Rapidly growing primordial black holes as seeds of the massive high-redshift JWST Galaxies
Abstract
A group of massive galaxies at redshifts of have been recently detected by the James Webb Space Telescope (JWST), which were unexpected to form at such early time within the standard Big Bang cosmology. In this work, we propose that this puzzle can be explained by the presence of some primordial black holes (PBHs) with mass of . These PBHs act as seeds for early galaxies formation with masses of at high redshift, hence accounting for the JWST observations. We use a hierarchical Bayesian inference framework to constrain the PBH mass distribution models, and find that the Lognormal model with the is preferred over other hypotheses. These rapidly growing BHs are expected to have strong radiation and may appear as the high-redshift compact objects, similar to those recently discovered by JWST.
1 Introduction
The standard Big Bang cosmology, which has been supported by numerous precise cosmological measurements, has achieved remarkable success. However, in the past decade, observations and measurements have challenged some of its predictions (Perivolaropoulos & Skara, 2022). Especially, the possibility that primordial black holes (PBHs) could be responsible for some observed phenomena has garnered considerable attention recently, in part because they could serve as both dark matter candidates and the seeds of supermassive black holes (SMBH) in high-redshift galaxies (Green & Kavanagh, 2021; Inayoshi et al., 2020). Therefore, investigating PBHs presents an exciting opportunity to explore the mechanics of the early Universe (Escrivà et al., 2022).
PBHs, with far-reaching cosmological implications, can be formed through the gravitational collapse of overdense regions in the early Universe (Zel’dovich & Novikov, 1966; Hawking, 1971). These kinds of objects may have diverse masses and then account for various cosmological phenomena. Specifically, asteroid-mass PBHs can be applied to account for a significant fraction of dark matter (Montero-Camacho et al., 2019), while PBHs with masses of hundreds are viewed as candidate sources for LIGO/Virgo events (Bird et al., 2016; Sasaki et al., 2016). Moreover, PBHs with masses are thought to be hypothetical seeds for high-redshift supermassive black holes (SMBHs), which is the focus of this work.
The upcoming JWST observations are expected to shed further light on the nature of high-redshift galaxies and the role of PBHs in their formation, whose formation mechanisms remain unclear (Gardner et al., 2006; Volonteri et al., 2021). Recently, its observations have identified several bright galaxy candidates at (Labbe et al., 2022; Atek et al., 2023; Yan et al., 2023), which are difficult to reconcile with the Big Bang cosmology predictions (Volonteri et al., 2021; Lovell et al., 2023). One possible interpretation is the alteration of the matter power spectrum by the PBHs (Liu & Bromm, 2022; Biagetti et al., 2023; Trinca et al., 2023; Hütsi et al., 2023; Cai et al., 2023). In this work, we show that PBHs with masses of could potentially grow up into SMBHs with masses of observed in the centers of galaxies, through super-Eddington accretion within the dark matter halo. Then, we adopt a hierarchical Bayesian inference framework to constrain the PBH mass distribution models, and find that the Lognormal model with the is strongly preferred over other hypotheses. These growing PBHs with strong radiation may appear as high-redshift compact objects, which accounted for those observations of JWST.
2 PBH Evolution in the Early Universe
After having been generated, PBHs may evolve through accretion throughout cosmic history, and this accretion of baryonic matter onto PBHs can significantly impact their masses (De Luca et al., 2020a; Serpico et al., 2020). However, the physics of accretion is complex, as the accretion rate and the geometry of the accretion flow are intertwined and both play a crucial role in the evolution of the PBH masses. An analytic accretion model, such as the one developed by Mack, Ricotti and Ostriker (Mack et al., 2007; Ricotti, 2007; Ricotti et al., 2008), can be used to study the accretion of baryonic matter onto PBHs and provide useful insights into the accretion behavior. In the intergalactic medium, a PBH with mass can accrete baryonic matter at the Bondi-Hoyle rate which can be expressed as
| (1) |
where is the Bondi-Hoyle radius, is the hydrogen gas number density, and is the PBH effective velocity, which is defined in terms of the PBH relative velocity and the gas with sound speed . The accretion parameter accounts for the gas viscosity, the Hubble expansion, and the Compton scattering between the gas and the CMB, which is defined in Eq.(23) in Ricotti et al. (2008).
It is important to note that PBHs only make up a tiny portion of DM in the Universe, and that there is a dominant dark matter halo surrounding a PBH and expands over time as long as the PBHs do not interact with one another. This dark matter halo, or ”dark matter clothing”, increases the gas accretion rate, acting as a catalyst for PBH accretion despite the fact that the direct DM accretion is negligible for the PBH evolution. We assume that a black hole is surrounded by a dark halo with a density profile of (Bertschinger, 1985) and a characteristic radius of . As long as the Bondi radius is greater than twice the radius of the dark halo , the gas accretion rate onto the halo is the same as that onto a bare PBH with a dark halo mass . However, for that with smaller or larger , the accretion enhancement caused by the halo will take place and the accretion parameter must be modified to introduce corrections to the naked case following the method in Ricotti et al. (2008) and Ricotti (2007). For instance, a thin accretion disk arises around the PBH if the angular momentum carried by the baryonic infalling material is sufficiently high.
The gas accretion rate is suppressed by the outflows from the PBH which sweep away the surrounded medium and only leave the diluted and hot gas. The integration of this effect, known as mechanical feedback (MF), into the analytic accretion calculation poses significant challenges (Ali-Haïmoud & Kamionkowski, 2017; De Luca et al., 2020b). However, a glimmer of optimism arises from recent 3D numerical simulations (Bosch-Ramon & Bellomo, 2020; Bosch-Ramon, 2022; Piga et al., 2022). These simulations have provided valuable insights, suggesting a roughly consistent fractional rescaling factor for PBH accretion. As a result, we can succinctly express PBH accretion as , with an adopted value of . This selection is derived from averaging the potential outflow orientation angles during the accretion process. While this reduction in the accretion rate is significant, it serves as an illustrative example of PBH evolution in the early universe. A comprehensive analysis of these additional phenomena is a subject for future investigation, expanding our understanding of this intricate process.
After considering the effect of the dark halo and the feedback, the efficiency and shape of the accretion process are entirely encoded in the dimensionless baryonic accretion rate , which is defined as with the Eddington accretion .
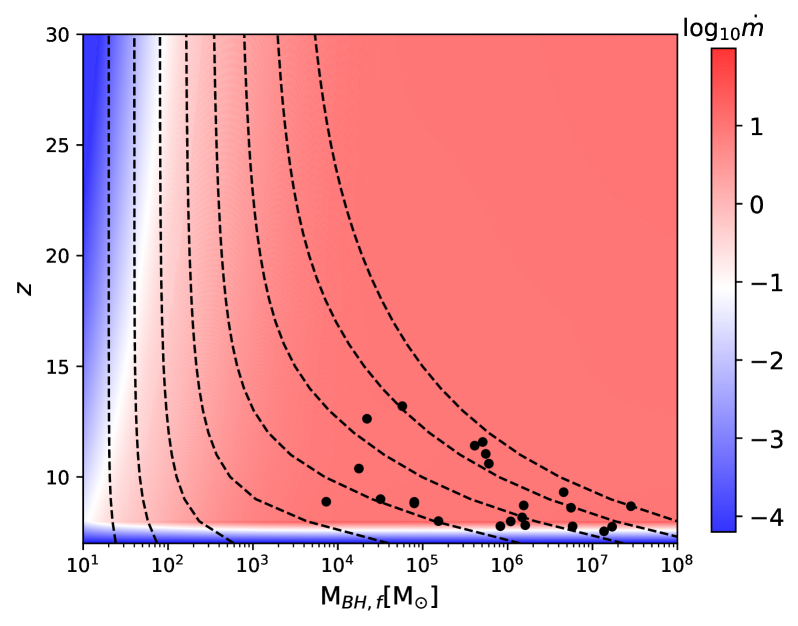
In Figure 1, we present the accretion rate as a function of PBH mass and redshift, leveraging data sources listed in Table 1 through the relationship between and . The black dotted lines illustrate the trajectories of PBH evolution for various initial masses, including , , , , , , and within the plane. It is worth noting that the redshit cutoff for PBH accretion is set at 7.5 due to significant uncertainties related to large-scale structure. Typically, the PBHs with initial masses, denoted as , less than a few solar masses face challenges in achieving efficient growth due to their low accretion rates. However, for PBHs with higher initial masses, the accretion process can be significantly more effective. In fact, some PBHs that originated in the very early Universe have the potential to grow to a size approaching (Kohri et al., 2022).
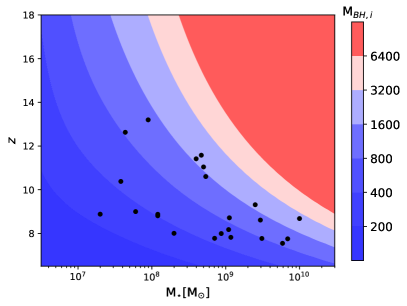
In the local Universe, a well-established trend reveals a shared growth pattern between SMBHs and galaxies, a relationship extensively discussed in the review by Greene et al. (2020). This co-evolution scenario is believed to be influenced by feedback processes originating from active galactic nuclei (AGNs) and the initial mass density of SMBHs and galaxies. An empirical relationship between the mass of the SMBH, denoted as , and the galaxy mass is described by , where serves as a reference value. However, due to the absence of high-redshift measurements, our understanding replies on theoretical extrapolation based on the values reported by Greene et al. (2020), which are , and . In Figure 2 we provide a visual representation of the initial mass, denoted as , required to account for the current JWST observations of the high redshift massive galaxies, particularly within the context of the PBH accretion scenario using data obtained from the JWST.
3 JWST Observations and PBH Mass Distribution
The James Webb Space Telescope (JWST), launched on December 25, 2021, is the most powerful space telescope currently in operation, equipped with four instruments: Mid-Infrared Instrument (MIRI), Near-Infrared Spectrograph (NIRSpec), Near-Infrared Camera (NIRCam) and Fine Guidance Sensor/Near Infrared Imager and Slitless Spectrograph (FGS-NIRISS). During its Early Release Observations (EROs), the JWST observed the massive strong lensing cluster SMACSJ0723. Spectra obtained from this observation revealed both Ly and Balmer breaks in the galaxies, offering valuable insights into their masses and redshifts through Spectral Energy Distribution (SED) fitting. Furthermore, the Cosmic Evolution Early Release Science (CEERS) program employed NIRCam to capture multi-band images in a deep field, covering an area of approximately . These data have been widely utilized in numerous studies to identify candidates for massive high-redshift galaxies using the SED fitting method (Labbe et al., 2022; Atek et al., 2023; Yan et al., 2023).
However, it is essential to acknowledge that uncertainties persist in the photometric redshift estimation. Therefore, in this analysis, we focus on high-redshift JWST galaxy candidates with spectroscopically determined redshifts, which are more reliable (Arrabal Haro et al., 2023; Boyett et al., 2023; Bunker et al., 2023; Curtis-Lake et al., 2023; Fujimoto et al., 2023; Heintz et al., 2023; Jung et al., 2023). The galaxies included in Table 1 represent the most prominent candidates identified to date.
| Source ID | R.A. (deg) | Decl. (deg) | Reference | ||
|---|---|---|---|---|---|
| CEERS-61419 | 214.897232 | 52.843854 | Fu23 | ||
| CEERS-61381 | 214.901252 | 52.846997 | Fu23 | ||
| CEERS-7078 | 215.011708 | 52.988303 | Fu23 | ||
| CEERS-4702 | 214.994404 | 52.989378 | Fu23 | ||
| CEERS-4774 | 215.005185 | 52.996577 | Fu23 | ||
| CEERS-4777 | 215.005365 | 52.996697 | Fu23 | ||
| CEERS-23084 | 214.830685 | 52.887771 | Fu23 | ||
| CEERS-43725 | 214.967532 | 52.932953 | He23 | ||
| CEERS-81061 | 215.035392 | 52.890667 | He23 | ||
| EGS-11855 | 215.218762 | 53.069862 | He23 | ||
| EGS-34697 | 215.089714 | 52.966183 | He23 | ||
| CEERS-59920 | 214.882994 | 52.840416 | He23 | ||
| EGS-8901 | 215.188413 | 53.033647 | He23 | ||
| EGS-33634 | 215.150862 | 52.989562 | J23 | ||
| EGS-36986 | 214.999053 | 52.941977 | J23 | ||
| CEERS-16943 | 214.943152 | 52.942442 | AH23 | ||
| CEERS-11384 | 214.906640 | 52.945504 | AH23 | ||
| GS-z10-0 | 53.15884 | -27.77349 | La23 | ||
| GS-z11-0 | 53.16476 | -27.77463 | La23 | ||
| GS-z12-0 | 53.16634 | -27.82156 | La23 | ||
| GS-z13-0 | 53.14988 | -27.77650 | La23 | ||
| GN-z11 | 189.10608333 | 62.2420556 | Bu23 | ||
| Gz9p3 | 3.617193 | -30.4255352 | Bo23 |
Furthermore, the Bondi accretion affects the mass distribution of PBHs with redshift. The fraction of PBHs with mass in the interval at redshift is what we refer to as the mass function . The evolution of an initial at formation redshift is governed by
| (2) |
where is the final mass of a PBH that accretes mass at redshift . In the literature, there are theoretical realizations for primordial power spectra that could generate a significantly enhanced power at small scales allowing for an increase in the abundance of massive PBHs (Cai et al., 2023), such as non-attractor inflation (Kinney, 2005; Martin et al., 2013; Garcia-Bellido & Ruiz Morales, 2017) and non-perturbative resonance effects (Cai et al., 2018, 2019; Zhou et al., 2020; Cai et al., 2021). To distinguish various forms of theoretically predicted PBH mass functions, we consider the following typical PBH mass functions that arise in PBH formation models (Carr et al., 2021; Carr & Kuhnel, 2020),
| (3) |
where is the step function, and the and are parameters in these distributions. For the Multipeak model, we use two normalized Gaussian distributions with same width in our analysis, as the evolution of .
| Models | xe | |||||||
| Lognormal | - | - | 2 | 16.25 | 0.00 | |||
| Powerlaw | - | - | - | 1 | 14.28 | 8.36 | ||
| Multipeak | 4 | 13.20 | 8.22 | |||||
| Gaussian | - | - | 2 | 9.78 | 10.68 | |||
| Critical | - | - | - | 1 | 0.00 | 31.26 |
We use the masses of high-redshift galaxies recently observed by JWST to constrain the hyper-parameters of each initial PBH mass function through hierarchical Bayesian inference (Thrane & Talbot, 2019). For a series of independent observations, the posterior distribution for is given by
| (4) |
where denote the likelihood function of the JWST data given a galaxy’s properties (the mass and the redshift). The distribution of as predicted by the PBH population models is denoted by , which satisfies , where is the mass distribution of galaxies calculated from the initial PBH mass functions in Equation (3), and the galaxies are assumed to be distributed uniformly in the co-moving frame of the Universe. We assign Uniform priors for all of the hyper-parameters in this work. To approximate the reported result for the mass and redshift of each galaxy (as shown by a central value plus/minus the uncertainties in Table 1), we use a two-dimensional skew normal distribution , and assume that . Then the above equation can be calculated via Monte Carlo integration with sample points drawn from the skew normal distributions.
To quantitatively evaluate various PBH models and the statistical significance of our results, we calculate the Bayes factor between model and model , namely , where . According to Jeffreys’ scale criterion, a Bayes factor greater than (or lnZ larger than [2.30, 3.45, 4.60]) would suggest strong, very strong, or decisive Bayesian evidence in favor of model relative to model , given the available data. Additionally, we calculate the Akaike information criterion (AIC) (Akaike, 1974), defining as , to compare models with different numbers of parameters. A difference of of 2 or more indicates strong evidence against the model with the higher AIC value.
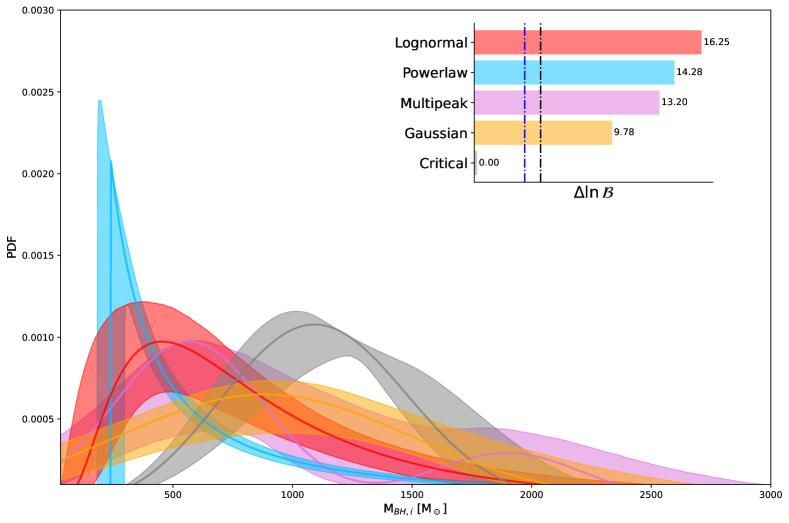
Our summarized results, presented in Table 2, reveal a preference for the Lognormal, Powerlaw, and Multipeak models over the Gaussian models, with a Bayesian evidence exceeding 3.42. Furthermore, the Lognormal model outperforms the Powerlaw and Multipeak models, and the Powerlaw and Multipeak models exhibit comparable quality as indicated by their slight differences in BIC and AIC values. Notably, the Critical model displays the highest AIC value and the lowest BIC value, thus being strongly disfavored. Figure 3 displays the constraints on the five different PBH initial mass functions and the Bayes factors of each model compared to the Critical model. The colored shaded zones represent the 90% credible regions for the inferred population distribution. For all models, the majority of the PBH masses lie . According to Jeffreys’ scale criterion, the logarithmic Bayes factors for the Lognormal model, the Powerlaw model, the Multipeak model, and the Gasssian model are 16.25, 14.28, 13.20, and 9.78, respectively, indicating they are decisively preferred by the data compared to the Critical model. Most notably, the Lognormal mass function stands out from the five models, with the lowest AIC value of 8.36 compared to the second preferred model. Consequently, we conclude that JWST observations provide informative insights into distinguishing the initial PBH mass function, with current data offering relatively stringent constraints on its shape. Moreover, the above analysis also highlights the importance of statistical analysis in making conclusions about the PBHs population and their implications for early cosmology.
4 Summary
The accretion of baryonic matter onto PBHs is believed to have played an important role in the early Universe, giving rise to the formation of seed black holes at the centers of early galaxies. This study demonstrates that PBHs with initial masses of exhibit rapid growth through accretion, reaching masses in the range of by , which could potentially account for the massive high-redshift galaxies observed by JWST. Future observations with JWST during the cosmic re-ionization era are expected to reveal these rapidly growing PBHs, as their accretion can yield energetic radiation across a broad spectrum of wavelengths. Consequently, this radiation could initiate the formation of a group of luminous active galactic nuclei, which might manifest as high-redshift compact objects, akin to recent observations made by JWST (Furtak et al., 2022). In our efforts to constrain the formation models of PBHs, we have employed a hierarchical Bayesian inference framework, leading to a strong preference for the Lognormal Model with a characteristic mass of over other scenarios.
It is noteworthy that the initial mass distribution of the PBHs uncovered in our study significantly differs from that expected in the pair-instability supernova scenario (Abel et al., 2002; Heger et al., 2003), which is characterized by an abrupt cutoff in the mass function at (Li et al., 2023). However, it’s essential to exercise caution, as the current high-redshift galaxy sample remains relatively limited, and future data may influence the current model constraints. Nevertheless, our current results have demonstrated the promising prospect of distinguishing between different PBH distribution models with future observation.
Acknowledgements
We are grateful to Lei Feng, Qiang Yuan and Lei Zu for helpful discussion. This work is supported in part by the National Key R&D Program of China (2021YFC2203100), by the NSFC (11921003, 11961131007, 11653002, 12003029, 12261131497), by China Postdoctoral Science Foundation under grant No. 2023TQ0355, by CAS Young Interdisciplinary Innovation Team (JCTD-2022-20), by 111 Project for ”Observational and Theoretical Research on Dark Matter and Dark Energy” (B23042), by the Fundamental Research Funds for Central Universities, by the CSC Innovation Talent Funds, by the CAS project for young scientists in basic research (YSBR-006), and by the USTC Research Funds of the Double First-Class Initiative.
References
- Abel et al. (2002) Abel, T., Bryan, G. L., & Norman, M. L. 2002, Science, 295, 93
- Akaike (1974) Akaike, H. 1974, IEEE Transactions on Automatic Control, 19, 716
- Ali-Haïmoud & Kamionkowski (2017) Ali-Haïmoud, Y., & Kamionkowski, M. 2017, Phys. Rev. D, 95, 043534
- Arrabal Haro et al. (2023) Arrabal Haro, P., Dickinson, M., Finkelstein, S. L., et al. 2023, Nature, 622, 707
- Atek et al. (2023) Atek, H., Shuntov, M., Furtak, L. J., et al. 2023, MNRAS, 519, 1201
- Bertschinger (1985) Bertschinger, E. 1985, ApJS, 58, 39
- Biagetti et al. (2023) Biagetti, M., Franciolini, G., & Riotto, A. 2023, ApJ, 944, 113
- Bird et al. (2016) Bird, S., Cholis, I., Muñoz, J. B., et al. 2016, Phys. Rev. Lett., 116, 201301
- Bosch-Ramon (2022) Bosch-Ramon, V. 2022, Astron. Astrophys., 660, A5
- Bosch-Ramon & Bellomo (2020) Bosch-Ramon, V., & Bellomo, N. 2020, Astron. Astrophys., 638, A132
- Boyett et al. (2023) Boyett, K., Trenti, M., Leethochawalit, N., et al. 2023, arXiv e-prints, arXiv:2303.00306
- Bunker et al. (2023) Bunker, A. J., Saxena, A., Cameron, A. J., et al. 2023, A&A, 677, A88
- Cai et al. (2019) Cai, Y.-F., Chen, C., Tong, X., Wang, D.-G., & Yan, S.-F. 2019, Phys. Rev. D, 100, 043518
- Cai et al. (2021) Cai, Y.-F., Jiang, J., Sasaki, M., Vardanyan, V., & Zhou, Z. 2021, Phys. Rev. Lett., 127, 251301
- Cai et al. (2018) Cai, Y.-F., Tong, X., Wang, D.-G., & Yan, S.-F. 2018, Phys. Rev. Lett., 121, 081306
- Cai et al. (2023) Cai, Y.-F., Tang, C., Mo, G., et al. 2023, arXiv e-prints, arXiv:2301.09403
- Cai et al. (2023) Cai, Y.-F., Tang, C., Mo, G., et al. 2023, arXiv:2301.09403
- Carr et al. (2021) Carr, B., Kohri, K., Sendouda, Y., & Yokoyama, J. 2021, Rept. Prog. Phys., 84, 116902
- Carr & Kuhnel (2020) Carr, B., & Kuhnel, F. 2020, Ann. Rev. Nucl. Part. Sci., 70, 355
- Curtis-Lake et al. (2023) Curtis-Lake, E., Carniani, S., Cameron, A., et al. 2023, Nature Astronomy, 7, 622
- De Luca et al. (2020a) De Luca, V., Franciolini, G., Pani, P., & Riotto, A. 2020a, Phys. Rev. D, 102, 043505
- De Luca et al. (2020b) —. 2020b, JCAP, 04, 052
- Escrivà et al. (2022) Escrivà, A., Kuhnel, F., & Tada, Y. 2022, arXiv:2211.05767
- Fujimoto et al. (2023) Fujimoto, S., et al. 2023, Astrophys. J. Lett., 949, L25
- Furtak et al. (2022) Furtak, L. J., Zitrin, A., Plat, A., et al. 2022, arXiv e-prints, arXiv:2212.10531
- Garcia-Bellido & Ruiz Morales (2017) Garcia-Bellido, J., & Ruiz Morales, E. 2017, Phys. Dark Univ., 18, 47
- Gardner et al. (2006) Gardner, J. P., et al. 2006, Space Sci. Rev., 123, 485
- Green & Kavanagh (2021) Green, A. M., & Kavanagh, B. J. 2021, J. Phys. G, 48, 043001
- Greene et al. (2020) Greene, J. E., Strader, J., & Ho, L. C. 2020, Ann. Rev. Astron. Astrophys., 58, 257
- Hawking (1971) Hawking, S. 1971, MNRAS, 152, 75
- Heger et al. (2003) Heger, A., Fryer, C. L., Woosley, S. E., Langer, N., & Hartmann, D. H. 2003, Astrophys. J., 591, 288
- Heintz et al. (2023) Heintz, K. E., Brammer, G. B., Giménez-Arteaga, C., et al. 2023, Nature Astronomy, arXiv:2212.02890
- Hütsi et al. (2023) Hütsi, G., Raidal, M., Urrutia, J., Vaskonen, V., & Veermäe, H. 2023, Phys. Rev. D, 107, 043502
- Inayoshi et al. (2020) Inayoshi, K., Visbal, E., & Haiman, Z. 2020, Ann. Rev. Astron. Astrophys., 58, 27
- Jung et al. (2023) Jung, I., Finkelstein, S. L., Arrabal Haro, P., et al. 2023, arXiv e-prints, arXiv:2304.05385
- Kinney (2005) Kinney, W. H. 2005, Phys. Rev. D, 72, 023515
- Kohri et al. (2022) Kohri, K., Sekiguchi, T., & Wang, S. 2022, Phys. Rev. D, 106, 043539
- Labbe et al. (2022) Labbe, I., van Dokkum, P., Nelson, E., et al. 2022, Nature,, arXiv:2207.12446
- Li et al. (2023) Li, Y.-J., Wang, Y.-Z., Tang, S.-P., & Fan, Y.-Z. 2023, arXiv e-prints, arXiv:2303.02973
- Liu & Bromm (2022) Liu, B., & Bromm, V. 2022, Astrophys. J. Lett., 937, L30
- Lovell et al. (2023) Lovell, C. C., Harrison, I., Harikane, Y., Tacchella, S., & Wilkins, S. M. 2023, MNRAS, 518, 2511
- Mack et al. (2007) Mack, K. J., Ostriker, J. P., & Ricotti, M. 2007, Astrophys. J., 665, 1277
- Martin et al. (2013) Martin, J., Motohashi, H., & Suyama, T. 2013, Phys. Rev. D, 87, 023514
- Montero-Camacho et al. (2019) Montero-Camacho, P., Fang, X., Vasquez, G., Silva, M., & Hirata, C. M. 2019, JCAP, 08, 031
- Perivolaropoulos & Skara (2022) Perivolaropoulos, L., & Skara, F. 2022, New Astron. Rev., 95, 101659
- Piga et al. (2022) Piga, L., Lucca, M., Bellomo, N., et al. 2022, JCAP, 12, 016
- Ricotti (2007) Ricotti, M. 2007, Astrophys. J., 662, 53
- Ricotti et al. (2008) Ricotti, M., Ostriker, J. P., & Mack, K. J. 2008, Astrophys. J., 680, 829
- Sasaki et al. (2016) Sasaki, M., Suyama, T., Tanaka, T., & Yokoyama, S. 2016, Phys. Rev. Lett., 117, 061101, [Erratum: Phys.Rev.Lett. 121, 059901 (2018)]
- Serpico et al. (2020) Serpico, P. D., Poulin, V., Inman, D., & Kohri, K. 2020, Phys. Rev. Res., 2, 023204
- Thrane & Talbot (2019) Thrane, E., & Talbot, C. 2019, Publ. Astron. Soc. Austral., 36, e010, [Erratum: Publ.Astron.Soc.Austral. 37, e036 (2020)]
- Trinca et al. (2023) Trinca, A., Schneider, R., Maiolino, R., et al. 2023, MNRAS, 519, 4753
- Volonteri et al. (2021) Volonteri, M., Habouzit, M., & Colpi, M. 2021, Nature Rev. Phys., 3, 732
- Yan et al. (2023) Yan, H., Ma, Z., Ling, C., Cheng, C., & Huang, J.-S. 2023, ApJ, 942, L9
- Zel’dovich & Novikov (1966) Zel’dovich, Y. B., & Novikov, I. D. 1966, Astron. Z., 43, 758
- Zhou et al. (2020) Zhou, Z., Jiang, J., Cai, Y.-F., Sasaki, M., & Pi, S. 2020, Phys. Rev. D, 102, 103527
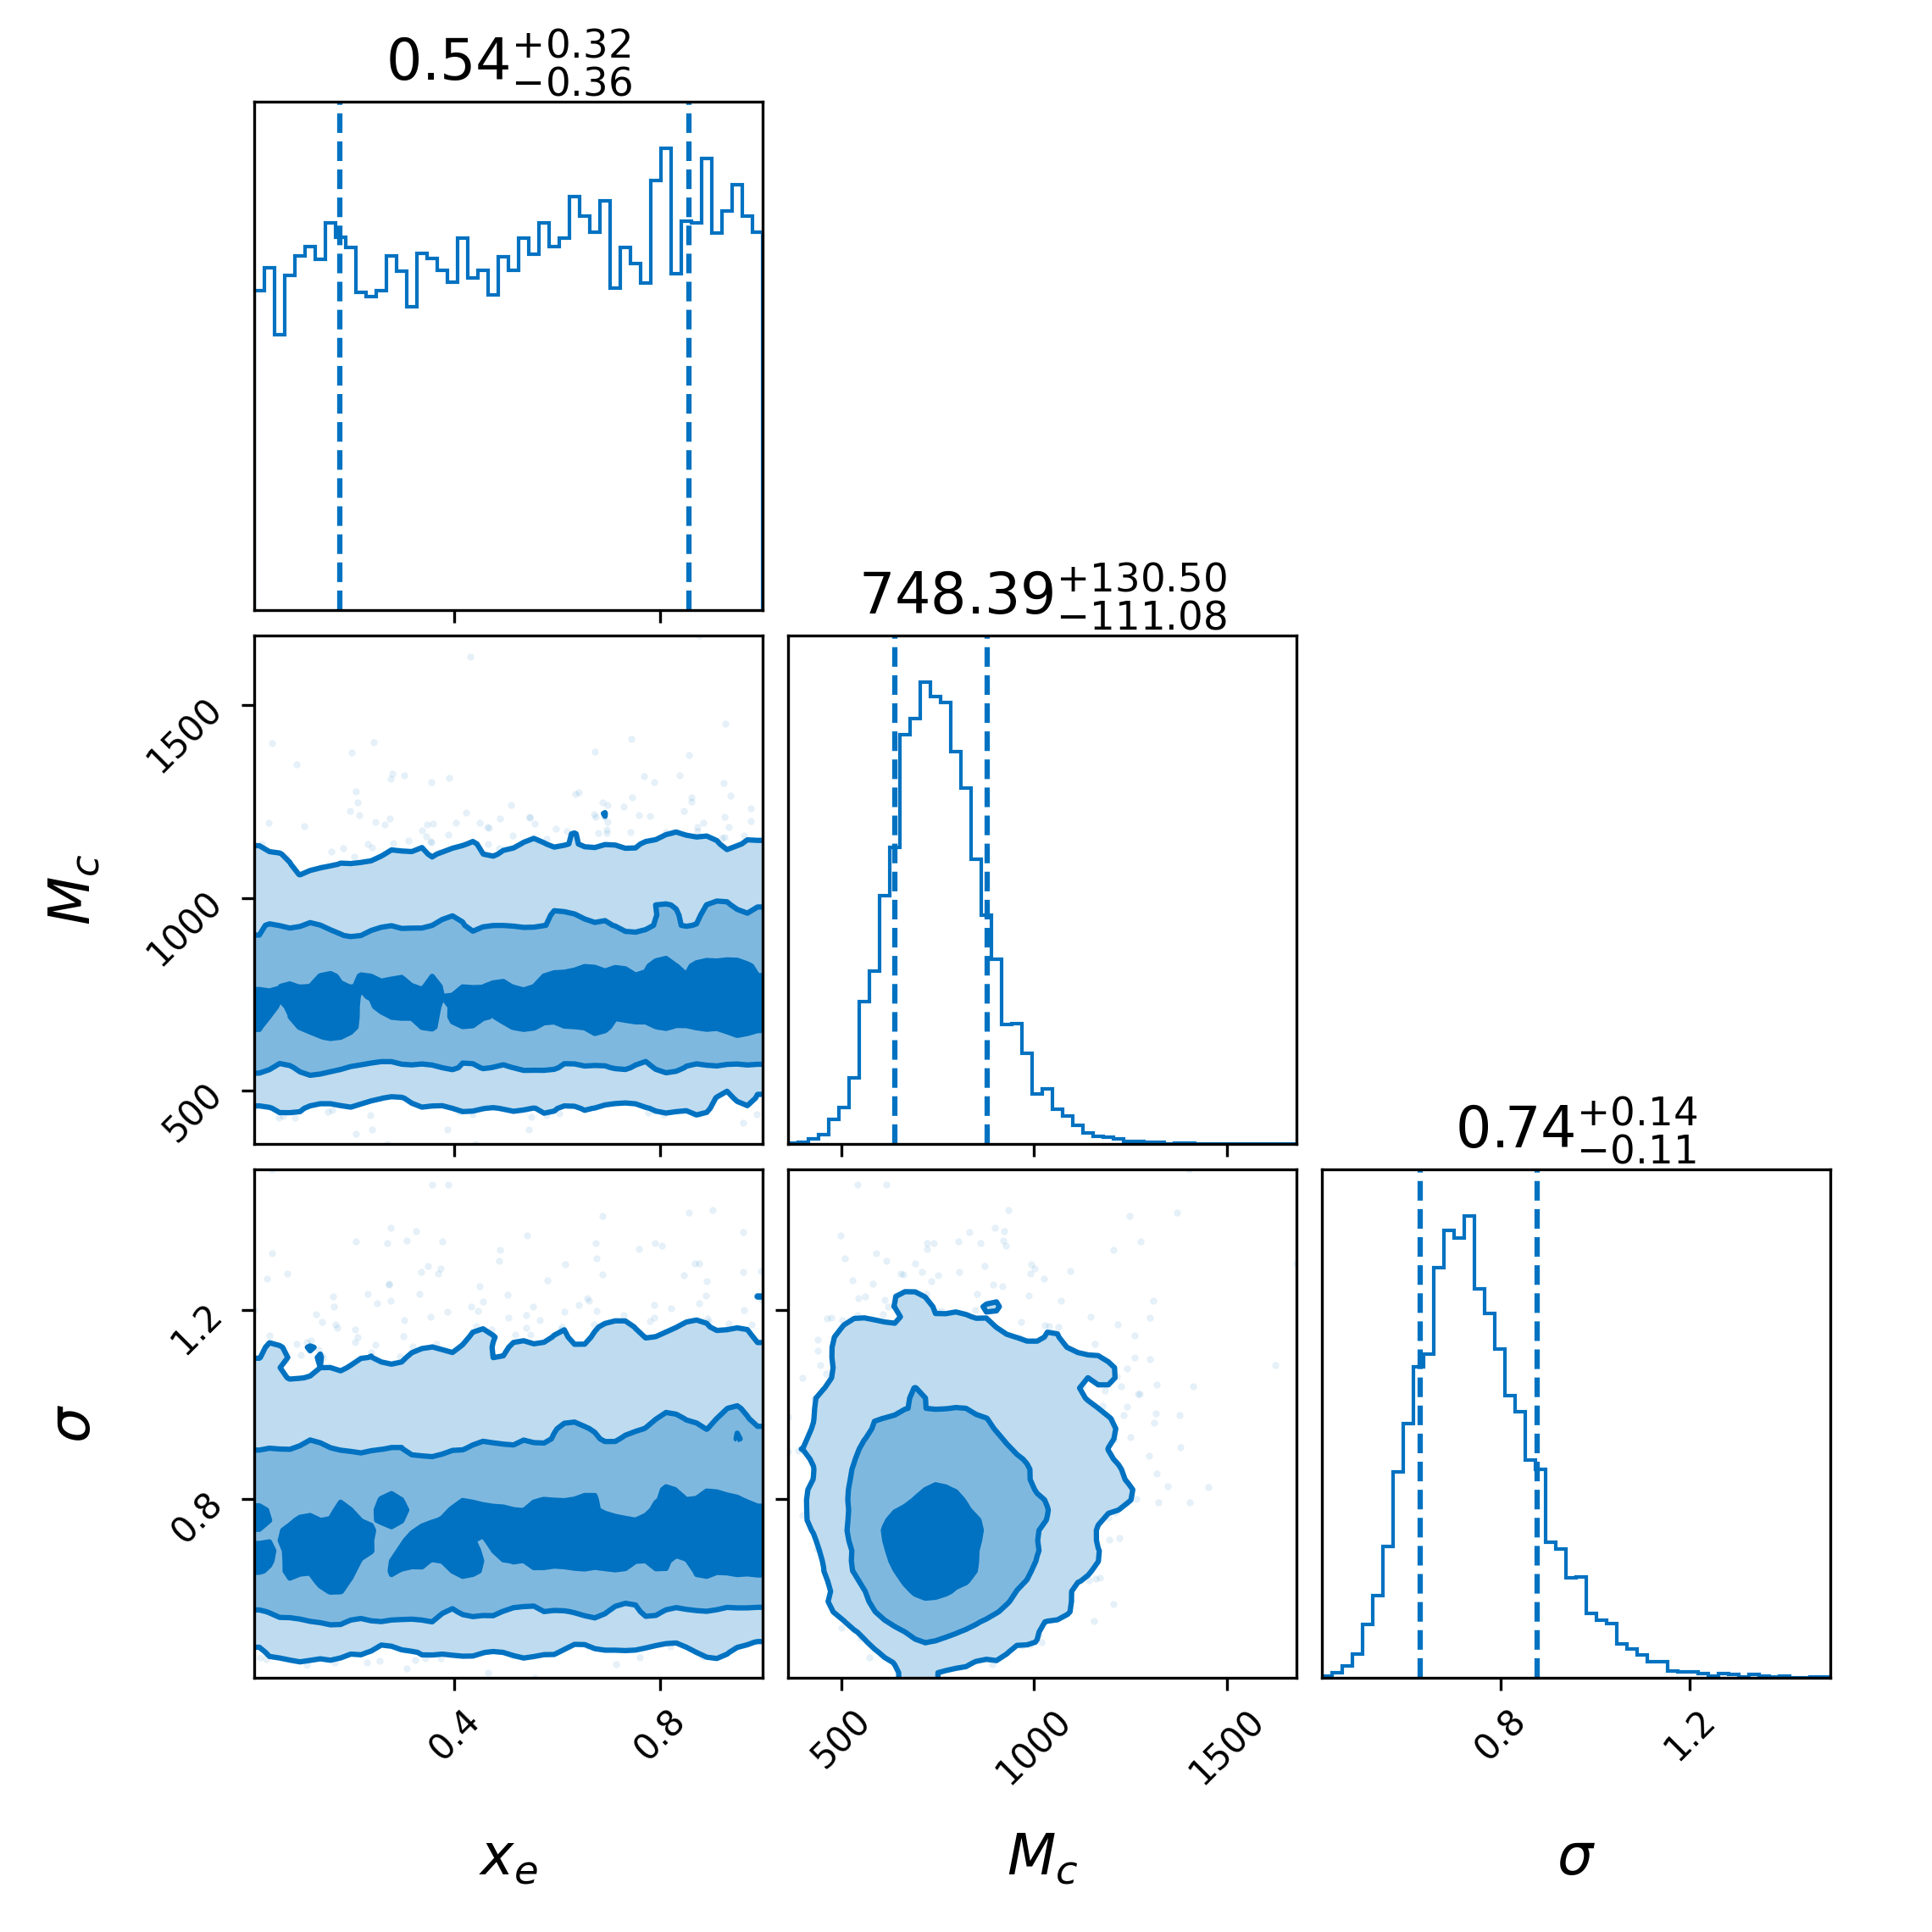
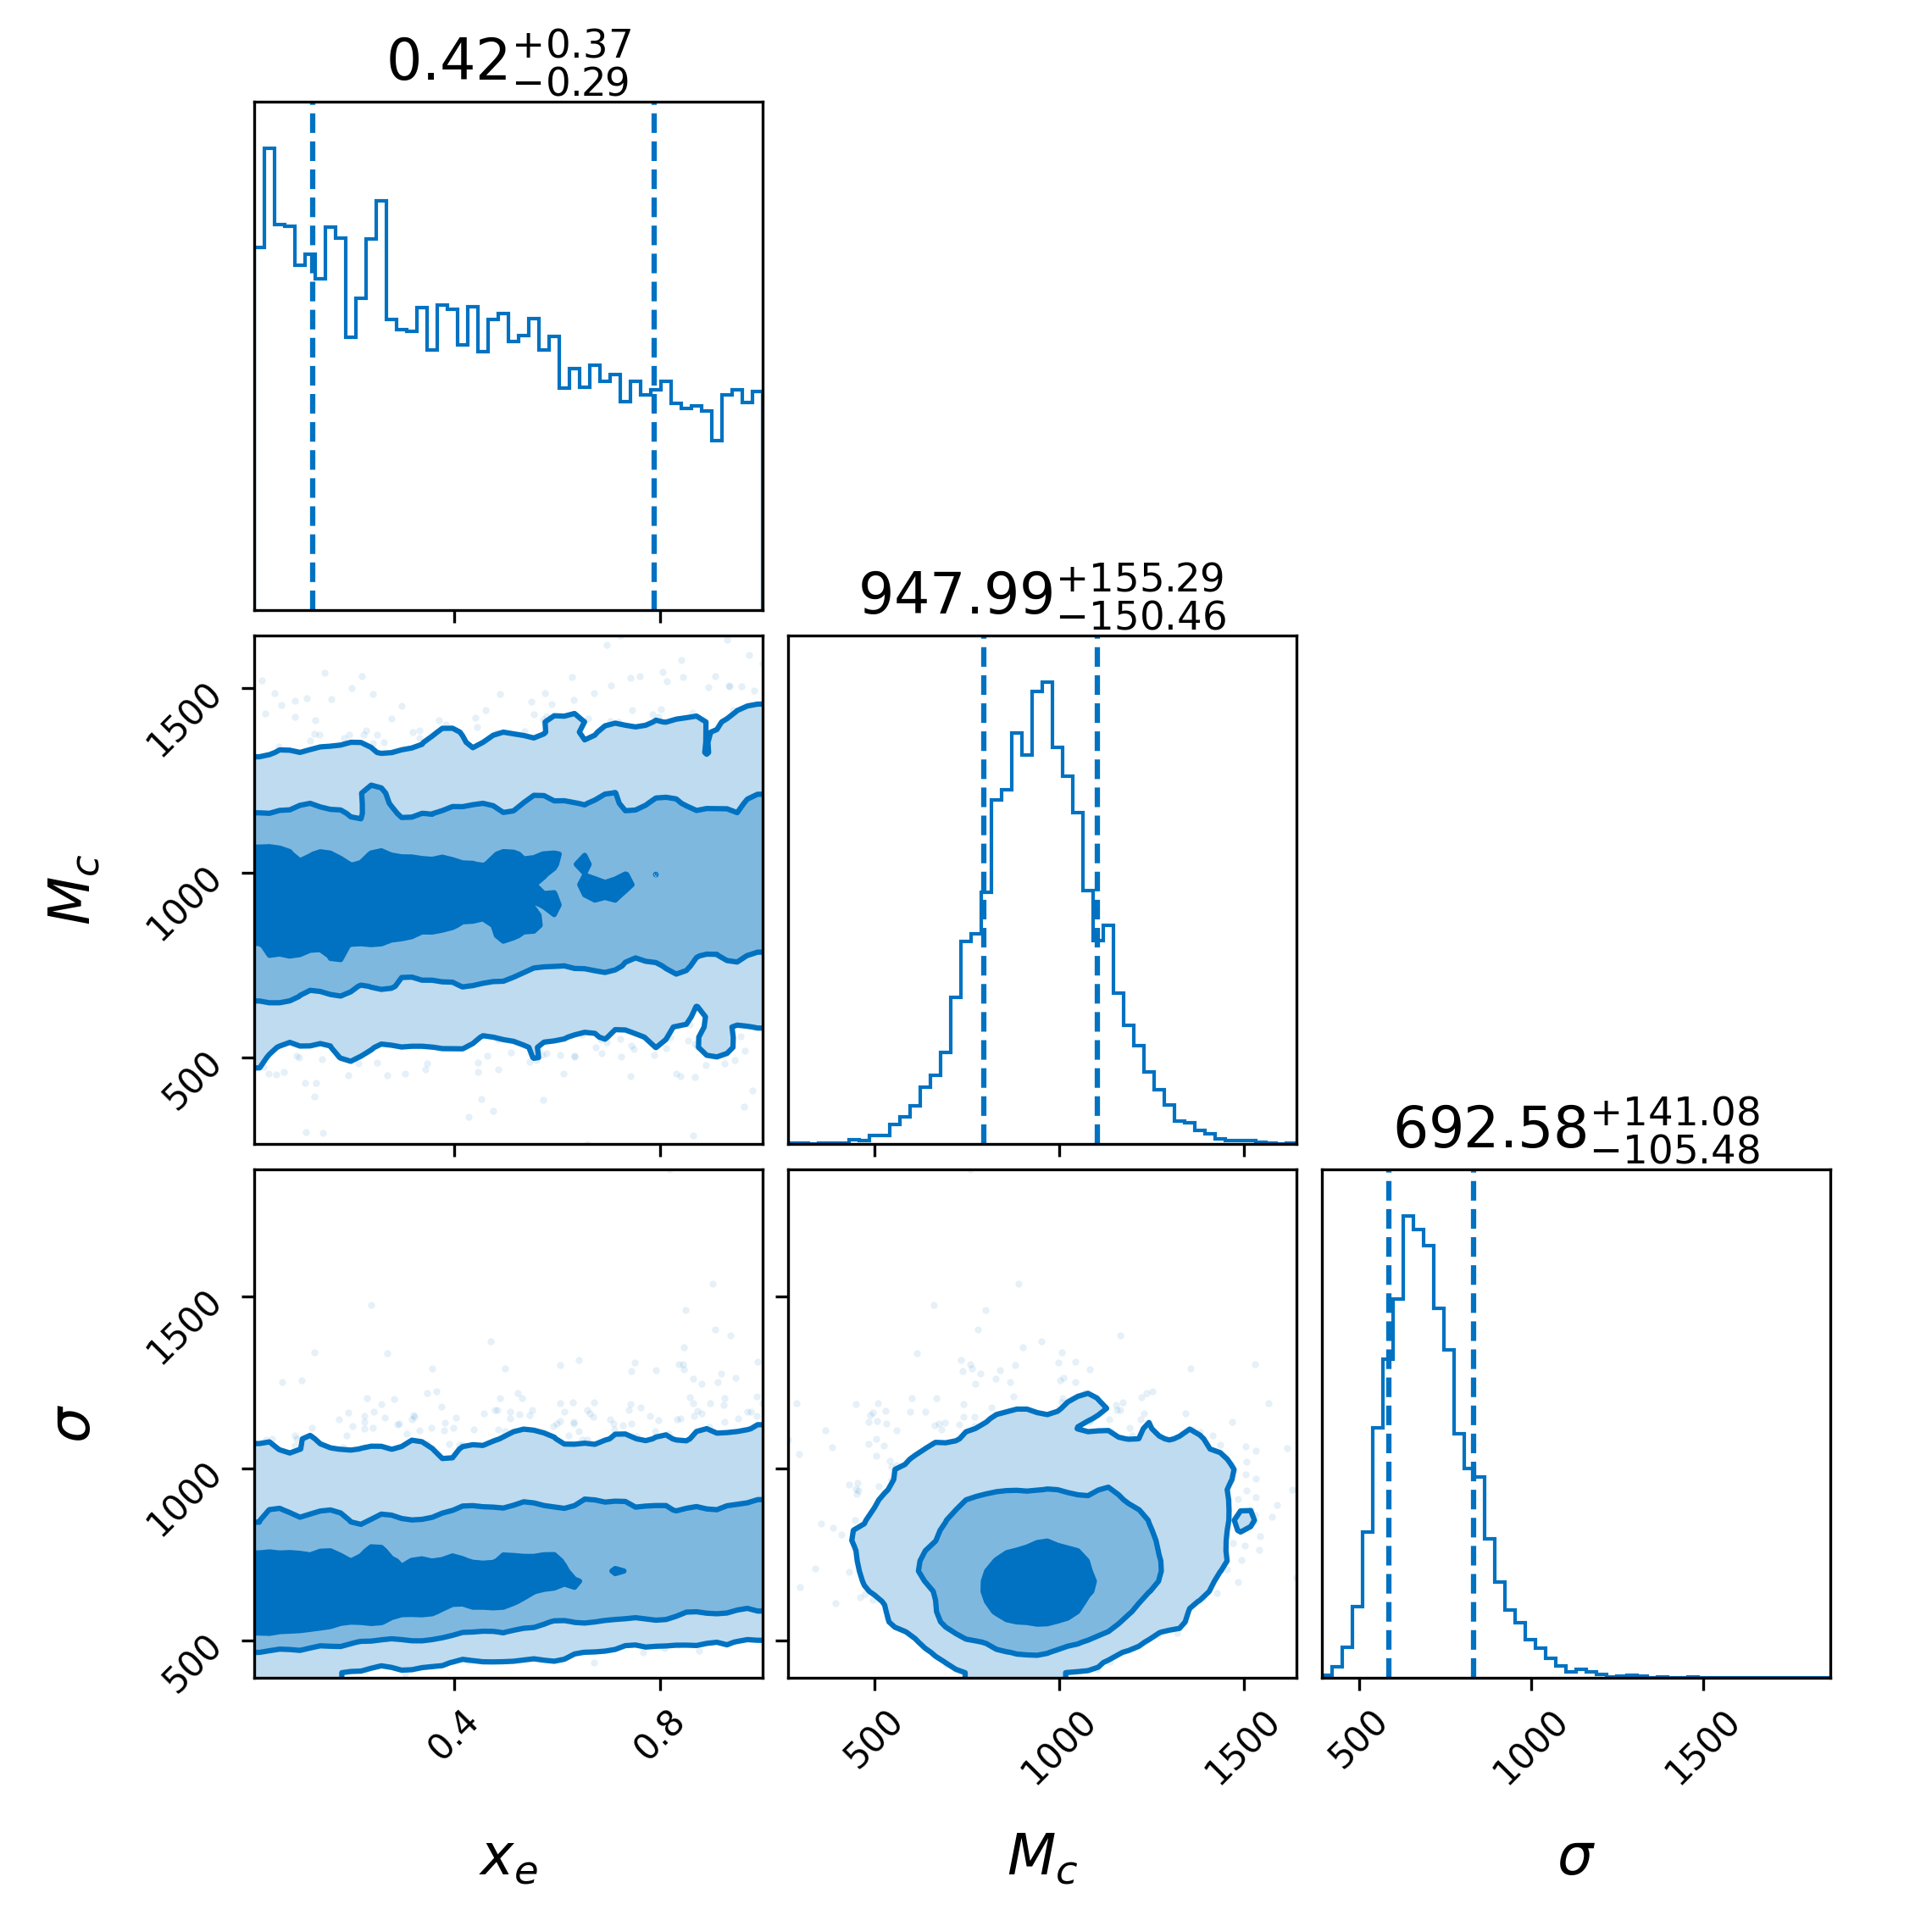
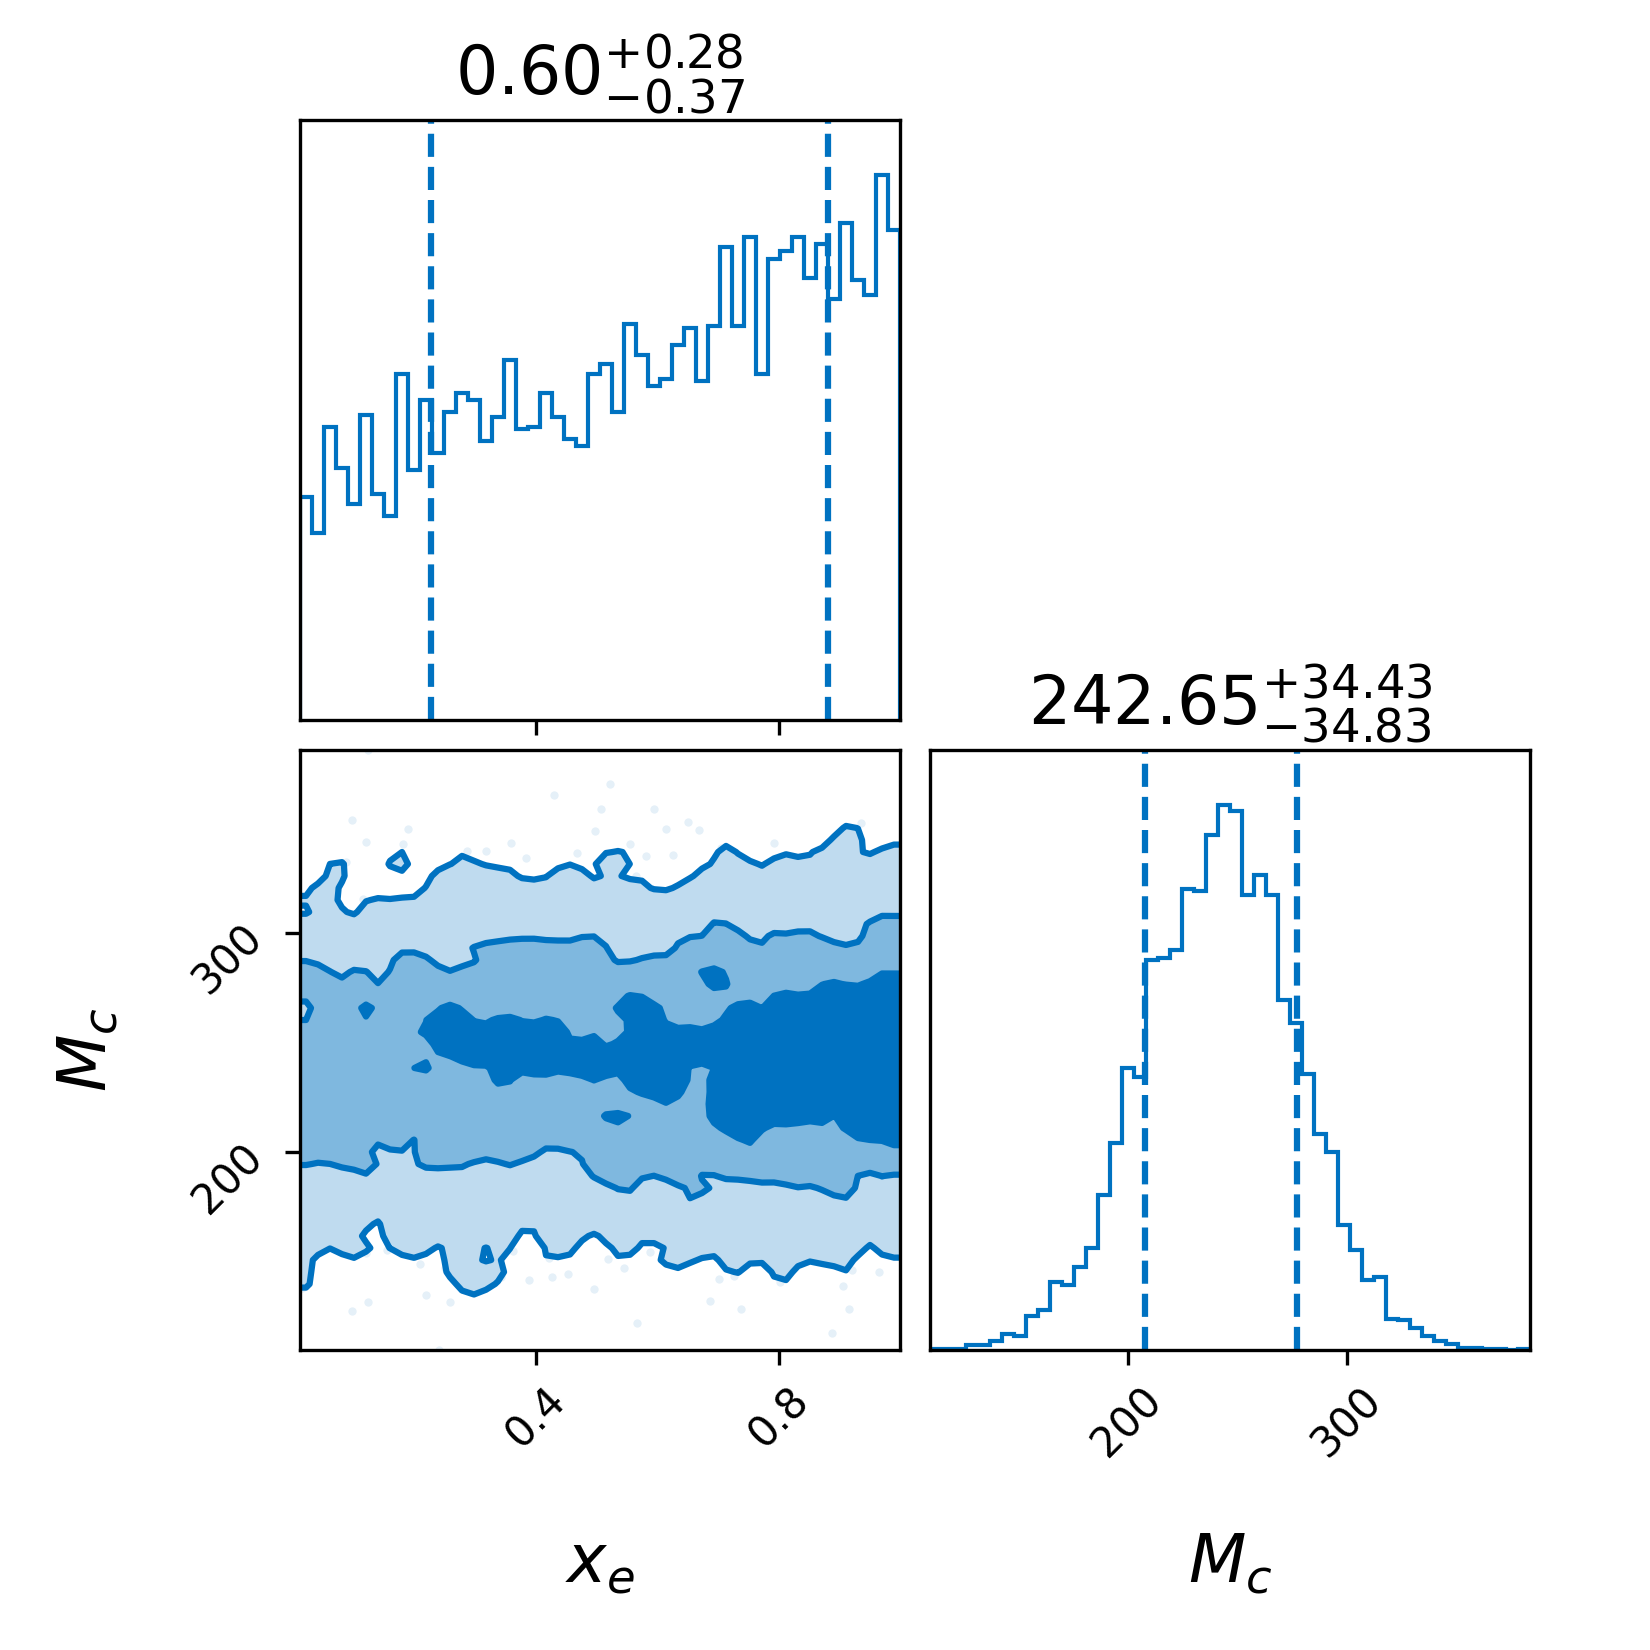
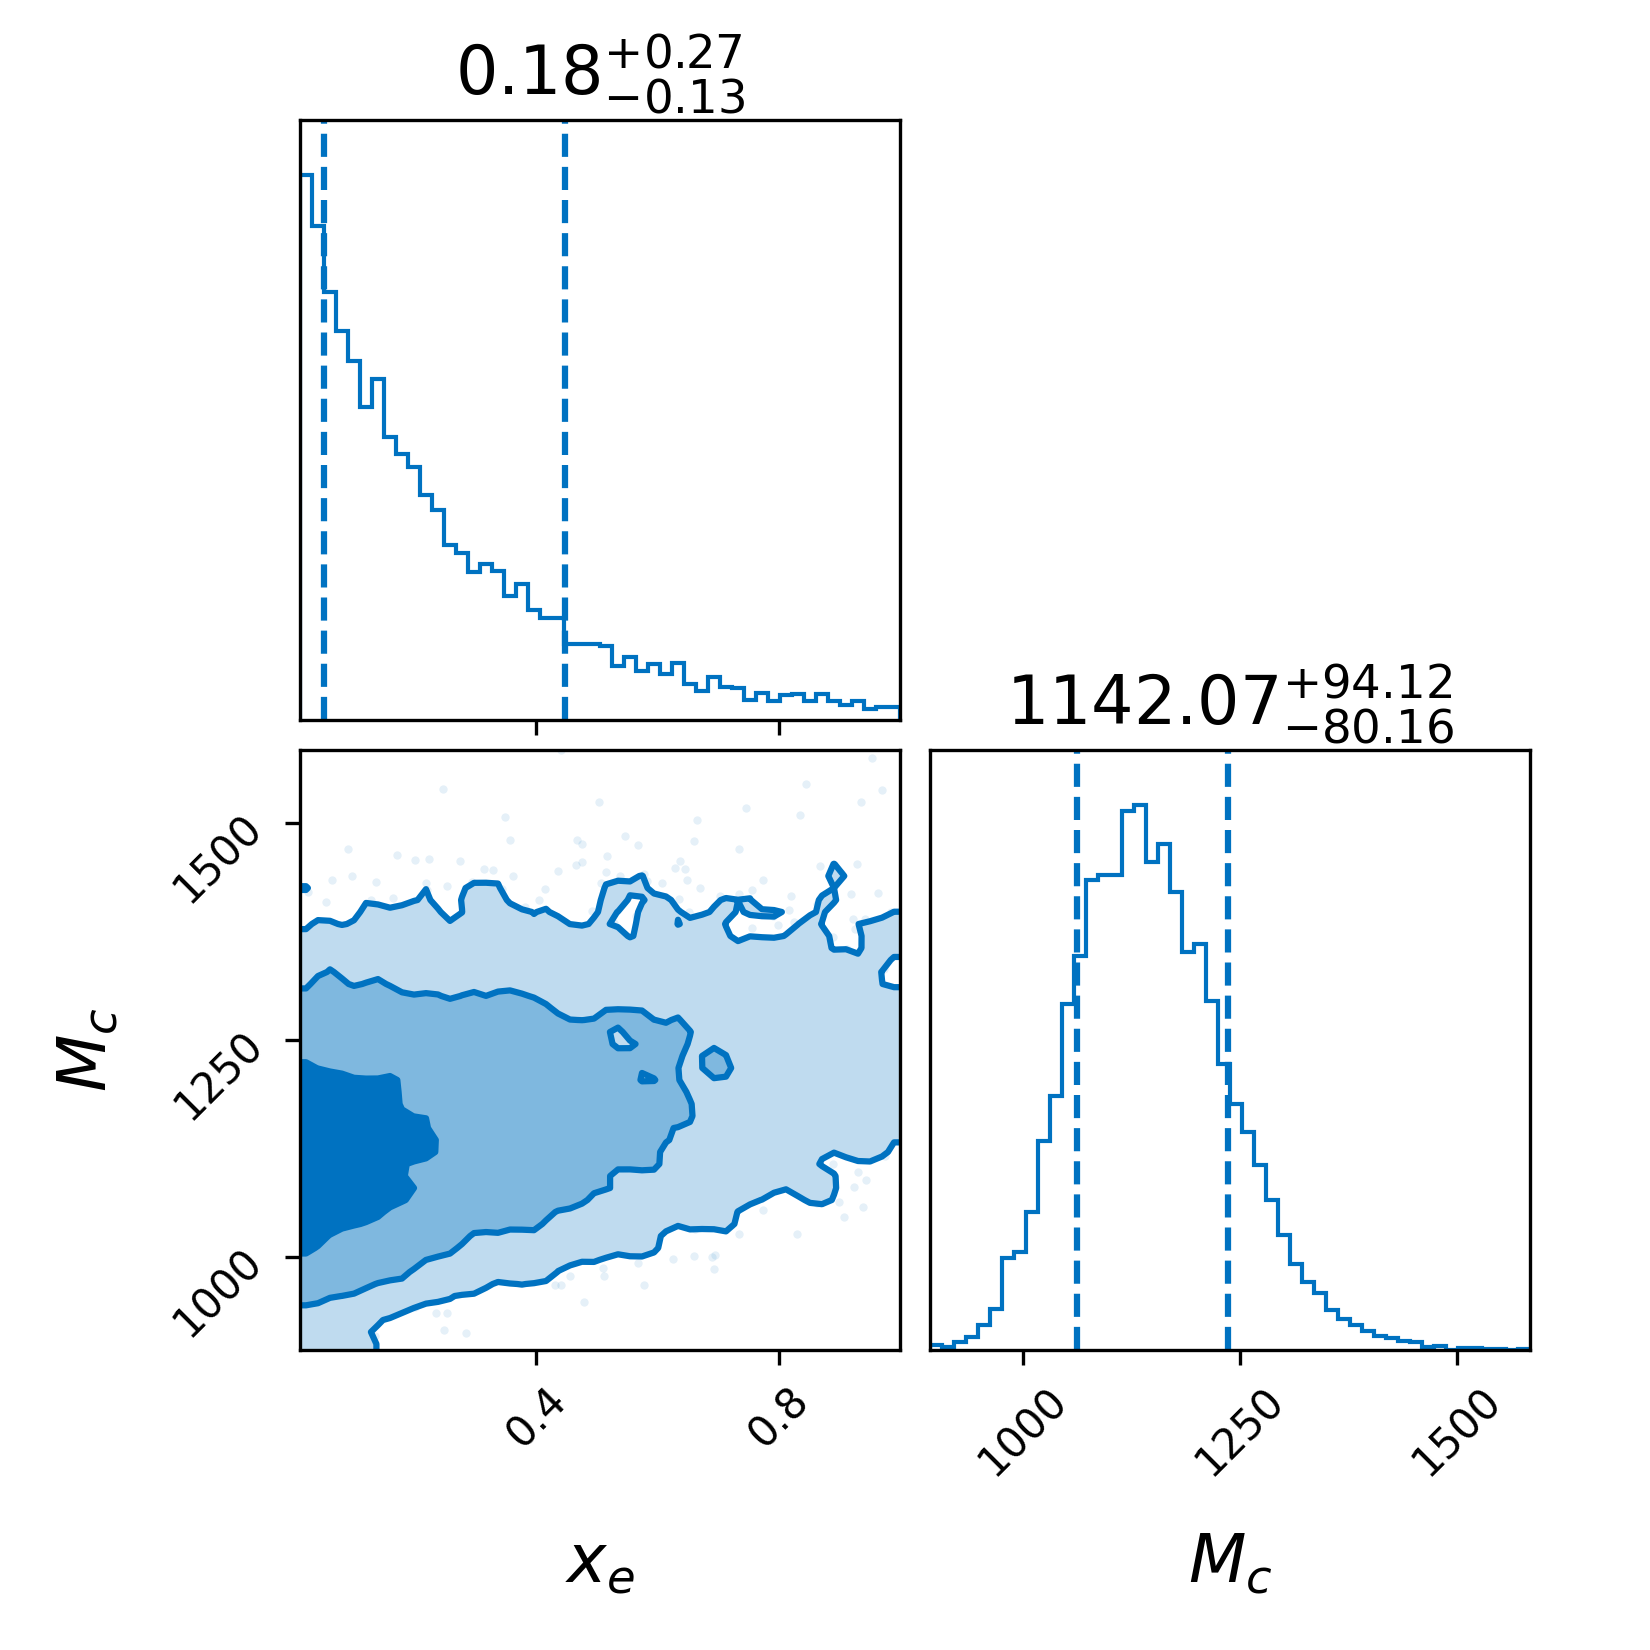
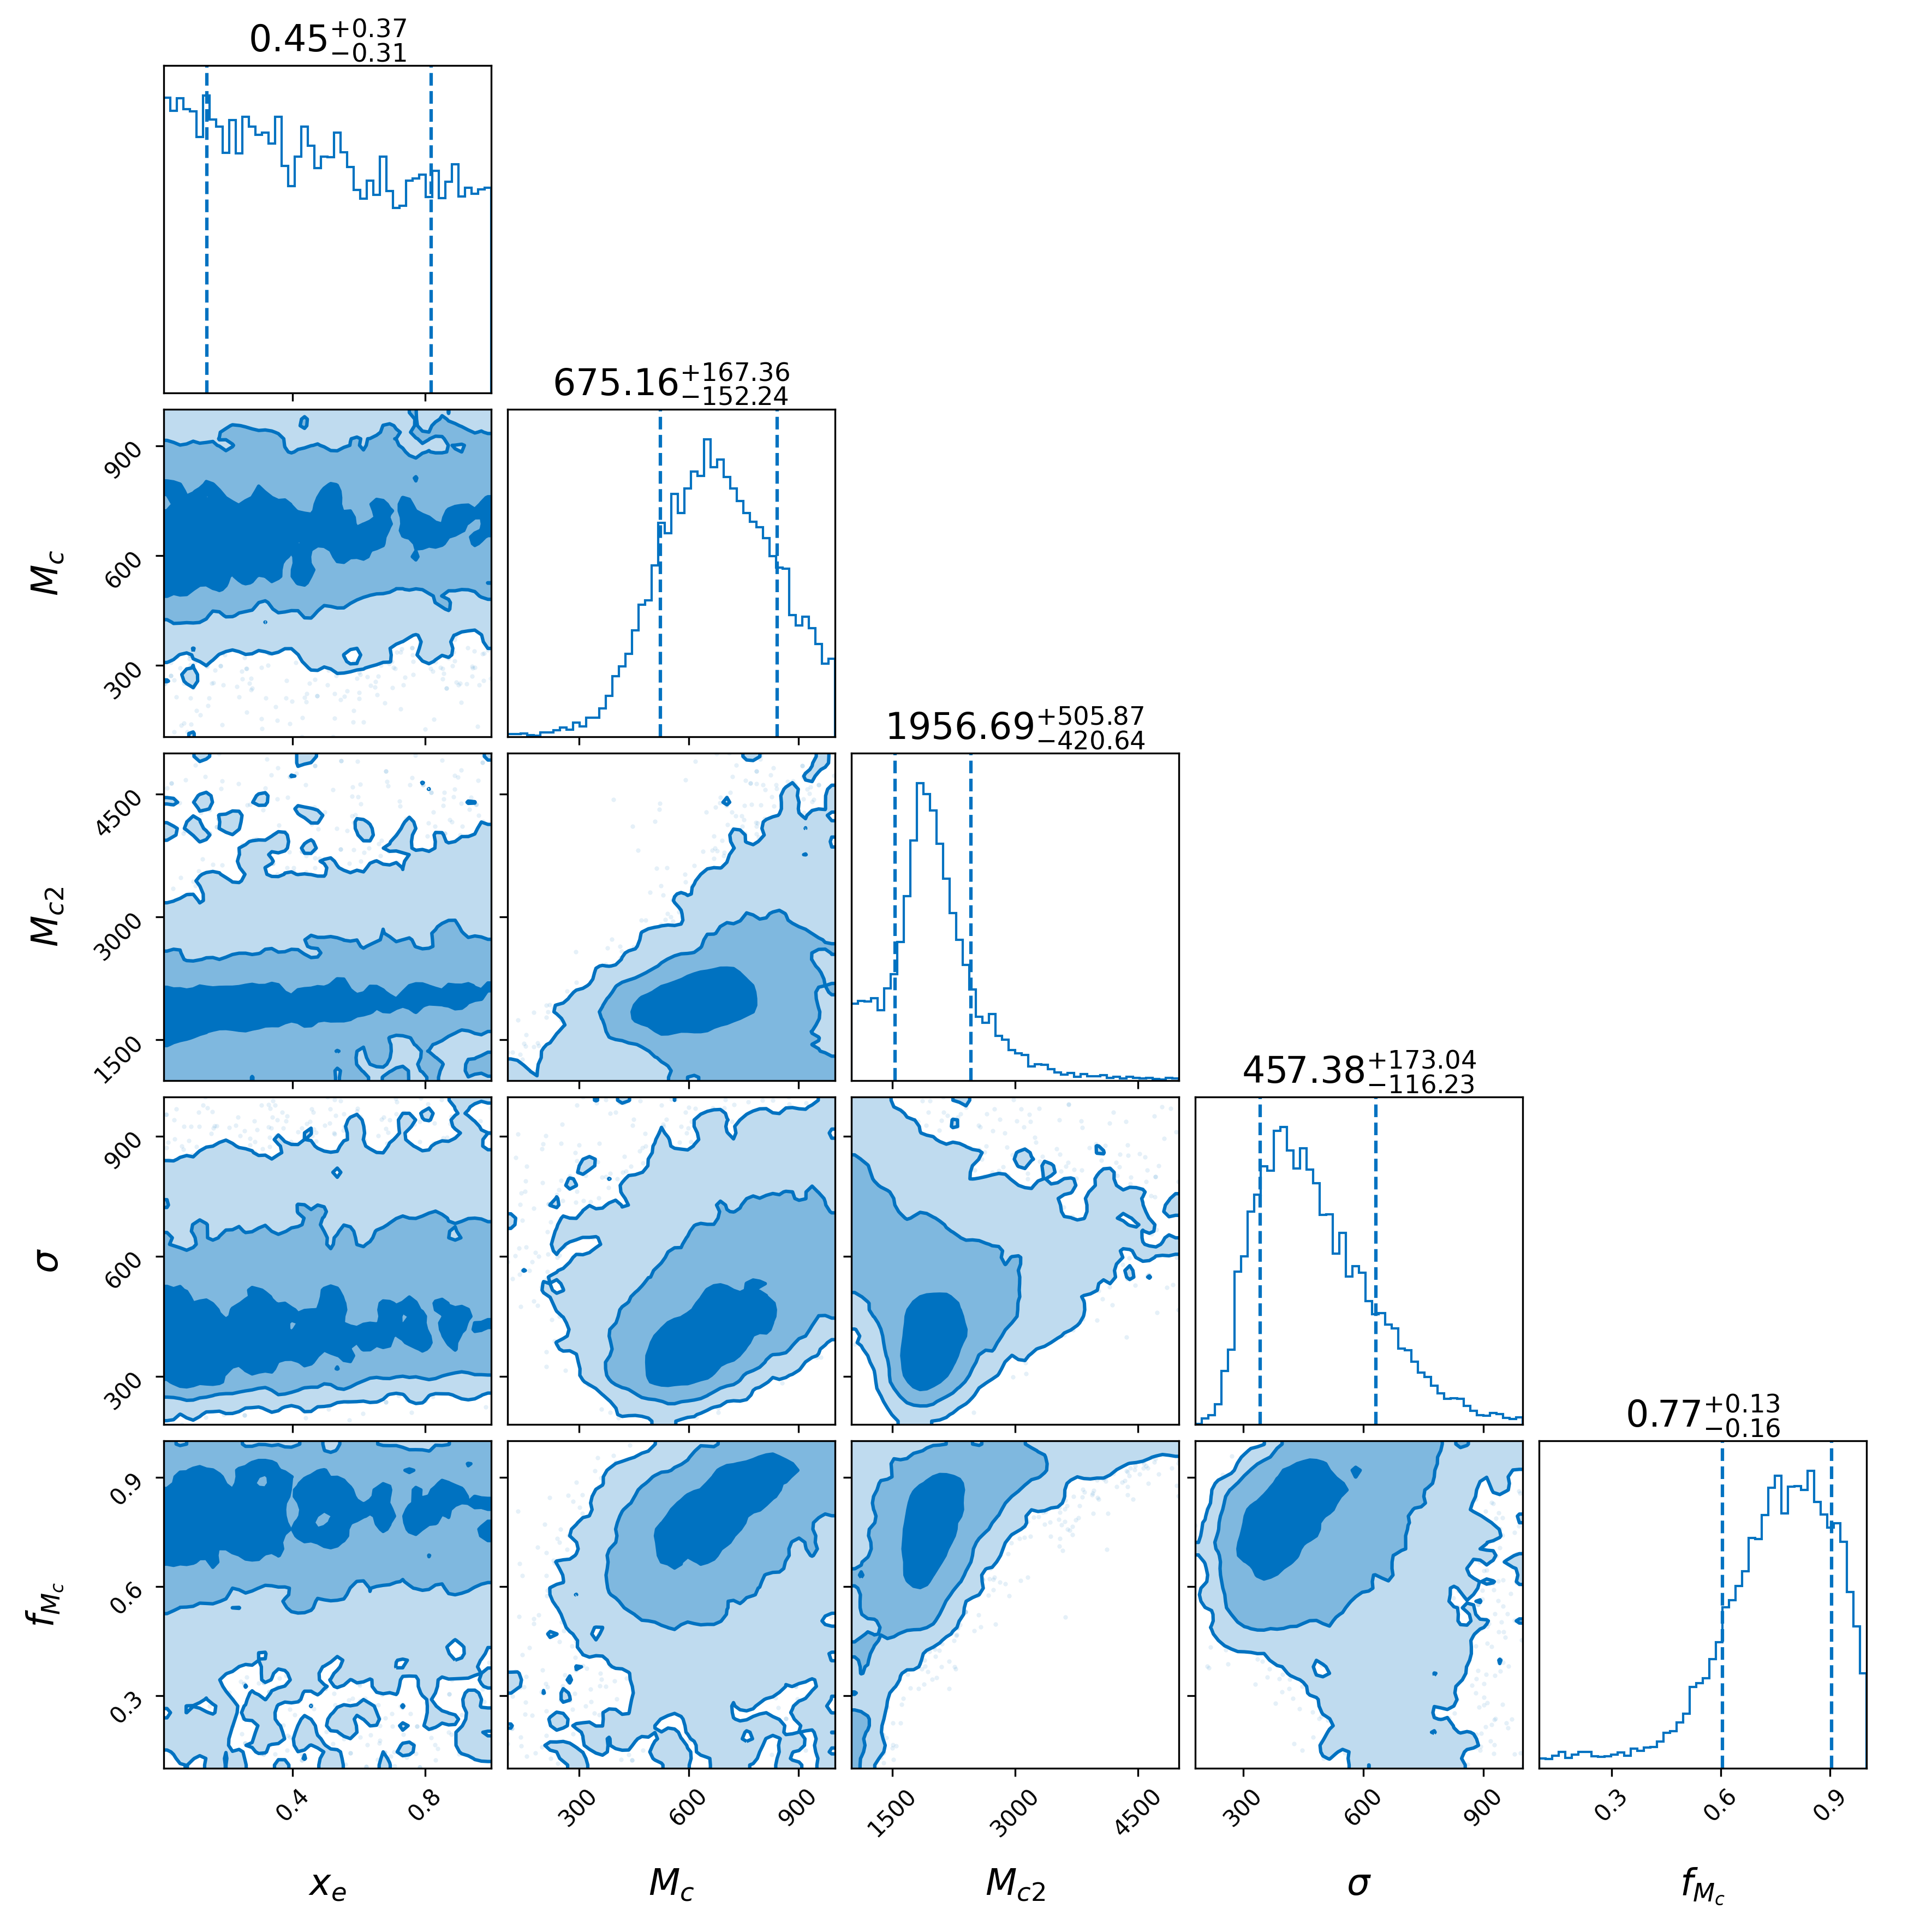
Appendix: The Posterior Distribution of PBH Population
The posteriors of the hyper-parameters describing the initial mass distributions of PBHs (Logormal/Gaussian/Powerlaw/Critical/Multipeak), as introduced in the main text, are displayed in Figure 4, respectively.