Predicting Human Attention using Computational Attention
Abstract
Most models of visual attention are aimed at predicting either top-down or bottom-up control, as studied using different visual search and free-viewing tasks. We propose Human Attention Transformer (HAT), a single model predicting both forms of attention control. HAT is the new state-of-the-art (SOTA) in predicting the scanpath of fixations made during target-present and target-absent search, and matches or exceeds SOTA in the prediction of “taskless” free-viewing fixation scanpaths. HAT achieves this new SOTA by using a novel transformer-based architecture and a simplified foveated retina that collectively create a spatio-temporal awareness akin to the dynamic visual working memory of humans. Unlike previous methods that rely on a coarse grid of fixation cells and experience information loss due to fixation discretization, HAT features a dense-prediction architecture and outputs a dense heatmap for each fixation, thus avoiding discretizing fixations. HAT sets a new standard in computational attention, which emphasizes both effectiveness and generality. HAT’s demonstrated scope and applicability will likely inspire the development of new attention models that can better predict human behavior in various attention-demanding scenarios.
1 Introduction
The prediction of human attention is crucial for Human-Computer Interaction (HCI) systems to anticipate a person’s needs and intents, but human attention is not a singular thing and its control can take at least two broad forms. One is bottom-up, meaning that attention saliency signals are computed from the visual input and used to prioritize shifts of attention. The same visual input should therefore lead to the same shifts of bottom-up attention. The second type of attention is top-down, meaning that a task or goal is used to control attention. Given a kitchen scene, very different fixations are observed depending on whether a person is searching for a clock or a microwave oven [59]. These two types of attention control spawned two separate literatures on gaze fixation prediction (the accepted measure of attention), one where studies use a free-viewing task to study questions of bottom-up attention and the other using a goal-directed task (typically, visual search) to study top-down attention control. Consequently, most models have been designed to address either bottom-up or top-down attention, not both. Can a single model architecture predict both bottom-up and top-down attention control?
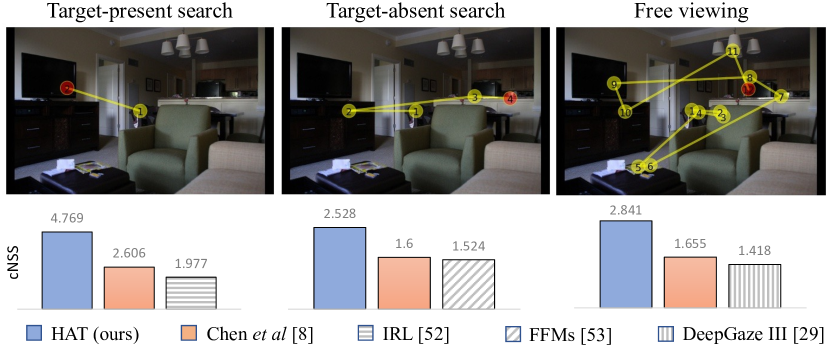
Our answer to this question is HAT, a Human Attention Transformer that generally predicts scanpaths of fixations, meaning that it can be applied to both top-down visual search and bottom-up free viewing tasks (Fig. 1). Critical to HAT’s effectiveness and scope is a novel transformer-based design and a simplified foveated retina that collectively work to create a form of dynamically-updating visual working memory. Previous methods either use a recurrent neural network (RNN) to maintain a dynamically updated hidden vector that conveys information across fixations [9, 48, 57, 2], or simulate a foveated retina by combining multi-resolution information at the pixel level [57], feature level [55], or semantic level [54]. These methods, however, have drawbacks: RNNs lack interpretability and multi-resolution methods of simulating a foveated retina [57, 54, 55] fail to capture critical temporal and spatial information useful for scanpath prediction. To address these problems, a computational attention mechanism [49] is used to dynamically integrate the spatial, temporal and visual information acquired at each fixation into working memory [43, 44], enabling HAT to learn a set of task-specific attention weights for aggregating information from working memory and predicting human attention control. This mechanism hints at the relationship between human attention and working memory [16, 19], making HAT cognitively plausible and its predictions interpretable.
In addition, previous work [54, 55, 9] addressed the problem of scanpath prediction using (inverse) reinforcement learning, where a coarse grid is often used to discretize the fixations into categorical actions due to the limited amount of gaze data. However, this discretization of fixations leads to reduced accuracy of the fixation prediction, thereby minimizing the usefulness of the method in applications where high-resolution imagery is available as input. A seemingly simple remedy to this problem would be to increase the resolution of the discretization grid. However, this would quadratically increase the dimension of the action space, making it challenging to train the networks due to the need for much larger amounts of training data to covering a much larger action space. HAT, on the other hand, treats the scanpath prediction problem as a sequence of dense prediction tasks with per-pixel supervision, thus avoiding the discretization problem.
To demonstrate HAT’s generality, we predict scanpaths under three settings, target-present (TP) search, target-absent (TA) search, and free-viewing (FV), covering both top-down and bottom-up attention. In the previous work predicting search scanpaths [54, 55, 9], separate models were trained for the TP and TA settings. HAT is a single model establishing new SOTAs in both TP and TA search-scanpath prediction. When trained with FV scanpaths, HAT also achieves top performance relative to baselines. HAT advances SOTA in cNSS by 83%, 58% and 72% under the TP, TA and FV settings on the COCO-Search18 dataset [10] and the COCO-FreeView dataset [11], respectively.
Our contributions can be summarized as follows:
-
1.
We propose HAT, a novel transformer architecture integrating visual information at two different eccentricities (approximating a foveated retina) to predict the spatial and temporal allocation of human attention (the fixation scanpath).
-
2.
We show that our HAT architecture can be broadly applied to different attention control tasks, as demonstrated by SOTA scanpath predictions in the TP and TA and FV settings. We also demonstrate that HAT’s predictions of human attention are highly interpretable.
-
3.
We remove the need for fixation discretization and formulate scanpath prediction as a sequential dense prediction task, making HAT applicable to high-resolution input.
2 Related Work
Predicting and understanding human gaze control has been a topic of interest for decades in psychology [56, 18, 58], but it has only recently attracted the researcher’s attention in computer vision [1, 26] In particular, Itti’s seminal work [23] on the saliency model has triggered a lot of interest on human attention modeling in computer vision community and facilitated many other studies identifying and modeling the salient visual features of an image to predict natural human eye-movement behavior [5, 33, 29, 22, 32, 15, 25, 24, 4, 41, 3]. However, the scope of these work is often narrowly focused on predicting human natural eye-movements without a specific visual task (i.e., free-viewing), ignoring another important form of attention control, such as goal-directed attention. In addition, existing saliency models (for which training code is available, if applicable, e.g., [23, 50]) only model the spatial distribution of fixations and do not predict the temporal order between fixations (i.e., scanpath). Scanpath prediction is more challenging problem because it requires predicting not only where a fixation will be, but also when it will be there.
To tackle these limitations, Chen et al. [10] created COCO-Search18, a large-scale goal-directed gaze dataset. In that work, eye movements were collected from the participants who were asked to search for a target object from the visual input where a target might or might not exist (target present and target absent conditions, respectively). This paradigm, called categorical visual search, is extensively studied in psychology to understand human goal-directed attention control [52]. Early visual search datasets either have multiple targets [20] in an image or only contain one or two target categories [17, 57]. COCO-Search18 extended it to 18 targets creating a large enough eye-movement dataset that enables training deep-learning models to predict goal-directed human scanpaths. In [54], an inverse reinforcement learning (IRL) model proposed which showed superior performance on COCO-Search18 in predicting target-present scanpaths. Most recently, the same research group [55] proposed a more generalized scanpath prediction model using foveated feature maps that can be applied to target-absent as well. However, their generalizability to free-viewing prediction has never been interrogated.
Chen et al. [9] showed that a reinforcement learning model directly optimized on the scanpath similarity metric can predict scanpaths on VQA task, as well as on free-viewing and target-present visual search tasks. Similar to their work, we design a generic scanpath model that generalizes to free-viewing and visual search tasks (both target-present and target-absent). Contrary to the previous approach (mostly CNN-based), we leverage the power of the Transformer architecture [49] and a dynamically-updating working memory, which collectively helps to learn a complex spatio-temporal fixation representations that can be applied to various visual tasks. We also approach scanpath prediction as a dense prediction problem, eliminating the need for discretizing the fixations into lower-resolution grid space, which causes an inevitable loss of precision in the fixation prediction as in previous methods [9, 54, 55]. Our model is similar to IVSN [60] in using a top-down query to match features in a feature map for each visual task (free-viewing or search). However, a critical difference is that in IVSN the query is directly extracted from a given task-related image; whereas in our setting HAT automatically learn the task-specific queries from the training fixations.
3 Approach
In this section, we first formulate scanpath prediction as a sequence of dense prediction tasks using behavior cloning. We then introduce our proposed transformer-based model, HAT, for scanpath prediction. Finally, we describe how we train HAT and use it for fast inference.
3.1 Preliminaries
To avoid the precision loss caused by grid discretization present in prior fixation prediction methods [57, 54, 9, 55], we formulate scanpath prediction as a sequential prediction of pixel coordinates. Given a image and the initial fixation (often set as the center of an image), a scanpath prediction model aims to predict a sequence of human-like fixation locations , with each fixation being a pixel location in the image. Note that is variable that may be different for each scanpath due to the different termination criteria of different human viewers. To model the uncertainty in human attention allocation, existing methods [55, 54, 9, 57] often predict a probability distribution over a coarse grid of fixation locations at each step. HAT takes the same spirit but outputs a dense fixation heatmap. Specifically, HAT outputs a heatmap with each pixel value indicating the chance of the pixel being fixated in the next fixation. In addition, HAT also outputs a termination probability indicating how likely the model should terminate the scanpath at the current step . To sample a fixation, we apply -normalization on . In the following, we omit the subscript for brevity.
3.2 Human Attention Transformer
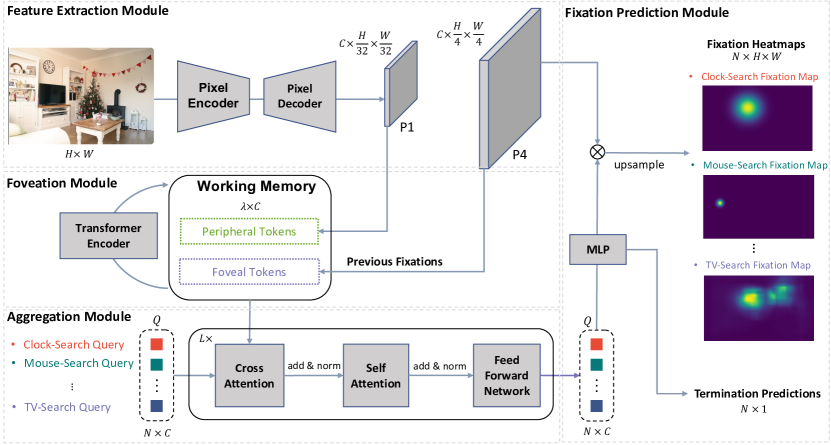
HAT is a novel transformer-based model for scanpath prediction. At each fixation, HAT outputs a set of prediction pairs where indicates a task, which could be a visual search task (e.g., clock search and mouse search) or a free-viewing task. Fig. 2 shows an overview of the proposed model. HAT consists of four modules: 1) a feature extraction module that extracts a feature pyramid with multi-resolutional feature maps corresponding to information extracted at different eccentricities [55, 47]; 2) a foveation module which maintains a dynamical working memory representing the information acquired through fixations; 3) an aggregation module that selectively aggregates the information in the working memory using attention mechanism for each task; 4) a fixation prediction module that predicts the fixation heatmap and termination probability for each task .
The feature extraction module consists of a pixel encoder (e.g., ResNet [21], a Swin transformer [39]), and a pixel decoder (e.g., FPN [36] and deformable attention [61]). Taking a image as input, the pixel encoder encodes the input image into a high-semantic but low-resolution feature map. The pixel decoder up-samples the feature map several times, each time by a scale factor of two, to construct a pyramid of four multi-scale feature maps denoted as , where , , and is the channel dimension.
The foveation module constructs a dynamic working memory using the feature maps and to represent the information a person acquires from the peripheral and foveal vision, respectively. We discard medium-grained feature maps and in computing the peripheral representation for computational efficiency. We did not observe performance improvement after adding in the peripheral tokens (see Sec. 4.4 for details). Finally, we apply a Transformer encoder [49] to dynamically update the working memory with the information acquired at a new fixation.
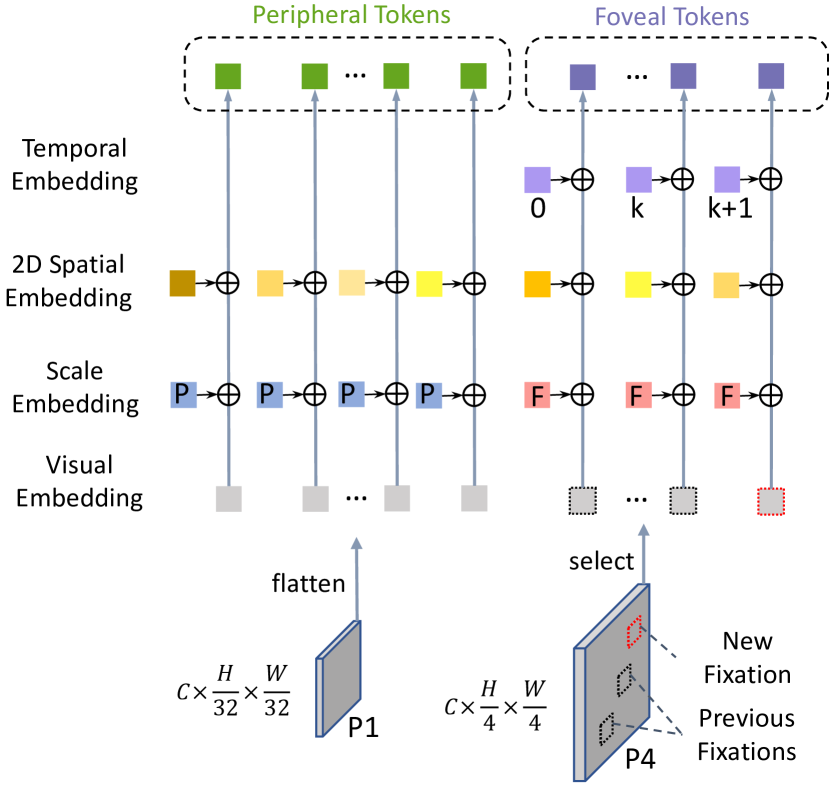
Fig. 3 illustrates the construction of the working memory. The working memory consists of two parts: peripheral tokens and foveal tokens. We first flatten the low-resolution feature map over the spatial axes to obtain the peripheral visual embeddings . Feature vectors in at each fixation location are selected as the foveal visual embeddings , where is number of previous fixations. For simplicity, we round the fixation to its nearest position in . Then we add a learnable scale embedding to each token to discern the scale/resolution of the visual embeddings. As the spatial information is shown to be important in predicting human scanpath (e.g., center bias and inhibition of return [51]), we enrich the peripheral and foveal tokens with their 2D spatial information in the image. Specifically, we create a lookup table of 2D sinusoidal position embeddings [35] by concatenating the 1D sinusoidal positional encoding of the horizontal and vertical coordinates of each pixel location. For a visual embedding at position of a given feature map of stride ( for and for ), its position encoding is defined by the element at position in where and . Furthermore, we add to each foveal token the temporal embedding, a learnable vector, according to its fixation index to capture the temporal order among previous fixations.
The aggregation module is a transformer decoder [49] that selectively aggregates information from the working memory into the task-specific queries , where is the number of tasks (e.g., for COCO-Search18 [10] and for free-viewing datasets). The transformer decoder has layers, with each layer consisting of a cross-attention layer, a self-attention layer and a feed-forward network (FFN). Different from the standard transformer decoder [49], we follow [12] and switch the order of cross-attention and self-attention module. Firstly, each zero-initialized task query selectively gathers the information in working memory acquired through previous fixations using cross-attention. Then, the self-attention layer followed by a FFN is applied to exchange information in different queries which could boost the contextual cues [14] in each query.
The fixation prediction module yields the final prediction—a fixation heatmap and a termination probability for each task . For the termination prediction, a linear layer followed by a sigmoid activation is applied on top of each updated query :
| (1) |
where and are the parameters of the linear layer. For the fixation heatmap prediction, a Multi-Layer Perceptron (MLP) with two hidden layers first transforms into a task embedding, which is then convolved with the high-resolution feature map to get the fixation heatmap after a sigmoid layer:
| (2) |
where denotes the pixel-wise dot product operation. Finally, we upsample to the image resolution. Note that the predictions for all tasks, i.e., and , are yielded in parallel.
3.3 Training and Inference
Training loss. We follow [57] and use behavior cloning to train HAT. The problem of scanpath prediction is broken down into learning a mapping from the input triplet of an image, a sequence of previous fixations, and a task to the output pair of a fixation heatmap and a termination probability. Given the predicted fixation heatmaps and termination probabilities , the training loss is only calculated for its ground-truth task :
| (3) |
where and are the the ground-truth fixation heatmap and termination label for task , respectively. We compute by smoothing the ground-truth fixation map with a Gaussian kernel with the kernel size being one degree of visual angle. denotes the fixation loss and is computed using pixel-wise focal loss [37, 34]:
| (4) |
where represents the value of at location and and . is the termination loss and is computed by applying a binary cross entropy (negative log-likelihood) loss, i.e.,
| (5) |
where is a weight to balance the loss of positive and negative training examples since there are many more negative labels than positive labels for training a termination prediction, especially for target-absent visual search and free-viewing tasks where scanpath are long. We set to be the ratio of the number of negative training instances to the number of positive ones.
Inference. Similarly to [54, 55, 9], HAT also generates scanpaths autoregressively, but in an efficient way. Given an image, HAT only computes the image pyramid and peripheral tokens once. For a new fixation, a foveal token is constructed and appended to the working memory after which the aggregation module and fixation prediction module yield the fixation heatmaps and termination predictions for all tasks in parallel.
| Target-present | Target-absent | |||||||||
| SemSS | SS | cIG | cNSS | cAUC | SemSS | SS | cIG | cNSS | cAUC | |
| Human consistency | 0.526 | 0.500 | - | - | - | 0.410 | 0.381 | - | - | - |
| Detector | 0.545 | 0.451 | 0.182 | 2.346 | 0.905 | 0.369 | 0.321 | -0.516 | 0.446 | 0.783 |
| Fixation heuristic | 0.530 | 0.437 | 1.107 | 2.186 | 0.917 | 0.347 | 0.298 | -0.599 | 0.405 | 0.798 |
| IVSN [60] | 0.393 | 0.326 | -0.192 | 1.318 | 0.901 | 0.284 | 0.222 | -0.219 | 0.884 | 0.867 |
| PathGAN [2] | 0.310 | 0.244 | - | - | - | 0.349 | 0.250 | - | - | - |
| IRL [54] | 0.491 | 0.422 | -9.709 | 1.977 | 0.913 | 0.301 | 0.319 | 0.032 | 1.202 | 0.893 |
| Chen et al. [9] | 0.536 | 0.445 | -1.273 | 2.606 | 0.956 | 0.381 | 0.331 | -3.278 | 1.600 | 0.925 |
| FFMs [55] | 0.529 | 0.451 | 1.548 | 2.376 | 0.932 | 0.389 | 0.372 | 0.729 | 1.524 | 0.916 |
| HAT (ours) | 0.554 | 0.444 | 2.259 | 4.769 | 0.970 | 0.412 | 0.388 | 1.314 | 2.528 | 0.945 |
| Joint HAT (ours) | 0.575 | 0.468 | 2.301 | 4.687 | 0.977 | 0.421 | 0.394 | 1.372 | 2.624 | 0.948 |
4 Experiments
In this section, we describe our experiments to study the effectiveness of HAT for scanpath prediction on both visual search and free-viewing tasks.
Datasets. We train and evaluate HAT using four datasets: COCO-Search18 [10], COCO-FreeView [11], MIT1003 [27] and OSIE [53]. COCO-Search18 is a large-scale visual search dataset containing both target-present and target-absent human scanpaths in searching for 18 different object target. COCO-Search18 contains 3101 target-present images and 3101 target-absent images selected from COCO [38], each viewed by 10 subjects. COCO-FreeView is a “sibling” dataset of COCO-Search18 but with free-viewing scanpaths. COCO-FreeView contains the same images with COCO-Search18, each viewed by 10 subjects in a free-viewing setting. MIT1003 is a widely-used free-viewing dataset containing 1003 natural images. OSIE is a also free-viewing gaze dataset but with rich semantic-level annotations, containing 700 natural indoor and outdoor scenes. Each image in MIT1003 and OSIE is viewed by 15 subjects.
Evaluation metrics. To measure the performance, we mainly analyze the scanpath prediction models from two aspects: 1) how similar the predicted scanpaths are to the human scanpaths; and 2) how accurate a model predicts the next fixation given all previous fixations. To measure the scanpath similarity, we use a commonly adopted metric, sequence score (SS) [6] and its variant semantic sequence score (SemSS) [55]. SS transforms the scanpaths into sequences of fixation cluster IDs and then compares them using a string matching algorithm [42]. Different from SS, SemSS transforms a scanpath into a string of semantic labels of the fixated pixels. For next fixation prediction, we follow [30, 55, 31] and report the conditional saliency metrics, cIG, cNSS and cAUC, which measure how well a predicted fixation probability map of a model predicts the ground-truth (next) fixation when the model is provided with the fixation history of the scanpath in consideration, using the widely used saliency metrics, IG, NSS and AUC [7]. For fair comparison, we follow [55] and predict one scanpath for each testing image, step by step selecting the most probable fixation location as the next fixation.
Other models. We first compare our model against several heuristic baselines. Following prior works [54, 57, 55, 9, 31], the human consistency, an oracle where we use one viewer’s scanpath to predict the scanpath of another, is reported as a gold-standard model. Second, we compare to a fixation heuristic method, a ConvNet trained to predict human fixation density maps, from which we sample fixations sequentially with inhibition of return. For visual search scanpaths, we further include a detector baseline, which is similar to the fixation heuristic, but trained on target-present images of COCO-Search18 to output target detection probability maps. For the fixation heuristic and detector baselines, we use the winner-take-all strategy to generate scanpaths. Furthermore, we compare HAT to the previous state-of-the-art models of scanpath prediction: IVSN [60], IRL [54], Chen et al. [9], DeepGaze III [31] and FFMs [55]. Note that IVSN only applies for visual search tasks, and unlike other methods, IVSN is designed for zero-shot search scanpath prediction, hence is not trained with any gaze data. DeepGaze III only applies for free-viewing scanpaths and is trained with the SALICON dataset [25] and MIT1003 [27].
4.1 Implementation Details
Network structure. HAT has four modules as shown in Fig. 2. For the feature extraction module, we use ResNet-50 [21] as our pixel encoder and MSDeformAttn [61] as the pixel decoder (results with other pixel encoders, ResNet-101 and Swin Transformer [39], and pixel decoder, FPN [36], can be found in the supplement). The number of channels of the feature maps is set to 256. For the foveation module, the transformer encoder has three layers. The transformer decoder in the aggregation module has six layers (i.e,. ). The number of queries for visual search scanpath prediction (as COCO-Search18 contains 18 target categories) and for free-viewing scanpath prediction. Finally, the MLP in the fixation prediction module has two hidden layers of 128 dimensions and a ReLU activation function.
Training settings. We follow [55, 54] and resize all images to for computational efficiency during training and inference. We use the AdamW [40] with the learning rate of and train HAT for 30 epochs with a batch size of 128. No data augmentation is used during training. Note that the pixel encoder and pixel decoder are kept fixed during training and we use the COCO-pretrained weights for panoptic segmentation from [12]. Following [54], we set the maximum length of each predicted scanpath to 6 and 10 (excluding the initial fixation) for target-present and target-absent search scanpath prediction, respectively. For free viewing, the maximum scanpath length is set to 20. More details can be found in the supplement.
| SS | cIG | cNSS | cAUC | |
| Human consistency | 0.349 | - | - | - |
| Fixation heuristic | 0.329 | 0.319 | 1.621 | 0.930 |
| PathGAN [2] | 0.181 | - | - | - |
| IRL [54] | 0.300 | -0.213 | 1.018 | 0.888 |
| Chen et al. [9] | 0.365 | -1.263 | 1.655 | 0.922 |
| DeepGaze III [31] | 0.339 | 0.140 | 1.418 | 0.910 |
| FFMs [55] | 0.329 | 0.329 | 1.432 | 0.918 |
| HAT | 0.359 | 1.171 | 2.841 | 0.947 |
| SS | cIG | cNSS | cAUC | |
| Human consistency | 0.363 | - | - | - |
| Chen et al. [9] | 0.210 | -9.735 | 0.186 | 0.750 |
| HAT | 0.225 | 0.573 | 1.841 | 0.930 |
4.2 Main Results
Visual Search. In Tab. 1, we compare HAT with SOTA visual search scanpath prediction models in both target-present (TP) and target-absent (TA) settings on the COCO-Search18 test set. When trained separately on TP and TA scanpaths, HAT consistently outperforms all other methods in predicting TP and TA scanpaths. In TP setting, HAT achieves the best performance in four out of five metrics. Although FFM and Detector are better in SS, HAT achieves a higher SemSS, suggesting that HAT better understands the semantics behind fixations. Moreover, compared to the previous state of the art, Chen et al. [9], HAT improves the cNSS by 83% and 58% in TP and TA settings, respectively. Importantly, when trained jointly with TP and TA scanpaths (never been done before), HAT further improves the performance in predicting both TP and TA scanpaths, surpassing or matching with human consistency in most metrics.
Free-viewing. Beyond visual search, HAT can also predict free-viewing scanpath by regarding the free-viewing as a single standalone task. In Tab. 2, we compare HAT with the baselines except Detector and IVSN as the free-viewing fixations are not tasked to searching for a target like visual search. HAT outperforms all other methods in cIG, cNSS and cAUC, especially HAT is 256% and 72% better than the second best (FFMs and [9]) in cIG, cNSS, respectively. This reaffirms the effectiveness of HAT as a generic framework for scanpath prediction. We further compare HAT to the best alternative overall, Chen et al. [9], by evaluating the models trained using COCO-FreeView on an unseen dataset MIT1003 in Tab. 8. The results show that HAT outperforms [9] in all metrics and with significant improvement in cIG, cNSS and cAUC. This suggests that other models like the predictions of FFMs and Chen et al.’s model are prone to be overconfident, whereas HAT better calibrates the confidence in predicting free-viewing fixations and thus provides a more robust prediction of human attention with better generalizability to unseen datasets. Our additional experiments on OSIE and MIT1003 further confirm our findings. Please refer to the supplement for detailed results.
4.3 Qualitative Analysis
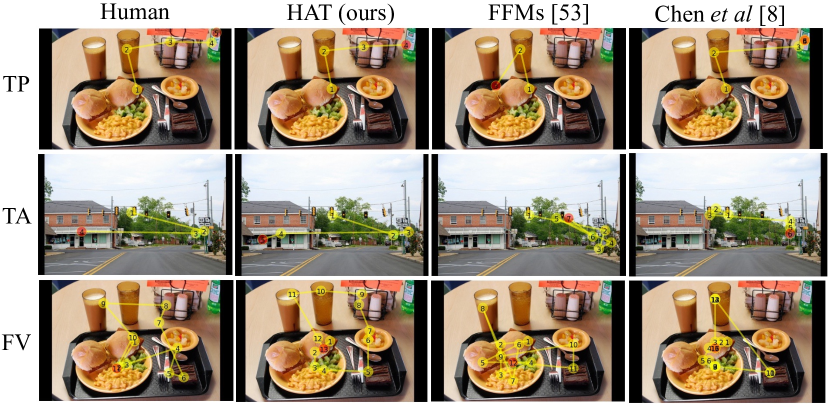
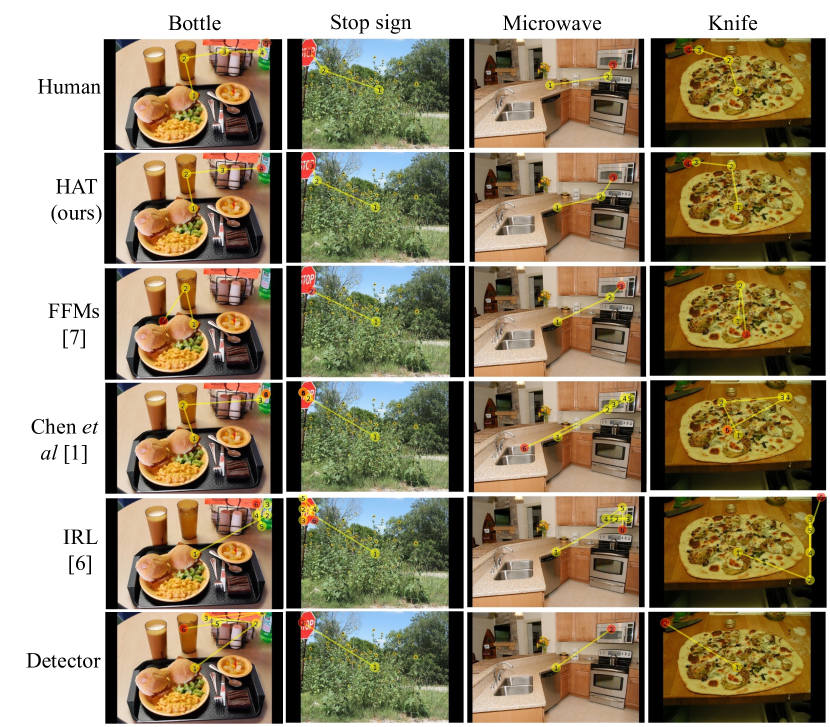
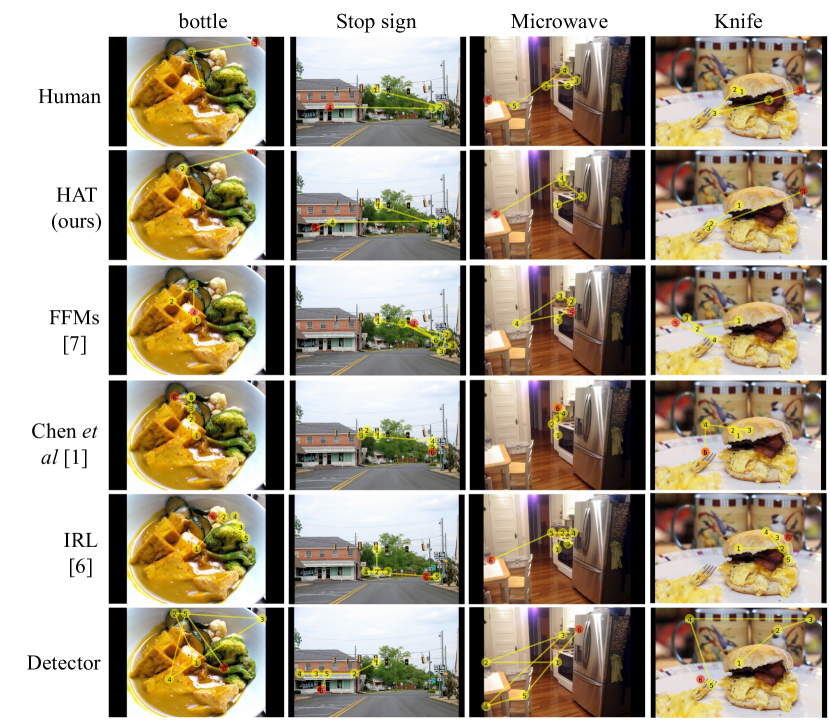
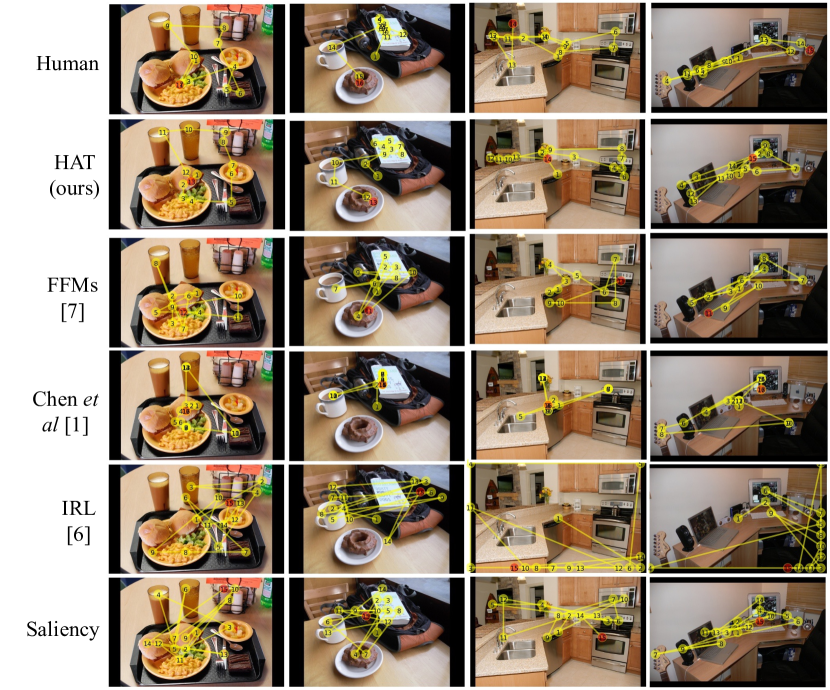
Scanpath visualization. In this section, we qualitatively compare the predicted scanpaths of different methods to each other and to the ground-truth human scanpaths in the TP, TA and FV settings. As shown in Fig. 4, when searching for bottles in the TP setting, HAT not only correctly predicted the terminal fixation on the heavily-occluded target, but also predicted fixations on all the distractor objects that look similar to the target, like humans do. Other methods either missed the distractor objects or failed to find the target. Similarly, for the TA stop sign search, HAT was the only one that looked at both sides of the road in searching for a stop sign like the human subject would, showing a use of semantic and context cues to control attention. In the FV setting, HAT also predicted the most human-alike scanpaths among all methods in (1) the fixation locations (where), (2) the semantics (what), and (3) the order (when) of the fixations. This demonstrates that HAT captures the all three aspects (what, where and when) of human fixations. More scanpath visualizations can be found in the supplement.
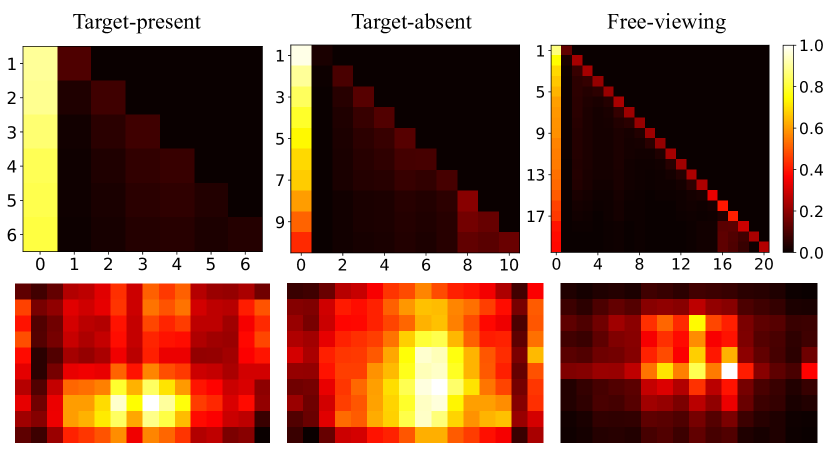
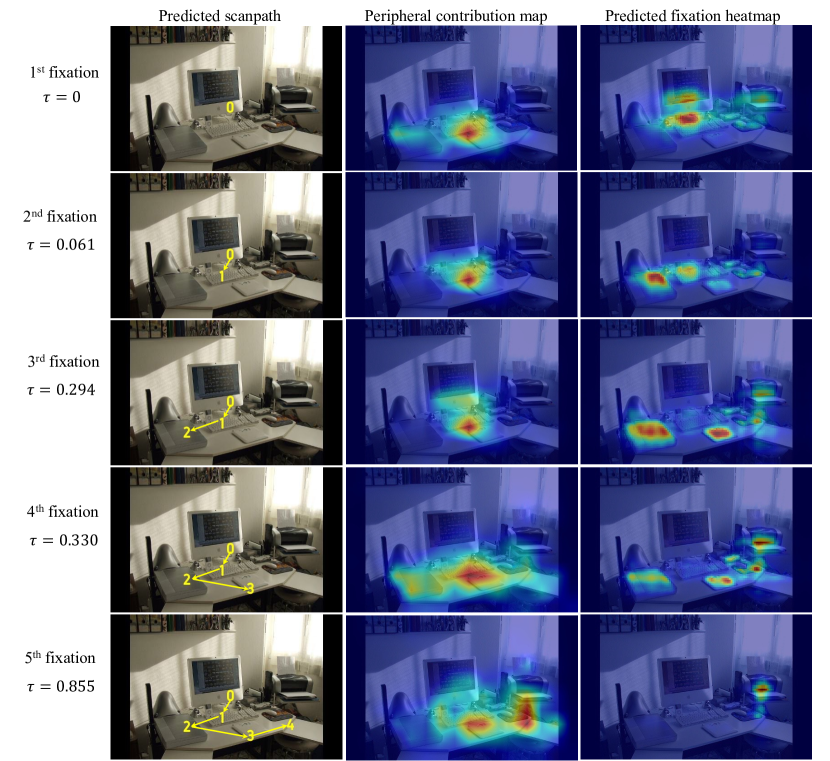
Model interpretability. We also qualitatively analyzed the contribution of peripheral tokens and foveal tokens in predicting human attention control under the TP, TA and FV settings, separately. As shown in Fig. 5, the peripheral tokens contribute the most in predicting TP fixations across all fixations (forming the yellow column on the left). This is because in TP images there is a strong target signal available in the visual periphery to guide attention. Contrast this with FV fixations, where the contribution of the peripheral tokens diminishes over the temporal space and the only the current foveal token has a strong and consistent contribution (a clear red diagonal line). An interpretation of this pattern is that people have only a poor memory of what they viewed in previous fixations and their attention is controlled by salient pixels within a local neighborhood around the current fixation. Interestingly, for TA fixations we also observe a diminishing contribution of the peripheral tokens over the temporal space, but not as pronounced. Moreover, as more fixations are made, the contribution of recent fixations increases, approaching the pattern in FV. This suggests that the later fixations of a TA scanpath behave like a FV scanpath, which confirms a finding in [11]. Lastly, the bottom row visualizes the contribution of each individual peripheral token (averaged over the temporal axis), where we see peripheral tokens encode a strong center bias for FV fixations, whereas TA fixations show a weaker center bias and TP fixations show no obvious center bias at all, again as expected and confirming previous suggestion. This showcases the potential for HAT to make highly interpretable predictions of human attention control. Category-wise analysis for TP and TA can be found in the supplement.
| SemSS | SS | cIG | cNSS | |
| (HAT) | 0.412 | 0.388 | 1.314 | 2.528 |
| 0.410 | 0.385 | 1.321 | 2.533 | |
| 0.411 | 0.386 | 1.306 | 2.487 | |
| w/o transformer enc. | 0.399 | 0.377 | 1.249 | 2.442 |
| w/o spatial emb. | 0.400 | 0.380 | 1.040 | 2.299 |
| w/o scale emb. | 0.403 | 0.380 | 1.283 | 2.453 |
| w/o temporal emb. | 0.411 | 0.383 | 1.136 | 2.244 |
| w/o peripheral tokens | 0.404 | 0.374 | 1.248 | 2.465 |
| w/o foveal tokens | 0.393 | 0.374 | 0.778 | 1.893 |
4.4 Ablation studies
We perform ablation studies of HAT under the TA setting. In Tab. 4, we first verify our choice of extracting the peripheral tokens from in the foveation module of HAT. We train HAT with three different sources of peripheral tokens: 1) (160 peripheral tokens as and ); 2) (640 tokens); 3) where we concatenate the tokens for and (800 tokens in total). We observe that three different options have similar performance. We choose in our implementation because of its computational efficiency and smaller memory footprint.
We further verify the effectiveness of each component in the foveation module, including the transformer encoder, 2D spatial embedding, scale embedding and temporal embedding, peripheral tokens and foveal tokens, by ablating them one at a time. It is shown in Tab. 4 that ablating any of these components incur a performance drop over all metrics. This suggests that all of these components contribute to the superior performance of HAT. Among these components, removing foveal tokens incurs the largest performance drop (cIG decreases by nearly 41%). This is understandable because foveal tokens represent the knowledge acquired in previous fixations, without which HAT can be considered as a fixation density map predictor like the fixation heuristic baseline. In addition, spatial embedding and temporal embedding also contribute significantly to the performance of HAT, without them cIG drops by 21% and 14%, respectively. This indicates that knowing “where” and “when” visual information is acquired is important for predicting scanpath. Please refer to the supplementary material for more ablation studies of HAT.
5 Conclusions and Discussion
With the rapid development of Augmented Reality (AR) and Virtual Reality (VR) technologies, there is an increasing demand for predicting and understanding human gaze behavior [45, 28, 46], with scanpath prediction being a challenging task. For those AR/VR applications requiring a high input resolution (), discretizing fixations into a coarse grid incurs a non-negligible loss in accuracy. In this work we presented HAT, a generic attention scanpath prediction model. Built from a simple dense prediction framework [13], HAT circumvents the drawbacks of discretizing fixations as in prior state of the arts [54, 9, 55]. Inspired by the human vision system, HAT uses a novel foveated working memory which dynamically updates its knowledge about the scene as it changes its fixation. We show that HAT achieves new SOTA performance, not only in predicting free-viewing fixation scanpaths, but also scanpaths in target-present and target-absent search. In demonstrating this broad scope, our HAT model sets a new bar in the computational attention of attention control.
References
- [1] Emre Akbas and Miguel P Eckstein. Object detection through search with a foveated visual system. PLoS computational biology, 2017.
- [2] Marc Assens, Xavier Giro-i Nieto, Kevin McGuinness, and Noel E O’Connor. Pathgan: Visual scanpath prediction with generative adversarial networks. In Proceedings of the European Conference on Computer Vision (ECCV) Workshops, pages 0–0, 2018.
- [3] David J Berg, Susan E Boehnke, Robert A Marino, Douglas P Munoz, and Laurent Itti. Free viewing of dynamic stimuli by humans and monkeys. Journal of vision, 9(5):19–19, 2009.
- [4] Ali Borji, Ming-Ming Cheng, Huaizu Jiang, and Jia Li. Salient object detection: A benchmark. IEEE transactions on image processing, 24(12):5706–5722, 2015.
- [5] Ali Borji and Laurent Itti. State-of-the-art in visual attention modeling. IEEE transactions on pattern analysis and machine intelligence, 35(1):185–207, 2013.
- [6] Ali Borji, Hamed R Tavakoli, Dicky N Sihite, and Laurent Itti. Analysis of scores, datasets, and models in visual saliency prediction. In Proceedings of the IEEE international conference on computer vision, pages 921–928, 2013.
- [7] Zoya Bylinskii, Tilke Judd, Aude Oliva, Antonio Torralba, and Frédo Durand. What do different evaluation metrics tell us about saliency models? IEEE transactions on pattern analysis and machine intelligence, 41(3):740–757, 2018.
- [8] Holger Caesar, Jasper Uijlings, and Vittorio Ferrari. Coco-stuff: Thing and stuff classes in context. In Proceedings of the IEEE conference on computer vision and pattern recognition, pages 1209–1218, 2018.
- [9] Xianyu Chen, Ming Jiang, and Qi Zhao. Predicting human scanpaths in visual question answering. In Proceedings of the IEEE/CVF Conference on Computer Vision and Pattern Recognition, pages 10876–10885, 2021.
- [10] Yupei Chen, Zhibo Yang, Seoyoung Ahn, Dimitris Samaras, Minh Hoai, and Gregory Zelinsky. Coco-search18 fixation dataset for predicting goal-directed attention control. Scientific reports, 11(1):1–11, 2021.
- [11] Yupei Chen, Zhibo Yang, Souradeep Chakraborty, Sounak Mondal, Seoyoung Ahn, Dimitris Samaras, Minh Hoai, and Gregory Zelinsky. Characterizing target-absent human attention. In Proceedings of the IEEE/CVF Conference on Computer Vision and Pattern Recognition (CVPR) Workshops, pages 5031–5040, 2022.
- [12] Bowen Cheng, Ishan Misra, Alexander G Schwing, Alexander Kirillov, and Rohit Girdhar. Masked-attention mask transformer for universal image segmentation. In Proceedings of the IEEE/CVF Conference on Computer Vision and Pattern Recognition, pages 1290–1299, 2022.
- [13] Bowen Cheng, Alex Schwing, and Alexander Kirillov. Per-pixel classification is not all you need for semantic segmentation. Advances in Neural Information Processing Systems, 34:17864–17875, 2021.
- [14] Marvin M Chun and Yuhong Jiang. Contextual cueing: Implicit learning and memory of visual context guides spatial attention. Cognitive psychology, 36(1):28–71, 1998.
- [15] Marcella Cornia, Lorenzo Baraldi, Giuseppe Serra, and Rita Cucchiara. Predicting human eye fixations via an lstm-based saliency attentive model. IEEE Transactions on Image Processing, 27(10):5142–5154, 2018.
- [16] Robert Desimone, John Duncan, et al. Neural mechanisms of selective visual attention. Annual review of neuroscience, 18(1):193–222, 1995.
- [17] Krista A Ehinger, Barbara Hidalgo-Sotelo, Antonio Torralba, and Aude Oliva. Modelling search for people in 900 scenes: A combined source model of eye guidance. Visual cognition, 17(6-7):945–978, 2009.
- [18] John M Findlay and Iain D Gilchrist. Visual attention: The active vision perspective. In Vision and attention, pages 83–103. Springer, 2001.
- [19] Adam Gazzaley and Anna C Nobre. Top-down modulation: bridging selective attention and working memory. Trends in cognitive sciences, 16(2):129–135, 2012.
- [20] Syed Omer Gilani, Ramanathan Subramanian, Yan Yan, David Melcher, Nicu Sebe, and Stefan Winkler. Pet: An eye-tracking dataset for animal-centric pascal object classes. In 2015 IEEE International Conference on Multimedia and Expo (ICME), pages 1–6. IEEE, 2015.
- [21] Kaiming He, Xiangyu Zhang, Shaoqing Ren, and Jian Sun. Deep residual learning for image recognition. In Proceedings of the IEEE conference on computer vision and pattern recognition, pages 770–778, 2016.
- [22] Xun Huang, Chengyao Shen, Xavier Boix, and Qi Zhao. Salicon: Reducing the semantic gap in saliency prediction by adapting deep neural networks. In Proceedings of the IEEE International Conference on Computer Vision, pages 262–270, 2015.
- [23] Laurent Itti and Christof Koch. A saliency-based search mechanism for overt and covert shifts of visual attention. Vision research, 40(10-12):1489–1506, 2000.
- [24] Saumya Jetley, Naila Murray, and Eleonora Vig. End-to-end saliency mapping via probability distribution prediction. In Proceedings of the IEEE Conference on Computer Vision and Pattern Recognition, pages 5753–5761, 2016.
- [25] Ming Jiang, Shengsheng Huang, Juanyong Duan, and Qi Zhao. Salicon: Saliency in context. In The IEEE Conference on Computer Vision and Pattern Recognition (CVPR), June 2015.
- [26] Aditya Jonnalagadda, William Yang Wang, BS Manjunath, and Miguel P Eckstein. Foveater: Foveated transformer for image classification. arXiv preprint arXiv:2105.14173, 2021.
- [27] Tilke Judd, Krista Ehinger, Frédo Durand, and Antonio Torralba. Learning to predict where humans look. In 2009 IEEE 12th international conference on computer vision, pages 2106–2113. IEEE, 2009.
- [28] Anton S Kaplanyan, Anton Sochenov, Thomas Leimkühler, Mikhail Okunev, Todd Goodall, and Gizem Rufo. Deepfovea: Neural reconstruction for foveated rendering and video compression using learned statistics of natural videos. ACM Transactions on Graphics (TOG), 38(6):1–13, 2019.
- [29] Srinivas SS Kruthiventi, Kumar Ayush, and R Venkatesh Babu. Deepfix: A fully convolutional neural network for predicting human eye fixations. IEEE Transactions on Image Processing, 26(9):4446–4456, 2017.
- [30] Matthias Kümmerer and Matthias Bethge. State-of-the-art in human scanpath prediction. arXiv preprint arXiv:2102.12239, 2021.
- [31] Matthias Kümmerer, Matthias Bethge, and Thomas SA Wallis. Deepgaze iii: Modeling free-viewing human scanpaths with deep learning. Journal of Vision, 22(5):7–7, 2022.
- [32] Matthias Kümmerer, Lucas Theis, and Matthias Bethge. Deep gaze i: Boosting saliency prediction with feature maps trained on imagenet. arXiv preprint arXiv:1411.1045, 2014.
- [33] Matthias Kummerer, Thomas SA Wallis, Leon A Gatys, and Matthias Bethge. Understanding low-and high-level contributions to fixation prediction. In Proceedings of the IEEE International Conference on Computer Vision, pages 4789–4798, 2017.
- [34] Hei Law and Jia Deng. Cornernet: Detecting objects as paired keypoints. In Proceedings of the European conference on computer vision (ECCV), pages 734–750, 2018.
- [35] Yang Li, Si Si, Gang Li, Cho-Jui Hsieh, and Samy Bengio. Learnable fourier features for multi-dimensional spatial positional encoding. Advances in Neural Information Processing Systems, 34:15816–15829, 2021.
- [36] Tsung-Yi Lin, Piotr Dollár, Ross Girshick, Kaiming He, Bharath Hariharan, and Serge Belongie. Feature pyramid networks for object detection. In Proceedings of the IEEE conference on computer vision and pattern recognition, pages 2117–2125, 2017.
- [37] Tsung-Yi Lin, Priya Goyal, Ross Girshick, Kaiming He, and Piotr Dollár. Focal loss for dense object detection. In Proceedings of the IEEE international conference on computer vision, pages 2980–2988, 2017.
- [38] Tsung-Yi Lin, Michael Maire, Serge Belongie, James Hays, Pietro Perona, Deva Ramanan, Piotr Dollár, and C Lawrence Zitnick. Microsoft coco: Common objects in context. In European conference on computer vision, pages 740–755. Springer, 2014.
- [39] Ze Liu, Yutong Lin, Yue Cao, Han Hu, Yixuan Wei, Zheng Zhang, Stephen Lin, and Baining Guo. Swin transformer: Hierarchical vision transformer using shifted windows. In Proceedings of the IEEE/CVF International Conference on Computer Vision, pages 10012–10022, 2021.
- [40] Ilya Loshchilov and Frank Hutter. Decoupled weight decay regularization. arXiv preprint arXiv:1711.05101, 2017.
- [41] Christopher Michael Masciocchi, Stefan Mihalas, Derrick Parkhurst, and Ernst Niebur. Everyone knows what is interesting: Salient locations which should be fixated. Journal of vision, 9(11):25–25, 2009.
- [42] Saul B Needleman and Christian D Wunsch. A general method applicable to the search for similarities in the amino acid sequence of two proteins. Journal of molecular biology, 48(3):443–453, 1970.
- [43] Klaus Oberauer. Working memory and attention—a conceptual analysis and review. Journal of cognition, 2019.
- [44] Christian NL Olivers and Pieter R Roelfsema. Attention for action in visual working memory. Cortex, 131:179–194, 2020.
- [45] Sohee Park, Arani Bhattacharya, Zhibo Yang, Samir R Das, and Dimitris Samaras. Mosaic: Advancing user quality of experience in 360-degree video streaming with machine learning. IEEE Transactions on Network and Service Management, 18(1):1000–1015, 2021.
- [46] Sohee Park, Arani Bhattacharya, Zhibo Yang, Mallesham Dasari, Samir R Das, and Dimitris Samaras. Advancing user quality of experience in 360-degree video streaming. In 2019 IFIP Networking Conference (IFIP Networking), pages 1–9. IEEE, 2019.
- [47] Shima Rashidi, Krista Ehinger, Andrew Turpin, and Lars Kulik. Optimal visual search based on a model of target detectability in natural images. Advances in Neural Information Processing Systems, 33, 2020.
- [48] Wanjie Sun, Zhenzhong Chen, and Feng Wu. Visual scanpath prediction using ior-roi recurrent mixture density network. IEEE transactions on pattern analysis and machine intelligence, 43(6):2101–2118, 2019.
- [49] Ashish Vaswani, Noam Shazeer, Niki Parmar, Jakob Uszkoreit, Llion Jones, Aidan N Gomez, Lukasz Kaiser, and Illia Polosukhin. Attention is all you need. Advances in neural information processing systems, 30, 2017.
- [50] Dirk Walther and Christof Koch. Modeling attention to salient proto-objects. Neural networks, 19(9):1395–1407, 2006.
- [51] Zhiguo Wang and Raymond M Klein. Searching for inhibition of return in visual search: A review. Vision research, 50(2):220–228, 2010.
- [52] JM Wolfe. Visual search. pashler, h.(ed.), attention, 1998.
- [53] Juan Xu, Ming Jiang, Shuo Wang, Mohan S Kankanhalli, and Qi Zhao. Predicting human gaze beyond pixels. Journal of vision, 14(1):28–28, 2014.
- [54] Zhibo Yang, Lihan Huang, Yupei Chen, Zijun Wei, Seoyoung Ahn, Gregory Zelinsky, Dimitris Samaras, and Minh Hoai. Predicting goal-directed human attention using inverse reinforcement learning. In Proceedings of the IEEE/CVF conference on computer vision and pattern recognition, pages 193–202, 2020.
- [55] Zhibo Yang, Sounak Mondal, Seoyoung Ahn, Gregory Zelinsky, Minh Hoai, and Dimitris Samaras. Target-absent human attention. In European Conference on Computer Vision, pages 52–68. Springer, 2022.
- [56] AL Yarbus. Eye movements and vision plenum. New York, 1967.
- [57] Gregory Zelinsky, Zhibo Yang, Lihan Huang, Yupei Chen, Seoyoung Ahn, Zijun Wei, Hossein Adeli, Dimitris Samaras, and Minh Hoai. Benchmarking gaze prediction for categorical visual search. In Proceedings of the IEEE/CVF Conference on Computer Vision and Pattern Recognition Workshops, pages 0–0, 2019.
- [58] Gregory J Zelinsky. A theory of eye movements during target acquisition. Psychological review, 115(4):787, 2008.
- [59] Gregory J Zelinsky, Yupei Chen, Seoyoung Ahn, Hossein Adeli, Zhibo Yang, Lihan Huang, Dimitrios Samaras, and Minh Hoai. Predicting goal-directed attention control using inverse-reinforcement learning. Neurons, behavior, data analysis and theory, 2021, 2021.
- [60] Mengmi Zhang, Jiashi Feng, Keng Teck Ma, Joo Hwee Lim, Qi Zhao, and Gabriel Kreiman. Finding any waldo with zero-shot invariant and efficient visual search. Nature communications, 9(1):1–15, 2018.
- [61] Xizhou Zhu, Weijie Su, Lewei Lu, Bin Li, Xiaogang Wang, and Jifeng Dai. Deformable detr: Deformable transformers for end-to-end object detection. arXiv preprint arXiv:2010.04159, 2020.
Appendix A Appendix
Appendix B Implementation details
Training details. Follow [55, 9, 54], we resize the images in all datasets (COCO-Search18, COCO-FreeView, OSIE and MIT1003) to a fixed resolution ( in this paper) for computational efficiency during training and inference. The ground-truth human fixations are remapped (linearly) onto the resized image. For COCO-Search18, COCO-FreeView and OSIE, we use their official data split for training and testing. For the MIT1003 dataset, we perform 5-fold cross validation on the 1003 images in MIT1003, i.e., training on 800 images (and the associated human scanpaths) and testing on the rest 203 images in each fold. We report the averaged results (over 5 folds) for the MIT1003 dataset. We use the AdamW [40] with the learning rate of and train HAT for 30 epochs with a batch size of 128. No data augmentation is used during training. Note that the pixel encoder and pixel decoder are kept fixed during training and we use the COCO-pretrained weights for panoptic segmentation from [12]. In summary, the following parameters in HAT are trained end-to-end using the loss defined in Eq. (3) of the main paper: the Transformer encoder in the foveation module; all task-specific queries and the Transformer decoder in the aggression module; and the linear layer (W, b) and MLP in the fixation prediction module. Following [54], we set the maximum length of each predicted scanpath to 6 and 10 (excluding the initial fixation) for target-present and target-absent search scanpath prediction (COCO-Search18), respectively. For free-viewing datasets (COCO-FreeView, OSIE and MIT1003), the maximum scanpath length is set to 20.
Implementation of cIG. cIG denotes the amount of information gain from the predicted fixation map (the model is provided with all previous fixations) over a baseline in predicting the ground-truth fixation. Here, the baseline is a fixation density map constructed by averaging the smoothed density (with a Gaussian kernel of one degree of visual angle) maps of all training fixations. For target-present and target-absent visual search settings, we use a (target) category-wise fixation density map, following [55]. For the heuristic models (i.e., target detector and saliency heuristic) which apply the winner-take-all strategy on a static fixation map to generate the scanpath prediction, we use the same static fixation map for all fixations in a scanpath to compute cIG, cNSS and cAUC. To obtain the predicted fixation maps for Chen et al.’s model [9], we use the ground-truth fixation map (Gaussian smoothed with a kernel size of 2) as input to obtain the predicted action map for the next fixation (i.e., the predicted fixation map). Note that all predicted fixation maps in computing cIG, cNSS and cAUC, are resized to for fair comparison.
Inference speed. On a single RTX A6000 GPU, it takes about 1 second and 18GB GPU memory for HAT to process a batch of 128 images at each fixation step (i.e., 0.008 secs for each image). The total time for generating a scanpath depends on the scanpath length. For instance, on average HAT takes 0.048 secs to generate 128 target-absent scanpaths whose average length is about 6 fixations.
Appendix C More Ablation Studies with HAT
By default, HAT uses ResNet-50 [21] as the pixel encoder and MSD [61] as the pixel decoder. However, HAT is also compatible with other architectures. Hence, in Tab. 5, we evaluate HAT with different pixel encoders and decoders. Three pixel encoders: ResNet-50 (R50), ResNet-101 (R101) [21] and Swin Transformer (we use the base model, Swin-B) [39]), and two pixel decoders: FPN [36] and MSD [61], are evaluated. One can observe that MSD is slightly better than FPN as the pixel decoder and HAT performs the best when using R50 as the pixel encoder. Notice that the difference between different configurations is small, suggesting that the performance of HAT is robust to the choice of different pixel encoder and decoder architectures. More importantly, all of these configurations of HAT significantly outperforms all baselines in the main text (see Table 1 of the main text).
In Tab. 6, we ablate the Transformer decoder in the aggregation module of HAT by using different numbers of Transformer decoder layers: . By default, HAT uses 6 layers of Transformer decoder, i.e., . By varying , we observe no significant performance change in HAT with being slightly better than other configurations in SS and cIG. This indicates that HAT’s superior performance does not depend on the choice of hyper-parameter .
Appendix D Experiments on OSIE and MIT1003
To further validate the effectiveness of our proposed HAT in free-viewing scanpath prediction, we compare HAT to the previous state-of-the-art method in free-viewing scanpath prediction, Chen et al. [9] (see Tab. 2 of the main text), using the OSIE dataset [53] and the MIT1003 dataset [27]. Here we only report SS, cIG, cNSS and cAUC and do not use SemSS because OSIE and MIT1003 do not contain pixel-wise segmentation annotation which is required in SemSS. Tab. 7 and Tab. 8 consistently show that HAT surpasses Chen et al. [9] in all three metrics by a large margin especially in cIG and cNSS on both free-viewing datasets. The results are consistent with our findings in Table 2 of the main text—HAT accurately predicts the scanpaths (reflected by SS), with well-calibrated confidence (as evidenced by the high cIG and cNSS).
| Pixel enc. | Pixel dec. | SemSS | SS | cIG | cNSS |
| R50 | MSD | 0.412 | 0.388 | 1.314 | 2.528 |
| R50 | FPN | 0.404 | 0.376 | 1.283 | 2.465 |
| R101 | MSD | 0.404 | 0.383 | 1.238 | 2.467 |
| Swin-B | MSD | 0.406 | 0.382 | 1.289 | 2.508 |
| SemSS | SS | cIG | cNSS | |
| 1 | 0.413 | 0.386 | 1.277 | 2.536 |
| 3 | 0.412 | 0.384 | 1.301 | 2.557 |
| 6 | 0.412 | 0.388 | 1.314 | 2.528 |
| 9 | 0.411 | 0.384 | 1.304 | 2.528 |
| SS | cIG | cNSS | cAUC | |
| Human consistency | 0.380 | - | - | |
| Chen et al. [9] | 0.326 | -1.526 | 2.288 | 0.920 |
| HAT | 0.333 | 1.519 | 2.780 | 0.942 |
| SS | cIG | cNSS | cAUC | |
| Human consistency | 0.363 | - | - | - |
| Chen et al. [9] | 0.260 | 0.042 | 1.408 | 0.927 |
| HAT | 0.324 | 0.762 | 2.116 | 0.941 |
Appendix E Additional Qualitative Analysis
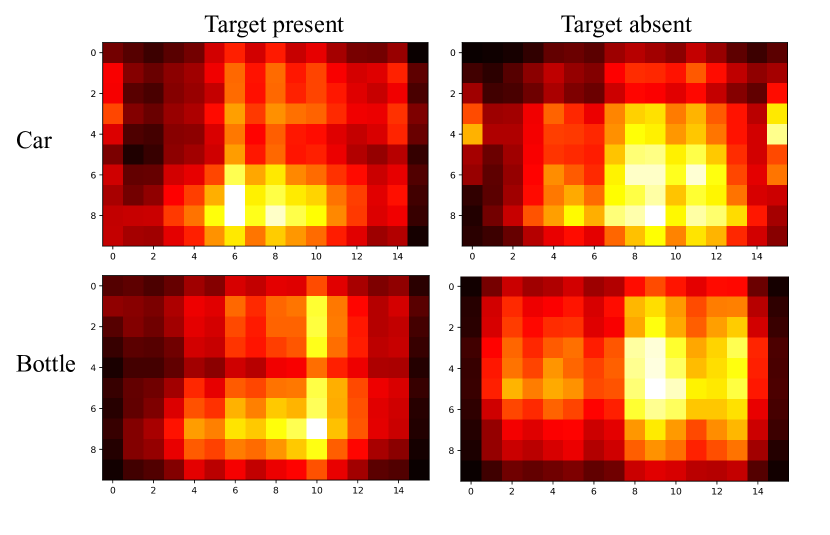
Peripheral contribution map. In Section 4.3 of the main text, we showed that there exists a strong center bias signal in the peripheral tokens of free-viewing (FV) fixations, whereas the center bias is less obvious in the peripheral tokens of target-absent (TA) and target-present (TP) fixations. A natural question arising from this observation is whether the peripheral tokens of TA and TP fixations encode a target prior–spatial distribution of the possible target location. To answer this question, we first visualize the category-wise peripheral contribution maps for TP and TA fixations by averaging the attention weights (on the peripheral tokens) of the last cross-attention layer over all testing fixations for each target category. As shown in Fig. 6, the category-specific peripheral contribution map does not provide a clear evidence of TA and TP peripheral contribution map being a target prior, but we find some target-specific pattern, e.g., the contribution is pronounced around the bottom horizontal area for “car” and around the vertical area for “bottle”, which may represent the spatial prior of each category.
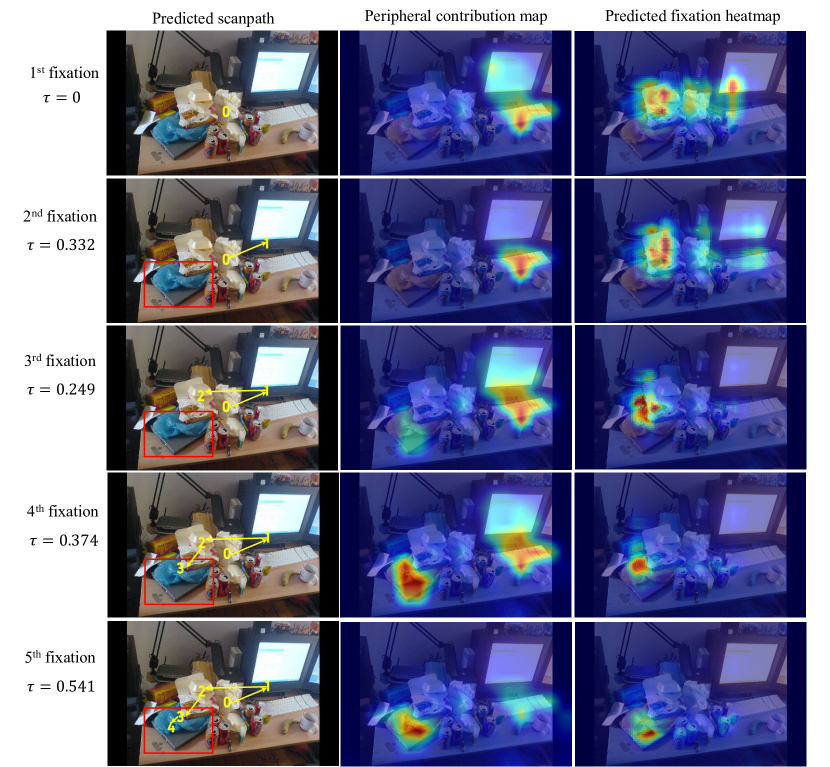
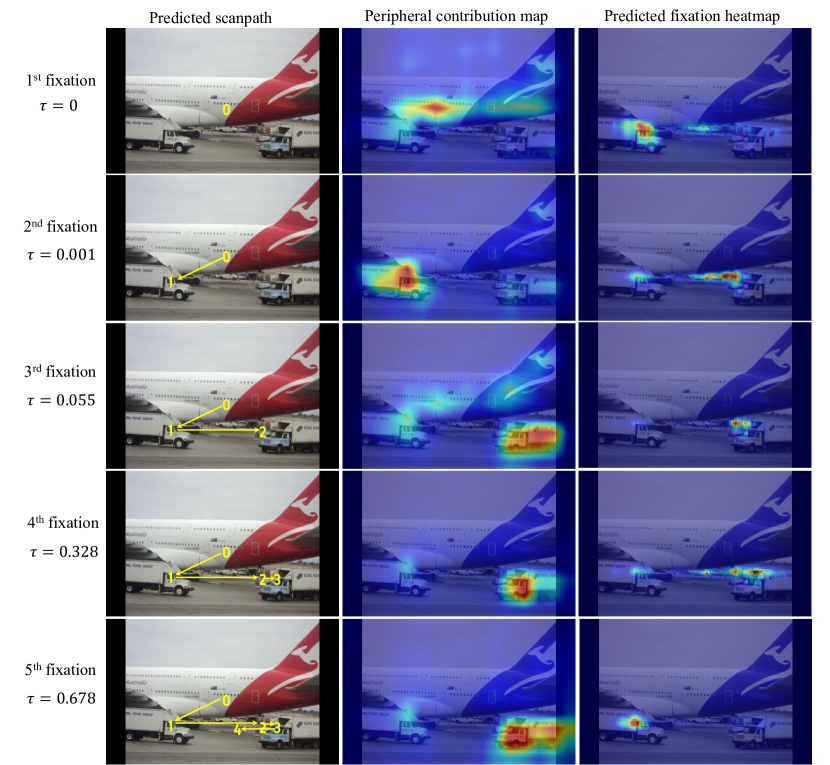
We further analyze how the peripheral contribution map evolves across a sequence of fixations. Fig. 7 shows the peripheral contribution maps when searching for a laptop (middle column) with the corresponding predicted scanpath (left column) and fixation heatmaps (right column). Each row represents each fixation step. We observe that the encoded periphery features not only align with the location of the next fixation (e.g., when the occluded laptop is encoded in the left-bottom periphery, the model makes a fixation to the target and terminates the search), but also provides the contextual cues where a target might be located (e.g., near the keyboard and the monitor where a laptop is usually found). We also observe a similar pattern in the TA setting, where the peripheral contributions are higher for target-like objects (e.g., truck in car search, Fig. 8) and for contextual cues (table and keyboard for laptop search, Fig. 9)
Scanpath visualization. We further visualize additional scanpaths for human (ground truth), our HAT, FFMs [55], Chen et al. [9], IRL [54], and a heuristic method (target detector for visual search and saliency heuristic for free viewing) in the TP, TA, and FV settings. Fig. 10 shows the TP scanpaths. In all examples, HAT shows superior performance in predicting the human fixation trajectory not only when humans correctly fixate on the target, but also when their attention is distracted by other visually similar objects. For example, in the last column of Fig. 10 when the task is to find a knife, HAT is the only model that correctly predicts the fixation on the metallic object (because knives are usually metallic), whereas other methods either missed the target or did not show any distractions to the metallic object. This shows the capacity of HAT in modeling human attention control in visual search. Fig. 11 shows that HAT learns to leverage the context cues in predicting target-absent fixations, e.g., when the search target is microwave, HAT correctly predicted the fixations on the counter-top and table, where microwaves are often found. Similarly, HAT also generates the most human-like scanpaths in free-viewing task (see Fig. 12), capturing all important aspects of scanpaths, such as the locations (where), the semantics (what), and the order (when) of the fixations.
Appendix F Further discussion on applications
Models that predict top-down attention (TP/TA search fixations), modulated by an external goal, have wide applicability to attention-centric HCI. For example, faster attention-based rendering that leverages the prediction of a user’s attention as they play a VR/AR game and home robots incorporating search-fixation-prediction models will be better at inferring a user’s need (i.e., their search target). Home robots incorporating search-fixation-prediction models will be better able to infer a users’ need (i.e., their search target) and autonomous driving systems can attend to image input like an undistracted driving expert. Applications of FV attention prediction exist in foveated rendering [28] and online video streaming [45].