MIGHTEE-H i: Possible interactions with the galaxy NGC 895
Abstract
The transformation and evolution of a galaxy is strongly influenced by interactions with its environment. Neutral hydrogen (H i) is an excellent way to trace these interactions. Here, we present H i observations of the spiral galaxy NGC 895, which was previously thought to be isolated. High-sensitivity H i observations from the MeerKAT large survey project MIGHTEE reveal possible interaction features, such as extended spiral arms, and the two newly discovered H i companions, that drive us to change the narrative that it is an isolated galaxy. We combine these observations with deep optical images from the Hyper Suprime Camera to show an absence of tidal debris between NGC 895 and its companions. We do find an excess of light in the outer parts of the companion galaxy MGTHJ022138.1-052631 which could be an indication of external perturbation and thus possible sign of interactions. Our analysis shows that NGC 895 is an actively star-forming galaxy with a SFR of , a value typical for high stellar mass galaxies on the star forming main sequence. It is reasonable to state that different mechanisms may have contributed to the observed features in NGC 895 and this emphasizes the need to revisit the target with more detailed observations. Our work shows the high potential and synergy of using state-of-the-art data in both H i and optical to reveal a more complete picture of galaxy environments.
keywords:
galaxies: individual: NGC 895-galaxies: interactions-galaxies: evolution-galaxies1 Introduction
Numerous observations have shown that galaxy properties such as morphology, size, star formation and kinematics are strongly influenced by their connections to the surrounding environment (Dressler, 1980; Peng et al., 2010; Zheng et al., 2017). Most galaxies in the nearby universe are either interacting with or gravitationally bound to nearby companions (e.g, Okamoto & Habe 1999; Zheng et al. 2017; Blanton & Moustakas 2009). Such interactions are directly responsible for an abrupt change in galaxy properties. According to the prevailing theoretical model for structure formation, galaxies are surrounded by a halo of dwarf galaxies and these galaxies form and evolve hierarchically through a succession of mergers (White & Rees, 1978). For example, the most massive local group satellite, the Large Magellanic Cloud (LMC), is one of many dwarf galaxies that surround the Milky Way galaxy (Willman, 2010; Koposov et al., 2015). While interaction between massive galaxies can cause powerful star formation events (Heckman et al., 1990), interactions between dwarf companions and massive galaxies can also be dramatic (e.g., the Magellanic Stream being pulled from the SMC/LMC system by interactions with the Milky Way; Putman et al. 1998).
Close encounters of galaxies can show significant signatures of gravitational interaction in the form of a distortion in their structure, the presence of tails and bridges, or a common diffuse envelope (Barnes & Hernquist, 1992; Nidever et al., 2013). All these features have been quantitatively explained based on numerous N-body simulations, starting with those of Toomre & Toomre (1972). The -CDM cosmology assumes that apart from dark haloes with normal (luminous) galaxies in their centres, completely dark clumps (sub-haloes) should also exist with masses 108 - 1011 M⊙ (Yang et al., 2005). If completely dark galaxies exist (e.g., Wong et al., 2021), then the evidence of interactions may also occur in the case of galaxies that appear isolated (but see Román et al., 2021). Apart from interaction with a dark galaxy, irregularities of isolated galaxies may be due to an earlier merger with a now consumed companion (Karachentsev et al., 2006), or a brief, fly-by interaction with a companion currently far away (Sinha & Holley-Bockelmann, 2012). There could additionally be large gas accretion from cosmic filaments (Kereš et al., 2005) and asymmetric accretion that could also lead to perturbed morphologies.
One way to identify interacting/merging galaxies is through the characterization of their optical morphological properties. Late-stage mergers are thus identified as having highly disturbed morphologies (Cibinel et al., 2019), while early-stage merging galaxies are often characterized by the presence of tidal features. Close pairs of galaxies (merger candidates) on the other hand mark the beginning stages of the merger process. The states of non-equilibrium induced by merger activity in both the stellar and dark matter components of a galaxy translate into asymmetries in the galaxy stellar light distribution (Reichard et al., 2009), and it is these asymmetries that have become useful tracers of merger activity in the optical regime.
Neutral hydrogen gas (H i), however, remains one of the best tracers for galaxy interactions because the H i envelope of a galaxy is generally more extended than its optical disk (Hoffman et al., 1996; Michel-Dansac et al., 2010; Koribalski et al., 2018), and is more easily disrupted by tidal forces from neighbouring galaxies. Galaxy pairs often show complex extended H i distributions, including tails and bridges (Koribalski et al., 2004), even if the corresponding optical images show few disturbances. Observations of the H i distribution and kinematics of large numbers of spiral galaxies now provide abundantly detailed information on the nature of interactions/mergers in both the H i disc kinematics and the H i distribution, which influences the shape of the global profile (Swaters et al., 1999; Sorgho et al., 2020). Espada et al. (2012) quantified the range H i profile asymmetries in a sample of some of the most isolated galaxies in the local Universe (AMIGA, Verdes-Montenegro et al. 2005), and found that it shows the lowest level of HI-asymmetry of any galaxy sample. Galaxies with asymmetric global profiles often have rotation curves that rise more slowly on one side of the galaxy than on the other (Sancisi et al., 2008; Swaters et al., 1999; Deg et al., 2020). Correspondingly, iso-velocity contours of the velocity field show a steeper gradient. All this may indicate past or present interaction activity.
High-sensitivity H i observations have typically been conducted in the past with single-dish telescopes (e.g, Barnes et al. 2001; Giovanelli et al. 2005; Bouchard et al. 2006) which are ideal for probing low surface brightness H i emission, as these instruments do not filter out emission on any scales (Pisano, 2014). However, single dishes have coarse spatial resolution that is often unable to resolve the H i in nearby galaxies, especially companion dwarf galaxies which tend to be fainter and smaller. The Square Kilometre Array (SKA) pathfinder and precursor telescopes such as MeerKAT (Camilo et al., 2018) have been built with a unique combination of high sensitivity, high angular resolution and wide field of view which allows us to survey the sky at unprecedented speeds and improved sensitivity.
The MeerKAT International GHz Tiered Extragalactic Exploration (MIGHTEE; Jarvis et al., 2016) Survey is a medium-deep, medium-wide blind survey carried out with MeerKAT. The Early Science MIGHTEE observations provide H i line cubes with relatively high sensitivity to diffuse and faint emission. MIGHTEE H i observations can thus help to understand the behaviour of H i gas-rich galaxies and their surrounding environments (e.g. Ranchod et al. 2021). In this paper, we are particularly interested in one of the galaxies contained within the survey volume, NGC 895. It is an exciting system to study since this nearby galaxy, classified as a SA(s)cd (de Vaucouleurs et al., 1991) has been classified as isolated (Tully, 1988), but in fact, it exhibits strong signs of interaction in H i such as extended tidal arms and a warp. Pisano et al. (2002), using Very Large Array (VLA) data, report an H i mass of 1.3 1010 M⊙ and reveal a severely warped inclined galaxy, although no obvious companion was observed. The star formation properties of NGC 895 were derived by Maddox et al. (2021) using multi-wavelength optical and near-infrared imaging to perform photometry. Using the HSC G-band, GFHT u-band, HSC riZY, and near-infrared JHKs bands, they fit the photometry using spectral energy distribution (SED) fitting to derive a stellar mass of 7.86 109 M⊙, a star formation rate of 7.3 10-10 M⊙/yr and an age of 2.5 Gyr. Note that the values quoted by Maddox et al. (2021) were all computed in bulk, i.e. objects were not treated individually. Some basic information on NGC 895 can be found in Table 1.
In this paper, we use high sensitivity, high spatial resolution MeerKAT observations as part of the MIGHTEE-H i early science, complemented by Subaru deep optical images to explore the environment surrounding NGC 895. We aim to search for potential companions and determine their effects on the properties of NGC 895. In section 2 we discuss the observations and data reduction techniques of our H i observations and also present the auxiliary optical data. In section 3.1 we present the H i distribution. Section 3.2 provides the analysis of the H i kinematics of NGC 895, and Section 3.3 presents the star formation properties of NGC 895. In Section 4 we provide the optical analysis of two newly detected H i companions, while Section 5 provides a detailed discussion of the possible causes of the observed properties in NGC 895. Lastly, the conclusions are given in Section 6.
Throughout this paper, we assume CDM cosmology parameters of = 0.315, = 0.685, = 67.4 km s-1Mpc-1 and AB magnitudes are used throughout unless otherwise stated. The distances used in this paper are cosmological luminosity distances, calculated using H i redshifts and assuming the cosmological values stated above.
| Parameter | NGC 895 |
|---|---|
| Morphology | SA(s)cd(a) |
| Right ascension (J2000) | 02:21:36.5 |
| Declination (J2000) | -05:31:17.0 |
| Distance (Mpc) | 34.3 1.1 |
| V (km.s-1) | 2286.0 22 |
| PAopt(∘) | 110.0 |
| Inclinationopt(∘) | 39.0 |
| Redshift | 0.007658 0.00006 |
| Total H i mass (M⊙) | 1.3 (b) |
| Stellar mass (M⊙) | (2.28 0.16) (c) |
| SFR (M⊙/yr) | 1.75 0.07 (c) |
| Age (Gyr) | 2.50 |
| Notes. Ref (a) de Vaucouleurs et al. (1991); (b) Pisano et al. (2002); (c) this work. All other values are derived from the MIGHTEE-H i data using the method described in Maddox et al. (2021). | |
2 Observations
2.1 The MIGHTEE Survey – Observations and Data Reduction
MIGHTEE targets four well-known deep extragalactic fields. The data are collected in full spectral line and polarization modes. The H i emission project within the MIGHTEE survey is referred to as MIGHTEE-H i, described in detail in Maddox et al. (2021). This work uses the MIGHTEE-H i Early Science observations, which were conducted between mid-2018 and mid-2019. These observations were performed with the full array (64 dishes, minimum 58 dishes) in the L-band, which has a frequency range from 900 to 1670 MHz. We used the MeerKAT 4k correlator mode, which has 4096 channels, and a channel width of 209 kHz, corresponding to 44 km s-1at z = 0.
The data reduction was performed with the Process-MeerKAT calibration and imaging pipeline (Frank et al. in prep.). The pipeline is casa - based (McMullin et al., 2007) and does spectral line calibration following the standard data reduction and calibration tasks such as flagging, delay, bandpass and complex gain calibration. Spectral-line imaging was performed using casa TCLEAN with the Briggs (ROBUST = 0.5) weighting scheme. The continuum subtraction was done in the visibilities using standard casa routines UVSUB and UVCONTSUB. Once the cubes were produced, per-pixel median filtering was applied to the resulting data cubes to reduce the impact of the direction-dependent artefacts. The restored synthesized beam for the H i cube has a size of with a position angle of -2.6 deg. The H i cube has a rms noise per 44 km s-1channel of 85 Jy beam-1, which translates to a 3 column density sensitivity of N = .
Moments maps were constructed using the spectral-cube software111https://spectral-cube.readthedocs.io/en/latest/ and the standard procedure as described in Ponomareva et al. (2021). We created a cubelet from the MIGHTEE H i field centred on NGC 895. The cubelet was then smoothed to a circular beam of 20′′ and clipped at the 3 level. The resulting mask was then applied to the original resolution cubelet to account for the low column density extended H i emission. Lastly, the remaining noise pixels were masked out by hand.
| Number of antennas | 58 to 64 |
|---|---|
| Total integration | 13 h on source |
| FWHM of primary beam | 1 ∘ |
| Channel width | 209 kHz |
| Number of channels | 4096 |
| Robust = 0.5 weighting function | |
| FWHM of synthesized beam | (2.0 kpc 1.5 kpc) |
| RMS noise per channel | 85 Jy |
| H i column density limit | |
| (3 over 1 channel, ) | cm-2 |
| (3 over 1 channel, ) | cm-2 |
2.2 Optical data
We use the deepest optical dataset that overlaps with MeerKAT images in this region of the sky, from the Hyper Suprime-Cam Subaru Strategic Program Survey (HSC-SSP) Aihara et al. (2018). This survey makes use of the Subaru 8.2 m telescope providing images with sub-arcsec resolution in the broad bands g, r, i, z and y. We downloaded mosaics for each of the bands, including a wide enough field around NGC 895 using the hscmap browser hosted on the survey web page: https://hsc-release.mtk.nao.ac.jp/doc/. We used the second data release of the survey (Aihara et al., 2019). We calculated the limiting surface brightness of these mosaics following the technique applied by Román et al. (2020), their appendix A. The 3 values in boxes are 30.2, 29.6, 29.4, 28.7 and 27.7 mag arcsec-2 in g, r, i, z and y, respectively. The 5 point source detection limits are g = 26.8, r = 26.4, i = 26.2, z = 25.4, y = 24.7 mag according to the survey.
Additionally, we use data from the Dark Energy Camera Legacy Survey (DECaLS; Dey et al., 2019). This is a multi-purpose deep optical survey that makes use of the DECAM imager on the 4 m Blanco Telescope in the three optical bands g, r and z with a seeing of the order of 1′′. The depths measured in the region of NGC 895 are 29.3, 29.0 and 27.8 for the g, r and z bands at 3; boxes. The 5 point source detection limits are g = 24.7, r = 23.6 and z = 22.8 mag according to the survey. Although the DECaLS data is less deep than the previously mentioned HSC-SSP data, the DECaLS data has a processing step in which the stars are subtracted by modelling the PSF, alleviating problems with confusion and foreground Galactic stars, which is relevant for Section 4.
3 NGC 895 analysis
3.1 H i content and distribution
The H i moment-0 map of NGC 895 and companion galaxies is shown in thevtopvpanel of Fig. 1, and the H i column density map, overlaid on a deep HSC 3-colour image, is shown in the bottom panel. The sensitivity of our observations allows us to detect two H i companions located to the north and north-west of the main galaxy (see Fig. 1), which we identify as MGTHJ022138.1-052631 and MGTHJ022042.1-052115 (referred as J022138 and J022042 hereinafter). The two companions have spatially coincident optical emission, and are at projected distances of 46.5 and 173.7 kpc from NGC 895, respectively. The inner region of NGC 895 appears to have a normal morphology typical for spiral galaxies (Buta, 2013). The lowest H i contour corresponds to the 3.2 column density limit of . At this level, the galaxy has a diameter of 115 kpc at our adopted distance of 34.3 1.1 Mpc. This is 2.7 times the optical diameter of 43 kpc derived from the g-band color image. The H i gas distribution, as seen in Fig. 1 reveals an H i-poor central region.
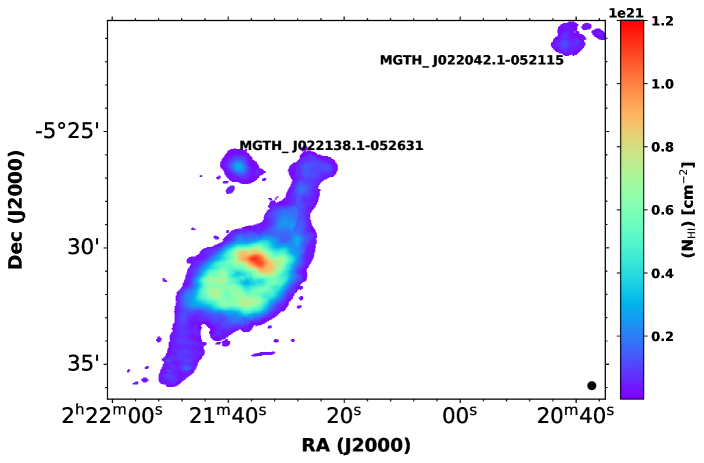
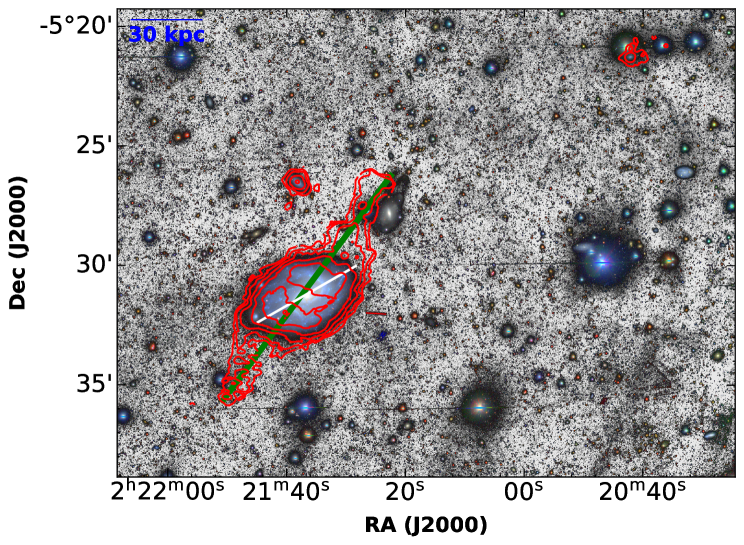
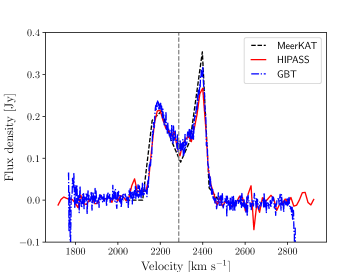
Figure 2 shows the global H i profile of NGC 895. It has been derived from the primary-beam corrected cubes. We compare the global profile of NGC 895 as obtained from MeerKAT, GBT and HIPASS observations. It is clear from Fig. 2 and Fig. 3 that NGC 895 is asymmetric, with more H i on the receding than on the approaching side. The H i line flux derived from the global profile of NGC 895 as measured from the MeerKAT data is 52.1 0.3 Jy. km s-1. This is in agreement with the GBT and HIPASS fluxes of 50.51 Jy. km s-1(Springob et al., 2005) and 49.4 Jy. km s-1(Koribalski et al., 2004), respectively. Using the H i mass standard formula,
| (1) |
where is the distance in Mpc, is the flux density in Jy, d is the velocity resolution in km s-1and is the redshift, the corresponding total H i mass is 1.4 0.01 1010 M⊙. This value is 8 higher than that of Pisano et al. (2002).
3.2 H i Kinematics
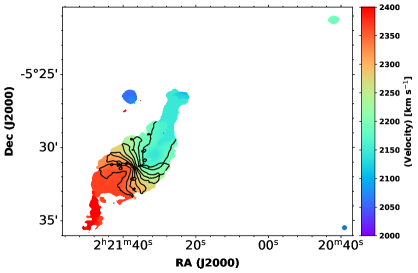
The velocity field map of NGC 895 is shown in Fig. 3. The map shows a different curvature of the iso-velocity contours on the approaching and receding side, which suggests the presence of kinematic asymmetry (Khademi et al., 2021). We use an extended version of the tilted-ring model by Rogstad et al. (1974) implemented in the TIlted RIng FIitting Code TiRiFiC (Józsa et al., 2007) to model the kinematics and the gas distribution in NGC 895. TiRiFiC uses a minimization technique to fit a tilted-ring model directly to a data cube instead of a velocity field. This makes TiRiFiC less prone to beam smearing effects and represents more accurately complex kinematical features, such as a warp, compared to the classic method of fitting to a velocity field. TiRiFiC models a rotating gas disc as a set of concentric annuli, each described by the user-supplied input parameters such as the central coordinates (XPOS, YPOS), the rotation curve (VROT), the position angle (PA), the inclination (INCL), the thickness of the disk (Z0), and potentially many more.
To make a reasonable initial guess for the TiRiFiC model parameters, we use the Fully Automated TiRiFiC (FAT) software Kamphuis et al. (2015), which is a GDL wrapper around TiRiFiC. We used the beta version of FAT, which allows for radial variation of the intrinsic velocity dispersion. FAT takes an H i data cube as input and automatically estimates the following free parameters; 1) surface brightness, 2) position angle, 3) inclination 4) rotational velocity, 5) systemic velocity, 6) scale height 7), intrinsic dispersion and 8) central coordinates. FAT fits each parameter ring by ring and finally smooths the parameters with a polynomial of order 0, 1, 2, 3, 4 or 5. FAT models the H i disc as two halves and fits rings across each half. The procedure employed by FAT for finding the initial estimates of the free parameters and the flow-chart for fitting is discussed in detail in Kamphuis et al. (2015). The results from FAT were then inputted to TiRiFiC, allowing us to adjust the initial estimates manually and, if necessary, add parameters not implemented by FAT.
Unlike TiRiFiC, FAT is fully automated and no parameter tweaks are required to optimize the results. The output from FAT is a very good starting point for TiRiFiC. TiRiFiC is only necessary if we want to fit non-axisymmetric features not captured by FAT, or if we want to fit the galaxies as one disk (i.e., not as a receding and approaching halves). The stopping criteria for TiRiFiC are reached by visual inspection of various plots of the model and the observed data cube (Position-velocity diagrams, residual velocity field, moment maps, and channel maps). Based on this, we judge whether certain model features are required to better reproduce the observations or not. The degeneracy between velocity and inclination, which is often seen for 2D fitting, is broken for TiRiFiC if the disk is symmetric and has a gradient in surface brightness. For the case of a very thick disk, the inclination, rotation velocity, and disk thickness are degenerate. For NGC 895, the disk thickness is not high enough to cause such a degeneracy.
To minimize the number of free parameters, we fit the galaxy as one disc instead of modelling the approaching and the receding halves separately, as done by FAT. However, to capture the asymmetric distribution in surface brightness, we introduce a first order azimuthal variation in amplitude (SM1A) and phase (SM1P). Both of these parameters were varied with radius. Errors were calculated using the bootstrap method described in (Ianjamasimanana et al., 2020; Józsa et al., 2021). The method consists of first getting model parameters using a Golden-Section nested intervals algorithm. The model parameter at a single node is then shifted by a random value to create a synthetic datum. After creating many such data and fitting each of them, the mean value and the standard deviation of the best-fitting parameters are taken as the final model parameters and the standard errors, respectively.
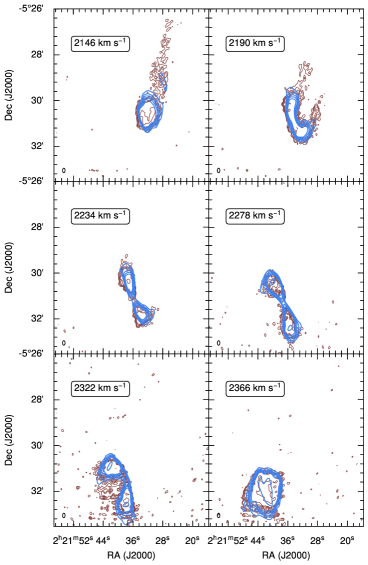
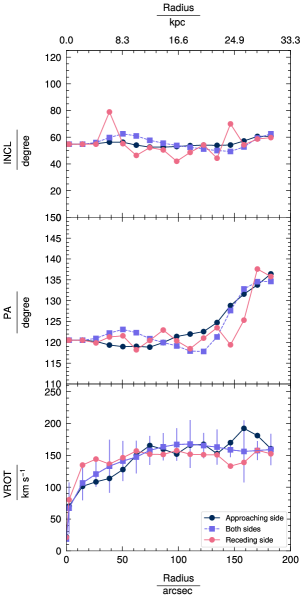
Figure 4 (left) compares the data (brown) and the model (blue) at different velocities. The main disc of the galaxy is well modelled and shows a good resemblance to the data. The presence of H i emission not captured by our model is also seen in Fig. 4 (left). These indicate asymmetric features (arms) most likely induced by an interaction. In Fig. 4 (left), there are extensions in the data (e.g. channel 2146 km s-1) clearly pointing North, in the direction of the companion J022138. This suggests the present gravitational interaction between those two objects. As we will see in the next section, this is also the companion showing an excess of light in the outer parts, another indication of possible interaction in the past. Fig. 4 (right) shows TiRiFiC results for the inclination, position angle and rotation velocity of NGC 895. At a radius of 16 kpc, we see a major shift in the position angle, which is interpreted as being due to a warp.
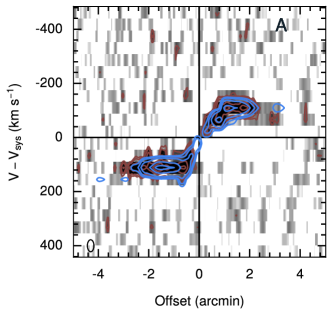
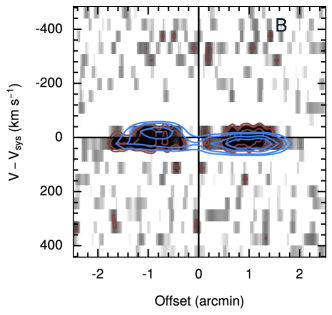
Figure 5 shows the position-velocity diagram of NGC 895 along the major axis and minor axis, with the data (brown) overlaid on the model (blue). We see that the model is consistent with the data. From the position-velocity diagram, we see no traces of extraplanar gas, which suggest that the arms we see in NGC 895 are asymmetric features induced by an interaction. The systemic velocity derived for NGC 895 is 2253 32 km s-1. This value is consistent with the value of 2286 20 km s-1derived from the H i global profile. The rotation curve is derived out to a radius of R = 184 ′′ (30.5 kpc), where the rotation velocity reaches a value of 159 24 km s-1.
 |
 |
3.3 Star formation & stellar mass estimates
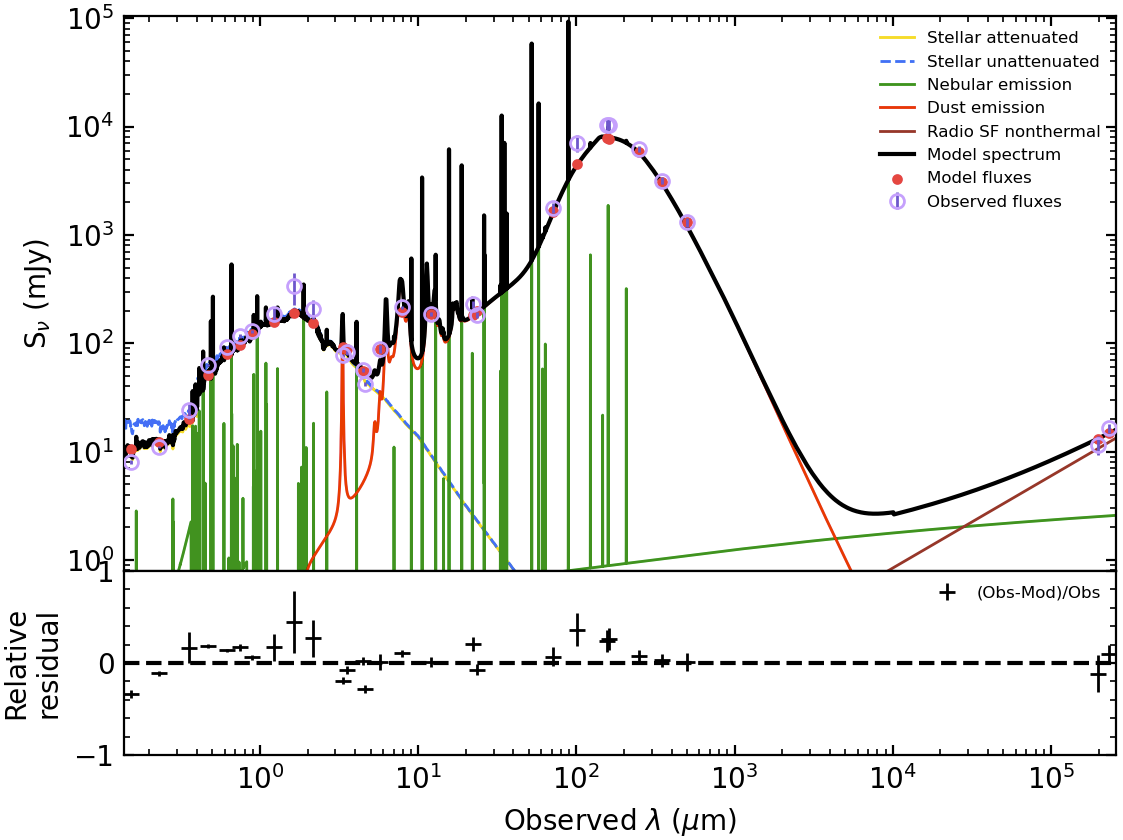
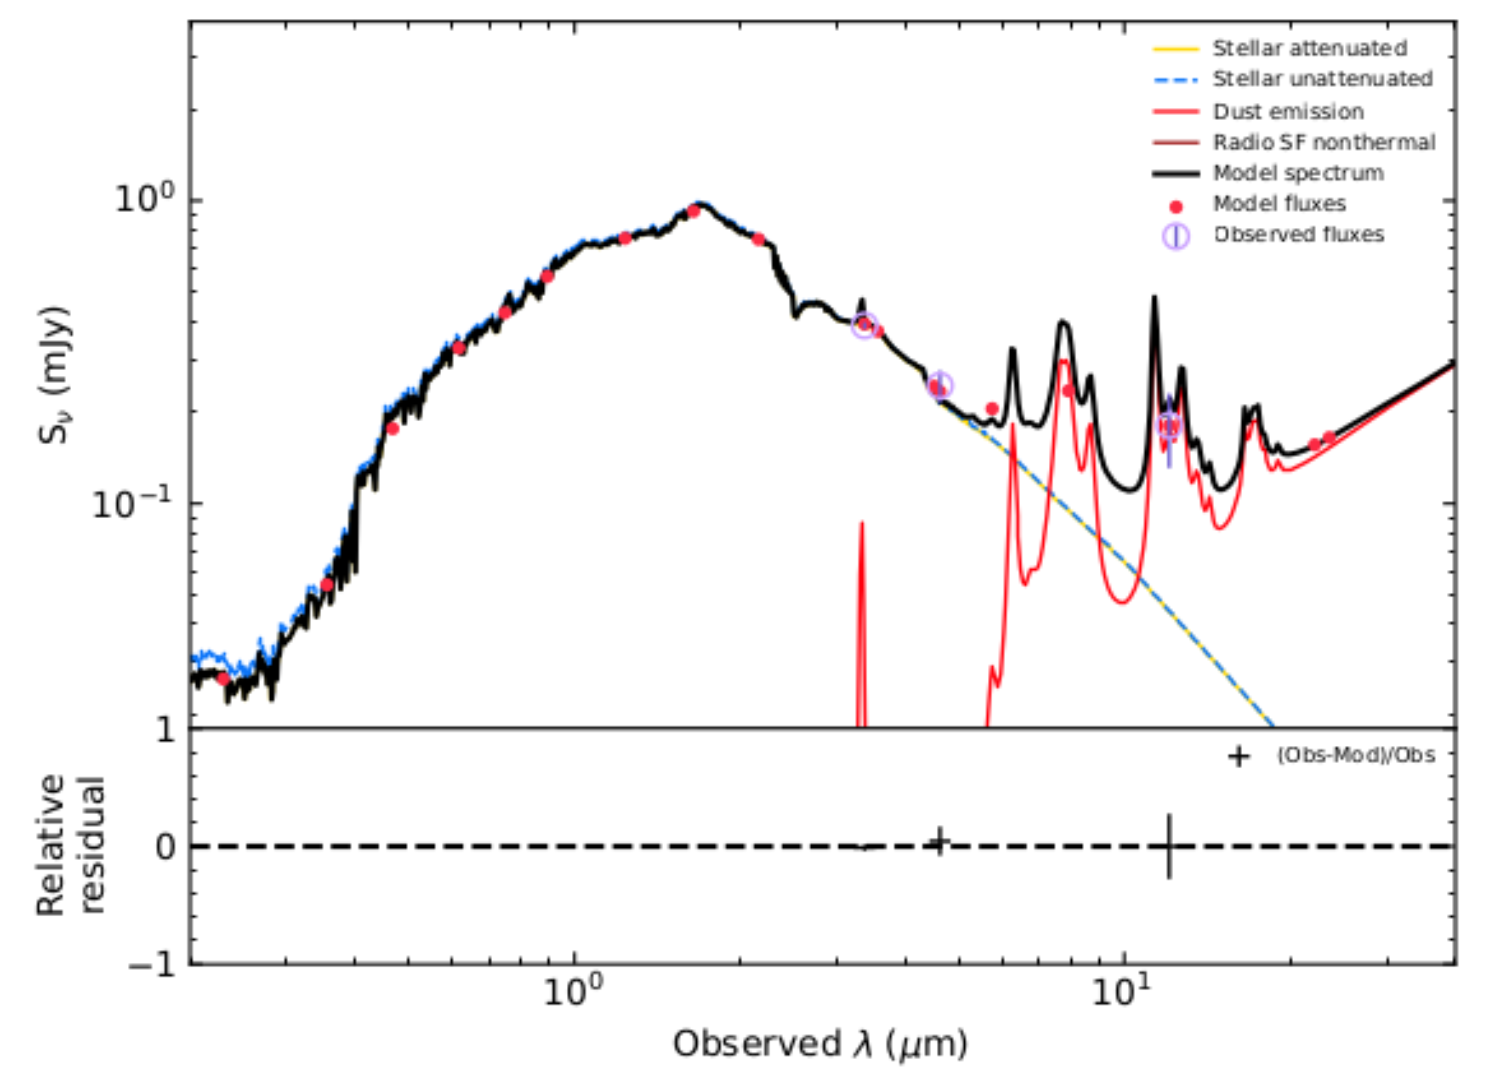
The star formation and stellar mass of NGC 895 were obtained by a multi-wavelength SED fitting analysis exploiting the spectral energy distribution (SED) fitting code CIGALE (v. 2022.1. Boquien et al. 2019, as applied to multi-wavelength photometry by Małek et al. 2018). In order to perform the fit, it is important to have access to the best multi-wavelength compilation of aperture-matched photometry. For this reason, we used the multi-wavelength matched photometry available from DustPedia (Bianchi et al., 2018) combined with our MeerKAT measurements and VLA radio continuum flux measurements. The best fit model is shown in Fig. 6. This was obtained by assuming the following models and parameters. We used a Chabrier initial mass function (IMF) with delayed star formation history and nebular emission (we also tried fitting the SED with an additional star formation burst, but our results did not change, so an additional burst is not needed to explain the results); we used the standard attenuation law presented in Charlot & Fall (2000) with the interstellar medium (ISM) and birth cloud slope of the attenuation equal to -0.7. We used the modified dust template by Draine & Li (2007). CIGALE allows performing the fit by exploiting different SED templates and emission models, e.g. AGN torus emission. We performed a run with the AGN module, but the estimated AGN fraction, defined as a ratio of the AGN luminosity to the sum of the AGN and dust luminosities, was lower than 0.3 (0.240.42). The probability distribution function characterized by a single peak around the AGN fraction equal to 0. It means that even with an extensive range of possibilities for the AGN module, CIGALE did not find even one solution with a significant AGN contribution larger than 0.5. In the broadband spectral energy distribution fitting, the AGN fraction lower than 15 is usually too uncertain to be considered a real AGN contribution. Moreover, the goodness of the fit, calculated as a pseudo reduced , is slightly larger when the AGN module is forced to be used, even with such a small percentage (the reduced increases from 1.7 without the AGN module, to 1.8 with AGN module, and AGN fraction lower than 0.2). Additionally, the stellar masses calculated with and without AGN module agree up to the second decimal (M 0.16 M⊙, and M 0.16 M⊙ for a run without and with the AGN module, respectively). We found no changes in the estimation of the star formation rate of 1.75 0.09 M⊙/yr. Our finding suggests that this galaxy does not host an AGN, and all the emission is due to star formation activity (Condon et al., 1998).
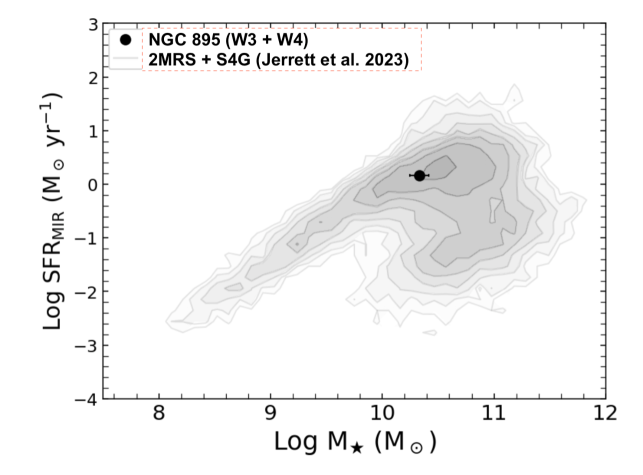
A similar value for the SFR, of M⊙/yr (Jarrett et al., 2023), was determined using the new scaling relations between WISE mid-infrared galaxy photometry and well determined stellar masses from SED modeling optical-infrared photometry provided by the Galaxy And Mass Assembly (GAMA) Survey222http://www.gama-survey.org/ data release 4 (DR4 Catalogue of the GAMA-KiDS-VIKING survey of the southern G23 field (Driver et al., 2022)). Fig. 7 shows the relationship between the star formation rate and the stellar mass for galaxies obtained by Jarrett et al. (2023). The grey line shows the galaxy sample from the 2MASS redshift survey (2MRS, Huchra et al. 2012) and the Spitzer Survey of Stellar Structure in Galaxies (S4G, Meidt et al. 2014). The black circle indicates the location of NGC 895 with respect to the main sequence. NGC 895 lies in the middle of the main sequence with no excess star fomation.
4 Analysis of the H i -detected satellites
4.1 H i properties
The H i morphology of the two galaxies is irregular. Using the faintest H i contour (see Fig. 1), we estimate H i diameters of 12.3 0.9 kpc for J022138 and 8.9 0.9 kpc for J022042 (the error being defined by the beam size). The profile widths at 50 levels are 52.9 22.0 km s-1and 48 22.0 km s-1for J022138 and J022042, respectively. We derive H i masses of 5.4 0.3 107 M⊙ and 8.2 0.1 107 M⊙ for J022138 and J022042. The H i properties of the companion galaxies are provided in Table 3.
Given the coarse velocity resolution of our data, the size of the companion galaxies, with only two H i beams across, does not allow us to derive H i rotation velocities using kinematic analysis, hence we estimate the maximum rotation velocities using , where is the width of the H i spectrum at the level of 50 of the peak value and is the inclination. The inclination angles were defined as cos)/(), where d and D are the minor and major axis measured to the outer contour of the H i moment 0 map and and are the sizes of the synthesized beam in the direction of the major and minor axis of the H i disk. and are used to take into account the beam-smearing effect due to our low spatial resolution data. Using the H i parameters in Table 3, we derive the rotation velocities of 38 22 km s-1and 43 22 km s-1for J022138 and J022042, respectively. The dynamical masses are estimated using
| (2) |
where V is the rotation velocity. This gives us dynamical masses of 2.0 0.2 109 M⊙ for J022138, and 1.6 0.1 109 M⊙ for J022042.
4.2 Optical properties
We analyse the deep optical images of the H i-detected satellites discussed previously: J022138 and J022042. Photometry in all the available optical bands, and structural properties when possible, are provided in Table 3.
| Parameter | J022138 | J022042 |
|---|---|---|
| RA | 02h 21m 38.07s | 02h 20m 42.1s |
| Dec | 05° 26’ 31.5” | 05° 21’ 15.00” |
| g-band | 17.13 0.01 mag† | 19.30 0.18 mag‡ |
| r-band | 16.79 0.01 mag† | 18.93 0.15 mag‡ |
| i-band | 16.66 0.01 mag† | 18.56 0.01 mag* |
| z-band | 16.59 0.01 mag† | 18.68 0.13 mag‡ |
| y-band | 16.57 0.02 mag† | 21.07 0.11 mag* |
| W1-band | 17.34 0.03 mag | - |
| W2-band | 17.89 0.13 mag | - |
| W3-band | 17.46 0.29 mag | - |
| W4-band | 15.31 mag | - |
| Stellar mass | 1.38 0.12 108 M⊙ | 4.21 0.97 107 M⊙ |
| SFR | 0.00403 0.001 M⊙/yr | - |
| (0) | 22.9 0.1 mag/arcsec2 | 23.4 0.2 mag/arcsec2 |
| Sérsic index | 0.73 0.05 | 0.83 0.10 |
| Axis ratio | 0.49 0.01 | 0.71 0.05 |
| Position angle | 49 1.1 degrees | 110 1.0 degrees |
| Effective radius | 11.7 0.4 arcsec | 4.0 0.5 arcsec |
| H i properties | ||
| Redshifta | 0.006912 0.000006 | 0.007359 0.00007 |
| Total H i mass a | 5.4 0.3 107 M⊙ | 8.2 0.1 107 M⊙ |
| Dynamical massb | 2.0 0.2 109 M⊙ | 1.6 0.1 109 M⊙ |
| V b | 2057.3 22.0 km s-1 | 2188.2 22.0 km s-1 |
| W50b | 52.9 22.0 km s-1 | 48 22.0 km s-1 |
| H i radiusb | 6.2 1.2 kpc | 4.5 0.5 kpc |
| Inclinationb | 43.9 4.3 degrees | 33.1 3.3 degrees |
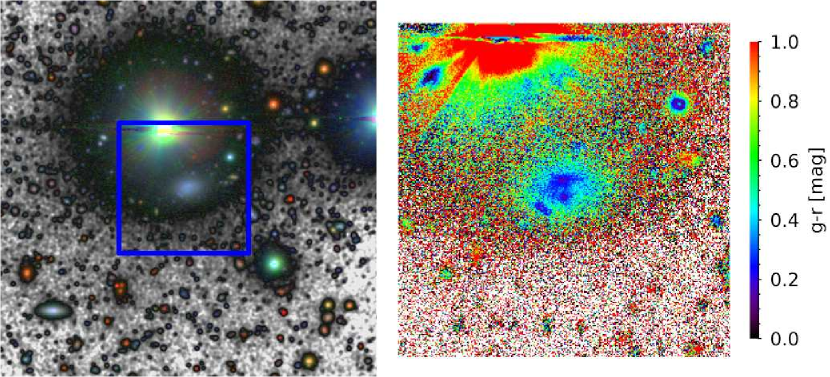
First, we analyse J022042. In Fig. 8 we show an image with the optical data available in the HSC-SSP dataset. The chance presence of an adjacent star is problematic for the analysis of the lower surface brightness regions in J022042 and problematic in general for a photometric analysis. To obtain cleaner photometry, we use DECALS data in which stars are modelled and subtracted from the images, allowing the effect of the adjacent star to be significantly reduced. This allows us to perform aperture photometry, which is presented in Table 3.
Although an analysis of low surface brightness regions, for example with photometric profiles, is not possible for J022042 due to the contamination of an adjacent star, we use the HSC-SSP images of high depth and resolution to analyse the substructure. In the right panel of Fig. 8, we present a g-r colour map which shows the presence of clumps of star formation in the central region of J022042, specifically a central clump of larger extension and a smaller one in the NW direction. While the integrated colour of J022042 is g-r = 0.37 mag (see Table 3), the clumps have a bluer colour of approximately g-r 0.2 - 0.3 mag. Regarding the morphology of J022042, just attending to the visual morphology in the color map, we did not find significant asymmetries beyond the presence of these clumps of star formation in the central regions. The main body of this satellite appears redder in colour and quite symmetrical.
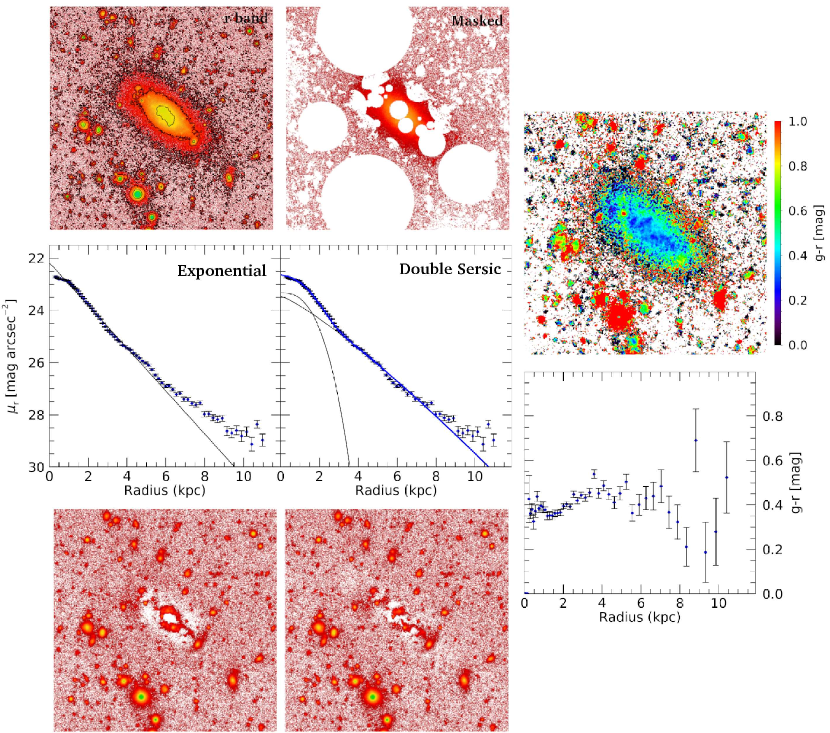
We now focus on J022138. The larger extension of J022138 and the absence of bright foreground sources allows us to make a much more detailed study of this satellite. We show a summary of its properties in Table 3. In Fig. 9 we show the results of an analysis of its photometric profiles. First, we find that a single Sersic model is not a good representation of the morphology of the galaxy. Both fitting a single Sersic model with free Sersic index n and fixing to an exponential profile n=1 produce an excess of light in the outer parts (shown in Fig. 9). This is also visible in the residual image. The fit with two Sersic models shows a much better fit. We can see in Fig. 9 that the profile is well represented by this double Sersic model, showing a much cleaner residual image. Even in the best fit, an excess of light in the outer parts, starting at about 9 kpc still remains in the profile.
To further investigate the double Sersic model, we show in Fig. 9 a panel with the photometric colour g-r of the satellite together with a photometric profile of this colour. The innermost region, approximately the inner 2 kpc, has a bluer colour than the rest of the satellite where we can also observe HII regions of star formation. We conclude that the central region is dominated by star formation, producing an artificial second component in the photometric profile.
We also show the isophotal contours of the satellite at 23, 25 and 27 mag arcsec-2 in Fig. 9. While the inner regions adjust to a more elliptical morphology, the contour of 27 mag arcsec-2 tends towards a boxy shape. The excess of light in the external regions observed in the profile together with their boxy morphology, could be an indication of a minor tidal interaction. We disregard problems derived from the sky subtraction due to the absence of over-subtraction at large radius.
We used CIGALE to perform the SED fitting of both satellite galaxies and thus obtain an estimate of their stellar masses and star formation rates. In order to run the fit we exploited the optical and WISE photometry reported in Table 3. The WISE photometric measurements were carried out using the techniques developed by Jarrett et al. (2019) but are only available for J022138 as J022042 could not be reliably measured in WISE images. We complemented our optical photometric measurements against the photometry provided by the Herschel Extragalactic Legacy Project (Vaccari, 2016; Shirley et al., 2019, 2021, HELP) DR1 Merged Catalogue333https://hedam.lam.fr/HELP/ and found that the two photometric datasets were in good agreement for the bands we could measure ourselves, with HELP providing a few extra data points. The best fit model for J022138 is shown in Fig. 10. We measure the star formation rate of 0.004 0.001 M⊙/yr for J022138. This value is comparable to those of isolated dwarf irregular galaxies with typical star formation rates, such as WLM (0.006 M⊙/yr), IC 1574 (0.005 M⊙/yr), and AndIV (0.003 M⊙/yr) (Lee et al., 2009). Therefore, we do not observe any star formation enhancement in J022138. However, even including the HELP measurements, we could not strongly constrain the long-wavelength SED of J022042 due to the lack of a WISE detection, so for this object we could only estimate the stellar mass but not the star formation rate. The derived values are reported in Table 3.
5 Discussion
One of the main questions emerging from the data presented is the possible origin of the H i features observed in NGC 895. Asymmetries are common in disc galaxies. They are often seen in the form of morphological, kinematical or integrated H i spectral asymmetries (Sancisi et al., 2008; Jog & Combes, 2009; Espada et al., 2011; de Blok et al., 2014). Among the different mechanisms used to explain such asymmetries in galaxies are tidal interactions. Here, we discuss the implications of the above results by considering several possible interaction scenarios that may have caused the observed H i and optical features detected in NGC 895.
5.1 Environment and morphology of NGC 895
We search for signatures of interaction by examining the environment around NGC 895 and its companion galaxies as well as their H i morphologies (see Fig. 1). Our deep H i observations reveal several features in NGC 895 that are clear signatures of interactions. The presence of symmetric tidal arms, as well as the lopsided and warped structure and kinematics of NGC 895 are suggestive of the strong effects of interaction with its environment. The distribution of the H i emission is asymmetric with more H i emission towards the receding side as compared to the approaching side (see Fig. 2). Several studies have demonstrated that warping and lopsidedness of mass distribution can be observed in a significant fraction of galaxies (Sancisi et al., 2008; Haynes et al., 1998; Józsa et al., 2009). The presence of these features is generally interpreted as a sign of interaction. Given that these features are visible in NGC 895, it is important to know how they originated.
Although previously identified as an isolated galaxy in H i by Tully (1988), it is immediately obvious from Fig. 1 that NGC 895 has 2 gas-rich dwarf companions located north and north-west of the main galaxy. These newly detected H i companions are identified as J022138 and J022042. Signatures of interactions between interacting galaxies can often be seen in the form of bridges or tidal tails between galaxies (Nidever et al., 2013). While bridges are associated with early stages of ongoing interactions, tidal tails between galaxies are often linked to past close encounter events with other galaxies. We searched for tidal tails and bridges between NGC 895 and its companions, at column densities of 1020 cm-2, and find no evidence for tidal tails and bridges. Although H i tidal tails and bridges have been detected at this column density before (de Blok et al., 2018; Lee-Waddell et al., 2019; Namumba et al., 2021), it is likely that the diffuse H i debris has a lower H i column density ( 1020 cm-2) that cannot be detected by our current observations.
Even though the environment around NGC 895 does not show significant signs of interactions such as tidal tails and bridges, we estimate the upper limit orbital period of each companion galaxy, which is the amount of time it will take for a companion to orbit around the centre of the main galaxy and compare these values to the age of the tails associated with NGC 895. The orbital period is 2R/V, where R is the separation between the centres of the main galaxy and companion in kpc, and V is the velocity difference in km s-1. We estimate upper limit orbital periods of 1 Gyr and 8 Gyr for J022138 and J022042, respectively. Given the length of the western tail ( 37 kpc) and the mean velocity dispersion of NGC 895 (16.8 km s-1), the age (T = length/dispersion) of the tail must be at least of order 2.2 Gyr. This suggests that it is unlikely that J022042 has caused the asymmetries associated with NGC 895. However, looking at J022138 with an orbital period of 1 Gyr, a possible scenario is that J022138 did a close fly-by of NGC 895, warping the H i disc of the central galaxy, while disrupting its own stellar and H i distribution. Such a scenario is supported by the excess of light in the external regions observed in the profile which together with their boxy morphology in Fig. 9, could be an indication of tidal interaction (Naab et al., 1999).
5.2 Tidal stripping
H i tails and streams, as well as stellar streams, between galaxies are often associated with tidal stripping of the smaller companion by the larger galaxy (for example Putman et al. 2021; Lucchini et al. 2021; Chen et al. 2014; Putman et al. 1998). The deviation from a Sersic model through an excess of light in the outer parts could be considered an indication of the external perturbation. In the deep optical images, we do not find any evidence for a tidal tail or stream. To further investigate the potential interactions that may take place, we estimate the tidal radius, (r), the radius beyond which matter is tidally stripped due to an interaction between two galaxies, given by Dahari (1984) as:
| (3) |
where is the radially projected distance between the NGC 895 and the companion, while and are the dynamical masses for the H i companions and NGC 895 respectively.We derive the r of 10.3 and 34.3 kpc for J022138 and J022042 respectively. The calculated tidal radius of each satellite is much larger than their H i radii of 6.2 kpc and 4.5 kpc, meaning that it is unlikely that they are prone to disruption.
Whereas for J022042 the tidal radius is much larger than the extension of the galaxy, for J022138 we observe that r coincides approximately with the region in the profile in which we observe an excess of light. This could indicate that, although we cannot detect the presence of tidal tails/streams, probably due to insufficient depth in the optical data, we detect the tidal effects produced by NGC 895 on the satellite, and therefore uncover evidence for an interaction between the two systems. We note that the estimate of the tidal radius is derived using the current projected distance between the main galaxy and its companion. In the past, the galaxies could have been closer to each other.
5.3 Link with star formation
The occurrence of high SFR in galaxies has been associated with galaxy interactions (Yun et al., 1994). Previous studies have found that mergers and interactions can enhance the SF in galaxies which may lead to starburst episodes (e.g. Knapen et al. 2015; Zaragoza-Cardiel et al. 2018; Knapen & James 2009; Barton et al. 2000; Díaz-García & Knapen 2020; Steffen et al. 2021). The fact that NGC 895 lies on the main sequence is a relatively strong indication that no noticeable SFR enhancement has occurred. Our analysis shows that if there have been interactions of NGC 895 with its environment, these have not enhanced its SFR. This is in agreement with Bushouse & Gallagher (1984) who showed that even though galaxies in their sample were involved in strong interactions, it was not immediately obvious that the central regions had been greatly affected as their calculated SFR for most interacting galaxies fell in the near constant SFR regime. The implication of this for our analysis is that the typical value of SFR calculated for NGC 895 might not be sufficient to rule out possible interactions.
6 Conclusions
We present high-sensitivity MIGHTEE-H i observations of NGC 895 as well as deep archival HSC optical images. We highlight the results of this study:
-
1.
The H i morphology and kinematics of NGC 895 are asymmetric. The H i profile has more H i emission from the receding side than the approaching side. The H i kinematics shows that the disc of NGC 895 has a warp, which might indicate a disturbance.
-
2.
Assuming a distance of 34.3 1.1 Mpc, we derive an H i mass of 1.4 0.01 1010 M⊙ for NGC 895, a value consistent with that derived from single-dish observations.
-
3.
At column densities of 1.2 1020 cm-2, we detect two new H i companions of NGC 895, thus changing the narrative that it is an isolated galaxy. These are classified as MGTHJ022138.1-052631 and MGTHJ022042.1-052115.
-
4.
The H i masses for the companion galaxies are 8.2 0.1 107 M⊙ and 5.4 0.3 107 M⊙ for J022138 and J022042 respectively.
-
5.
Although the H i properties of NGC 895 indicate that it might have undergone an interaction, we do not find tidal debris between NGC 895 and its companions. This might indicate either that other mechanisms are responsible for the asymmetries seen in NGC 895 or that our observation sensitivity does not allow us to detect these interaction features which could be present at low column density levels.
-
6.
We calculate the orbital periods of the H i companion galaxies and compare these to the age of the H i tail of NGC 895. We find that it is unlikely that J022042 is responsible for the observed interaction features in NGC 895. It is, however, possible that J022138 did a close fly-by of NGC 895, warping the H i disc of the central galaxy, while disrupting its own stellar and H i distribution. This is also supported by the fact that the calculated tidal radius of each satellite is much larger than their H i radius, meaning that it is unlikely that they are prone to disruption. For J022138, the tidal radius is of the order of the radius at which we observe a slight excess of light in the optical profile and it might well be that during an earlier phase of encounter, when the companion may have been closer to NGC 895, tidal effects did play some role.
-
7.
We find that the SFR of NGC 895 has not been enhanced. The galaxy has an active star-forming disk and lies on the main sequence with a SFR of . Based on previous studies, this does not rule out any possible interaction with its companion galaxies.
Our work shows the high potential and synergy of using state-of-the-art data in both H i and optical to reveal a more complete picture of galaxy environments.
Acknowledgements
The MeerKAT telescope is operated by the South African Radio Astronomy Observatory, which is a facility of the National Research Foundation, an agency of the Department of Science and Innovation. BN’s research is supported by the South African Radio Astronomy Observatory (SARAO). We acknowledge the use of the ilifu cloud computing facility - www.ilifu.ac.za, a partnership between the University of Cape Town, the University of the Western Cape, the University of Stellenbosch, Sol Plaatje University, the Cape Peninsula University of Technology and the South African Radio Astronomy Observatory. The Ilifu facility is supported by contributions from the Inter-University Institute for Data Intensive Astronomy (IDIA – a partnership between the University of Cape Town, the University of Pretoria, the University of the Western Cape and the South African Radio astronomy Observatory), the Computational Biology division at UCT and the Data Intensive Research Initiative of South Africa (DIRISA). BN acknowledges financial support from the Women by Science programme of the Fundación Mujeres por África, from the Gobierno de Canarias, and from the Instituto de Astrofísica de Canarias (IAC). JR and JHK acknowledge support from the Spanish Ministry of Science and Innovation under the grant "The structure and evolution of galaxies and their central regions" with reference PID2019-105602GB-I00/10.13039/501100011033, from the ACIISI, Consejería de Economía, Conocimiento y Empleo del Gobierno de Canarias and the European Regional Development Fund (ERDF) under grant with reference PROID2021010044, and from IAC project P/300724, financed by the Ministry of Science and Innovation, through the State Budget and by the Canary Islands Department of Economy, Knowledge and Employment, through the Regional Budget of the Autonomous Community. JR also acknowledges funding from University of La Laguna through the Margarita Salas Program from the Spanish Ministry of Universities ref. UNI/551/2021-May 26, and under the EU Next Generation. JF-B acknowledges support through the RAVET project by the grant PID2019-107427GB-C32 from the Spanish Ministry of Science, Innovation and Universities (MCIU), and through the IAC project TRACES which is partially supported through the state budget and the regional budget of the Consejería de Economía, Industria, Comercio y Conocimiento of the Canary Islands Autonomous Community. RI acknowledges financial support from the grant CEX2021-001131-S funded by MCIN/AEI/10.13039/501100011033, from the grant IAA4SKA (Ref. R18-RT-3082) from the Economic Transformation, Industry, Knowledge and Universities Council of the Regional Government of Andalusia and the European Regional Development Fund from the European Union and financial support from the grant PID2021-123930OB-C21 funded by MCIN/AEI/10.13039/501100011033, by "ERDF A way of making Europe" and by the "European Union" and the Spanish Prototype of an SRC (SPSRC) service and support funded by the Spanish Ministry of Science and Innovation (MCIN), by the Regional Government of Andalusia and by the European Regional Development Fund (ERDF). EN and THJ acknowledge support from the National Research Foundation (South Africa). OS’s research is supported by the South African Research Chairs Initiative of the Department of Science and Technology and National Research Foundation (grant number 81737). LM and MV acknowledge financial support from the Inter-University Institute for Data Intensive Astronomy (IDIA), a partnership of the University of Cape Town, the University of Pretoria, the University of the Western Cape and the South African Radio Astronomy Observatory, and from the South African Department of Science and Innovation’s National Research Foundation under the ISARP RADIOSKY2020 Joint Research Scheme (DSI-NRF Grant Number 113121) and the CSUR HIPPO Project (DSI-NRF Grant Number 121291). SHAR is supported by the South African Research Chairs Initiative of the Department of Science and Technology and National Research Foundation. KM is grateful for support from the Polish National Science Centre via grant UMO-2018/30/E/ST9/00082. NM acknowledges support of the LMU Faculty of Physics.MJJ, IH and AAP acknowledge support of the STFC consolidated grant [ST/S000488/1] and [ST/W000903/1] and MJJ and IH support from a UKRI Frontiers Research Grant [EP/X026639/1]. MJJ also acknowledges support from the Oxford Hintze Centre for Astrophysical Surveys which is funded through generous support from the Hintze Family Charitable Foundation. LVM acknowledges financial support from the grant SEV-2017-0709 funded by MCIN/AEI/ 10.13039/501100011033, from the grants RTI2018-096228-B-C31 and PID2021-123930OB-C21 funded by MCIN/AEI/ 10.13039/501100011033, by “ERDF A way of making Europe” and by the "European Union" and from the grant IAA4SKA (R18-RT-3082) funded by the Economic Transformation, Industry, Knowledge and Universities Council of the Regional Government of Andalusia and the European Regional Development Fund from the European Union.
Data availability
The H i data from this study are available as part of the first MIGHTEE survey data release and the optical data were publicly available.
References
- Aihara et al. (2018) Aihara H., et al., 2018, PASJ, 70, S4
- Aihara et al. (2019) Aihara H., et al., 2019, PASJ, 71, 114
- Barnes & Hernquist (1992) Barnes J. E., Hernquist L., 1992, ARA&A, 30, 705
- Barnes et al. (2001) Barnes D. G., et al., 2001, MNRAS, 322, 486
- Barton et al. (2000) Barton E. J., Geller M. J., Kenyon S. J., 2000, ApJ, 530, 660
- Bianchi et al. (2018) Bianchi S., et al., 2018, A&A, 620, A112
- Blanton & Moustakas (2009) Blanton M. R., Moustakas J., 2009, ARA&A, 47, 159
- Boquien et al. (2019) Boquien M., Burgarella D., Roehlly Y., Buat V., Ciesla L., Corre D., Inoue A. K., Salas H., 2019, A&A, 622, A103
- Bouchard et al. (2006) Bouchard A., Carignan C., Staveley-Smith L., 2006, AJ, 131, 2913
- Bushouse & Gallagher (1984) Bushouse H. A., Gallagher J. S. I., 1984, PASP, 96, 273
- Buta (2013) Buta R. J., 2013, in Falcón-Barroso J., Knapen J. H., eds, , Secular Evolution of Galaxies. p. 155
- Camilo et al. (2018) Camilo F., et al., 2018, ApJ, 856, 180
- Charlot & Fall (2000) Charlot S., Fall S. M., 2000, ApJ, 539, 718
- Chen et al. (2014) Chen H.-W., Gauthier J.-R., Sharon K., Johnson S. D., Nair P., Liang C. J., 2014, MNRAS, 438, 1435
- Cibinel et al. (2019) Cibinel A., et al., 2019, MNRAS, 485, 5631
- Condon et al. (1998) Condon J. J., Cotton W. D., Greisen E. W., Yin Q. F., Perley R. A., Taylor G. B., Broderick J. J., 1998, AJ, 115, 1693
- Dahari (1984) Dahari O., 1984, AJ, 89, 966
- Deg et al. (2020) Deg N., Blyth S. L., Hank N., Kruger S., Carignan C., 2020, MNRAS, 495, 1984
- Dey et al. (2019) Dey A., et al., 2019, AJ, 157, 168
- Díaz-García & Knapen (2020) Díaz-García S., Knapen J. H., 2020, A&A, 635, A197
- Draine & Li (2007) Draine B. T., Li A., 2007, ApJ, 657, 810
- Dressler (1980) Dressler A., 1980, ApJ, 236, 351
- Driver et al. (2022) Driver S. P., et al., 2022, MNRAS, 513, 439
- Espada et al. (2011) Espada D., Verdes-Montenegro L., Huchtmeier W. K., Sulentic J., Verley S., Leon S., Sabater J., 2011, A&A, 532, A117
- Espada et al. (2012) Espada D., et al., 2012, ApJ, 760, L25
- Giovanelli et al. (2005) Giovanelli R., et al., 2005, The Astronomical Journal, 130, 2598
- Haynes et al. (1998) Haynes M. P., Hogg D. E., Maddalena R. J., Roberts M. S., van Zee L., 1998, AJ, 115, 62
- Heckman et al. (1990) Heckman T. M., Armus L., Miley G. K., 1990, ApJS, 74, 833
- Hoffman et al. (1996) Hoffman G. L., Salpeter E. E., Farhat B., Roos T., Williams H., Helou G., 1996, ApJS, 105, 269
- Huchra et al. (2012) Huchra J. P., et al., 2012, ApJS, 199, 26
- Ianjamasimanana et al. (2020) Ianjamasimanana R., et al., 2020, MNRAS, 497, 4795
- Jarrett et al. (2019) Jarrett T. H., Cluver M. E., Brown M. J. I., Dale D. A., Tsai C. W., Masci F., 2019, ApJS, 245, 25
- Jarrett et al. (2023) Jarrett T. H., Cluver M. E., Taylor E. N., Bellstedt S., Robotham A. S. G., Yao H. F. M., 2023, arXiv e-prints, p. arXiv:2301.05952
- Jarvis et al. (2016) Jarvis M., et al., 2016, in MeerKAT Science: On the Pathway to the SKA. p. 6 (arXiv:1709.01901)
- Jog & Combes (2009) Jog C. J., Combes F., 2009, Phys. Rep., 471, 75
- Józsa et al. (2007) Józsa G. I. G., Kenn F., Klein U., Oosterloo T. A., 2007, A&A, 468, 731
- Józsa et al. (2009) Józsa G. I. G., Oosterloo T. A., Morganti R., Klein U., Erben T., 2009, A&A, 494, 489
- Józsa et al. (2021) Józsa G. I. G., et al., 2021, MNRAS, 501, 2704
- Kamphuis et al. (2015) Kamphuis P., Józsa G. I. G., Oh S. . H., Spekkens K., Urbancic N., Serra P., Koribalski B. S., Dettmar R. J., 2015, MNRAS, 452, 3139
- Karachentsev et al. (2006) Karachentsev I. D., Karachentseva V. E., Huchtmeier W. K., 2006, A&A, 451, 817
- Kereš et al. (2005) Kereš D., Katz N., Weinberg D. H., Davé R., 2005, MNRAS, 363, 2
- Khademi et al. (2021) Khademi M., Yang Y., Hammer F., Nasiri S., 2021, A&A, 654, A7
- Knapen & James (2009) Knapen J. H., James P. A., 2009, ApJ, 698, 1437
- Knapen et al. (2015) Knapen J. H., Cisternas M., Querejeta M., 2015, MNRAS, 454, 1742
- Koposov et al. (2015) Koposov S. E., Belokurov V., Torrealba G., Evans N. W., 2015, ApJ, 805, 130
- Koribalski et al. (2004) Koribalski B. S., et al., 2004, AJ, 128, 16
- Koribalski et al. (2018) Koribalski B. S., et al., 2018, MNRAS, 478, 1611
- Lee-Waddell et al. (2019) Lee-Waddell K., et al., 2019, MNRAS, 487, 5248
- Lee et al. (2009) Lee J. C., et al., 2009, ApJ, 706, 599
- Lucchini et al. (2021) Lucchini S., D’Onghia E., Fox A. J., 2021, ApJ, 921, L36
- Maddox et al. (2021) Maddox N., et al., 2021, A&A, 646, A35
- Małek et al. (2018) Małek K., et al., 2018, A&A, 620, A50
- McMullin et al. (2007) McMullin J. P., Waters B., Schiebel D., Young W., Golap K., 2007, in Shaw R. A., Hill F., Bell D. J., eds, Astronomical Society of the Pacific Conference Series Vol. 376, Astronomical Data Analysis Software and Systems XVI. p. 127
- Meidt et al. (2014) Meidt S. E., et al., 2014, ApJ, 788, 144
- Michel-Dansac et al. (2010) Michel-Dansac L., et al., 2010, The Astrophysical Journal, 717, L143
- Naab et al. (1999) Naab T., Burkert A., Hernquist L., 1999, ApJ, 523, L133
- Namumba et al. (2021) Namumba B., et al., 2021, MNRAS, 505, 3795
- Nidever et al. (2013) Nidever D. L., et al., 2013, ApJ, 779, L15
- Okamoto & Habe (1999) Okamoto T., Habe A., 1999, The Astrophysical Journal, 516, 591
- Peng et al. (2010) Peng Y.-j., et al., 2010, ApJ, 721, 193
- Pisano (2014) Pisano D. J., 2014, AJ, 147, 48
- Pisano et al. (2002) Pisano D. J., Wilcots E. M., Liu C. T., 2002, ApJS, 142, 161
- Ponomareva et al. (2021) Ponomareva A. A., et al., 2021, MNRAS, 508, 1195
- Putman et al. (1998) Putman M. E., et al., 1998, Nature, 394, 752
- Putman et al. (2021) Putman M. E., Zheng Y., Price-Whelan A. M., Grcevich J., Johnson A. C., Tollerud E., Peek J. E. G., 2021, ApJ, 913, 53
- Ranchod et al. (2021) Ranchod S., et al., 2021, MNRAS, 506, 2753
- Reichard et al. (2009) Reichard T. A., Heckman T. M., Rudnick G., Brinchmann J., Kauffmann G., Wild V., 2009, ApJ, 691, 1005
- Rogstad et al. (1974) Rogstad D. H., Lockhart I. A., Wright M. C. H., 1974, ApJ, 193, 309
- Román et al. (2020) Román J., Trujillo I., Montes M., 2020, A&A, 644, A42
- Román et al. (2021) Román J., Jones M. G., Montes M., Verdes-Montenegro L., Garrido J., Sánchez S., 2021, A&A, 649, L14
- Sancisi et al. (2008) Sancisi R., Fraternali F., Oosterloo T., van der Hulst T., 2008, A&ARv, 15, 189
- Schlafly & Finkbeiner (2011) Schlafly E. F., Finkbeiner D. P., 2011, ApJ, 737, 103
- Shirley et al. (2019) Shirley R., et al., 2019, MNRAS, 490, 634
- Shirley et al. (2021) Shirley R., et al., 2021, MNRAS, 507, 129
- Sinha & Holley-Bockelmann (2012) Sinha M., Holley-Bockelmann K., 2012, ApJ, 751, 17
- Sorgho et al. (2020) Sorgho A., Chemin L., Kam Z. S., Foster T., Carignan C., 2020, MNRAS, 493, 2618
- Springob et al. (2005) Springob C. M., Haynes M. P., Giovanelli R., Kent B. R., 2005, ApJS, 160, 149
- Steffen et al. (2021) Steffen J. L., Fu H., Comerford J. M., Dai Y. S., Feng S., Gross A. C., Xue R., 2021, ApJ, 909, 120
- Swaters et al. (1999) Swaters R. A., Schoenmakers R. H. M., Sancisi R., van Albada T. S., 1999, MNRAS, 304, 330
- Toomre & Toomre (1972) Toomre A., Toomre J., 1972, ApJ, 178, 623
- Tully (1988) Tully R. B., 1988, Nearby galaxies catalog
- Vaccari (2016) Vaccari M., 2016, in Napolitano N. R., Longo G., Marconi M., Paolillo M., Iodice E., eds, Astrophysics and Space Science Proceedings Vol. 42, The Universe of Digital Sky Surveys. p. 71 (arXiv:1508.06444), doi:10.1007/978-3-319-19330-4_10
- Verdes-Montenegro et al. (2005) Verdes-Montenegro L., Sulentic J., Lisenfeld U., Leon S., Espada D., Garcia E., Sabater J., Verley S., 2005, A&A, 436, 443
- White & Rees (1978) White S. D. M., Rees M. J., 1978, MNRAS, 183, 341
- Willman (2010) Willman B., 2010, Advances in Astronomy, 2010, 285454
- Wong et al. (2021) Wong O. I., et al., 2021, MNRAS, 507, 2905
- Yang et al. (2005) Yang X., Mo H. J., Jing Y. P., van den Bosch F. C., 2005, MNRAS, 358, 217
- Yun et al. (1994) Yun M. S., Ho P. T. P., Lo K. Y., 1994, Nature, 372, 530
- Zaragoza-Cardiel et al. (2018) Zaragoza-Cardiel J., Smith B. J., Rosado M., Beckman J. E., Bitsakis T., Camps-Fariña A., Font J., Cox I. S., 2018, ApJS, 234, 35
- Zheng et al. (2017) Zheng Z., et al., 2017, MNRAS, 465, 4572
- de Blok et al. (2014) de Blok W. J. G., et al., 2014, A&A, 569, A68
- de Blok et al. (2018) de Blok W. J. G., et al., 2018, ApJ, 865, 26
- de Vaucouleurs et al. (1991) de Vaucouleurs G., de Vaucouleurs A., Corwin Herold G. J., Buta R. J., Paturel G., Fouque P., 1991, Third Reference Catalogue of Bright Galaxies