Nuclear neutron radius and weak mixing angle measurements from latest COHERENT CsI and atomic parity violation Cs data
Abstract
The COHERENT collaboration observed coherent elastic neutrino nucleus scattering using a 14.6 kg cesium-iodide (CsI) detector in 2017 and recently published the updated results before decommissioning the detector. Here, we present the legacy determination of the weak mixing angle and of the average neutron rms radius of and obtained with the full CsI dataset, also exploiting the combination with the atomic parity violation (APV) experimental result, that allows us to achieve a precision as low as 4.5% and to disentangle the contributions of the and nuclei. Interestingly, we show that the COHERENT CsI data show a 6 evidence of the nuclear structure suppression of the full coherence. Moreover, we derive a data-driven APV+COHERENT measurement of the low-energy weak mixing angle with a percent uncertainty, independent of the value of the average neutron rms radius of and , that is allowed to vary freely in the fit. Additionally, we extensively discuss the impact of using two different determinations of the theoretical parity non-conserving amplitude in the APV fit. Our findings show that the particular choice can make a significant difference, up to 6.5% on (Cs) and 11% on the weak mixing angle. Finally, in light of the recent announcement of a future deployment of a 10 kg and a 700 kg cryogenic CsI detectors, we provide future prospects for these measurements, comparing them with other competitive experiments that are foreseen in the near future.
I Introduction
Coherent elastic neutrino-nucleus scattering (CENS) is a purely weak-neutral-current process, predicted by Freedmann in 1974 Freedman (1974), which happens at low-momentum transfer when the de Broglie wavelength of the exchanged Z boson mediator is greater than the nucleus radius. In this process, the neutrino interacts with the nucleus as a whole, i.e. coherently, making the cross section roughly proportional to the square of the number of neutrons of the target nucleus. For this reason, it can become some orders of magnitude bigger than that of other low-energy processes which involve neutrinos. Nonetheless, CENS has evaded experimental observation for about 43 years since its first theoretical postulation, due to the difficulty in detecting such a low-energy (few keVs) nuclear recoil produced as the single outcome of the interaction. In fact, the first observation of CENS was reported by the COHERENT collaboration only in 2017 Akimov et al. (2017, 2018), thanks to 14.6 kg of cesium-iodide (CsI) scintillating crystals exposed to the neutrino flux produced by pion-decays-at-rest at the Spallation Neutron Source (SNS), situated in the Oak Ridge Nation Laboratory. In the subsequent years, the COHERENT collaboration reported a second measurement of CENS with a liquid argon (LAr) detector Akimov et al. (2021, 2020), and later on updated the results with the same CsI detector Akimov et al. (2022a). Furthermore, tantalizing evidence of CENS using antineutrinos from the Dresden-II boiling water reactor has been recently reported in Ref. Colaresi et al. (2022) using an ultra-low noise 2.924 kg p-type point-contact germanium detector.
In recent years, CENS has proven to be one of the most profitable tools to study a plethora of diverse physical phenomena, ranging from neutrino non-standard interactions and light mediators Liao and Marfatia (2017); Denton et al. (2018); Lindner et al. (2017); Flores et al. (2020); Coloma et al. (2017); Giunti (2020); Coloma et al. (2022); Cadeddu et al. (2021a); Atzori Corona et al. (2022a); Banerjee et al. (2021); Bertuzzo et al. (2022) to neutrino electromagnetic properties Kosmas et al. (2015); Billard et al. (2018); Coloma et al. (2022); Cadeddu et al. (2018a); Atzori Corona et al. (2022b), as well as to perform intriguing tests of nuclear physics and electroweak interactions Cadeddu et al. (2020a); Miranda et al. (2020); Cadeddu et al. (2021b, 2018b); Papoulias et al. (2020); Papoulias and Kosmas (2018); Cadeddu et al. (2020b); Papoulias (2020); Khan and Rodejohann (2019); Dutta et al. (2019); Aristizabal Sierra et al. (2018); Cadeddu and Dordei (2019); Dutta et al. (2020); Abdullah et al. (2018); Ge and Shoemaker (2018); Miranda et al. (2021); Flores et al. (2020); De Romeri et al. (2022).
Indeed, in previous works Cadeddu et al. (2018b, 2020b); Papoulias (2020); Miranda et al. (2020); Huang and Chen (2019); Cadeddu et al. (2021b), it has been shown that CENS can be exploited to extract information on the neutron root-mean-square (rms) radius distribution inside atomic nuclei, . Such a quantity is of extreme interest in nuclear physics and astrophysics since it provides valuable information on the equation of state (EOS) of neutron-rich matter, which is at the basis of the formation, structure, and stability of atomic nuclei, whether stars collapse into neutron stars or black holes, and also the structure of neutron stars as well as the understanding of gravitational wave events Shen et al. (2020); Horowitz (2019); Wei et al. (2020); Thiel et al. (2019); Adhikari et al. (2021).
Despite its importance, is experimentally very poorly known and it has been usually determined using strong probes, which are known to be model dependent and affected by non-perturbative effects Thiel et al. (2019). This lack of knowledge has been behind the Lead Radius Experiment (PREX) construction at the Jefferson Laboratory in order to precisely determine of lead, 208Pb, by measuring the parity-violating electroweak asymmetry in the elastic scattering of polarized electrons from 208Pb Abrahamyan et al. (2012); Adhikari et al. (2021). Notably, the PREX-II collaboration has demonstrated the feasibility of measuring the neutron rms radius of 208Pb at the percent level Adhikari et al. (2021), being able to obtain the current most accurate determination of the neutron skin, i.e. the difference between and the proton rms radius distribution , of a heavy and neutron-rich nucleus like lead.
More recently, the CREX experiment, the twin experiment of PREX that uses calcium, has reported a very precise determination of the neutron radius of Adhikari et al. (2022). These achievements strengthen the importance of further exploiting electroweak probes to obtain direct, reliable and precise determinations of the neutron distribution of neutron-rich nuclei. Luckily, CENS provides a promising and long-lasting tool, especially as the community is putting a lot of effort into developing the future CENS program Akimov et al. (2022b); Baxter et al. (2020); Abdullah et al. (2022); Angloher et al. (2019); Strauss et al. (2017).
The CENS process is also sensitive to the so-called weak mixing angle , also known as the Weinberg angle, which is a key parameter of the electroweak theory as it describes the mixing of the gauge boson fields Workman et al. (2022). Many experiments measured its value very precisely at intermediate or high energies scales Workman et al. (2022), while its low-energy value still lacks of a precise experimental determination.
Since the weak mixing angle can be significantly modified in some beyond the standard model (SM) scenarios Safronova et al. (2018); Cadeddu et al. (2021c), such as in presence of dark bosons Coloma et al. (2022); De Romeri et al. (2022); Atzori Corona et al. (2022a); Young et al. (2007); Cadeddu et al. (2021c), and it may have an impact also for nuclear physics measurements Corona et al. (2022), it is of major importance to exploit the most recent available data to obtain its most accurate state-of-the-art determination using electroweak probes.
At the moment, the most precise determination of the weak mixing angle available in the low-energy sector comes from another low-energy electroweak probe, so-called Atomic Parity Violation (APV) experiments, also known as parity
non-conservation (PNC) experiments, on cesium atoms Wood et al. (1997); Guena et al. (2005). In particular, a PNC interaction mixes S and P eigenstates, and, in cesium, this feature permits for the 6S7S transition between Zeeman sub-levels Gilbert et al. (1985), that would be otherwise forbidden. In Ref. Cadeddu and Dordei (2019); Cadeddu et al. (2021b), it has been demonstrated for the first time the complementarity of CENS and APV experiments to simultaneously extract information on the weak mixing angle and the nuclear physics parameters, making it interesting to combine these results.
The goal of this paper is therefore to use the latest CsI data-release provided by the COHERENT collaboration in 2021 with a refined quenching factor (QF) determination and more statistics Akimov et al. (2022a, c), both alone and in combination with the information content coming from APV on cesium atoms, in order to extract the most precise information on the weak mixing angle and nuclear physics parameters. This paper is organized as follows. In Sec. II we give the necessary theoretical tools for the determination of the physics parameters of interest, while in Sec. III we provide the experimental details and statistical procedures used in this analysis as well as describe and comment the results obtained analysing COHERENT and APV data. Before to summarise our conclusions in Sec. V, in Sec. IV we review future perspectives for these measurements.
II Nuclear and electroweak physics using CENS and APV processes
As stated in the introduction, CENS and atomic parity violation represent two of the most promising electroweak probes to access the neutron nuclear distribution. The proton and neutron nuclear form factors, and , account respectively for the spatial distribution of protons and neutrons inside the target nucleus. Their measurement can be extracted analysing CENS data corresponding to a neutrino () scattering off a nucleus with protons and neutrons (in this analysis, we use , and ). They depend on the size of the nucleus and in these kind of processes they parameterize the loss of coherence as the momentum transfer grows. They represent a crucial ingredient of the CENS SM differential cross section which, as a function of the nuclear recoil energy and for a spin-zero nucleus, is given by Freedman (1974); Drukier and Stodolsky (1984); Barranco et al. (2005); Patton et al. (2012)
| (1) |
where is the Fermi constant, is the neutrino energy, is the nuclear mass, and and are the neutrino couplings to protons and neutrons, respectively. Their tree-level values are , which encapsulates the dependence on the weak mixing angle such that it could be determined from CENS data, and . In the SM, the value of the weak mixing angle evaluated at zero-momentum transfer is equal to , as reported in the Particle Data Group (PDG) Workman et al. (2022). A precise determination of these couplings is of fundamental importance to retrieve correctly and . Thus, in this paper, we calculated the couplings taking into account the radiative corrections in the scheme following Refs. Erler and Su (2013); Workman et al. (2022)
| (2) |
The quantities in Eq. (2), , and , with and are the radiative corrections associated with the box diagram, the crossed-box and the box respectively, while is a parameter of electroweak interactions. Moreover, describes the neutrino charge radius contribution and introduces a dependence on the neutrino flavour (see Ref. Erler and Su (2013) or the appendix B of Ref. Atzori Corona et al. (2023) for further information on such quantities).
Numerically, the values of these couplings correspond to , , and .
The form factors and can be parametrized using a symmetrized Fermi Cadeddu et al. (2018b) distribution which is given by the analytic expression
| (3) |
The parameter is the so-called diffuseness, which is related to the surface thickness through and is commonly fixed to the value fm both for the neutron and proton form factor, as most of theoretical nuclear models predict roughly the same density drop between proton and neutron distributions. The rms radius is related to through and, for the proton distribution inside the nucleus, we use the proton rms radii obtained from the muonic atom spectroscopy data Fricke et al. (1995); Angeli and Marinova (2013) as explained in Ref. Cadeddu et al. (2020a), namely and . Since only little knowledge on the neutron rms radii of and is available using electroweak probes Hoferichter et al. (2020); Cadeddu et al. (2018b); Papoulias et al. (2020); Cadeddu et al. (2018a); Huang and Chen (2019); Papoulias (2020); Khan and Rodejohann (2019); Cadeddu et al. (2020a, b), we take as a reference the values of the neutron rms radii extracted from the theoretical nuclear shell model (NSM) calculations of the corresponding neutron skins Hoferichter et al. (2020) which are
| (4) |
In the calculations which assume these values of the neutron rms radii, we take into account the effect of their uncertainties by considering a 3.4% uncertainty for the CsI CENS rates Akimov et al. (2022a).
An alternative description is provided by the Helm parameterization Helm (1956), which practically gives the same results as the SF. The Helm parameterization is given by
| (5) |
where is the order-one spherical Bessel function, while is the box (or diffraction) radius.
The rms radius of the corresponding nucleon distribution is given by ,
where the parameter quantifies the so-called surface thickness.
We consider a value of fm, which is the typical value determined for the proton form factor for this type of nuclei Friedrich and Voegler (1982).
The low-energy measurement of the nuclear weak charge, , of from APV experiments also depends on the nuclear physics parameters and the weak mixing angle, making it interesting to simultaneously constrain these parameters exploiting COHERENT CsI data. In particular, the nuclear weak charge depends on the weak mixing angle according to the relation Workman et al. (2022)
| (6) |
where is the fine-structure constant, while and are the couplings of electrons to protons and neutrons, respectively, including radiative corrections in the scheme Workman et al. (2022); Erler and Su (2013) (see also appendix A of Ref. Cadeddu et al. (2021b)). The small numerical corrections to the couplings are discussed in Ref. Erler and Su (2013) and include the calculation of the -box correction from Ref. Blunden et al. (2012). The values of the couplings correspond to
| (7) | |||
| (8) |
where and . These values give
.
Experimentally, the weak charge of a nucleus is extracted from the ratio of the parity violating amplitude, , to the Stark vector transition polarizability, , and by calculating theoretically in terms of
| (9) |
where and are determined from atomic theory, and Im stands for imaginary part Workman et al. (2022).
We use Workman et al. (2022), where is the Bohr radius and is the absolute value of the electric charge, and Workman et al. (2022).
In order to extract information on the neutron distribution inside cesium and to directly evaluate from a combined fit with the COHERENT data, one has to subtract to the so-called “neutron skin” correction in order to obtain Cadeddu et al. (2021b).
This correction has been introduced in Ref. Derevianko (2001) to take into account the fact that the difference between and is not considered in the nominal atomic theory derivation. Hence, the neutron skin corrected value of the weak charge, , is retrieved by summing to the correction term Derevianko (2001); Cadeddu et al. (2020b); Cadeddu and Dordei (2019).
In this way, the dependence of on the neutron rms radius becomes also explicit. Indeed, the factors and incorporate the radial dependence of the electron axial transition matrix element by considering the proton and the neutron spatial distribution, respectively Pollock et al. (1992); Viatkina et al. (2019); Pollock et al. (1992); Derevianko (2001).
For the calculation of and we refer to appendix B of Ref. Cadeddu et al. (2021b).
In this work, we will rely on the theoretical value of the PNC amplitude with the neutron skin correction used in Ref. Cadeddu et al. (2021b) Dzuba et al. (2012), but we will also discuss the implications to consider the result of the more recent calculation reported in Ref. Sahoo et al. (2021) which yields to a smaller value, namely .
III Results
In this section, we present the new measurements of the weak mixing angle, performed at the energy scale probed by the experiments, i.e. and for COHERENT and APV, respectively, and of the cesium nuclear parameters, both obtained using the latest COHERENT CsI data-set Akimov et al. (2022a) alone and in combination with APV.
Concerning the treatment of the COHERENT data, we largely follow the same procedure described in details in Ref. Atzori Corona et al. (2022a), to which we refer the reader. The physical parameters of interest are extracted using the following Poissonian least-squares function Baker and Cousins (1984); Workman et al. (2022)
| (10) |
where
the indices represent the nuclear-recoil energy and arrival time bin, respectively, while the indices
for stand, respectively, for CENS, (), beam-related neutron (), neutrino-induced neutron () and steady-state () backgrounds obtained from the anti-coincidence data.
In our notation, is the experimental event number obtained from coincidence data and is the predicted number of CENS events that depends on the physics model under consideration, according to the cross-section in Eq. (1), as well as on the neutrino flux, energy resolution, detector efficiency, number of target atoms and the CsI quenching factor Atzori Corona et al. (2022a).
We take into account the systematic uncertainties with the nuisance parameters
and the corresponding uncertainties
,
,
and
as explained in Refs. Atzori Corona et al. (2022a); Akimov et al. (2022a).
When performing the analysis of the APV data, we use the least-squares function given by
| (11) |
where is the total uncertainty. Finally, when performing a combined analysis of the COHERENT data with APV, we use the least-squares function given by
| (12) |
III.1 Determination of and the average CsI neutron radius
 |
 |
| COH-CsI | 86.0 | 85.2 | ||
|---|---|---|---|---|
| APV PDG | - | - | ||
| APV 2021 | - | - | ||
| APV PDG + CsI | 86.0 | 85.3 | ||
| APV 2021 + CsI | 86.0 | 86.6 | ||
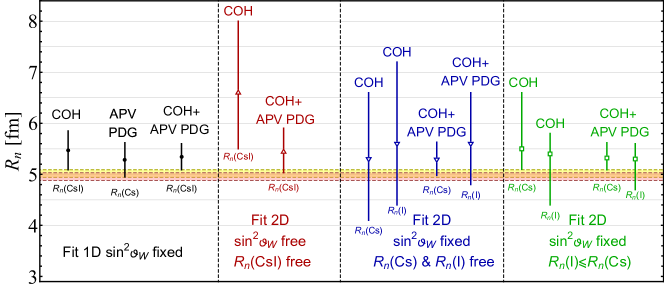
In this section, we report the limits obtained on and separately, i.e., by fitting for only one parameter at a time and fixing the other to the theoretical prediction. To this end, we exploit the COHERENT CsI and APV dataset separately but also their combination.
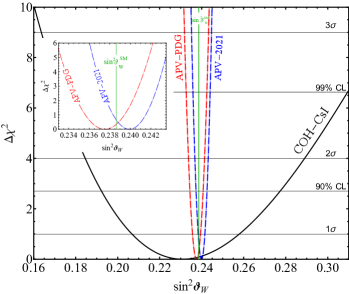
In Sec. I we introduced the weak mixing angle , whose experimental determination might provide a powerful tool to test the SM of electroweak theory and to investigate possible new physics extensions of it. With this aim in mind, we updated the previous COHERENT CsI analysis performed in Ref. Cadeddu et al. (2021b) using a refined quenching factor Akimov et al. (2022a, c) and an improved fitting procedure which exploits the neutrino time arrival information and uses a poissonian function, instead of the canonical gaussian definition, which provides a more correct and reliable fit to the data when the number of events in each bin is small. Relying on the theoretical prediction for the neutron radius, we can fix the average CsI radius to , according to Eq. (4), to perform a fit to extract the weak mixing angle using the least-square function in Eq. (10). The result is shown graphically in Fig. 1 and at the , 90 and confidence level (CL) we find
| (13) |
which is in agreement with the theoretical SM prediction and the result recently presented in Ref. De Romeri et al. (2022) when fitting the COHERENT CsI data with a different approach. Another derivation performed by the COHERENT collaboration Akimov et al. (2022a) reports , which agrees rather well with our result although some small differences are expected due to the different description of the nuclear structure, i.e. different choices of the reference values for the neutron nuclear radii, and a different approach to radiative corrections for neutrino-nucleus scattering. Moreover, we checked the impact of using a different quenching factor, by comparing our nominal results obtained using Refs. Akimov et al. (2022a, c) and the derivation in Ref. Lewis and Collar (2021). The latter lower QF decreases the total number of CENS events resulting in a larger by about 10%.
This result can be compared with those obtained using the APV experiment on Cs and the least-squares function in Eq. (11), namely
| (14) | |||
| (15) |
that we derived exploiting the experimental value of obtained with the theoretical prediction of the PNC amplitude of Ref. Dzuba et al. (2012), referred to as APV PDG, and that recently calculated in Ref. Sahoo et al. (2021), referred to as APV 2021. It is possible to see that the APV dataset allows us to achieve a factor of more than 10 better precision in the determination of . As shown in the insert of Fig. 1, the two PNC amplitudes point to a value of the weak mixing angle that is below and above the theoretical prediction, respectively, by less than 1. From the combination of the APV and COHERENT CsI dataset we obtain
| (16) | |||
| (17) |
Clearly, the combination is vastly dominated by the APV result, with the PNC amplitude from Ref. Sahoo et al. (2021) being slightly more precise. All the results shown are summarised in Table 1.
Moving now to the poorly-known neutron distribution inside the nuclei, in order to obtain information on it we fix the weak mixing angle to the SM low-energy value, that is currently calculated with very high precision Workman et al. (2022), to let the average CsI neutron distribution radius free to vary in the fit. Indeed, given the fact that the difference between the rms neutron radii of Cs and I is expected to be small compared to the current precision of experimental data, the choice to fit for an average value is a fair approximation. Clearly, in this case, the contribution due to the neutron form factor to the total systematic uncertainty on is removed in the least-square function evaluation. The result of the fit is shown in Fig. 1 and at the , 90 and CL we find
| (18) |
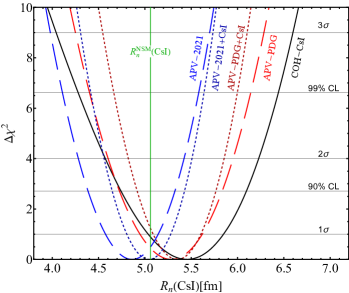
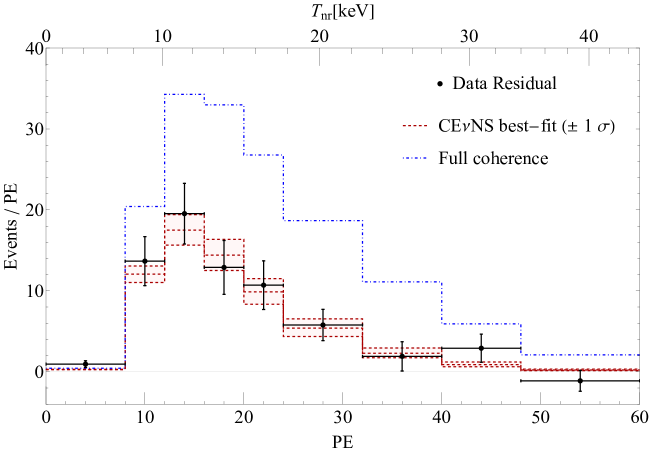
which is in agreement, within the uncertainty, with the NSM expected value for , despite the central value pointing toward a large neutron skin. Moreover, this result is almost more precise than the previous determination of Ref. Cadeddu et al. (2021b). To better appreciate the sensitivity of CENS to , in Fig. 2 we show the impact of the nuclear structure to the theoretical prediction of the CENS event rates. In particular, we show the COHERENT excess counts, namely the background subtracted COHERENT data, as a function of both the photoelectrons (PE) and the corresponding nuclear recoil energy () and we compare them with the prediction obtained in case of full coherence, i.e., setting all nuclear form factors equal to unity, and with the best fit obtained leaving free to vary, as described in this section. We find that COHERENT data shows a 6 evidence of the nuclear structure suppression of the full coherence, making it an extremely powerful probe to determine nuclear parameters.
Also APV data is sensitive to and using the least-squares function in Eq. (11) we get
| (19) | |||
| (20) |
Differently from the case of the weak mixing angle, the precision achieved in this case is only slightly better than that achieved with COHERENT, such that the constraints improve significantly by performing a combination of these two experiments. The -curves we obtain are summarised in Fig. 1 and the numerical values we find are
| (21) | |||
| (22) |
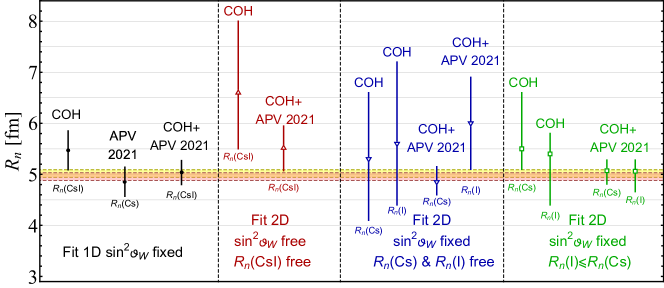
It is possible to see that the combination obtained using the 2021 PNC amplitude of Ref. Sahoo et al. (2021) returns a neutron distribution rms radius that is very well in agreement with the theoretical prediction, while both COHERENT and the PDG PNC amplitude of Ref. Dzuba et al. (2012) suggest a larger neutron skin. Given that in the latter case the two dataset point toward a similar value, we also get a smaller value for the minimum , as shown in Table 1. In both scenarios, a precision of less than 5% is obtained in the determination of .
III.2 Simultaneous determination of vs (CsI) and combined analysis with APV
 |
 |
 |
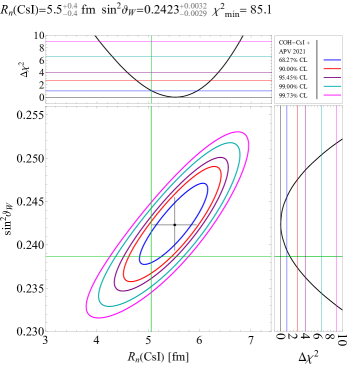 |
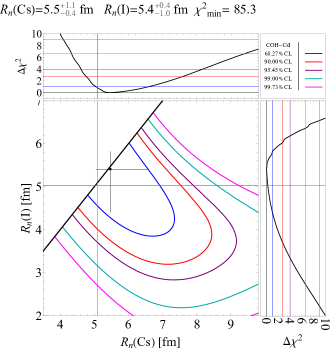
In this section, we extend the analysis presented in Sec. III.1 by letting both the weak mixing angle and the average CsI neutron radius to vary freely in the fit such that correlation between these two observables is properly taken into account. This allows one to obtain simultaneous information on both parameters, taking into account their degeneracy and obtaining thus a more reliable result. We also perform this fit in combination with APV data using Eq. (12), in order to exploit the different dependence of the two experiments on these two parameters. This allows us to get a more precise and solid determination of both quantities that uses the overall constraining power of two different electroweak probes. The contours at different CLs of the allowed regions in the plane of the weak mixing angle and the average CsI neutron radius are reported in Fig. 3, using COHERENT CsI data alone. At the CL we obtain
| (23) |
The fit tends to prefer large values for both parameters, with the theoretical value of the weak mixing angle and the rms average neutron radius of CsI that lie respectively at and outside the marginalized allowed region, despite the large uncertainties.
Indeed, the dataset is better fitted considering unusually large values for the weak mixing angle and the average rms neutron radius. In fact, it is interesting to notice that the fit of the COHERENT-CsI data improves noticeably with respect to the case in which both parameters are fixed to their theoretical value with a (i.e. the difference between the in this fit and the obtained fixing the parameters to their theoretical value) which is .
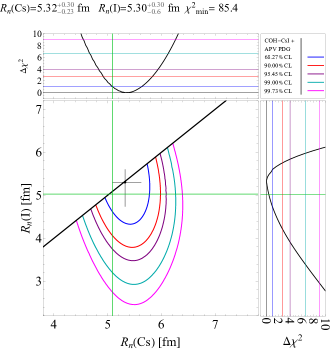
These constraints have been further tested by performing a combined fit with the APV experiment on cesium. The results of the combined analyses are reported in Fig. 4 and Fig. 4, using the experimental value of obtained with the theoretical prediction of the PNC amplitude of Ref. Dzuba et al. (2012) and that recently calculated in Ref. Sahoo et al. (2021), respectively. Using from Ref. Dzuba et al. (2012) we obtain
| (24) |
The impact of including the APV data is noticeable, both in the uncertainty of the parameters, that is improved by more that one order of magnitude for the weak mixing angle and by a factor of for , as well as in their central values, that are moved towards the expected values, especially for .
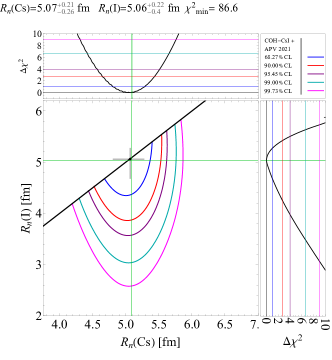
Using from Ref. Sahoo et al. (2021), at the level we obtain
| (25) |
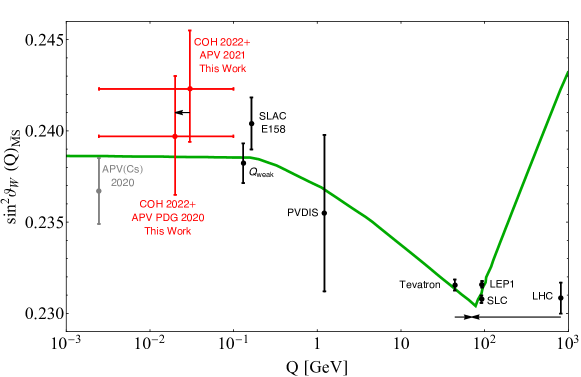
These results are depicted by the red data points in Fig. 5, where a summary of the weak mixing angle measurements as a function of the energy scale Q is shown along with the SM predicted running calculated in the scheme. They represent an alternative derivation of the weak mixing angle from APV that is fully data-driven and that keeps into account the correlation with the value of determined simultaneously using two electroweak probes, that are known to be practically model independent. Indeed, the nominal derivation of the weak mixing angle from APV data, that is reported in the PDG Workman et al. (2022) and is depicted by the grey point in Fig. 5, uses a value of that is extrapolated from hadronic experiments using antiprotonic atoms, which are known to be affected by considerable model dependencies. By comparing the two new determinations reported in this work, it is possible to see that the weak mixing angle is especially affected by the particular choice of the PNC amplitude, underlying thus the importance for the future to clarify the discrepancies between the two different approaches used in Refs. Sahoo et al. (2021); Dzuba et al. (2012).
III.3 Simultaneous determination of (I) vs (Cs) and combined analysis with APV
 |
 |
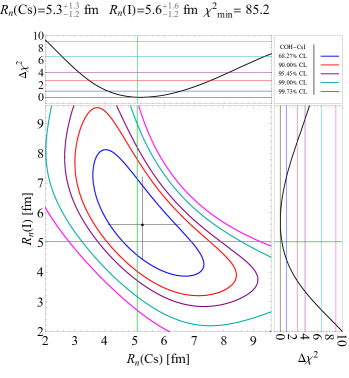
In this section, we describe the study of the correlation between using the latest COHERENT CsI data alone and combined with APV Cs to obtain the up-to-date and more accurate constraints on both these quantities. In fact, since APV depends only on the Cs neutron radius, while the COHERENT CsI result depends on both and , we are able to break their degeneracy by fixing the weak mixing angle to its SM value. The result of the COHERENT CsI analysis is reported in Fig. 3, where we show the contours at different CLs in the plane of and . Namely, we get
| (26) |
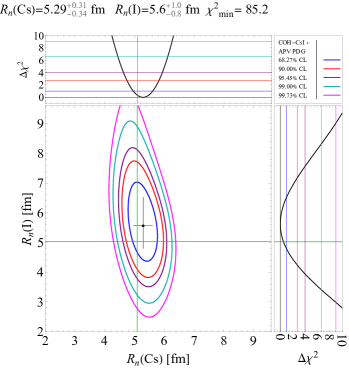
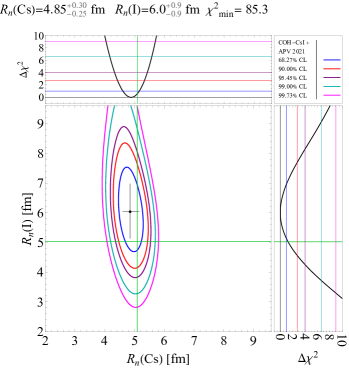
As expected, COHERENT CsI data alone does not allow to disentangle the two contributions, motivating the need to perform a combined analysis with APV data. The results of the combined analysis are reported in Fig. 6 and Fig. 6, using the experimental value of obtained with the theoretical predictions of the PNC amplitude considered in this work. In these two scenarios we obtain
| (27) | |||||
| (28) |
The corresponding neutron skins are, respectively, - and -. Also in this case the usage of the different PNC amplitudes play a major role and with the second analysis, the slightly larger value of the iodium rms neutron radius is compensated by a significantly smaller value of , that translates in an almost-zero neutron skin for cesium, with smaller uncertainties than those of the first analysis. Moreover, in all the scenarios, the central values suggest that , while all theoretical models (see e.g. Table I of Ref. Cadeddu et al. (2021b)) predicts the opposite. We thus redetermine these measurements after imposing the well-motivated constraint . In this case the measurements performed in this section become
| (29) | |||||
| (30) | |||||
| (31) |
Imposing this constraint, we achieve an uncertainty as low as 4% on . The corresponding constraints on the plane of and together with their marginalizations, at different CLs can be found in Appendix A.
III.4 Overview of the results on
Given the vast amount of measurements of the neutron rms radius distribution presented in this work under different hypotheses, we summarised all of them in Fig. 7(a) and (b) when using APV with the PNC amplitude from Ref. Dzuba et al. (2012) or from Ref. Sahoo et al. (2021), respectively. Despite the different fit configurations used to extract the values of , and , a coherent picture emerges with an overall agreement between the COHERENT and APV results and the theoretical predictions. However, we would like to note that using APV PDG we obtain on average larger values on the radii, even if still compatible within uncertainties. On the contrary, APV 2021 shifts downwards the measured radii towards the predictions, but in the simultaneous 2D fit with where the correlation with the latter increases the extracted central value of . Moreover, we checked the impact of using a different quenching factor, by comparing our nominal results obtained using Refs. Akimov et al. (2022a, c) and the derivation in Ref. Lewis and Collar (2021). The latter lower QF decreases the total number of CENS events resulting in a smaller by about 10%.
 |
 |
IV Future perspectives
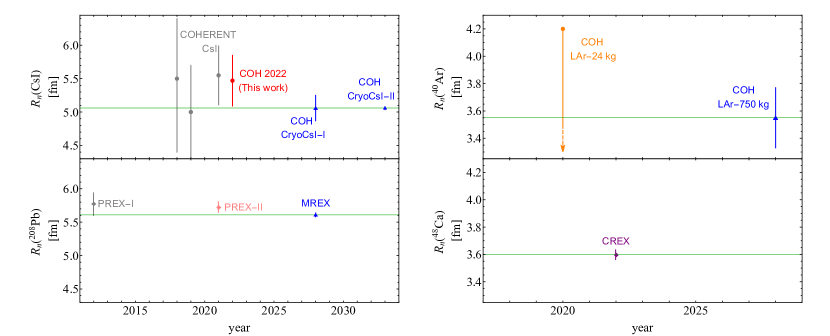
In this section, we describe a sensitivity study that we performed to outline the potentialities of CENS to measure the CsI neutron radius and the weak mixing angle at the SNS, in the context of the COHERENT experimental program. As shown in the previous sections and in several previous papers (see, e.g., the review in Ref. Abdullah et al. (2022)), CENS is a very powerful tool, being a process which turned out to be very versatile in putting constraints on a variety of parameters. Nevertheless, the current level of accuracy of CENS in the determination of the neutron radius, both the CsI one reported in this work as well as the argon (Ar) one reported in Ref. Cadeddu et al. (2020a), is still lower with respect to that obtained using parity-violating electron scattering on similar nuclei. This is visible in Fig. 8 where we show the current status for different neutron distribution radii measured via diverse electroweak probes. As shown, the precision achieved by the PREX Abrahamyan et al. (2012); Adhikari et al. (2021); Becker et al. (2018) and CREX Adhikari et al. (2022) experiments is indeed greater than that obtained through CENS for CsI and Ar Cadeddu et al. (2018b, 2020b, 2021b, 2020a); Akimov et al. (2022b).
Luckily, this is not the end of the story. The COHERENT collaboration has additional existing and planned near-future deployments in the Neutrino Alley at the SNS with exciting physics potential. In particular, the experimental program under development includes a tonne-scale liquid argon time-projection chamber detector as well as a large scale CsI cryogenic detector. These new detectors, together with planned upgrades to the SNS proton beam, will further broaden and deepen the physics reach of the COHERENT experiment. Moreover, the European Spallantion Source (ESS) is currently under construction in Lund, Sweden Abele et al. (2022). At design specifications, the ESS will operate at 5 MW using a proton linac with a beam energy of 2 GeV. In
addition to providing the most intense neutron beams, the ESS also provides a large neutrino flux and so it will be exploited to study CENS, using in particular a 31.5 kg CsI target kept at 80 K Abele et al. (2022); Baxter et al. (2020). Finally, a new CENS detection experiment is under construction in China, where undoped CsI crystals coupled with two photon multiplier tubes each, will be cooled down to 77 K and placed at the China Spallation Neutron Source (CSNS) Su et al. (2023).
In this work, we performed a sensitivity study using COHERENT plans as described in Ref. Akimov et al. (2022b). However, similar conclusions and prospects can also be drawn for the already mentioned CsI detectors expected at the ESS and the CSNS as they foresee similar technologies. The aim of this study is to assess to which extent CENS will be competitive in the future. To better appreciate the reach of the CENS program, we compare our COHERENT projections with other competitive measurements that are foreseen for the neutron radius of different nuclei and for the weak mixing angle. In this way, we obtain a complete and comprehensive review of the current and future status of knowledge on these fundamental quantities. The first upgrade of the SNS is planned for 2025, where the proton beam energy will be increased up to with respect to the current . Moreover, the beam power will increase to , compared to the current so that the number of neutrinos per flavor produced for each proton-on-target (POT) will increase to a value of 0.12. A second target station is planned in the 2030s, for a final power of . Using this information, we evaluate the number of proton-on-target () expected, that describe the intensity of the neutrino flux (see e.g. Ref. Atzori Corona et al. (2022a)), which is given by
| (32) |
being the running time of the experiment.
This means that the future SNS upgrade will be able to get a much higher neutrino flux for each neutrino flavor with respect to the current configuration.
See the text for more details.
The so-called COH-CryoCsI-I experiment, scheduled for 2025, will have a mass of about 10 kg and will exploit an undoped CsI crystal at cryogenic temperature , which would permit to use SiPM arrays instead of PMTs in order to remove the Cherenkov radiation background emitted by the latter. Moreover, the undoped CsI crystals at cryogenic temperature have approximately twice the light yield of the CsI[Na] crystal at .
The following upgrade will be the COH-CryoCsI-II experiment, planned in the 2030s, that will operate in similar conditions with a 700 kg undoped CsI detector. Both the COH-CryoCsI-I and COH-CryoCsI-II detectors will be able to lower the energy threshold, which is a fundamental requirement for CENS precision physics. Following Ref. Akimov et al. (2022b), we considered a threshold of while keeping the shape of the energy efficiency unchanged.
In addition, the systematic uncertainty on the neutrino flux will be strongly reduced thanks to the planned detector and will approach 4.7(2) statistical uncertainty after 2(5) SNS-years of operation. In this sensitivity study, we will use the value of 4.7 for the statistical uncertainty on the neutrino flux for the Cryo-CsI-I detector, while we use 2 for the Cryo-CsI-II detector. Another fundamental ingredient is the quenching factor of the CsI crystal, whose behavior at cryogenic temperature is currently under investigation. It will be directly measured by the COHERENT collaboration, but for this sensitivity study, we will consider a quenching factor of 5 as reported in Ref. Akimov et al. (2022b) and as it has already been established in Ref. Lewis and Collar (2021). Given the conservative value used, we do not consider a systematic error on the quenching factor. Thus, the total systematic uncertainty considered for the CENS prediction is for the Cryo-CsI-I detector and for the Cryo-CsI-II detector.
Assuming three years of data taking, and events are expected for COH-CryoCsI-I and COH-CryoCsI-II111For comparison, at the ESS a compact 31.5 kg cryogenic CsI detector is expected to measure CENS events per year Abele et al. (2022)., respectively, to be compared with the current CsI available statistics of events. Given the high statistics of these detectors, we find that the choice of using a poissonian or a gaussian definition for the least square function leads to almost identical results. Moreover, in order to keep into account the timing information in the sensitivity study, we used the least-square function definition in Eq. (10), using the same time binning of the data and time efficiency of the latest CsI data release analyzed in this paper. In this sensitivity study, we considered the SS background obtained by rescaling the one measured by the current CsI detector for the exposure time and the mass of COH-CryoCsI-I and COH-CryoCsI-II, respectively. Given that the SS background is unknown for energies smaller than the actual COHERENT energy threshold, we simply extended the background currently measured by the CsI COHERENT detector also to the first energy bin.
In Fig. 8, we report the projections on the neutron radius of CsI as obtained from this sensitivity study, along with a comprehensive review of the current and future status of different neutron radius measurements on various nuclei using other weak probes.
We find that COH-CryoCsI-I will be able to measure the neutron rms CsI radius with a precision of corresponding to a relative accuracy of about 222For these studies, we consider a value of as provided by the NSM calculations. See Sec. II for more information..
Similarly, for the COH-CryoCsI-II scenario we obtain a sensitivity projection for that corresponds to , meaning that COH-CryoCsI-II will be able to reach a per-mille accuracy level, i.e., about . It is worth noticing that, in this regime, the projected uncertainty on the neutron radius will become smaller than the difference between the Cs and I radius, expected to be . Thus, it will be of paramount importance to keep into account the different contributions of Cs and I by performing a simultaneous fit on these two quantities as we did in Sec. III.3.
This precision, which is also expected to be achieved at the ESS with a similar amount of foreseen CENS events, will represent an unprecedented window into nuclear physics, making CENS very competitive with respect to the other weak probes. Specifically, the other available and currently world-leading measurements on the neutron radius of heavy and neutron-rich nuclei come from parity-violating electron scattering as shown in the lower left panel of Fig. 8, for the case of Abrahamyan et al. (2012); Adhikari et al. (2021) as measured by PREX-I and PREX-II, respectively. It is worth noticing that the MREX experiment Becker et al. (2018) also plans to measure the neutron radius with an accuracy of about .
Talking about lighter nuclei, the currently available measurements come from COHERENT for Akimov et al. (2021) and for Adhikari et al. (2022) from the CREX experiment exploiting again parity-violating electron scattering. The COHERENT collaboration foresees to measure to 4.6 with the upgraded tonne scale argon detector (see also Ref. Sierra (2023)), so-called COH-Ar-750 Akimov et al. (2022b), as shown in the upper right panel of Fig. 8.
In Fig. 9, we report the projections on the weak mixing angle as obtained from this sensitivity study, along with a comprehensive review of the current and future measurements that are known for an energy scale below . In particular we depicted the evolution of the APV determination in the last decade Amsler et al. (2008); Nakamura et al. (2010); Olive et al. (2014); Zyla et al. (2020), that moved significantly due to different theoretical re-evaluations, the value of the weak mixing angle extracted from the CsI COHERENT in Ref. Cadeddu et al. (2021b) and in this work as well as the values obtained from the combination with APV. As it can be seen, many measurements of are expected in the near future in the low energy sector, as those coming from the P2 Becker et al. (2018); Dev et al. (2021) and MOLLER Benesch et al. (2014) experiments, and from future CENS experiments (COUS Lindner et al. (2017), TEXONO Wong et al. (2007), CONNIE Aguilar-Arevalo et al. (2016), and MIER Agnolet et al. (2017)) that will be really powerful for further constraining such a quantity. It is worth noticing that CENS from reactor antineutrinos already proved to be able to provide a determination of the weak mixing angle. Indeed, this has been shown in Ref. Atzori Corona et al. (2022b); Aristizabal Sierra et al. (2022), even if the uncertainty so far is still too large to be depicted in Fig. 9. In this scenario, CENS determinations with CsI will help with both the Cryo-CsI-I detector that will reach a precision of about and in particular with COH-CryoCsI-II, where a precision of about will be achieved. Similar precision are also expected to be achieved by the other large cryogenic CsI targets measuring CENS as highlighted in this section. The sensitivity projection on the weak mixing angle for the Cryo-CsI-I detector has been reported also in Ref. Akimov et al. (2022b) by the COHERENT collaboration, where a slightly better precision corresponding to has been found. The different result can be explained considering that the sensitivity to the weak mixing angle depends strongly on the values of and used to describe the loss of coherence for increasing recoil energies. The values from the NSM calculations adopted in our work differ from the significantly larger value used in the aforementioned work, which seems to be fm. We verified that we are able to obtain a better agreement with their projections using the latter value for the nuclear radius. When more data will become available, it will be therefore essential to perform a simultaneous determination of these parameters, as investigated in this work.
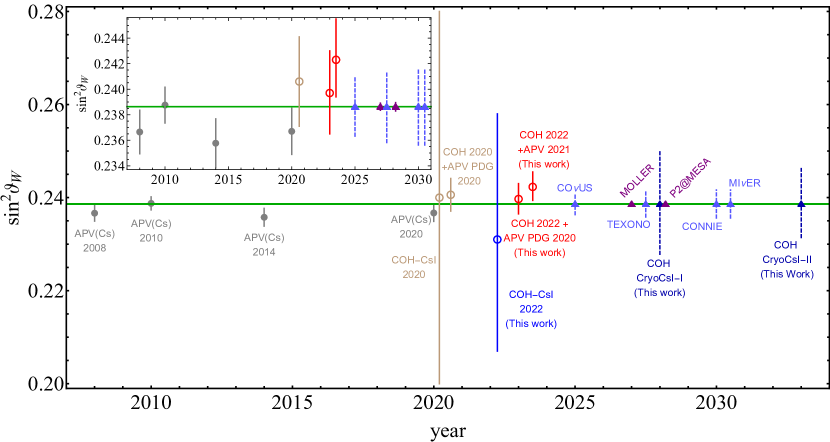
In the inset in the top left, a zoom of the y axes is shown to better appreciate the statistical uncertainties of the reported measurements and projections, removing the measurements from COHERENT-only which suffer from larger uncertainties.
V Conclusions
Motivated by the recent update of the observation of CENS using a 14.6 kg CsI detector by the COHERENT collaboration, we provide in this manuscript a complete and in-depth legacy determination of the average neutron rms radius of and and of the weak mixing angle. To do so, we take advantage of the knowledge developed in the latest years, employing the most up-to-date and accurate description of the CENS data, profiting from a precise determination of the radiative corrections, the inclusion of the neutrino arrival time information, a refined quenching factor derivation, and an appropriate least-square function definition. Interestingly, we show that the COHERENT CsI data show a 6 evidence of the nuclear structure suppression of the full coherence. Moreover, we also perform the combination with the APV experimental result, that allows us to disentangle the contributions of the and nuclei. A precision as low as 5(4) is obtained on leaving it free to vary in the fit (imposing the constraint ). The combination of APV+COHERENT impacts in particular the determination of the weak mixing angle and allows us to obtain a data-driven measurement of the low-energy weak mixing angle with a percent uncertainty, independent of the value of the average neutron rms radius of and , that is allowed to vary freely in the fit. In all the APV-related results, we exploit two different derivations of the theoretical PNC amplitude, showing that the particular choice can make a difference as large as 6.5% on and 11% on the weak mixing angle, underlying thus the importance for the future to clarify the discrepancies between the two different approaches used in Refs. Sahoo et al. (2021) and Dzuba et al. (2012). At the time of writing, the CsI COHERENT detector has been dismantled, but a new data taking with an upgraded experiment is foreseen in 5 years. Thus, in light of the recent announcement of a future deployment of a 10 kg and a 700 kg cryogenic CsI detectors, we provide future prospects for these measurements thanks to a sensitive study that we performed considering all the foreseen improvements. We compared the uncertainties forecasted for and , which are and for the 700 kg configuration, with different future measurements of the same quantities using weak probes, highlighting thus the impact that future CENS measurements will provide.
Appendix A Contours and marginalizations of and with the constraint
In this appendix, we list the constraints on the plane of and together with their marginalizations, at different CLs, obtained fitting the COHERENT CsI data alone, Fig. 10, and in combination with APV data, Figs. 10 and 10, imposing the constraint . The results in combination with APV have been obtained using the value for the neutron skin correction of Ref. Dzuba et al. (2012) and the value recently calculated in Ref. Sahoo et al. (2021), respectively.
 |
 |
 |
References
- Freedman (1974) Daniel Z. Freedman, “Coherent effects of a weak neutral current,” Phys. Rev. D 9, 1389–1392 (1974).
- Akimov et al. (2017) D. Akimov et al. (COHERENT), “Observation of Coherent Elastic Neutrino-Nucleus Scattering,” Science 357, 1123–1126 (2017), arXiv:1708.01294 [nucl-ex] .
- Akimov et al. (2018) D. Akimov et al. (COHERENT), “COHERENT Collaboration data release from the first observation of coherent elastic neutrino-nucleus scattering,” (2018), 10.5281/zenodo.1228631, arXiv:1804.09459 [nucl-ex] .
- Akimov et al. (2021) D. Akimov et al. (COHERENT), “First Measurement of Coherent Elastic Neutrino-Nucleus Scattering on Argon,” Phys. Rev. Lett. 126, 012002 (2021), arXiv:2003.10630 [nucl-ex] .
- Akimov et al. (2020) D. Akimov et al. (COHERENT), “COHERENT Collaboration data release from the first detection of coherent elastic neutrino-nucleus scattering on argon,” (2020), 10.5281/zenodo.3903810, arXiv:2006.12659 [nucl-ex] .
- Akimov et al. (2022a) D. Akimov et al. (COHERENT), “Measurement of the Coherent Elastic Neutrino-Nucleus Scattering Cross Section on CsI by COHERENT,” Phys. Rev. Lett. 129, 081801 (2022a), arXiv:2110.07730 [hep-ex] .
- Colaresi et al. (2022) J. Colaresi, J. I. Collar, T. W. Hossbach, C. M. Lewis, and K. M. Yocum, “Measurement of Coherent Elastic Neutrino-Nucleus Scattering from Reactor Antineutrinos,” Phys. Rev. Lett. 129, 211802 (2022), arXiv:2202.09672 [hep-ex] .
- Liao and Marfatia (2017) Jiajun Liao and Danny Marfatia, “COHERENT constraints on nonstandard neutrino interactions,” Phys. Lett. B 775, 54–57 (2017), arXiv:1708.04255 [hep-ph] .
- Denton et al. (2018) Peter B. Denton, Yasaman Farzan, and Ian M. Shoemaker, “Testing large non-standard neutrino interactions with arbitrary mediator mass after COHERENT data,” JHEP 07, 037 (2018), arXiv:1804.03660 [hep-ph] .
- Lindner et al. (2017) Manfred Lindner, Werner Rodejohann, and Xun-Jie Xu, “Coherent Neutrino-Nucleus Scattering and new Neutrino Interactions,” JHEP 03, 097 (2017), arXiv:1612.04150 [hep-ph] .
- Flores et al. (2020) L. J. Flores, Newton Nath, and Eduardo Peinado, “Non-standard neutrino interactions in U(1)’ model after COHERENT data,” JHEP 06, 045 (2020), arXiv:2002.12342 [hep-ph] .
- Coloma et al. (2017) Pilar Coloma, M. C. Gonzalez-Garcia, Michele Maltoni, and Thomas Schwetz, “COHERENT Enlightenment of the Neutrino Dark Side,” Phys. Rev. D 96, 115007 (2017), arXiv:1708.02899 [hep-ph] .
- Giunti (2020) C. Giunti, “General COHERENT constraints on neutrino nonstandard interactions,” Phys. Rev. D 101, 035039 (2020), arXiv:1909.00466 [hep-ph] .
- Coloma et al. (2022) Pilar Coloma, Ivan Esteban, M. C. Gonzalez-Garcia, Leire Larizgoitia, Francesc Monrabal, and Sergio Palomares-Ruiz, “Bounds on new physics with data of the Dresden-II reactor experiment and COHERENT,” JHEP 05, 037 (2022), arXiv:2202.10829 [hep-ph] .
- Cadeddu et al. (2021a) M. Cadeddu, N. Cargioli, F. Dordei, C. Giunti, Y. F. Li, E. Picciau, and Y. Y. Zhang, “Constraints on light vector mediators through coherent elastic neutrino nucleus scattering data from COHERENT,” JHEP 01, 116 (2021a), arXiv:2008.05022 [hep-ph] .
- Atzori Corona et al. (2022a) M. Atzori Corona, M. Cadeddu, N. Cargioli, F. Dordei, C. Giunti, Y. F. Li, E. Picciau, C. A. Ternes, and Y. Y. Zhang, “Probing light mediators and ( through detection of coherent elastic neutrino nucleus scattering at COHERENT,” JHEP 05, 109 (2022a), arXiv:2202.11002 [hep-ph] .
- Banerjee et al. (2021) Heerak Banerjee, Bhaskar Dutta, and Sourov Roy, “Probing L-L models with CENS: A new look at the combined COHERENT CsI and Ar data,” Phys. Rev. D 104, 015015 (2021), arXiv:2103.10196 [hep-ph] .
- Bertuzzo et al. (2022) Enrico Bertuzzo, Giovanni Grilli di Cortona, and Lucas Magno D. Ramos, “Probing light vector mediators with coherent scattering at future facilities,” JHEP 06, 075 (2022), arXiv:2112.04020 [hep-ph] .
- Kosmas et al. (2015) T. S. Kosmas, O. G. Miranda, D. K. Papoulias, M. Tortola, and J. W. F. Valle, “Probing neutrino magnetic moments at the Spallation Neutron Source facility,” Phys. Rev. D 92, 013011 (2015), arXiv:1505.03202 [hep-ph] .
- Billard et al. (2018) Julien Billard, Joseph Johnston, and Bradley J. Kavanagh, “Prospects for exploring New Physics in Coherent Elastic Neutrino-Nucleus Scattering,” JCAP 11, 016 (2018), arXiv:1805.01798 [hep-ph] .
- Cadeddu et al. (2018a) Matteo Cadeddu, Carlo Giunti, Konstantin A. Kouzakov, Yu-Feng Li, Yi-Yu Zhang, and Alexander I. Studenikin, “Neutrino Charge Radii From Coherent Elastic Neutrino-nucleus Scattering,” Phys. Rev. D 98, 113010 (2018a), [Erratum: Phys.Rev.D 101, 059902 (2020)], arXiv:1810.05606 [hep-ph] .
- Atzori Corona et al. (2022b) M. Atzori Corona, M. Cadeddu, N. Cargioli, F. Dordei, C. Giunti, Y. F. Li, C. A. Ternes, and Y. Y. Zhang, “Impact of the Dresden-II and COHERENT neutrino scattering data on neutrino electromagnetic properties and electroweak physics,” JHEP 09, 164 (2022b), arXiv:2205.09484 [hep-ph] .
- Cadeddu et al. (2020a) M. Cadeddu, F. Dordei, C. Giunti, Y. F. Li, E. Picciau, and Y. Y. Zhang, “Physics results from the first COHERENT observation of coherent elastic neutrino-nucleus scattering in argon and their combination with cesium-iodide data,” Phys. Rev. D 102, 015030 (2020a), arXiv:2005.01645 [hep-ph] .
- Miranda et al. (2020) O. G. Miranda, D. K. Papoulias, G. Sanchez Garcia, O. Sanders, M. Tórtola, and J. W. F. Valle, “Implications of the first detection of coherent elastic neutrino-nucleus scattering (CEvNS) with Liquid Argon,” JHEP 05, 130 (2020), [Erratum: JHEP 01, 067 (2021)], arXiv:2003.12050 [hep-ph] .
- Cadeddu et al. (2021b) M. Cadeddu, N. Cargioli, F. Dordei, C. Giunti, Y. F. Li, E. Picciau, C. A. Ternes, and Y. Y. Zhang, “New insights into nuclear physics and weak mixing angle using electroweak probes,” Phys. Rev. C 104, 065502 (2021b), arXiv:2102.06153 [hep-ph] .
- Cadeddu et al. (2018b) M. Cadeddu, C. Giunti, Y. F. Li, and Y. Y. Zhang, “Average CsI neutron density distribution from COHERENT data,” Phys. Rev. Lett. 120, 072501 (2018b), arXiv:1710.02730 [hep-ph] .
- Papoulias et al. (2020) D. K. Papoulias, T. S. Kosmas, R. Sahu, V. K. B. Kota, and M. Hota, “Constraining nuclear physics parameters with current and future COHERENT data,” Phys. Lett. B 800, 135133 (2020), arXiv:1903.03722 [hep-ph] .
- Papoulias and Kosmas (2018) D. K. Papoulias and T. S. Kosmas, “COHERENT constraints to conventional and exotic neutrino physics,” Phys. Rev. D 97, 033003 (2018), arXiv:1711.09773 [hep-ph] .
- Cadeddu et al. (2020b) M. Cadeddu, F. Dordei, C. Giunti, Y. F. Li, and Y. Y. Zhang, “Neutrino, electroweak, and nuclear physics from COHERENT elastic neutrino-nucleus scattering with refined quenching factor,” Phys. Rev. D 101, 033004 (2020b), arXiv:1908.06045 [hep-ph] .
- Papoulias (2020) Dimitrios K. Papoulias, “COHERENT constraints after the COHERENT-2020 quenching factor measurement,” Phys. Rev. D 102, 113004 (2020), arXiv:1907.11644 [hep-ph] .
- Khan and Rodejohann (2019) Amir N. Khan and Werner Rodejohann, “New physics from COHERENT data with an improved quenching factor,” Phys. Rev. D 100, 113003 (2019), arXiv:1907.12444 [hep-ph] .
- Dutta et al. (2019) Bhaskar Dutta, Shu Liao, Samiran Sinha, and Louis E. Strigari, “Searching for Beyond the Standard Model Physics with COHERENT Energy and Timing Data,” Phys. Rev. Lett. 123, 061801 (2019), arXiv:1903.10666 [hep-ph] .
- Aristizabal Sierra et al. (2018) D. Aristizabal Sierra, Valentina De Romeri, and N. Rojas, “COHERENT analysis of neutrino generalized interactions,” Phys. Rev. D 98, 075018 (2018), arXiv:1806.07424 [hep-ph] .
- Cadeddu and Dordei (2019) Matteo Cadeddu and Francesca Dordei, “Reinterpreting the weak mixing angle from atomic parity violation in view of the Cs neutron rms radius measurement from COHERENT,” Phys. Rev. D 99, 033010 (2019), arXiv:1808.10202 [hep-ph] .
- Dutta et al. (2020) Bhaskar Dutta, Doojin Kim, Shu Liao, Jong-Chul Park, Seodong Shin, and Louis E. Strigari, “Dark matter signals from timing spectra at neutrino experiments,” Phys. Rev. Lett. 124, 121802 (2020), arXiv:1906.10745 [hep-ph] .
- Abdullah et al. (2018) Mohammad Abdullah, James B. Dent, Bhaskar Dutta, Gordon L. Kane, Shu Liao, and Louis E. Strigari, “Coherent elastic neutrino nucleus scattering as a probe of a Z’ through kinetic and mass mixing effects,” Phys. Rev. D 98, 015005 (2018), arXiv:1803.01224 [hep-ph] .
- Ge and Shoemaker (2018) Shao-Feng Ge and Ian M. Shoemaker, “Constraining Photon Portal Dark Matter with Texono and Coherent Data,” JHEP 11, 066 (2018), arXiv:1710.10889 [hep-ph] .
- Miranda et al. (2021) O. G. Miranda, D. K. Papoulias, O. Sanders, M. Tórtola, and J. W. F. Valle, “Low-energy probes of sterile neutrino transition magnetic moments,” JHEP 12, 191 (2021), arXiv:2109.09545 [hep-ph] .
- De Romeri et al. (2022) V. De Romeri, O. G. Miranda, D. K. Papoulias, G. Sanchez Garcia, M. Tórtola, and J. W. F. Valle, “Physics implications of a combined analysis of COHERENT CsI and LAr data,” (2022), arXiv:2211.11905 [hep-ph] .
- Huang and Chen (2019) Xu-Run Huang and Lie-Wen Chen, “Neutron Skin in CsI and Low-Energy Effective Weak Mixing Angle from COHERENT Data,” Phys. Rev. D 100, 071301 (2019), arXiv:1902.07625 [hep-ph] .
- Shen et al. (2020) Hong Shen, Fan Ji, Jinniu Hu, and Kohsuke Sumiyoshi, “Effects of symmetry energy on equation of state for simulations of core-collapse supernovae and neutron-star mergers,” Astrophys. J. 891, 148 (2020), arXiv:2001.10143 [nucl-th] .
- Horowitz (2019) C. J. Horowitz, “Neutron rich matter in the laboratory and in the heavens after GW170817,” Annals Phys. 411, 167992 (2019), arXiv:1911.00411 [astro-ph.HE] .
- Wei et al. (2020) Jin-Biao Wei, Jia-Jing Lu, G. F. Burgio, Z. H. Li, and H. J Schulze, “Are nuclear matter properties correlated to neutron star observables?” Eur. Phys. J. A 56, 63 (2020), arXiv:1907.08761 [nucl-th] .
- Thiel et al. (2019) M. Thiel, C. Sfienti, J. Piekarewicz, C. J. Horowitz, and M. Vanderhaeghen, “Neutron skins of atomic nuclei: per aspera ad astra,” J. Phys. G 46, 093003 (2019), arXiv:1904.12269 [nucl-ex] .
- Adhikari et al. (2021) D. Adhikari et al. (PREX), “Accurate Determination of the Neutron Skin Thickness of 208Pb through Parity-Violation in Electron Scattering,” Phys. Rev. Lett. 126, 172502 (2021), arXiv:2102.10767 [nucl-ex] .
- Abrahamyan et al. (2012) S. Abrahamyan et al., “Measurement of the Neutron Radius of 208Pb Through Parity-Violation in Electron Scattering,” Phys. Rev. Lett. 108, 112502 (2012), arXiv:1201.2568 [nucl-ex] .
- Adhikari et al. (2022) D. Adhikari et al. (CREX), “Precision Determination of the Neutral Weak Form Factor of Ca48,” Phys. Rev. Lett. 129, 042501 (2022), arXiv:2205.11593 [nucl-ex] .
- Akimov et al. (2022b) D. Akimov et al., “The COHERENT Experimental Program,” in 2022 Snowmass Summer Study (2022) arXiv:2204.04575 [hep-ex] .
- Baxter et al. (2020) D. Baxter et al., “Coherent Elastic Neutrino-Nucleus Scattering at the European Spallation Source,” JHEP 02, 123 (2020), arXiv:1911.00762 [physics.ins-det] .
- Abdullah et al. (2022) M. Abdullah et al., “Coherent elastic neutrino-nucleus scattering: Terrestrial and astrophysical applications,” (2022), arXiv:2203.07361 [hep-ph] .
- Angloher et al. (2019) G. Angloher et al. (NUCLEUS), “Exploring with NUCLEUS at the Chooz nuclear power plant,” Eur. Phys. J. C 79, 1018 (2019), arXiv:1905.10258 [physics.ins-det] .
- Strauss et al. (2017) R. Strauss et al., “The -cleus experiment: A gram-scale fiducial-volume cryogenic detector for the first detection of coherent neutrino-nucleus scattering,” Eur. Phys. J. C 77, 506 (2017), arXiv:1704.04320 [physics.ins-det] .
- Workman et al. (2022) R. L. Workman et al. (Particle Data Group), “Review of Particle Physics,” PTEP 2022, 083C01 (2022).
- Safronova et al. (2018) M. S. Safronova, D. Budker, D. DeMille, Derek F. Jackson Kimball, A. Derevianko, and C. W. Clark, “Search for New Physics with Atoms and Molecules,” Rev. Mod. Phys. 90, 025008 (2018), arXiv:1710.01833 [physics.atom-ph] .
- Cadeddu et al. (2021c) M. Cadeddu, N. Cargioli, F. Dordei, C. Giunti, and E. Picciau, “Muon and electron g-2 and proton and cesium weak charges implications on dark Zd models,” Phys. Rev. D 104, 011701 (2021c), arXiv:2104.03280 [hep-ph] .
- Young et al. (2007) Ross Daniel Young, Roger D. Carlini, Anthony William Thomas, and Julie Roche, “Testing the standard model by precision measurement of the weak charges of quarks,” Phys. Rev. Lett. 99, 122003 (2007), arXiv:0704.2618 [hep-ph] .
- Corona et al. (2022) Mattia Atzori Corona, Matteo Cadeddu, Nicola Cargioli, Paolo Finelli, and Matteo Vorabbi, “Incorporating the weak mixing angle dependence to reconcile the neutron skin measurement on Pb208 by PREX-II,” Phys. Rev. C 105, 055503 (2022), arXiv:2112.09717 [hep-ph] .
- Wood et al. (1997) C. S. Wood, S. C. Bennett, D. Cho, B. P. Masterson, J. L. Roberts, C. E. Tanner, and Carl E. Wieman, “Measurement of parity nonconservation and an anapole moment in cesium,” Science 275, 1759–1763 (1997).
- Guena et al. (2005) J. Guena, M. Lintz, and M. A. Bouchiat, “Measurement of the parity violating 6S-7S transition amplitude in cesium achieved within 2 x 10(-13) atomic-unit accuracy by stimulated-emission detection,” Phys. Rev. A 71, 042108 (2005), arXiv:physics/0412017 .
- Gilbert et al. (1985) S. L. Gilbert, M. C. Noecker, R. N. Watts, and Carl E. Wieman, “MEASUREMENT OF PARITY NONCONSERVATION IN ATOMIC CESIUM,” Phys. Rev. Lett. 55, 2680–2683 (1985).
- Akimov et al. (2022c) D. Akimov et al. (COHERENT), “Measurement of scintillation response of CsI[Na] to low-energy nuclear recoils by COHERENT,” JINST 17, P10034 (2022c), arXiv:2111.02477 [physics.ins-det] .
- Drukier and Stodolsky (1984) A. Drukier and Leo Stodolsky, “Principles and Applications of a Neutral Current Detector for Neutrino Physics and Astronomy,” Phys. Rev. D 30, 2295 (1984).
- Barranco et al. (2005) J. Barranco, O. G. Miranda, and T. I. Rashba, “Probing new physics with coherent neutrino scattering off nuclei,” JHEP 12, 021 (2005), arXiv:hep-ph/0508299 .
- Patton et al. (2012) Kelly Patton, Jonathan Engel, Gail C. McLaughlin, and Nicolas Schunck, “Neutrino-nucleus coherent scattering as a probe of neutron density distributions,” Phys. Rev. C 86, 024612 (2012), arXiv:1207.0693 [nucl-th] .
- Erler and Su (2013) Jens Erler and Shufang Su, “The Weak Neutral Current,” Prog. Part. Nucl. Phys. 71, 119–149 (2013), arXiv:1303.5522 [hep-ph] .
- Atzori Corona et al. (2023) M. Atzori Corona, W. M. Bonivento, M. Cadeddu, N. Cargioli, and F. Dordei, “New constraint on neutrino magnetic moment and neutrino millicharge from LUX-ZEPLIN dark matter search results,” Phys. Rev. D 107, 053001 (2023), arXiv:2207.05036 [hep-ph] .
- Fricke et al. (1995) G. Fricke, C. Bernhardt, K. Heilig, L. A. Schaller, L. Schellenberg, E. B. Shera, and C. W. de Jager, “Nuclear Ground State Charge Radii from Electromagnetic Interactions,” Atom. Data Nucl. Data Tabl. 60, 177–285 (1995).
- Angeli and Marinova (2013) I. Angeli and K. P. Marinova, “Table of experimental nuclear ground state charge radii: An update,” Atom. Data Nucl. Data Tabl. 99, 69–95 (2013).
- Hoferichter et al. (2020) Martin Hoferichter, Javier Menéndez, and Achim Schwenk, “Coherent elastic neutrino-nucleus scattering: EFT analysis and nuclear responses,” Phys. Rev. D 102, 074018 (2020), arXiv:2007.08529 [hep-ph] .
- Helm (1956) Richard H. Helm, “Inelastic and Elastic Scattering of 187-Mev Electrons from Selected Even-Even Nuclei,” Phys. Rev. 104, 1466–1475 (1956).
- Friedrich and Voegler (1982) J. Friedrich and N. Voegler, “The salient features of charge density distributions of medium and heavy even-even nuclei determined from a systematic analysis of elastic electron scattering form factors,” Nucl. Phys. A 373, 192–224 (1982).
- Blunden et al. (2012) P. G. Blunden, W. Melnitchouk, and A. W. Thomas, “ box corrections to weak charges of heavy nuclei in atomic parity violation,” Phys. Rev. Lett. 109, 262301 (2012), arXiv:1208.4310 [hep-ph] .
- Derevianko (2001) Andrei Derevianko, “Correlated many-body treatment of the breit interaction with application to cesium atomic properties and parity violation,” Phys. Rev. A 65, 012106 (2001).
- Pollock et al. (1992) S. J. Pollock, E. N. Fortson, and L. Wilets, “Atomic parity nonconservation: Electroweak parameters and nuclear structure,” Phys. Rev. C 46, 2587–2600 (1992).
- Viatkina et al. (2019) A. V. Viatkina, D. Antypas, M. G. Kozlov, D. Budker, and V. V. Flambaum, “Dependence of atomic parity-violation effects on neutron skins and new physics,” Phys. Rev. C 100, 034318 (2019).
- Dzuba et al. (2012) V. A. Dzuba, J. C. Berengut, V. V. Flambaum, and B. Roberts, “Revisiting parity non-conservation in cesium,” Phys. Rev. Lett. 109, 203003 (2012), arXiv:1207.5864 [hep-ph] .
- Sahoo et al. (2021) B. K. Sahoo, B. P. Das, and H. Spiesberger, “New physics constraints from atomic parity violation in Cs133,” Phys. Rev. D 103, L111303 (2021), arXiv:2101.10095 [hep-ph] .
- Baker and Cousins (1984) Steve Baker and Robert D. Cousins, “Clarification of the Use of Chi Square and Likelihood Functions in Fits to Histograms,” Nucl. Instrum. Meth. 221, 437–442 (1984).
- Lewis and Collar (2021) C. M. Lewis and J. I. Collar, “Response of undoped cryogenic CsI to low-energy nuclear recoils,” Phys. Rev. C 104, 014612 (2021), arXiv:2101.03264 [physics.ins-det] .
- Anthony et al. (2005) P. L. Anthony et al. (SLAC E158), “Precision measurement of the weak mixing angle in Moller scattering,” Phys. Rev. Lett. 95, 081601 (2005), hep-ex/0504049 [hep-ex] .
- Wang et al. (2014) D. Wang et al. (PVDIS), “Measurement of parity violation in electron–quark scattering,” Nature 506, 67–70 (2014).
- Zeller et al. (2002) G. P. Zeller et al. (NuTeV), “A precise determination of electroweak parameters in neutrino nucleon scattering,” Phys. Rev. Lett. 88, 091802 (2002), hep-ex/0110059 .
- Androic et al. (2018) D. Androic et al. (Qweak), “Precision measurement of the weak charge of the proton,” Nature 557, 207–211 (2018).
- Becker et al. (2018) Dominik Becker et al., “The P2 experiment,” Eur. Phys. J. A 54, 208 (2018), arXiv:1802.04759 [nucl-ex] .
- Abele et al. (2022) H. Abele et al., “Particle Physics at the European Spallation Source,” (2022), arXiv:2211.10396 [physics.ins-det] .
- Su et al. (2023) Chenguang Su, Qian Liu, and Tianjiao Liang (CENS@CSNS), “CENS Experiment Proposal at CSNS,” (2023), arXiv:2303.13423 [physics.ins-det] .
- Sierra (2023) D. Aristizabal Sierra, “Extraction of neutron density distributions from high-statistics coherent elastic neutrino-nucleus scattering data,” (2023), arXiv:2301.13249 [hep-ph] .
- Amsler et al. (2008) Claude Amsler et al. (Particle Data Group), “Review of Particle Physics,” Phys. Lett. B 667, 1–1340 (2008).
- Nakamura et al. (2010) K. Nakamura et al. (Particle Data Group), “Review of particle physics,” J. Phys. G 37, 075021 (2010).
- Olive et al. (2014) K. A. Olive et al. (Particle Data Group), “Review of Particle Physics,” Chin. Phys. C 38, 090001 (2014).
- Zyla et al. (2020) P. A. Zyla et al. (Particle Data Group), “Review of Particle Physics,” PTEP 2020, 083C01 (2020).
- Dev et al. (2021) P. S. Bhupal Dev, Werner Rodejohann, Xun-Jie Xu, and Yongchao Zhang, “Searching for bosons at the P2 experiment,” (2021), arXiv:2103.09067 [hep-ph] .
- Benesch et al. (2014) J. Benesch et al. (MOLLER), “The MOLLER Experiment: An Ultra-Precise Measurement of the Weak Mixing Angle Using Moller Scattering,” (2014), arXiv:1411.4088 [nucl-ex] .
- Wong et al. (2007) H. T. Wong et al. (TEXONO), “A Search of Neutrino Magnetic Moments with a High-Purity Germanium Detector at the Kuo-Sheng Nuclear Power Station,” Phys. Rev. D 75, 012001 (2007), arXiv:hep-ex/0605006 .
- Aguilar-Arevalo et al. (2016) A. Aguilar-Arevalo et al. (CONNIE), “Results of the Engineering Run of the Coherent Neutrino Nucleus Interaction Experiment (CONNIE),” JINST 11, P07024 (2016), arXiv:1604.01343 [physics.ins-det] .
- Agnolet et al. (2017) G. Agnolet et al. (MINER), “Background Studies for the MINER Coherent Neutrino Scattering Reactor Experiment,” Nucl. Instrum. Meth. A 853, 53–60 (2017), arXiv:1609.02066 [physics.ins-det] .
- Aristizabal Sierra et al. (2022) D. Aristizabal Sierra, V. De Romeri, and D. K. Papoulias, “Consequences of the Dresden-II reactor data for the weak mixing angle and new physics,” JHEP 09, 076 (2022), arXiv:2203.02414 [hep-ph] .
- Cañas et al. (2018) B. C. Cañas, E. A. Garcés, O. G. Miranda, and A. Parada, “Future perspectives for a weak mixing angle measurement in coherent elastic neutrino nucleus scattering experiments,” Phys. Lett. B 784, 159–162 (2018), arXiv:1806.01310 [hep-ph] .