Effect of carbon content on electronic structure of uranium carbides
Abstract
The electronic structure of UCx (x=0.9, 1.0, 1.1, 2.0) was studied by means of x-ray absorption spectroscopy (XAS) at the C edge and measurements in the high energy resolution fluorescence detection (HERFD) mode at the U and edges. The full-relativistic density functional theory calculations taking into account the Coulomb interaction and spin-orbit coupling (DFT++SOC) were also performed for UC and UC2. While the U HERFD-XAS spectra of the studied samples reveal little difference, the U HERFD-XAS spectra show certain sensitivity to the varying carbon content in uranium carbides. The observed gradual changes in the U HERFD spectra suggest an increase in the C -U charge transfer, which is supported by the orbital population analysis in the DFT++SOC calculations, indicating an increase in the U occupancy in UC2 as compared to that in UC. On the other hand, the density of states at the Fermi level were found to be significantly lower in UC2, thus affecting the thermodynamic properties. Both the x-ray spectroscopic data (in particular, the C XAS measurements) and results of the DFT++SOC indicate the importance of taking into account and SOC for the description of the electronic structure of actinide carbides.
Introduction
Actinide carbides are considered as advanced nuclear fuels for the Generation IV nuclear reactors which will allow for the transmutation of minor actinides, thus contributing to the challenge of utilizing the nuclear waste. In turn, the performance of the carbide fuel will depend on the stoichiometry and stability of the required phases of the carbide systems. The thermodynamic properties will also depend on the changes in the electronic structure of actinide carbides. Since the main material for the fuel is uranium carbide, the U-C system receives more attention in terms of the dedicated research as compared to other actinide carbides.
X-ray spectroscopy is a good tool to probe the electronic structure of different materials but for uranium carbides most of the studies were so far carried out with the help of conventional x-ray spectroscopic techniques, such as x-ray absorption spectroscopy (XAS) at the U edge [1, 2, 3] or x-ray photoemission spectroscopy (XPS) [4, 5, 6, 7, 8, 9, 10, 11]. A great improvement in the quality of such research of actinide systems came with the application of the high energy resolution fluorescence detection x-ray absorption spectroscopy (HERFD-XAS) at the actinide edges [12, 13, 14] (see also reviews [15, 16]) when the greatly enhanced energy resolution and sensitivity of the method helped to resolve some long standing questions [12] about the oxidation path, monitor a gradual change of the oxidation state upon doping [17], discover new phases [18] and clarify the mechanism of the nano-phase formation [19]. The followed theoretical efforts in modelling the HERFD-XAS spectra for the large part of the actinide row [20, 21] made the interpretation the experimental data much easier.
Earlier, we reported the results of the HERFD-XAS measurements on UC and UMeC2 (Me=Fe, Zr, Mo) carbides [22]. Here we report the data measured for the uranium carbide samples with different carbon content: UC0.9, UC, UC1.1 and UC2.
Results and discussion
Fig. 1 displays the HERFD-XAS spectra of the UC0.9, UC, UC1.1 and UC2 samples recorded at the U edge. The spectra do not reveal significant changes between the samples. For UC0.9, a slight increase of the spectral intensity is observed in the 17172-17195 eV energy region as compared to the spectra of other carbide compositions which is consistent with x-ray diffraction (XRD) data indicating the existing mixture of UC and -U in the UC0.9 sample. The post-white-line background is expected to be higher for pure uranium than for its carbide [2].

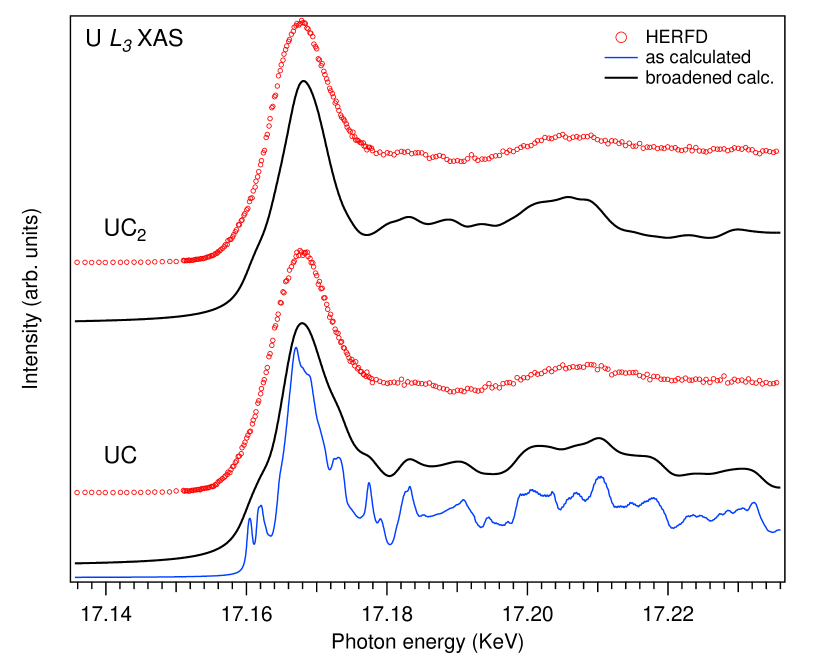
To evaluate the underlying spectral structures, Fig. 2 compares the experimental U HERFD-XAS spectra of UC and UC2 with the results of full-relativistic density functional theory taking into account the Coulomb interaction (DFT+) and Bethe-Salpeter equation (BSE) based calculations of U XAS using the OCEAN code and crystal structures from Ref. [23]. For the illustration purpose, both small and large broadenings of the calculated U XAS spectrum of UC were used to show the contribution of various underlying structures. Besides the dipole transitions (the contribution is small), the quadrupole transitions were also calculated. The latter give the main contribution to the low energy side of the U XAS spectra (see structures around 17162 eV in Fig. 2). These quadrupole transitions are significantly affected by taking into account for the shell. The dipole transitions to the states are also affected to some extent due to a modified density of states (DOS) as a result of the - hybridization. The value for UC was discussed in several publications [24, 25, 26] and most of the ground state and spectroscopic properties were reproduced using the DFT+ approach with =2.0-3.0 eV. Therefore, both for UC and UC2, we used the =2.5 eV value in the calculations and was set to 0.5 eV. While the post-edge structures of the spectra are usually sensitive to changes in the crystal structure [27, 15], in this case, even an improved energy resolution of the HERFD mode does not allow to make a clear distinction between cubic UC and tetragonal UC2.
A significant broadening of the U XAS (and even HERFD) spectra, which mainly probe the unoccupied states, makes it difficult to study the changes in the U DOS in detail. XAS measurements at the U edges ( transitions) can provide a higher energy resolution [28] but are not easy to perform due to weak intensities. XAS measurements at the C edge, which probe the unoccupied C states, can also help with this due to an admixture of the C states to the and states as a result of the U -O and U -O hybridization. As it was shown earlier, the ligand/anion XAS spectra of actinide materials are sensitive to changes in the crystal structure of materials as well as various non-stoichiometry and defects [29]. Therefore, the detailed understanding of the nature of the features in the ligand XAS spectra is necessary in order to use them for the material characterization.
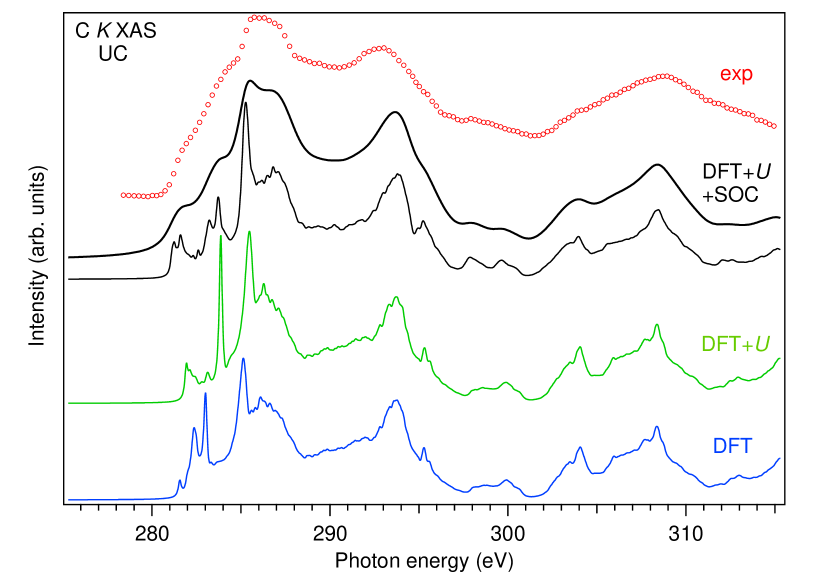
Fig. 3 displays the experimental C XAS spectrum of UC which is compared to BSE-calculated C XAS spectra using various formalisms: DFT, DFT+ and DFT+ with taking into account spin-orbit coupling (SOC). The same and values were used as in the case of the U XAS calculations. In the DFT++SOC case, the optimal projector functions were calculated with scalar-relativistic versions of U and C pseudopotentials, while full-relativistic pseudopotentials were used for other stages of the calculations in the OCEAN code. The broadening of the calculated spectra is limited to only the core-hole lifetime to get better understanding of the underlying structures in the experimental spectrum. In the DFT++SOC case, the calculated spectrum was additionally broadened to take into account the instrumental resolution for a better comparison with experiment.
In the DFT-based calculations (blue curve in Fig. 3), the low energy structure at 282.6 eV corresponds to transitions to the C states hybridized to the U states while the structure at 286.1 eV is associated with C states admixed to the U states. An inspection of Fig. 3 reveals a significant influence of the Coulomb interaction and SOC on the shape of the C XAS spectrum of UC. While the Coulomb interaction only affects the C states hybridized with the U states (see green curve in Fig. 3), SOC also affects the C states hybridized with the U states (black curves in Fig. 3). Compared to the scalar-relativistic DFT calculations (blue curve), SOC leads to a significant splitting of the 282.6-eV structure into two groups at 281.5 and 283.4 eV in the calculated C XAS spectrum, while a change of the 286.1-eV structure, reflecting a modification of the U states, is less pronounced. Therefore, the low energy structures of the experimental C XAS spectrum can be considered as a C manifestation of and SOC acting on the U states, thus indicating the importance of these interactions for the electronic structure characterization of actinide carbides.
In contrast to the U HERFD-XAS data, the U HERFD-XAS spectra of uranium carbides, which probe the U states, are turned to be sensitive to the carbon content and varying composition of the samples. In particular, the shoulder on the high energy side of the U HERFD spectrum at 3727 eV grows with increasing C content in the composition. It is difficult to explain the shoulder growth by only a change in the multiplet structure of the ground state configuration [22] as a result of the crystal structure distortion. If UC0.9 is a mixture of -U and UC and UC1.1 is a mixture of UC and UC2, the gradual relative-intensity increase of the shoulder upon going from UC0.9 to UC then to UC1.1 and to UC2 can not be caused by the low symmetry high symmetry low symmetry transition.
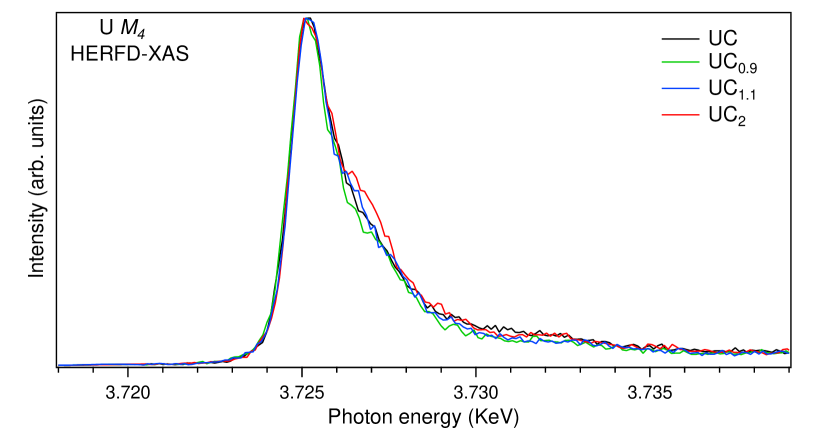
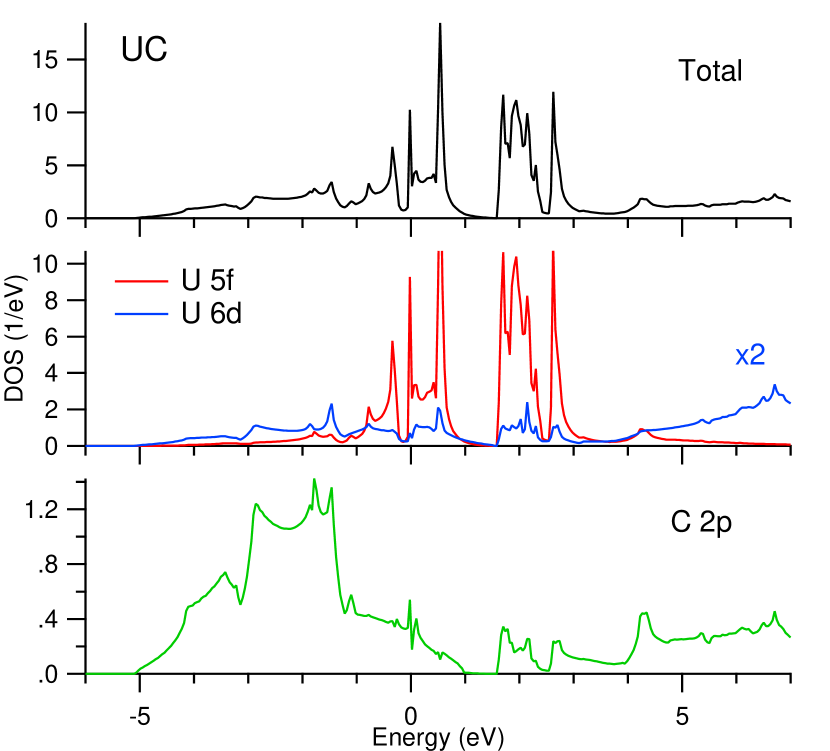
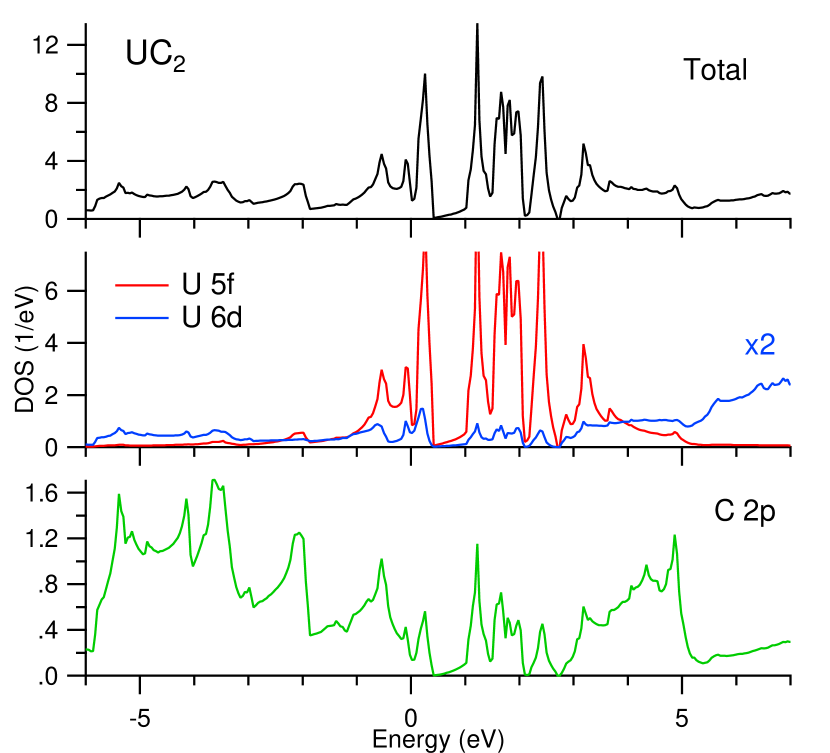
On the other hand, the observed gradual relative-intensity increase of the shoulder in the U HERFD spectra of carbides can be related to the increase in the ligand/anion U charge transfer and be a result of the multi-configurational contribution ( + + + …, where stands for an electronic hole in the valence band) in the ground and final states of the spectroscopic process (as discussed in Ref. [22]). That would mean a higher degree of such a charge-transfer for UC2 compared to UC. Indeed, the full-relativistic DFT+ calculations using the FPLO code (see Figs. 5,6,7) support this conclusion based on their orbital population analysis. The U occupancy was found to somewhat increase upon going from UC to UC2.
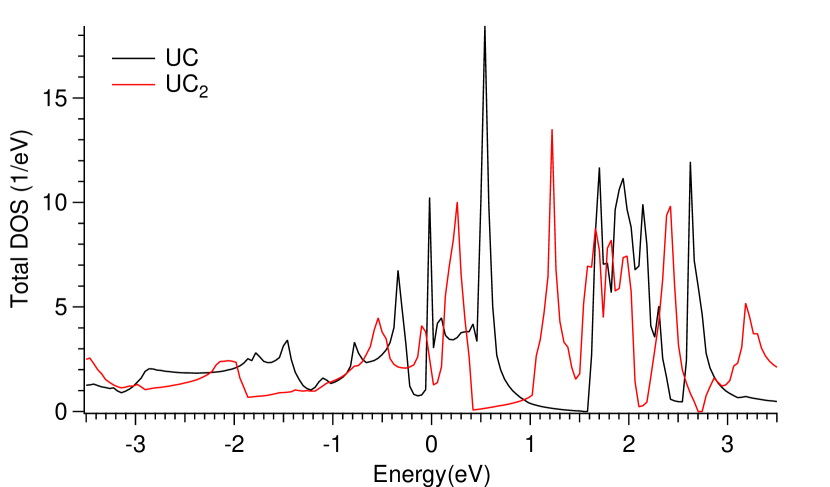
The FPLO-calculated total DOS of UC and UC2 is shown in Fig. 5 and partial DOSs in Figs. 6 and 7, respectively. Both for UC and UC2, a clear energy separation into two groups of states above the Fermi level appears as a result of SOC, the observed splitting happens closer to the Fermi level in UC2 than in UC. This again indicates the importance of taking into account SOC in the calculations of the electronic structure of actinide carbides. The prominent difference between UC and UC2 is a wider spread of the occupied C states in the valence band of UC2 as a result of the hybridization with the U states. At the same time, DOS at the Fermi level is significantly lower in UC2 as compared to UC, thus affecting the thermodynamic properties and making UC more favorable material for the carbide nuclear fuel.
Conclusion
The results of the present study indicate that the analysis of the effects of SOC and U is important for the proper description of the electronic structure of actinide carbides. The employment of x-ray spectroscopic methods with the enhanced energy resolution and sensitivity (such as HERFD-XAS at actinide edges) is necessary to spot small but important changes in the carbide properties with varying C content, such as the charge transfer and occupancy, which have influence on the thermodynamic properties and eventually on the performance of the carbide nuclear fuel.
Methods
Experimental
The samples were prepared by arc melting of relevant proportions of metallic uranium (depleted uranium, Framatome, 99.9%) and graphite pieces (Mersen) to reach the target stoichiometry of UC0.9, UC, UC1.1 and UC2. To insure a good homogeneity, they were turned and re-melted four times. Each melting was performed under an argon pressure of about 0.8 bar, after three vacuum / Ar purges. All samples were characterized by x-ray diffraction (XRD), using a Bruker D8 Advance diffractometer with monochromatic Cu radiation. XRD patterns were refined by the Rietveld method, using the FullProf software [30]. The initial structural models for UC and UC2 were taken from Ref. [23].
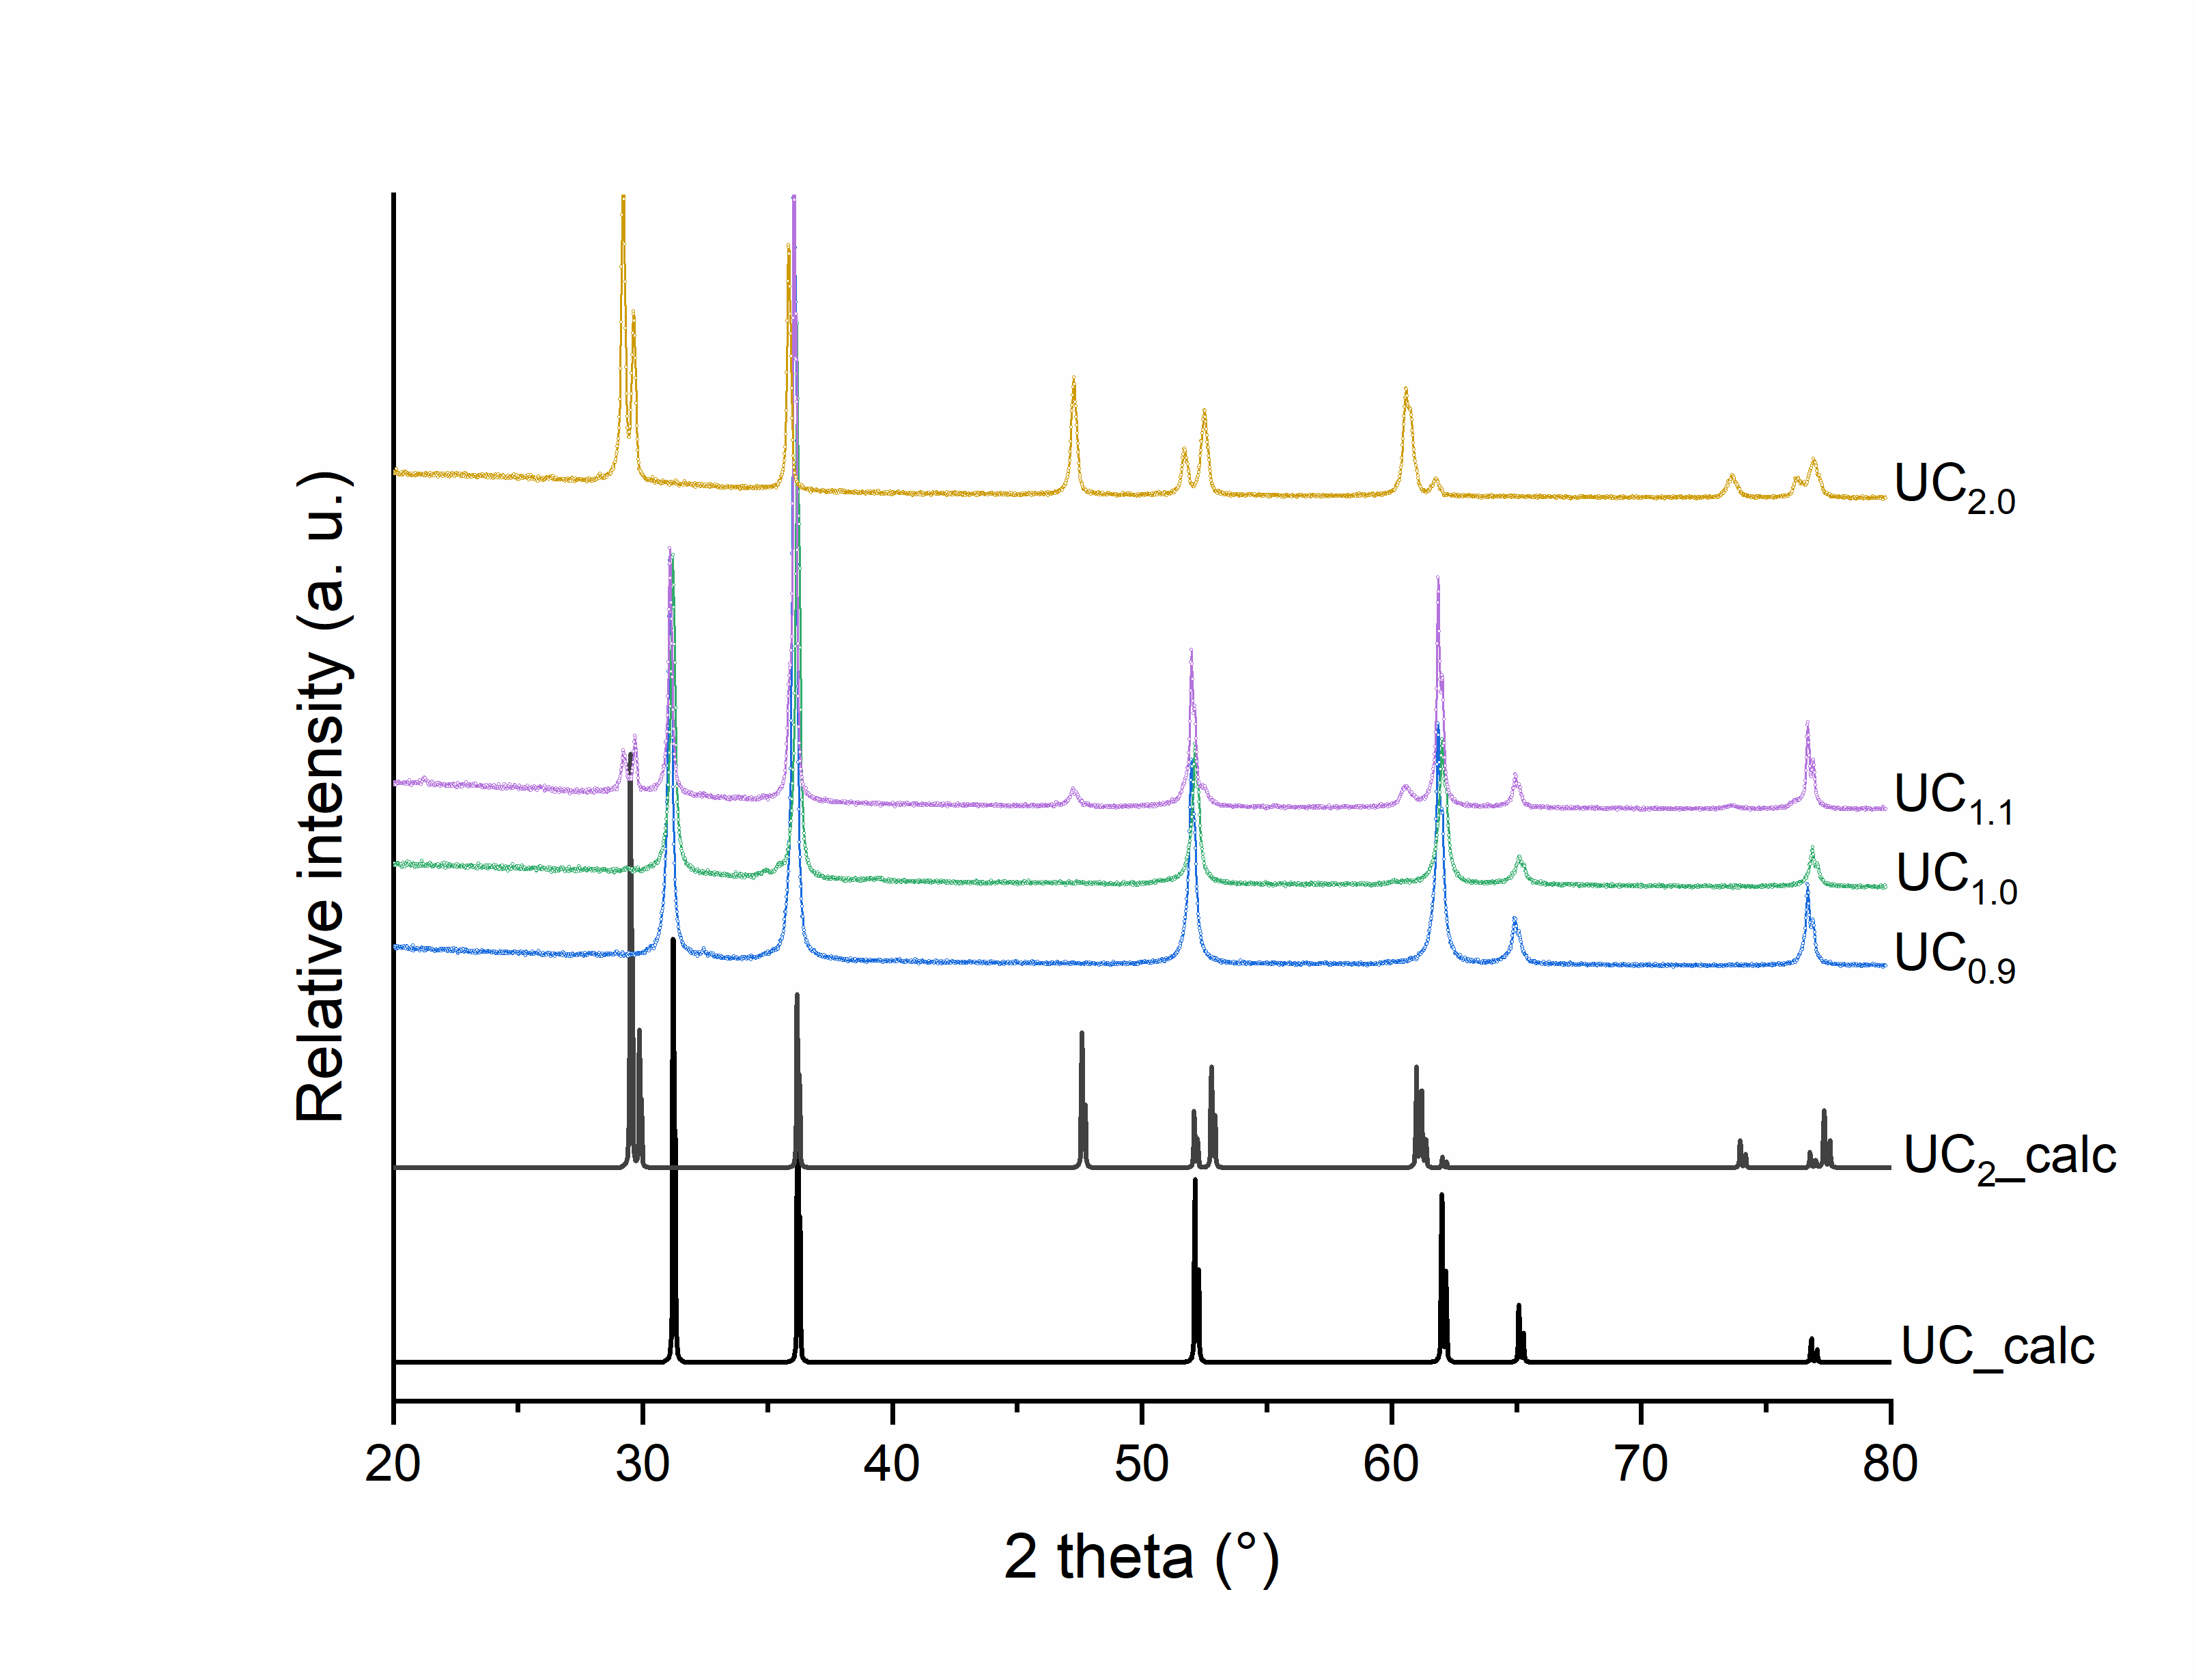
A precise x-ray diffraction analysis (Fig. 8) revealed that pure samples were obtained for the stoichiometric compositions UC1.0 and UC2.0 whereas mixtures of UC and -U and UC and UC2 were obtained for UC0.9 and UC1.1 respectively. The refined lattice parameters were found consistent with those reported in the literature for stoichiometric uranium carbides, with =4.956(1) Å for cubic UC (NaCl-type) and =3.524(1) Å and =5.991(1) Å for tetragonal UC2 (CaC2-type).
The measurements in the energy range of the U and x-ray absorption edges were carried out at the CAT-ACT beamline [31] of the KARA (Karlsruhe research accelerator) facility in Karlsruhe, Germany. The incident energies were selected using the 111 reflection from a double Si-crystal monochromator. The XAS scans were measured in the HERFD mode using an x-ray emission spectrometer [31]. Only one crystal-analyzer of the spectrometer was used in all the measurements. The sample, analyzer crystal and photon detector were arranged in the vertical Rowland geometry. The U HERFD spectra at the ( transitions) edge were obtained by recording the outgoing photons with an energy corresponding to the maximum of the U ( transitions) x-ray emission line, as a function of the incident energy, and the U HERFD at the ( transitions) edge was recorded at the maximum of the U ( transitions) line. The right emission energy was selected using the spherically bent Si220 crystal-analyzer (with 1 m bending radius) aligned at 75∘ Bragg angle for the measurements at the U edge and Ge777 at 77∘ Bragg angle for the measurements at the U edge. The HERFD data were recorded at one emission energy and the spectrometer was not moved between the scans. The spectral intensity was normalized to the incident flux. The total energy resolution was estimated to be 0.7 eV at the U edge and 2.6 eV at the U edge.
Samples were prepared and sealed in a special argon-filled container at the licensed laboratory of HZDR and were transported to KARA under inert conditions. All samples were mounted in the form of pellet pieces within triple holders with 8 m Kapton window on the front side, serving as first confinement. Three of such holders were mounted in one larger cell, with 13 m Kapton window on the front side. The second confinement chamber was constantly flushed with He. The entire spectrometer environment was contained within a He box to improve signal statistics.
The measurements in the energy range of the C ( transitions) edges of UC were performed at beamline 5.3.1 of the MAXlab [32]. C XAS data were measured in the total fluorescence yield (TFY) mode using a multichannel-plate detector. The incidence angle of the incoming photons was close to 90∘ to the surface of the sample. The monochromator resolution was set to 350 meV during the measurements.
Computational details
To apply the method of density functional theory taking into account the Coulomb interaction (DFT+), the full-potential local orbital (FPLO ver. 21.00-61) code (Ref.[33]; [www.FPLO.de]) was used. The calculations were performed in the full-relativistic mode. The exchange correlation potential was in the form of Perdew, Burke, and Ernzerhof (PBE) [34]. The band structure was calculated in the generalized gradient approximation (GGA). The default basis definitions for uranium and carbon atoms were applied, where the core electrons for uranium are up to the level while electrons are treated as valence ones and the levels up to are also included in the basis. For carbon, the electrons are treated as semi-core and the =3 levels are included in the basis in addition to valence and . The Coulomb interaction and Hund’s coupling parameters were set to 2.5 eV and 0.5 eV, respectively, for the shell. There is rather a consensus among researchers on these values for UC. The calculations were performed for the non spin-polarized case. The 40x40x40 -point mesh was used for UC and the 30x30x30 one for UC2. As convergence conditions, 10-10 for density and 10-8 Ry for the total energy were applied. The calculations were performed for experimental structures of UC and UC2 [23] without the relaxation procedure.
The experimental U HERFD-XAS and C XAS spectra of UC are also compared with the results of the XAS calculations using OCEAN which is the ab-initio DFT (PBE-GGA in this case) + Bethe-Salpeter equation (BSE) code for the calculations of core-level spectra.[35, 36] The code allows one to take into account the interaction of the valence-band electrons with the U (C ) core-hole and screening effects in the calculations of the U (C ) XAS spectra, respectively. The DFT+ approach was used with the help of Quantum Espresso v6.3 (Ref.[37, 38]; [www.quantum-espresso.org]) and the and values were set to 2.5 eV and 0.5 eV, respectively, for the uranium electrons. The norm-conserving PBE pseudopotential for carbon was taken from the PseudoDojo database [39]. The stringent version of the C pseudopotential of the valence configuration was used. The norm-conserving PBE pseudopotential for uranium was generated with the ONCVPSP v4.0.1 package [40] for the valence configuration using the PseudoDojo approach. The plane-wave cut-off energy was set to 65 Ry. The convergence threshold for density was 1.1x10⁻¹⁰ Ry. The -point grid for the calculation of the ground and final states as well as the real space mesh were 10x10x10 for UC and 10x10x6 for UC2. The 2x2x2 -point grid was used for the screening part of the calculations. The setting for the DFT and screening energy ranges were chosen to be 90 and 100 eV, respectively.
Acknowledgments
S.M.B. acknowledges support from the Swedish Research Council (research grant 2017-06465). S.B., L.A. and K.O.K. acknowledge support by the European Research Council under grant No. 759696. The computations and data handling were enabled by resources provided by the Swedish National Infrastructure for Computing (SNIC) at National Supercomputer Centre at Linköping University partially funded by the Swedish Research Council through grant agreement no. 2018-05973.
Author contributions statement
S.M.B. conceived, planned and conducted the experiments, performed the calculations and analyzed the results, S.B. and L.A. conducted experiments and analyzed the results, A.B. A.R. and T.V. conducted the experiments, K.O.K. planned and conducted the experiments, S.W. and O.T. prepared and characterized the samples. All authors reviewed the manuscript.
Additional information
Competing interests
The authors declare no competing interests.
Data availability
The datasets generated during and/or analysed during the current study are available from the corresponding author on reasonable request.
References
- [1] Itié, J. et al. High pressure X-ray absorption spectroscopy on uranium compounds. \JournalTitleInorganica Chimica Acta 140, 193–195, DOI: 10.1016/S0020-1693(00)81086-5 (1987).
- [2] Vigier, N. et al. New Data on the Structure of Uranium Monocarbide. \JournalTitleChem. Mater. 20, 3199–3204, DOI: 10.1021/cm8001783 (2008).
- [3] Carvajal Nuñez, U. et al. Coupling XRD, EXAFS, and 13C NMR to Study the Effect of the Carbon Stoichiometry on the Local Structure of UC1±x. \JournalTitleInorg. Chem. 52, 11669–11676, DOI: 10.1021/ic402144g (2013).
- [4] Erbudak, M. & Keller, J. Electronic structure of cubic uranium compounds. \JournalTitleZ Physik B 32, 281–286, DOI: 10.1007/BF01351505 (1979).
- [5] Ishii, T. Studies of uranium compounds by photoemission and bremsstrahlung isochromat spectroscopy. \JournalTitlePhysica B: Condensed Matter 186-188, 21–25, DOI: 10.1016/0921-4526(93)90486-P (1993).
- [6] Ito, T. et al. Electronic structure and Fermi surface of UC studied by high-resolution angle-resolved photoemission spectroscopy. \JournalTitleJournal of Magnetism and Magnetic Materials 226-230, 40–41, DOI: 10.1016/S0304-8853(00)00743-5 (2001).
- [7] Ejima, T. et al. Electronic structure of UC studied by X-ray photoemission and bremsstrahlung isochromat spectroscopy. \JournalTitlePhysica B: Condensed Matter 186-188, 77–79, DOI: 10.1016/0921-4526(93)90499-V (1993).
- [8] Eckle, M. et al. Electronic structure of UCx films prepared by sputter co-deposition. \JournalTitleJournal of Nuclear Materials 334, 1–8, DOI: 10.1016/j.jnucmat.2004.03.007 (2004).
- [9] Dillard, J. G. et al. Adsorption and reaction of iodine and methyl iodide with uranium monocarbide surfaces. \JournalTitleJ. Phys. Chem. 88, 5345–5352, DOI: 10.1021/j150666a048 (1984).
- [10] Ejima, T. et al. Line shapes of the XPS U 4f spectra in some uranium compounds. \JournalTitlePhys. Rev. B 53, 1806–1813, DOI: 10.1103/PhysRevB.53.1806 (1996).
- [11] Jilek, R. E. et al. Preparation of Epitaxial Uranium Dicarbide Thin Films by Polymer-Assisted Deposition. \JournalTitleChem. Mater. 25, 4373–4377, DOI: 10.1021/cm402655p (2013).
- [12] Kvashnina, K. O., Butorin, S. M., Martin, P. & Glatzel, P. Chemical State of Complex Uranium Oxides. \JournalTitlePhys. Rev. Lett. 111, 253002, DOI: 10.1103/PhysRevLett.111.253002 (2013).
- [13] Butorin, S. M., Kvashnina, K. O., Vegelius, J. R., Meyer, D. & Shuh, D. K. High-resolution X-ray absorption spectroscopy as a probe of crystal-field and covalency effects in actinide compounds. \JournalTitleProc. Natl. Acad. Sci. U.S.A. 113, 8093–8097, DOI: 10.1073/pnas.1601741113 (2016).
- [14] Vitova, T. et al. The role of the 5f valence orbitals of early actinides in chemical bonding. \JournalTitleNat Commun 8, 16053, DOI: 10.1038/ncomms16053 (2017).
- [15] Kvashnina, K., Kvashnin, Y. & Butorin, S. Role of resonant inelastic X-ray scattering in high-resolution core-level spectroscopy of actinide materials. \JournalTitleJournal of Electron Spectroscopy and Related Phenomena 194, 27–36, DOI: 10.1016/j.elspec.2014.01.016 (2014).
- [16] Kvashnina, K. O. & Butorin, S. M. High-energy resolution X-ray spectroscopy at actinide M4,5 and ligand K edges: what we know, what we want to know, and what we can know. \JournalTitleChem. Commun. 58, 327–342, DOI: 10.1039/D1CC04851A (2022).
- [17] Butorin, S. M., Kvashnina, K. O., Prieur, D., Rivenet, M. & Martin, P. M. Characteristics of chemical bonding of pentavalent uranium in La-doped UO2. \JournalTitleChem. Commun. 53, 115–118, DOI: 10.1039/C6CC07684J (2017).
- [18] Kvashnina, K. O. et al. A Novel Metastable Pentavalent Plutonium Solid Phase on the Pathway from Aqueous Plutonium(VI) to PuO2 Nanoparticles. \JournalTitleAngew. Chem. 131, 17722–17726, DOI: 10.1002/ange.201911637 (2019).
- [19] Pan, Z. et al. Nanoscale mechanism of UO2 formation through uranium reduction by magnetite. \JournalTitleNat Commun 11, 4001, DOI: 10.1038/s41467-020-17795-0 (2020).
- [20] Butorin, S. M. 3d-4f Resonant Inelastic X-ray Scattering of Actinide Dioxides: Crystal-Field Multiplet Description. \JournalTitleInorg. Chem. 59, 16251–16264, DOI: 10.1021/acs.inorgchem.0c02032 (2020).
- [21] Butorin, S. M. Advanced x-ray spectroscopy of actinide trichlorides. \JournalTitleJ. Chem. Phys. 155, 164103, DOI: 10.1063/5.0062927 (2021).
- [22] Butorin, S. M. et al. X-ray spectroscopic study of chemical state in uranium carbides. \JournalTitleJ Synchrotron Rad 29, 295–302, DOI: 10.1107/S160057752101314X (2022).
- [23] Austin, A. E. Carbon positions in uranium carbides. \JournalTitleActa Cryst 12, 159–161, DOI: 10.1107/S0365110X59000445 (1959).
- [24] Shi, H., Zhang, P., Li, S.-S., Sun, B. & Wang, B. Electronic structures and mechanical properties of uranium monocarbide from first-principles and calculations. \JournalTitlePhysics Letters A 373, 3577–3581, DOI: 10.1016/j.physleta.2009.07.074 (2009).
- [25] Ducher, R., Dubourg, R., Barrachin, M. & Pasturel, A. First-principles study of defect behavior in irradiated uranium monocarbide. \JournalTitlePhys. Rev. B 83, 104107, DOI: 10.1103/PhysRevB.83.104107 (2011).
- [26] Wdowik, U. D., Piekarz, P., Legut, D. & Jagło, G. Effect of spin-orbit and on-site Coulomb interactions on the electronic structure and lattice dynamics of uranium monocarbide. \JournalTitlePhys. Rev. B 94, 054303, DOI: 10.1103/PhysRevB.94.054303 (2016).
- [27] Vitova, T. et al. High energy resolution x-ray absorption spectroscopy study of uranium in varying valence states. \JournalTitlePhys. Rev. B 82, 235118, DOI: 10.1103/PhysRevB.82.235118 (2010).
- [28] Butorin, S. M. et al. Local Symmetry Effects in Actinide 4f X-ray Absorption in Oxides. \JournalTitleAnal. Chem. 88, 4169–4173, DOI: 10.1021/acs.analchem.5b04380 (2016).
- [29] Modin, A. et al. Indication of single-crystal PuO2 oxidation from O 1s x-ray absorption spectra. \JournalTitlePhys. Rev. B 83, 075113, DOI: 10.1103/PhysRevB.83.075113 (2011).
- [30] Rodríguez-Carvajal, J. Recent developments of the program fullprof. \JournalTitleNewsletter in Commission on Powder Diffraction (IUCr) 77, 12–19 (2001).
- [31] Zimina, A. et al. CAT-ACT–A new highly versatile x-ray spectroscopy beamline for catalysis and radionuclide science at the KIT synchrotron light facility ANKA. \JournalTitleReview of Scientific Instruments 88, 113113, DOI: 10.1063/1.4999928 (2017).
- [32] Denecke, R. et al. Beamline I511 at MAX II, capabilities and performance. \JournalTitleJournal of Electron Spectroscopy and Related Phenomena 101-103, 971–977, DOI: 10.1016/S0368-2048(98)00358-2 (1999).
- [33] Koepernik, K. & Eschrig, H. Full-potential nonorthogonal local-orbital minimum-basis band-structure scheme. \JournalTitlePhys. Rev. B 59, 1743–1757, DOI: 10.1103/PhysRevB.59.1743 (1999).
- [34] Perdew, J. P., Burke, K. & Ernzerhof, M. Generalized Gradient Approximation Made Simple. \JournalTitlePhys. Rev. Lett. 77, 3865–3868, DOI: 10.1103/PhysRevLett.77.3865 (1996).
- [35] Vinson, J., Rehr, J. J., Kas, J. J. & Shirley, E. L. Bethe-Salpeter equation calculations of core excitation spectra. \JournalTitlePhys. Rev. B 83, 115106, DOI: 10.1103/PhysRevB.83.115106 (2011).
- [36] Vinson, J. & Shirley, E. L. Fast, efficient, and accurate dielectric screening using a local real-space approach. \JournalTitlePhys. Rev. B 103, 245143, DOI: 10.1103/PhysRevB.103.245143 (2021).
- [37] Giannozzi, P. et al. QUANTUM ESPRESSO: a modular and open-source software project for quantum simulations of materials. \JournalTitleJ. Phys.: Condens. Matter 21, 395502, DOI: 10.1088/0953-8984/21/39/395502 (2009).
- [38] Giannozzi, P. et al. Advanced capabilities for materials modelling with Quantum ESPRESSO. \JournalTitleJ. Phys.: Condens. Matter 29, 465901, DOI: 10.1088/1361-648X/aa8f79 (2017).
- [39] van Setten, M. et al. The PseudoDojo: Training and grading a 85 element optimized norm-conserving pseudopotential table. \JournalTitleComputer Physics Communications 226, 39–54, DOI: 10.1016/j.cpc.2018.01.012 (2018).
- [40] Hamann, D. R. Optimized norm-conserving Vanderbilt pseudopotentials. \JournalTitlePhys. Rev. B 88, 085117, DOI: 10.1103/PhysRevB.88.085117 (2013).