The parallax and 3D kinematics of water masers in the massive star-forming region G034.43+0.24
Abstract
We report a trigonometric parallax measurement of 22 GHz water masers in the massive star-forming region G034.43+0.24 as part of the Bar and Spiral Structure Legacy (BeSSeL) Survey using the Very Long Baseline Array. The parallax is 0.330 0.018 mas, corresponding to a distance of 3.03 kpc. This locates G034.43+0.24 near the inner edge of the Sagittarius spiral arm and at one end of a linear distribution of massive young stars which cross nearly the full width of the arm. The measured 3-dimensional motion of G034.43+0.24 indicates a near-circular Galactic orbit. The water masers display arc-like distributions, possibly bow shocks, associated with winds from one or more massive young stars.
1 Introduction
G034.43+0.24 is a well-studied infrared dark cloud (IRDC) which hosts several massive protostars. Observations of its 1.2 mm dust emission reveal nine dense clumps (named MM1-9) which trace an elongated filamentary structure (See Figure 1 in Wang et al. (2006)). Methanol (Hu et al., 2016; Yang et al., 2017, 2019), water (Valdettaro et al., 2001; Wang et al., 2006) and hydroxyl masers (Qiao et al., 2014; Beuther et al., 2019) have been detected in several clumps toward this IRDC, and the water maser G034.43+0.24 in this region, which is the target of this paper.
Previous 3 mm continuum observations resolve G034.43+0.24 MM1 into seven dense cores (labeled MM1 a-g). The masses of the dense cores range from about 40 to 200 (Liu et al., 2022), contributing to a total mass of MM1 of several hundreds of solar masses and a bolometric luminosity of 3.2 10 within a diameter of 0.5 pc (Rathborne et al., 2005). Rathborne et al. (2011) reveal a complex kinematics of MM1, including scale-dependent velocity gradients and six outflow lobes associated with four independent outflows, which are seen in molecular lines of HCO+, CS, SiO, SO and CH3OH by the Atacama Large Millimeter/submillimeter Array’s Three-millimeter Observation of Massive Star-formation regions (ATOMS, Liu et al., 2020, 2022) survey.
A kinematic distance for G034.43+0.24 of 3.7 kpc was estimated from 13CO (1-0) (Simon et al., 2006) and CS (2-1) (Faúndez et al., 2004) observations. However, a trigonometric parallax of mas, corresponding to a distance of kpc, was measured by Kurayama et al. (2011) using the Japanese VLBI Exploration for Radio Astrometry (VERA) array. This parallax distance is less than half the kinematic distance, and this discrepancy makes estimation of physical parameters of this IRDC highly uncertain.
The primary aim of this paper is to obtain an independent parallax distance for G034.43+0.24 in order to resolve the current discrepancy, and accurately locate the dark cloud in the Galaxy. The Very Long Baseline Array (VLBA) observations presented here are part of the Bar and Spiral Structure Legacy (BeSSeL) Survey111http://bessel.vlbi-astrometry.org/, a Key Science Project of the National Radio Astronomy Observatory222The National Radio Astronomy Observatory is a facility of the National Science Foundation operated under cooperative agreement by Associated Universities, Inc.. Here, we report a new parallax and proper motion for the water masers associated with G34.43+0.24 MM1. In Section 2, we describe our observations and data reduction. The parallax and proper motions are reported in Section 3. In Section 4, we compare our parallax to the previous result, and briefly discuss the kinematics of the water masers and the arm association. We summarize our results in Section 5.
2 Observations and data reduction
The parallax observations were conducted under VLBA program BR198O. We observed the 616-523 rotational transition of the H2O molecule (rest frequency 22.23508 GHz). The observational setup and calibration procedures follow those described in Reid et al. (2009). In this section, we outline details specific to this observation. Seven epochs (2013 Nov. 06, 2014 Apr. 10, Jul. 22, Sep. 20, Nov. 01, Dec. 06, and 2015 Apr. 10) were observed, each spanning 7 hr. Four adjacent 16 MHz bands of right and left circular polarization were recorded. Spectral channels were spaced by 8 kHz, corresponding to a velocity of 0.11 km s-1. We observed four strong (“fringe-finder”) calibrators, J1638+5720, J1740+5211, J1824+1044, and J0019+7327, selected from the International Celestial Reference Frame 2 (ICRF2) catalogue (Fey et al., 2015) in order to monitor all systems. Instrumental delay and phase differences among individual intermediate-frequency (IF) bands were calibrated with J1638+5720.
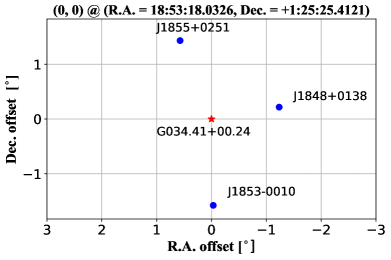
The observations included four 0.5-hr “geodetic blocks” intermixed with the manual phase calibrator and phase-referencing observations. The geodetic blocks were used to calibrate and remove clock drifts and uncompensated atmospheric delays (Reid et al., 2009). Phase-reference blocks involved switching between G034.43+0.24 and three background quasars selected from the BeSSeL calibrator survey (Immer et al., 2011) in the following sequence: T,Q1,T,Q1,T,Q1, T,Q2,T,Q2,T,Q2, T,Q3,T,Q3,T,Q3 …, where T is the target G034.43+0.24, and Q1, Q2, Q3 are J1848+0138, J18530010 and J1855+0251, respectively. The locations of these sources are shown in Figure 1. Individual scans were 32 s, typically yielding 20 s on-source after a slew/settle time of about 12 s. We selected the strongest maser channel at an LSR velocity, , of 56.98 km s-1 to serve as the interferometer phase reference in order to measure the position offsets of the quasars as well as other maser channels.
The data reduction was carried out using the NRAO’s Astronomical Image Processing System (Greisen, 2003, AIPS) together with a ParselTongue333https://www.jive.eu/jivewiki/doku.php?id=parseltongue:parseltongue (Kettenis et al., 2006) script. The well-calibrated maser spot and the background quasars were imaged with the AIPS task IMAGR. The background quasars were detected in synthesis maps at all epochs with SNR 10, except for J1853-0010 on 2014 July 22 which was not detected. The position offsets of the quasars relative to the reference maser spot were derived by fitting Gaussian brightness distributions using the AIPS task JMFIT. We used the AIPS task SAD to fit the positions of all the maser spots.
3 Results
3.1 Spatial Distribution and Internal Motion of Masers
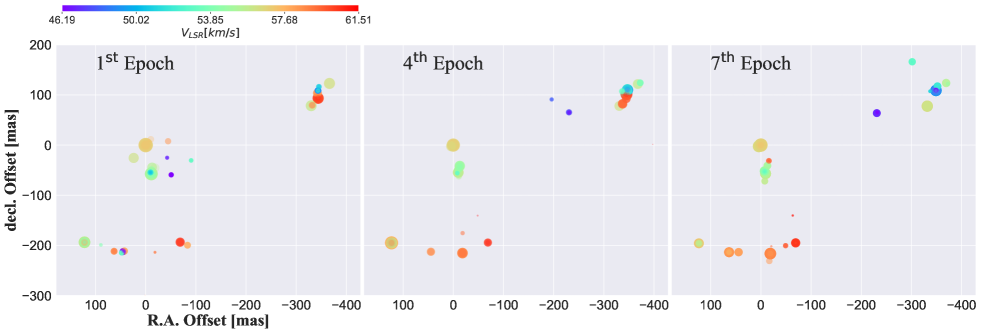
Figure 2 shows the spatial distribution of masers at the 1st, 4th and 7th epoch. The masers are distributed over a region of about 600 by 200 mas elongated in the SE-NW direction. The general morphology of the distribution remains stable over 1.5 yrs.
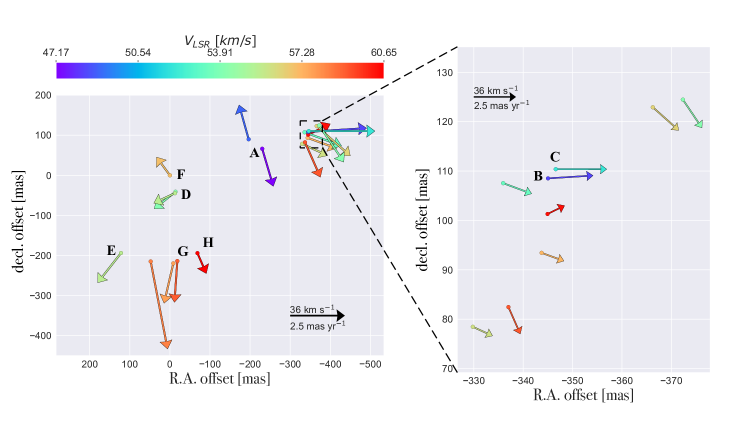
The internal motions of the water masers can be used to probe the gas kinematics within G034.43+0.24 MM1. The term “spot” used below refers to an individual maser emission peak in a single velocity channel, and the term “feature” refers to a collection of spots emitting at a similar position. We identified persistent maser spots by comparing their positions measured in the different epochs. For a given spectral channel, if their positions coincided within 5 mas yr-1, where is the time in years between epochs, we grouped them for parallax and proper motion fitting. For measurement of the internal motions, we grouped maser spots into a feature if they were detected over three or more continuous channels. We used a variance-weighted least-square fit to solve for a position offset at a reference epoch and a linear motion (relative to the reference maser spot at = 56.98 km s-1). We then calculated the average motion of all features and subtracted that from each feature’s motion. The internal proper motions are shown in Figure 3, ranging from 1.0 to 4.1 mas yr-1. Many of the maser features are moving in the SW-NE direction, roughly perpendicular to the SE-NW distribution. However, it is worth noting that the average motion subtracted from all spots is not guaranteed to place the motions in a reference frame of the central star(s), and one is free to add a single constant vector to all internal motions.
3.2 Parallax and Proper Motion Fitting
As discussed in Zhang et al. (2012), a maser “spot” can be a blend of multiple components, and this can lead to poor parallax results if the components change strength. Therefore, we selected spots that appeared not to be blended. We identified 47 maser spots belonging to nine maser features (labeled A through H, with E composed of two features at nearly the same position), which persisted over more than 5 epochs. We first performed individual fits for each spot with respect to each background quasar. In order to account for systematic errors owing to residual atmospheric delays and potential structural changes in a maser spot and/or a background quasar, we added “error floors” in quadrature with the formal Gaussian-fit uncertainties (which are dominated by thermal noise), separately for the R.A. and decl. measurements. The error-floors were iteratively adjusted until the per degree-of-freedom of the post-fit residuals was close to unity for both R.A. and decl.
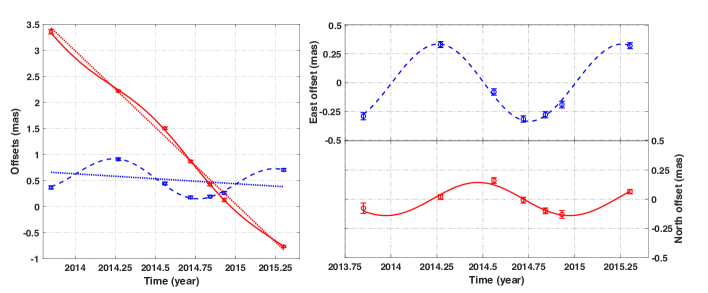
Figure 4 shows the results of parallax and proper motion fitting for the reference maser at = 56.98 km s-1. Figure 5 illustrates the individual solutions of parallax and proper motion for all spots relative to J1855+0251. While scatter in the proper motions is expected (owing to internal motions), the parallax values should be consistent. As shown in Figure 5, the parallaxes of features B, E1444Maser feature E1 and E2 appeared at slightly different positions, but are indistinguishable on a global maser spot map such as Figs. 2 and 3., F, and H are consistent within their uncertainties, whereas the parallax estimates for features A, C, D, E2 and G have large uncertainties and do not well agree. These maser spots likely suffer from spectral blending of variable emission components and were not used to estimate the parallax of G034.43+00.24.
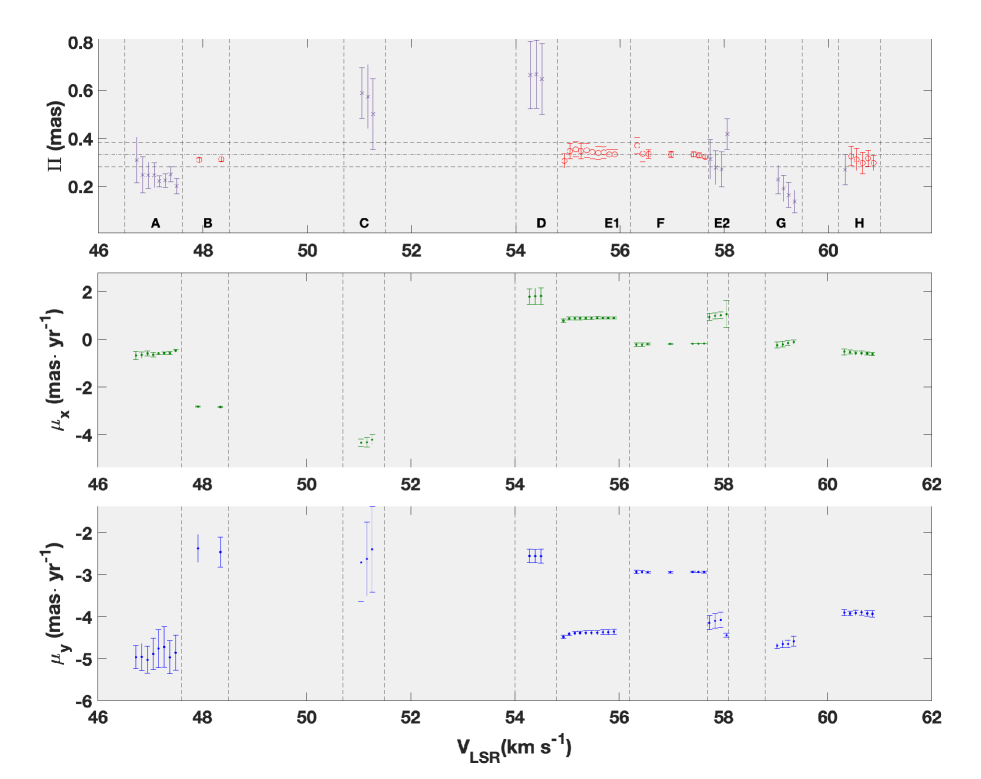
The parallaxes of the remaining 24 maser spots (red open circles in Figure 5) agree well. Therefore, we obtained a single solution, combining these spots, for each background quasar, by fitting a single parallax, while permitting different proper motions for each maser spot. The background quasar J18530010 exhibited extended structure toward the ENE direction, most likely owing to jetted emission, which significantly degraded the parallax fitting in the R.A. direction. For this background quasar, we obtained a parallax estimate of mas, which has twice the formal uncertainty compared to the unresolved quasars J1855+0251 and J1848+0108. Since the extended structure seen toward J18530010 is likely variable, and thus could systematically affect the parallax estimate, we discarded those data.
For our final result, we only used background quasars J1855+0251 and J1848+0108. Table 1 lists the combined results for the 24 good maser spots relative to these background quasars. We achieved a per degree-of-freedom ( in Table 1) near unity for error floor values of and mas in the R.A. and decl. directions, respectively. These indicate realistic single-epoch astrometric accuracies. We inflated the parallax uncertainty from the combined fits by a factor of in order to account for likely correlations among the positions of the maser spots caused by uncompensated atmospheric delays between G034.43+0.24 and a given background quasar. Then, we (variance-weighted) averaged the parallax results from the two good background quasars in order to obtain our final result: an annual parallax of mas, corresponding to a distance of kpc.
In order to estimate the motion of the central star, we first averaged the proper motion of spots in a feature and then took the midpoint of the extremes of the motions of all features as the best estimate for the motion of the star. We adopted one-quarter of the spread between the extremes as a conservative estimate of uncertainty. This yields an absolute proper motion of mas y-1.
| Background quasar | Feature |
|
|
|
|
||||||||
|---|---|---|---|---|---|---|---|---|---|---|---|---|---|
| J1855+0215 | B | 47.92 | |||||||||||
| 48.35 | |||||||||||||
| E1 | 54.93 | ||||||||||||
| 55.04 | |||||||||||||
| 55.15 | |||||||||||||
| 55.25 | |||||||||||||
| 55.36 | |||||||||||||
| 55.47 | |||||||||||||
| 55.58 | |||||||||||||
| 55.69 | |||||||||||||
| 55.79 | |||||||||||||
| 55.90 | |||||||||||||
| F | 56.33 | ||||||||||||
| 56.44 | |||||||||||||
| 56.55 | |||||||||||||
| 56.98 | |||||||||||||
| 57.41 | |||||||||||||
| 57.52 | |||||||||||||
| 57.63 | |||||||||||||
| H | 60.43 | ||||||||||||
| 60.54 | |||||||||||||
| 60.65 | |||||||||||||
| 60.76 | |||||||||||||
| 60.86 | |||||||||||||
| Combined | |||||||||||||
| J1848+0138 | B | 47.92 | |||||||||||
| 48.35 | |||||||||||||
| E1 | 54.93 | ||||||||||||
| 55.04 | |||||||||||||
| 55.15 | |||||||||||||
| 55.25 | |||||||||||||
| 55.36 | |||||||||||||
| 55.47 | |||||||||||||
| 55.58 | |||||||||||||
| 55.69 | |||||||||||||
| 55.79 | |||||||||||||
| 55.90 | |||||||||||||
| F | 56.33 | ||||||||||||
| 56.44 | |||||||||||||
| 56.55 | |||||||||||||
| 56.98 | |||||||||||||
| 57.41 | |||||||||||||
| 57.52 | |||||||||||||
| 57.63 | |||||||||||||
| H | 60.43 | ||||||||||||
| 60.54 | |||||||||||||
| 60.65 | |||||||||||||
| 60.76 | |||||||||||||
| 60.86 | |||||||||||||
| Combined | |||||||||||||
| Average |
3.3 3-dimensional kinematic distance
In order to provide an independent check on our parallax distance, we used our measured proper motion and to derive a 3-dimensional (3D) kinematic distance estimate. The 3D kinematic distance method has been described and evaluated by Reid (2022). From Bayes’ theorem, the posterior distribution function (PDF) for distance can be constructed from likelihood functions from measurements of and proper motions in Galactic longitude, , and latitude, (calculated from R.A. and decl. motions): , where RC indicates an assumed Galactic rotation curve and the prior distance probability function can be taken to be flat. The likelihood functions for the and either proper motion component are given by the following:
| (1) |
and
| (2) |
where and are the differences between the measured and the model values using equations given by Sofue (2011), and and are uncertainties in the measurements. Multiplying the component likelihoods leads to the 3D kinematic distance PDF.
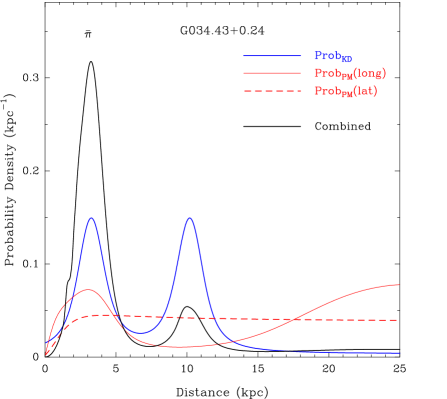
We adopted an LSR velocity of km s-1 for G034.43+00.24 which falls within the range of the water masers features and is close to that reported by Simon et al. (2006) for CO emission. Our proper motion measurements in equatorial coordinates transform to and mas y-1. When evaluating the likelihoods we used the Galactic rotation curve of Reid et al. (2019), based on parallax distances and proper motions of massive young stars. Fig. 6 shows likelihoods as a function of distance for the LSR velocity, yielding distance estimates of 3.3 or 10.2 kpc (with the standard 1-dimensional kinematic distance ambiguity), as well as for the proper motion in Galactic longitude and latitude. Note that the likelihood for the longitude motion strongly favors the near distance. Combining the individual likelihoods yields a 3D kinematic distance of kpc for G034.43+0.24. This is fully consistent with our parallax measurement.
With our 6-dimensional phase-space measurements, we can calculate the full 3-dimensional velocity vector of G034.43+00.24. Then, subtracting circular motion at its location in the Galaxy using the rotation curve of Reid et al. (2019), we found the peculiar (non-circular) motion components 555The uncertainties in the peculiar motions of G034.43+0.24 include the uncertainties in its distance, proper motions, and the underlying Galactic model of Reid et al. (2019). to be , , and km s-1, where is toward the Galactic center at the location of the source, is in the direction of Galactic rotation, and is toward the North Galactic Pole. Thus, the star(s) exciting the water masers in G034.43+00.24 are in a nearly circular Galactic orbit, characteristic of massive young stars.
4 Discussion
4.1 Comparison with previous results
For most sources with parallax distances measured by both the VERA project (see VERA Collaboration et al., 2020) and the BeSSeL Survey (see Reid et al., 2019), there is good agreement, i.e., the differences are generally within times their joint uncertainty. However, our measured distance for G034.43+0.24 of 3.03 kpc differs from the VERA result of kpc measured by Kurayama et al. (2011) by nearly eight times their joint uncertainty. While we are confident in our result, we can only offer some speculations as to why the Kurayama et al. (2011) parallax distance could be significantly different. Firstly, G034.43+0.24 has a Declination very close to zero, which can be problematic for the VERA array with only 4 antennas (Kurayama et al., 2011). Secondly, the Kurayama observations relied on a single background quasar. If that quasar experienced changes in structure over the time span of their observations, this could affect the parallax measurement (as we found for quasar J18530010), especially when only the R.A. component was measured in their case.
4.2 Water masers tracing dense gas bubbles
The absolute position of the reference maser spot at a of 56.98 km s-1 is , . 666The absolute position was determined by referencing the background quasar J1855+0251 located at , . By comparing the absolute position with the ALMA image by Liu et al. (2022) and Isequilla et al. (2021), as shown in Figure 7, the water maser clumps are associated in projection with subcore 1 (SC1) of MM1-a of IRDC G034.43+0.24.
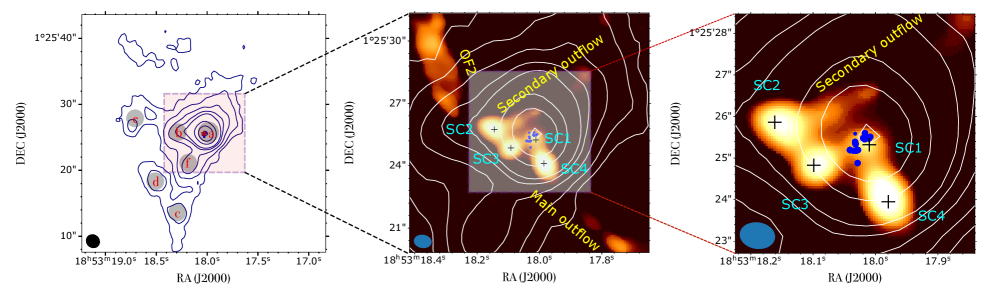
Water masers are seen in outflows and may be excited by shocks, e.g., J type (Elitzur et al., 1989) or C type (Kaufman & Neufeld, 1996), when outflowing gas interacts with ambient material. It is noteworthy that the internal proper motions of the maser features range from 14 to 58 km s-1 (derived from 1.0 to 4.1 mas yr-1 at the distance of 3.03 kpc), while the range of VLSR values is only about 13 km s-1. This asymmetry could occur if the masers are in a thin expanding shell, where tangential amplification lengths are the longest. To interpret the observed maser spatial-kinematics, we propose that the masers are tracing an expanding gas shell. However, as revealed by the ALMA observations of Liu et al. (2022), on larger scales than our masers the outflow activity is complex, including four outflow lobes launched from MM1-a, and suggesting that MM1-a may host multiple protostars. As shown in Figures 2 and 3, masers seem to assemble in a long arc, or more likely two arc-like clusters in the SE (R.A. offset mas) and NW (R.A. offset mas), moving toward the south and southwest, respectively. In addition, in Figure 3, we notice a radial velocity difference between the two clusters, which may suggest that they are excited by different protostars.
Considering the high degree of stellar multiplicity in massive star-formation regions, it is also possible that the water masers are tracing two dense gas bubbles compressed by outflows launched from multiple protostars in MM1-a. This is similar to the water masers in G011.920.61 and G035.020.35 reported by Moscadelli et al. (2019), which show inhomogeneous spatial distributions, separating into two clusters at different velocities, also suggesting that two YSOs excite different water maser clusters. Observations with higher resolution of at least 0.3′′ (half of the spread of the maser clusters) toward MM1-a using ALMA might be able to resolve multiple protostars.
4.3 Spiral arm association
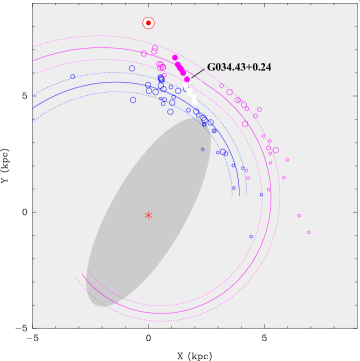
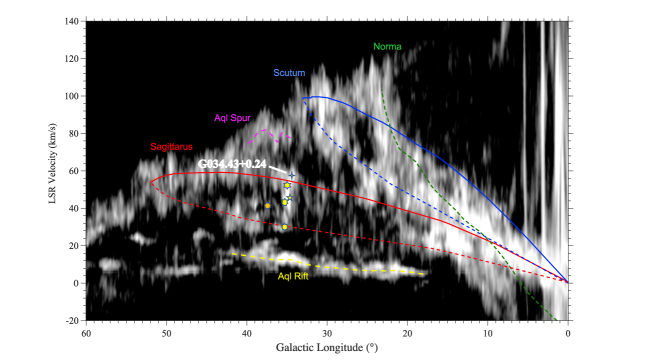
Our parallax, confirmed by its 3D kinematic distance, places G034.43+0.24 in the Sagittarius spiral arm as traced by massive young stars with maser parallaxes (Reid et al., 2019). At first glance this is surprising, as its of 55 km s-1 would favor placing it in the far portion of the Sagittarius spiral arm, well past the arm tangency, based on the longitude–velocity () trace of the spiral arm model shown in Fig. 9. However, G034.43+0.24 appears at one end of a “vertical” structure in the CO emission, which bridges the near and far sides of the Sagittarius arm in that plot. Sources in that bridge also display a linear pattern on a () map of the Milky Way (see filled purple circles in Fig. 8). 777A spurious linear structure in a map which points back to the Sun can be created from a group of sources at similar distances but with significant distance errors (so-called “fingers of God”). However, as can be seen in Fig. 8, the linear arrangement is slightly misaligned and does not directly point back to the Sun. Also, the parallax-distance errors are not large enough to cause the observed linear arrangement. Finally, since the sources also trace an unusual structure in space, we reject the “fingers of God” interpretation.
Table 2 lists parallax distances and full 3D kinematic information for the sources in the bridge. We note that the non-circular motions of all of these sources are small ( km s-1), which argues against a large-scale structure formed by the stellar wind of the precursor O-type star associated with supernova remnant W44 (see Reid & Ho, 1985). These sources span the extent of the Sagittarius arm at a pitch angle of ; were the arrangement to extend outside the arm it could be considered a spur, such as the white filled circles in Fig. 8 between the Scutum and Sagittarius spiral arms. However, being inside the arm they may trace an internal filamentary structure, possibly similar to the “Radcliffe wave” seen inside the Local spiral arm (Alves et al., 2020).
|
|
|
|
|
|
|
|
|||||||||||||||
|---|---|---|---|---|---|---|---|---|---|---|---|---|---|---|---|---|---|---|---|---|---|---|
| G035.200.74 | 2.19 | 30 7 | –0.18 0.50 | –3.63 0.50 | –4 7 | –8 7 | –8 6 | |||||||||||||||
| G035.020.34 | 2.33 | 52 5 | –0.92 0.90 | –3.61 0.90 | 12 9 | 5 8 | –1 10 | |||||||||||||||
| G035.201.73 | 2.40 | 43 3 | –0.68 0.44 | –3.60 0.44 | 3 4 | –2 4 | –5 5 | |||||||||||||||
| G034.791.38 | 2.62 | 45 5 | –0.31 0.62 | –2.80 0.72 | –7 8 | 4 7 | –6 8 | |||||||||||||||
| G034.430.24 | 3.03 | 55 5 | –0.96 0.93 | –3.38 0.50 | 1 10 | 2 11 | –2 8 |
Notes: Columns from left to right give Galactic coordinates, parallax distances, local standard-of-rest velocities, eastward and northward proper motion components, and peculiar (non-circular) motion components toward the Galactic center, in the direction of Galactic rotation and toward the North Galactic Pole. The peculiar motions are relative to the rotation curve of Reid et al. (2019) The astrometric parameters of G035.200.74, G035.020.34, G035.201.73, and G034.791.38 are taken from Reid et al. (2019).
5 Summary
We have measured an annual parallax of 0.330 0.018 mas for the H2O masers in the massive star-forming region G034.43+0.24, using VLBA observations as a part of the BeSSeL survey. The distance to the source is 3.03 kpc. We also estimate a 3D kinematic distance of 3.2 0.7 kpc, which agrees well with the parallax result. The parallax distance places G034.43+0.24 near the inner edge of the Sagittarius arm and at one end of a linear arrangement of massive star-formation regions, possibly tracing a filamentary structure like the “Radcliffe wave” in the Local arm.
Compared to previous ALMA observations, the water masers are associated in projection with IRDC G034.43+0.24 MM1-a which hosts multiple protostars. The masers are spread over a region of 600 by 200 mas elongated in the SE-NW direction. The masers likely assemble into two arc-like structures, with the southeast arc moving toward the south and the northwest arc moving southeast. We suggest that the arc-like structures may represent expanding dense gas bubbles compressed by outflows launched from different protostars.
This work is partly supported by the Natural Science Foundation of China (NSFC, grant No. U1831136, U2031212, and 11903079) and Shanghai Astronomical Observatory (N-2020-06-09-005). We thank Tie Liu for providing the ATOMS data.
References
- Alves et al. (2020) Alves, J., Zucker, C., Goodman, A. A., et al. 2020, Nature, 578, 237, doi: 10.1038/s41586-019-1874-z
- Astropy Collaboration et al. (2022) Astropy Collaboration, Price-Whelan, A. M., Lim, P. L., et al. 2022, ApJ, 935, 167, doi: 10.3847/1538-4357/ac7c74
- Beuther et al. (2019) Beuther, H., Walsh, A., Wang, Y., et al. 2019, A&A, 628, A90, doi: 10.1051/0004-6361/201935936
- Elitzur et al. (1989) Elitzur, M., Hollenbach, D. J., & McKee, C. F. 1989, ApJ, 346, 983, doi: 10.1086/168080
- Faúndez et al. (2004) Faúndez, S., Bronfman, L., Garay, G., et al. 2004, A&A, 426, 97, doi: 10.1051/0004-6361:20035755
- Fey et al. (2015) Fey, A. L., Gordon, D., Jacobs, C. S., et al. 2015, AJ, 150, 58, doi: 10.1088/0004-6256/150/2/58
- Greisen (2003) Greisen, E. W. 2003, in Astrophysics and Space Science Library, Vol. 285, Information Handling in Astronomy - Historical Vistas, ed. A. Heck, 109, doi: 10.1007/0-306-48080-8_7
- Hu et al. (2016) Hu, B., Menten, K. M., Wu, Y., et al. 2016, ApJ, 833, 18, doi: 10.3847/0004-637X/833/1/18
- Immer et al. (2011) Immer, K., Brunthaler, A., Reid, M. J., et al. 2011, ApJS, 194, 25, doi: 10.1088/0067-0049/194/2/25
- Isequilla et al. (2021) Isequilla, N. L., Ortega, M. E., Areal, M. B., & Paron, S. 2021, A&A, 649, A139, doi: 10.1051/0004-6361/202039974
- Kaufman & Neufeld (1996) Kaufman, M. J., & Neufeld, D. A. 1996, ApJ, 456, 250, doi: 10.1086/176645
- Kettenis et al. (2006) Kettenis, M., van Langevelde, H. J., Reynolds, C., & Cotton, B. 2006, in Astronomical Society of the Pacific Conference Series, Vol. 351, Astronomical Data Analysis Software and Systems XV, ed. C. Gabriel, C. Arviset, D. Ponz, & S. Enrique, 497
- Kurayama et al. (2011) Kurayama, T., Nakagawa, A., Sawada-Satoh, S., et al. 2011, PASJ, 63, 513, doi: 10.1093/pasj/63.3.513
- Liu et al. (2022) Liu, H.-L., Tej, A., Liu, T., et al. 2022, MNRAS, 510, 5009, doi: 10.1093/mnras/stab2757
- Liu et al. (2020) Liu, T., Evans, N. J., Kim, K.-T., et al. 2020, MNRAS, 496, 2790, doi: 10.1093/mnras/staa1577
- Moscadelli et al. (2019) Moscadelli, L., Sanna, A., Goddi, C., et al. 2019, A&A, 631, A74, doi: 10.1051/0004-6361/201936436
- Qiao et al. (2014) Qiao, H., Li, J., Shen, Z., Chen, X., & Zheng, X. 2014, MNRAS, 441, 3137, doi: 10.1093/mnras/stu776
- Rathborne et al. (2011) Rathborne, J. M., Garay, G., Jackson, J. M., et al. 2011, ApJ, 741, 120, doi: 10.1088/0004-637X/741/2/120
- Rathborne et al. (2005) Rathborne, J. M., Jackson, J. M., Chambers, E. T., et al. 2005, ApJ, 630, L181, doi: 10.1086/491656
- Reid (2022) Reid, M. J. 2022, AJ, 164, 133, doi: 10.3847/1538-3881/ac80bb
- Reid et al. (2016) Reid, M. J., Dame, T. M., Menten, K. M., & Brunthaler, A. 2016, ApJ, 823, 77, doi: 10.3847/0004-637X/823/2/77
- Reid & Ho (1985) Reid, M. J., & Ho, P. T. P. 1985, ApJ, 288, L17, doi: 10.1086/184412
- Reid et al. (2009) Reid, M. J., Menten, K. M., Brunthaler, A., et al. 2009, ApJ, 693, 397, doi: 10.1088/0004-637X/693/1/397
- Reid et al. (2019) —. 2019, ApJ, 885, 131, doi: 10.3847/1538-4357/ab4a11
- Robitaille (2019) Robitaille, T. 2019, APLpy v2.0: The Astronomical Plotting Library in Python, 2.0, Zenodo, Zenodo, doi: 10.5281/zenodo.2567476
- Simon et al. (2006) Simon, R., Rathborne, J. M., Shah, R. Y., Jackson, J. M., & Chambers, E. T. 2006, ApJ, 653, 1325, doi: 10.1086/508915
- Sofue (2011) Sofue, Y. 2011, PASJ, 63, 813, doi: 10.1093/pasj/63.4.813
- Valdettaro et al. (2001) Valdettaro, R., Palla, F., Brand, J., et al. 2001, A&A, 368, 845, doi: 10.1051/0004-6361:20000526
- VERA Collaboration et al. (2020) VERA Collaboration, Hirota, T., Nagayama, T., et al. 2020, PASJ, 72, 50, doi: 10.1093/pasj/psaa018
- Wang et al. (2006) Wang, Y., Zhang, Q., Rathborne, J. M., Jackson, J., & Wu, Y. 2006, ApJ, 651, L125, doi: 10.1086/508939
- Yang et al. (2019) Yang, K., Chen, X., Shen, Z.-Q., et al. 2019, ApJS, 241, 18, doi: 10.3847/1538-4365/ab06fb
- Yang et al. (2017) Yang, W., Xu, Y., Chen, X., et al. 2017, ApJS, 231, 20, doi: 10.3847/1538-4365/aa6ff3
- Zhang et al. (2012) Zhang, B., Reid, M. J., Menten, K. M., & Zheng, X. W. 2012, ApJ, 744, 23, doi: 10.1088/0004-637X/744/1/23
Appendix A SUPPLEMENTAL MATERIAL
| Feature |
|
|
|
|
|
|
||||||||||||
|---|---|---|---|---|---|---|---|---|---|---|---|---|---|---|---|---|---|---|
| 1(E) | 55.47 | 121.98 | -193.84 | 1.07 | -1.36 | 61.3 | ||||||||||||
| 2(H) | 60.65 | -68.69 | -194.04 | -0.41 | -0.94 | 12.7 | ||||||||||||
| 3(G) | 59.03 | -18.50 | -213.84 | 0.13 | -1.88 | 1.3 | ||||||||||||
| 4 | 57.73 | -8.53 | -219.55 | 0.42 | -1.83 | 3.6 | ||||||||||||
| 8 | 58.36 | 47.92 | -214.80 | -0.77 | -4.01 | 2.3 | ||||||||||||
| 9(F) | 56.98 | 0.00 | 0.00 | 0.61 | 0.83 | 560.3 | ||||||||||||
| 10 | 54.06 | -13.96 | -40.99 | 0.97 | -0.78 | 0.9 | ||||||||||||
| 11(D) | 55.47 | -12.69 | -44.45 | 0.97 | -0.46 | 16.2 | ||||||||||||
| 12 | 48.94 | -196.45 | 89.97 | 0.43 | 1.57 | 0.9 | ||||||||||||
| 13(A) | 47.17 | -230.25 | 66.25 | -0.51 | -1.72 | 0.5 | ||||||||||||
| 14 | 56.01 | -329.81 | 78.44 | -1.17 | -0.53 | 37.1 | ||||||||||||
| 15 | 59.14 | -337.01 | 82.44 | -0.70 | -1.60 | 3.7 | ||||||||||||
| 16 | 57.19 | -343.74 | 93.42 | -1.32 | -0.48 | 3.5 | ||||||||||||
| 17 | 60.43 | -344.94 | 101.29 | -1.01 | 0.50 | 15.4 | ||||||||||||
| 18 | 53.31 | -335.95 | 107.54 | -1.70 | -0.63 | 4.6 | ||||||||||||
| 19(B) | 48.35 | -345.03 | 108.51 | -2.67 | 0.17 | 0.9 | ||||||||||||
| 20(C) | 52.02 | -346.60 | 110.37 | -3.02 | 0.00 | 15.3 | ||||||||||||
| 21 | 56.44 | -366.26 | 122.90 | -1.53 | -1.37 | 45.5 | ||||||||||||
| 22 | 54.07 | -372.35 | 124.45 | -1.13 | -1.68 | 3.3 |
Notes: The letters A-H in parentheses are the same as Fig. 3, Fig. 5 and Table 1. VLSR is for the peak channel of a maser feature. R.A. and decl. offset represent the position offsets relative to the position of the reference maser at , . Brightness is the peak at the epoch that a maser feature first appeared.