[1]\fnmSabyasachi \surBhattacharya
1]\orgdivAgricultural and Ecological Research Unit, \orgnameIndian Statistical Institute, \orgaddress\street203, B. T. Road, \cityKolkata, \postcode700108, \stateWest Bengal, \countryIndia
Pesticide Mediated Critical Transition in Plant-Pollinator Networks
Abstract
Mutually beneficial interactions between plant and pollinators play an essential role in the biodiversity, stability of the ecosystem and crop production. Despite their immense importance, rapid decline events of pollinators are common worldwide in past decades. Excessive use of chemical pesticides is one of the most important threat to pollination in the current era of anthropogenic changes. Pesticides are applied to the plants to increase their growth by killing harmful pests and pollinators accumulates toxic pesticides from the interacting plants directly from the nectar and pollen. This has a significant adverse effect on the pollinator growth and the mutualism which in turn can cause an abrupt collapse of the community however predicting the fate of such community dynamics remains a blur under the alarming rise in the dependency of chemical pesticides. We mathematically modeled the influence of pesticides in a multispecies mutualistic community and used 105 real plant-pollinator networks sampled worldwide as well as simulated networks, to assess its detrimental effect on the plant-pollinator mutualistic networks. Our results indicate that the persistence of the community is strongly influenced by the level of pesticide and catastrophic and irreversible community collapse may occur due to pesticide. Furthermore, a species rich, highly nested community with low connectance and modularity has greater potential to function under the influence of pesticide. We finally proposed a realistic intervention strategy which involves the management of the pesticide level of one targeted plant from the community. We show that our intervention strategy can significantly delay the collapse of the community. Overall our study can be considered as the first attempt to understand the consequences of the chemical pesticide on a plant-pollinator mutualistic community.
keywords:
Environmental contamination, Plant-pollinator network, Tipping, Intervention1 Introduction
Plant-pollinator interaction is vitally important to terrestrial ecosystems and to crop production. It plays a key role in plant community assembly (Bruno et al, 2003; Ollerton et al, 2011; Wright et al, 2017; Hale et al, 2020) and thus provides critical ecosystem services with immense economic and aesthetic value (Klein et al, 2007; Potts et al, 2016; Requier et al, 2022; Gallai et al, 2009). Despite their immense importance, rapid decline events of many pollinators are frequent in recent years (Burkle et al, 2013; Rhodes, 2018).An important issue today is to determining how human activities impact the varied relationships between plants and their insect pollinators for the sake of conservation.
Some major anthropogenic threats to pollinators in the face of current global changes includes habitat loss and fragmentation, chemical contamination, warming and climate change, parasite infection and invasion of alien species (Harrison and Winfree, 2015; Nicolson and Wright, 2017; Potts et al, 2010; Dicks et al, 2021). Habitat loss and fragmentation due to the transformation of grasslands into farmland or urbanization, reduces the fraction of interaction between the plant and their pollinators and hence decreases the persistence of the system (McWilliams et al, 2019; Spiesman and Inouye, 2013). Climate warming affects the pollination by altering the abundance and distribution of plants (Arft et al, 1999; Inouye et al, 2003) and by creating temporal mismatch between plant and pollinators (Hegland et al, 2009). Disease by parasite infection has caused some major pollinator decline events in recent years (Goulson et al, 2015). Invasive species can reorganize the interactions, thus posing a risk to community stability(Vanbergen et al, 2018). These several factors can cause an abrupt and often irreversible community collapse of such mutualistic network, known as tipping (Lever et al, 2014; Memmott et al, 2004). Although there is a long list of potential causes of the decline of pollinators, the role of toxic contamination through agricultural pesticides and fertilizers, etc. is significant but rarely studied.
The intensification of agriculture and increasing reliance on agrochemicals makes pollinators chronically exposed to contaminations. Contamination from agriculture includes commonly used pesticides (Sponsler et al, 2019), fungicides and herbicides (Belsky and Joshi, 2020), and heavy metal contamination from the soil fertilizers (Nieminen et al, 2001). Pollinators may be exposed to contamination in numerous ways, mainly thorough ingestion of contaminated pollen and nectar (Mitchell et al, 2017), or exposure to contaminated nesting sited or materials which can impose variety of lethal and sub-lethal effect on them (Whitehorn et al, 2012; Henry et al, 2012; Tsvetkov et al, 2017; Cresswell, 2011; Bryden et al, 2013; Godfray et al, 2014). Lethal or direct effect includes reduction in the growth rate (Whitehorn et al, 2012) and rise in the mortality rate of pollinator and their larvae due to the accumulated contamination (Henry et al, 2012; Tsvetkov et al, 2017). Moreover, impairment of normal biological behaviours of pollinators such as memory and olfactory learning, navigation, foraging and feeding behaviour is seen due to contamination accumulation in several studies (Schneider et al, 2012; Sponsler et al, 2019; Piiroinen and Goulson, 2016). Furthermore, delayed larval and pupal developments is observed in laboratory studies which can decrease the time niche overlap between plant and pollinators for seasonal flowering plants (Wu et al, 2011). Overall the factors diminish the strength of the plant-pollinator mutual disruption by altering the pollinator visitation rate (Sponsler et al, 2019) and can be considered as sub-lethal effects. Exposure to chemical contamination can also compound the effects of other stressors on pollinator populations, such as loss of habitat and exposure to pathogens and diseases (Di Prisco et al, 2013).
Mathematical models played an important role to access the effect of current anthropogenic changes on plant-animal mutualistic community. Mutualistic networks are highly heterogeneous in degree distribution (Bascompte and Jordano, 2007), has moderate connectance (Valdovinos, 2019), moderate modularity (Olesen et al, 2007) and importantly, high nestedness (Bascompte et al, 2003; Burgos et al, 2007; Zhang et al, 2011). Nestedness promotes the species coexistence by reducing the interspecific competition (Bastolla et al, 2009), promoting complexity-stability relationship (Okuyama and Holland, 2008). These structural properties are responsible for the abrupt collapse of the whole community (Lever et al, 2014), i.e., the tipping, at some critical threshold of declining mutualistic strength or increasing mortality of pollinators, in the face of current anthropogenic changes. Metacommunity models of mutualistic species is studied considering habitat loss as a parameter, showing that there is a habitat loss threshold after which whole community collapses (Fortuna and Bascompte, 2006) and the number of interaction of the network reduces suddenly (Fortuna et al, 2013). Other environmental stressors affecting mutualistic interaction strength by causing phenological change of species can magnify the effect of habitat loss, when acts together (Revilla et al, 2015). Epidemic models are developed (Truitt et al, 2019; Proesmans et al, 2021) to study the disease spread on plant-pollinator network, and nestedness is shown to promote disease persistence as highly generalist plants acts as hubs of pathogen transmission. A mathematical model incorporating the effect of the temperature on the psychological trait parameters such as growth, mortality etc. of a mutualistic network is studied (Bhandary et al, 2022), where global temperature rise is shown to cause abrupt pollinator decline.
Environmental contamination, one of the detrimental consequences of current global changes, is an important driver of species demographic properties of such mutualistic communities. Few previous studies investigated the effect of toxins for antagonistic interactions (Huang et al, 2015; Garay-Narváez et al, 2013), but the understanding for mutualistic interaction remains a blur. Wang et al (2020) recently studied a single plant-pollinator system under pesticide exposure. Transitions to the bistable state and consequently pollinator extinction emerges as a result of increasing pesticide use. In real world, a plant-pollinator mutualistic community involves multiple species and posses significantly different topological properties from the antagonistic networks which can largely influence its dynamics (Bastolla et al, 2009; Lever et al, 2014) under the environmental stress. So study on the role of contamination on a multispecies mutualistic community is still lacking to best our knowledge.
To address this gap, we considered a mathematical model of a multispecific mutualistic community, where plants are exposed to environmental contamination. Pollinators accumulates contamination from the interacting plants which alters several trait parameters of the system. Our research addressed following interrelated questions: (1) what is the essential role of toxin on the persistence and abrupt collapse of a mutualistic community? (2) what is the role of several network topological properties to maintain the diversity of the system on the onset of environmental contamination? This will be done with the help of a mathematical model of multispecies mutualistic community, where physiological traits of pollinators are influenced by environmental contamination accumulated from the plant. Furthermore, we proposed here a possible intervention strategy related to the network structure of the system to evade the tipping point of the community.
2 Method
2.1 Mathematical model
An ecologically realistic mathematical model of a mutualistic community incorporates the following basic properties such as intrinsic growth, intra and interspecific competition and mutualistic interaction between plant and pollinators. Let and be the abundance of the plant and pollinators, respectively. Following Bastolla et al (2009), the equations for the rate of change of and are given by:
| (1) |
, where and are the plant and pollinator richness in the community. Description of the other parameters are the following. and are the intrinsic growth rate of plant and pollinators, respectively, in the absence of competition and mutualism. The degree of the mutualism can be categorize in two ways, obligate and facultative, depending the sign of . If the population persists in the absence of mutualism, it is called facultative mutualism and is positive in this case. On the opposite, is negative for the case of obligate mutualism, where species cannot persists in the absence of mutualism. We assumed a common value as the intrinsic growth rate of all species, for the sake of simplicity. represents the intra (for ) and interspecific (for ) competition between plant or pollinators. Usually and so we assumed and , for all plant and pollinators. is the per-capita mutualistic benefit received by plant from the pollinator and similarly is the per-capita mutualistic benefit received by pollinator from the plant . The parameters and are the strength of mutualistic interactions, which takes the following form . Here ’s are the elements of the adjacency matrix of the network, if plant and pollinator is connected, and otherwise. is the normalized mutualistic strength and is the degree if the plant or pollinators. Here the parameter determines the trade-off between mutualistic strength and the degree of the species and hence is associates mutualism with the network topology. means the mutualistic strengths are independent of the network structure. In contrast, means there is a full trade-off, gain from the mutualism of a species from the interacting species is splitted by the number of interactions and weakened the mutualism between each interacting species. Between the two extreme cases, we took following previous studies (Rohr et al, 2014; Jiang et al, 2019; Meng et al, 2020). is the half saturation constant, as the mutualistic benefit will saturate with the abundance of the interactive partners, and the Holling type response was first introduced by Okuyama and Holland (2008) in mutualistic network model. is the decline rate of the pollinators due to the external effects, and we took for simplicity. Finally, () are the constant immigration rates of plant (pollinators), which takes typically small value and thus have a little effect on the dynamics.
2.1.1 Incorporation of the effect of contamination
A simple approach to model the internal concentration of contamination (or body burden) of a species, i.e., the ratio of the total contamination accumulation to the biomass, can be written by the following form (Luoma and Rainbow, 2005; Veltman et al, 2008):
| (2) |
where is the internal concentration of the contamination time . and are the inflow of the contamination coming from environment and food, respectively, and is the constant loss rate. A general assumption in modeling the dynamics of a system under the effect of contamination is that, the dynamics of the internal contamination concentration is much faster compared to the population dynamics. So it approaches the steady state before the a significant change in the population dynamics (Huang et al, 2015; Prosnier et al, 2015; Kooi et al, 2008). By equating to in equation 2, we get the steady-state approximation of the internal contamination concentration () as:
| (3) |
which is basically proportional to the sum of uptakes from the environment and food. We can write , as,
| (4) |
is the concentration of the contamination in the environment, denotes uptake constant in the body, A is assimilation efficiency, E is egnation rate, is the concentration in the food intake.
Plants receive contamination directly due to the use of pesticides and other agrochemicals. So in case of plants. Let be the net uptake rate of the plant. Then using equation 4, the contamination burden of the plant, becomes
| (5) |
where is the contamination concentration imposed into the plant. Now pollinators accumulate contamination, only when they visit plants and there is no source of direct contamination intake from the environment. Thus for pollinators. The contamination body burden of pollinator , , depends on the contamination burden of the plant it interacts with (i.e. ) together with the mutualistic benefit it receives from that plant, , and net assimilation coefficient, (see Fig. 1.A). Combining the terms according to equation 4 and taking the summation over all plants, the expression of becomes
| (6) |
For simplicity, we assumed , for all plants and , for all pollinator .
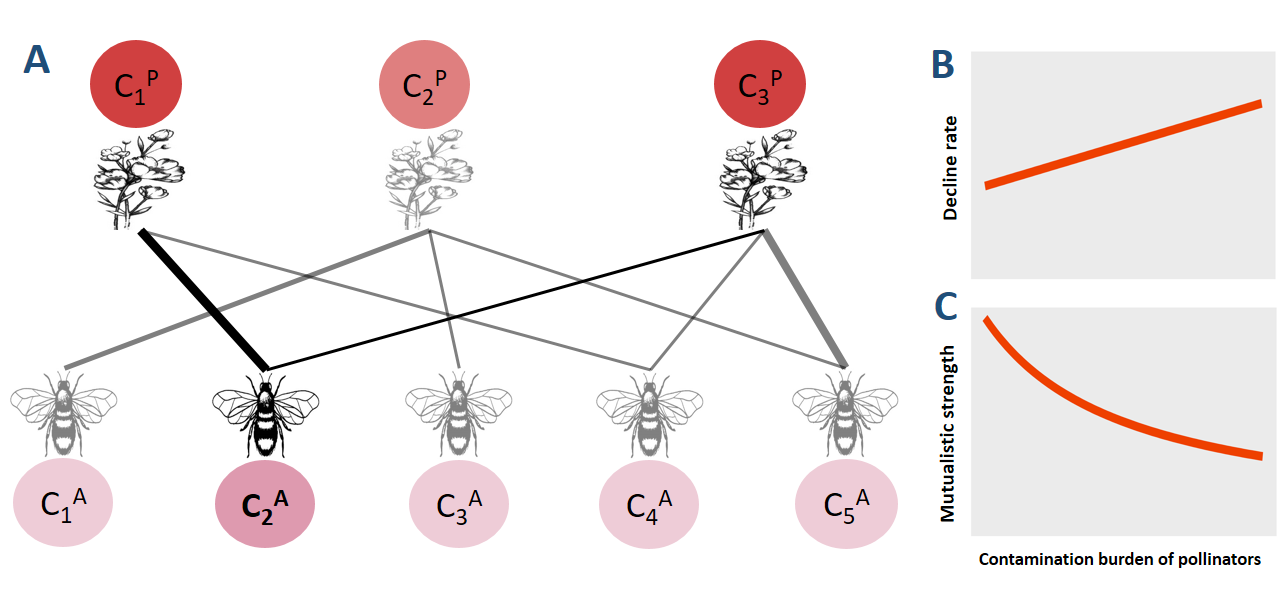
Responses due to the contamination: Commonly used pesticides and insecticide mainly contains a chemical named Neonicotinoid, which is accumulated by the pollinators and has variety of lethal and sublethal effect on the pollinator growth. Plenty of experimental studies found the positive association between the contamination burden of the pollinator with their direct mortality (see Henry et al (2012); Whitehorn et al (2012); Kasiotis et al (2014)). So we assumed that contamination mediated decline rate of the pollinators, , as a linearly increasing function of its body burden;
| (7) |
where is the effect parameter (see Fig. 1.B). Furthermore, the pollinator visitation rate in plants decreases with the accumulated toxin which in turn decreases the mutualistic strength between plants and pollinators (Sponsler et al, 2019; Wu et al, 2011; Schneider et al, 2012; Piiroinen and Goulson, 2016). Keeping this in mind, our modified mutualistic interaction strengths (of pollinator with plant ) and (of plant with pollinator ) takes the form:
| (8) |
which is a decreasing function of contamination body burden of pollinator (Fig. 1.C). We assumed and , for all pollinators and plants. Finally, pesticides can increase the plant growth rate by killing the harmful pests. So the plant growth rate takes the form:
| (9) |
which is a monotonically increasing function of the pesticide used and saturates at some specific value.
Final model: Incorporating the responses of the contamination from equation 7, 8 and 9, our final model becomes:
| (10) |
2.2 Simulations to meet our objectives
2.2.1 Objective 1
To meet our first objective, i.e., to study the role of toxin on the persistence and abrupt collapse of the community, we choose as one of the bifurcation parameter. Mutualistic communities experiences abrupt and irreversible collapse with deteriorating mutualistic strength, i.e., there exists a certain threshold of , below which whole community collapses. To study the role of contamination on the threshold of , we plotted equilibrium abundances of the system with respect to the bifurcation parameter , for systematically increasing contamination level.
Further to study the role of contamination on the abrupt collapse of the system, we plotted the equilibrium abundance of the system with respect to contamination level as a bifurcation parameter, for different levels of mutualistic strength ().
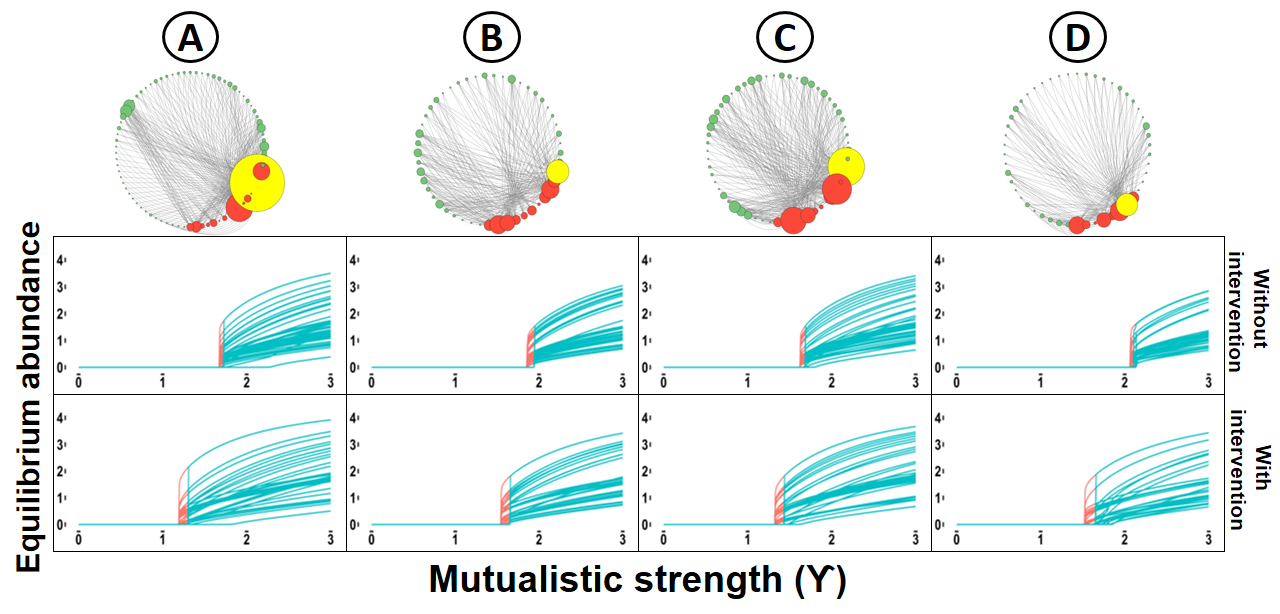
We first demonstrate the above results using four empirical networks: A ( and the number of links ) from empirical data from Hicking, Norfolf, UK; B ( and ) from Tenerife, Canary Islands; C ( and ) from North Carolina, USA; D ( and ) from Hestehaven, Denmark (available in Web Of Life database (https://www.web-of-life.es), with ID 6, 8, 25 and 38, respectively).
Further to illustrate the generality of the result, we plotted the minimum mutualistic strength levels (below which system collapses) for increasing levels of contamination and also maximum contamination tolerance level (after which system collapses) for decreasing mutualistic strength for all 105 empirical networks, described below.
Description of the data set: We used 105 real mutualistic networks in our study from the available 153 networks in the Web Of Life database (https://www.web-of-life.es). We first excluded the very large networks which contains 100 or more species for the sake of simulation run time. Next we excluded that which contains more plants than pollinators, as this is a basic structural properties of all empirical mutualistic networks (ref…). These two filtration leads to ultimately 105 networks with variety of network architectural properties and covers wide range of geographic locations.
2.2.2 Objective 2
Our second objective in this study was to verify the role of different network architectural properties on maintaining the species coexistence. We mainly focus on four network properties: (i) species richness, which is the total number of surviving species in the community; (ii) connectence or linkage density, the proportion of the realised link to the total number of possible links in the community; (iii) nestedness, the measure of the tendency for nodes to interact with subsets of the interaction partners of better-connected nodes (Bascompte et al, 2003; Bascompte and Jordano, 2007; Bastolla et al, 2009); (iv) modularity, the measure of the tendency of the network to subdivide into modules where species belonging to the same module interacts more than other modules (Olesen et al, 2007; Jordano, 1987). We calculated nestedness using the formula
| (11) |
following Bastolla et al (2009). Here and are the pollinator and plant richness, , is the degree of species and is the number of times species and interacts with the same mutualistic partner. Further we calculate nestedness using the modularity function using ”igraph” package in R software. We find the level of minimum mutualistic strength for varying contamination level and also the maximum toxin tolerance for different level of mutualistic strength, for all the 105 empirical networks. We finally find the correlation between the threshold of the tipping parameters with the four network properties to find their role in species coexistence under the influence of contamination in the environment.
Plant-pollinator mutualistic networks are highly nested compared to antagonistic networks (Bascompte et al, 2003; Bascompte and Jordano, 2013; Burgos et al, 2007; Bastolla et al, 2009), that is, interaction partners of specialist species are proper subsets of that of the generalist species. Pollinators, which interacts with common plants, have indirect positive effect on each other. Nestedness promotes this indirect positive effect by creating a central core of interactions, and thus increase biodiversity (Bascompte et al, 2003; Bastolla et al, 2009). But the dependency on each other increases with abundance loss and as a result, the whole community collapses together abruptly when a tipping point is reaches, due to its nested structure (Lever et al, 2014). To investigate the role of nestedness on the species coexistence and the tipping of the community under the influence of contamination, we find the minimum mutualistic strength threshold and maximum contamination tolerance levels, for varying the nestedness of a network. To do so, we generated mutualistic networks with specified connectence and nestedness using the algorithm proposed in Medan et al (2007), further used by Lever et al (2014). Results were averaged over 10 replications. We state the algorithm to generate a mutualistic network with specified nestedness in brief below.
Simulated network: We used the algorithm proposed by Medan et al (2007), further used by Lever et al (2014), to generate a mutualistic network with specified nestedness. First, connectence and forbidden links are fixed. Forbidden links are interactions that cannot occur within a community due to morphological or phenological uncoupling (see Jordano et al (2003)). A network with random structure is formed with the given connectence and forbidden links. We excluded the networks with isolated species. Interaction between species are rearranged in a ’rich gets richer’ mechanism to generate a network with desired nestedness. In each iteration, two interacting species, and is chosen randomly. Now the link between and is removed and interacts with a new randomly selected species , if has more degree than . This iteration process keeps the connectence unchanged and increases nestedness. Iteration stops when the desired nestedness is obtained. This algorithm enables us to vary nestedness in a mutualistic network with fixed species richness and connectence.
2.2.3 Objective 3
We finally proposed a possible intervention strategy by choosing a target plant and then applying the intervention. The detail of the intervention and simulation process is given in section 4.
3 Results
3.1 Effect of contamination on the persistence of the system
In this section, we demonstrate the effect of contamination on the coexistence and abrupt transition of a mutualistic community. We first used 4 empirical networks, Ⓐ-Ⓓ (described in Section. 2.2.1), to demonstrate the results (in Fig. 2, and 3). As we increase the contamination level, the abundance of each species in the community decreases. This is expected, as increasing contamination in plants increases the contamination body burden of the pollinators, which in turn increases their mortality and decreases the mutualistic benefit received from plants. These effects are responsible for the reduction in abundance. Surprisingly, with gradual increase in the contamination level, the system experiences a catastrophic transition from the stable coexistence state to an alternative state of very low abundance (see Fig. 2). The orange lines represents the collapse and green lines represents the recovery of the system. This phenomenon of sudden changing of a system’s state in response to some system parameters is known as tipping (Lever et al, 2014; Jiang et al, 2018). Contamination triggers the two tipping parameters of the mutualistic system, decline rate of the pollinators and the strength of the mutualism. As a results, abrupt and irreversible collapse of the population is seen in the community with increasing contamination. The threshold contamination level at which the tipping occurs, is denoted as maximum contamination tolerance (hereafter MCT). We see that, as the average mutualistic strength () of the community decreases, MCT decreases (Fig. 2). That is the systems with low average mutualistic strength has low potential to coexists in a contaminated environment.
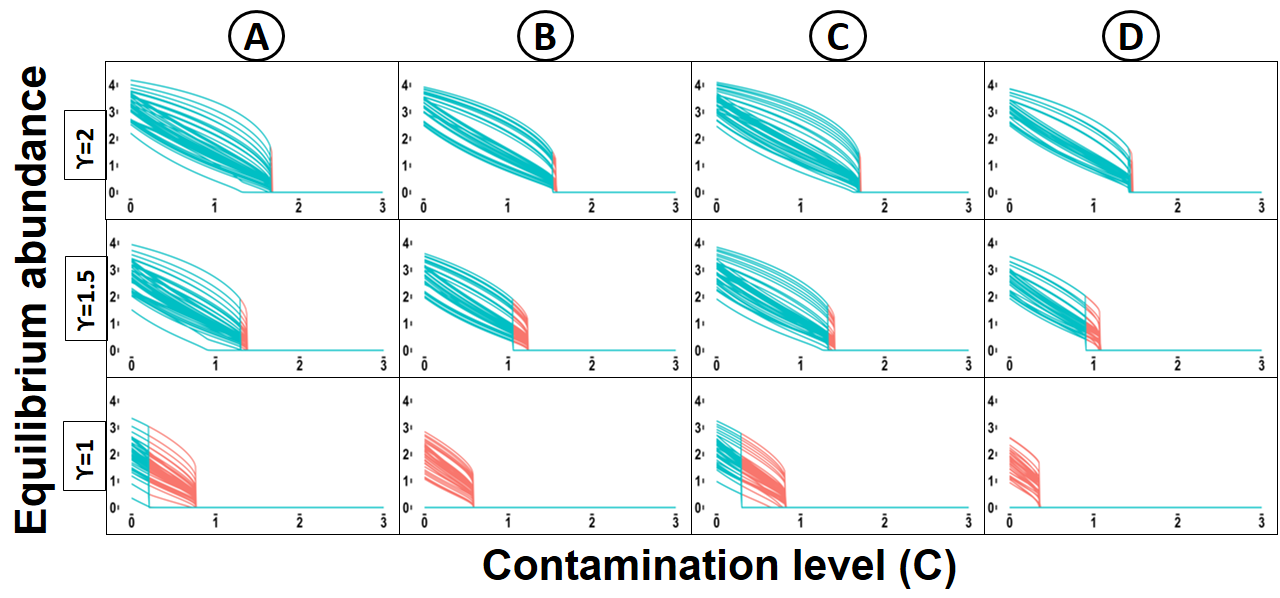
After the immediate collapse of the community, decreasing contamination level does not bring back the system to its previous state. System recovers at relatively low level of contamination, thus forming a hysteresis loop. At this parameter window, there is a bistability in the system and so the initial abundance determine its persistence. The parameter window for bistability increases with decreasing , which means that even before the whole community collapse, the system is sensitive to its initial abundance. For the community with very low mutualistic strength (), the MCT is comparably very low. Furthermore, the region of bistability is broad and sometimes there is no recovery from the collapse (see Fig. 2, for ).
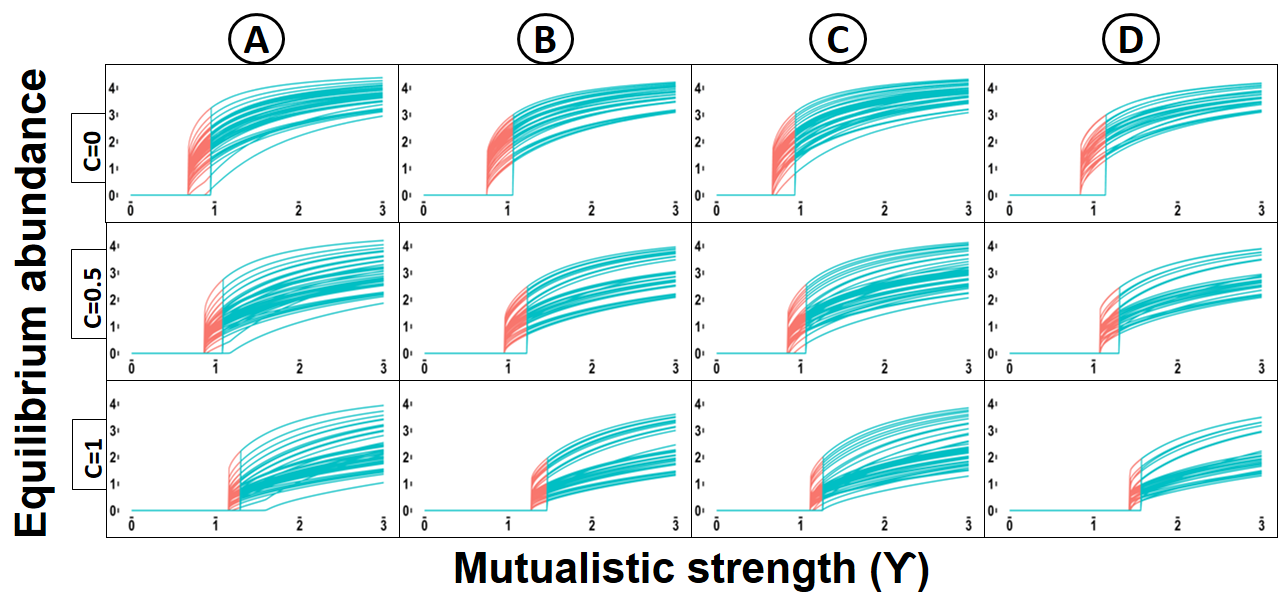
To understand the influence of contamination on the tipping of a community, we plot the equilibrium abundance with respect to , for different level of contamination level in the environment (see Fig. 3). Abundance decreases with decreasing , and then experiences an abrupt collapse at a threshold, below which the system is in the alternative stable state of very low abundance. We call it minimum gamma for coexistence, hereafter MGC. We see that MGC increases significantly with increasing contamination, for all the 4 networks. Also the threshold of the recovery, after which system backs to its previous stable coexistence state irrespective of all initial conditions, increases with increasing contamination. As example, network A coexists, irrespective of initial condition, for the mutualistic strength , when there is no contamination in the system. But the system posses bistability at for and even extinction state for for any initial abundance.
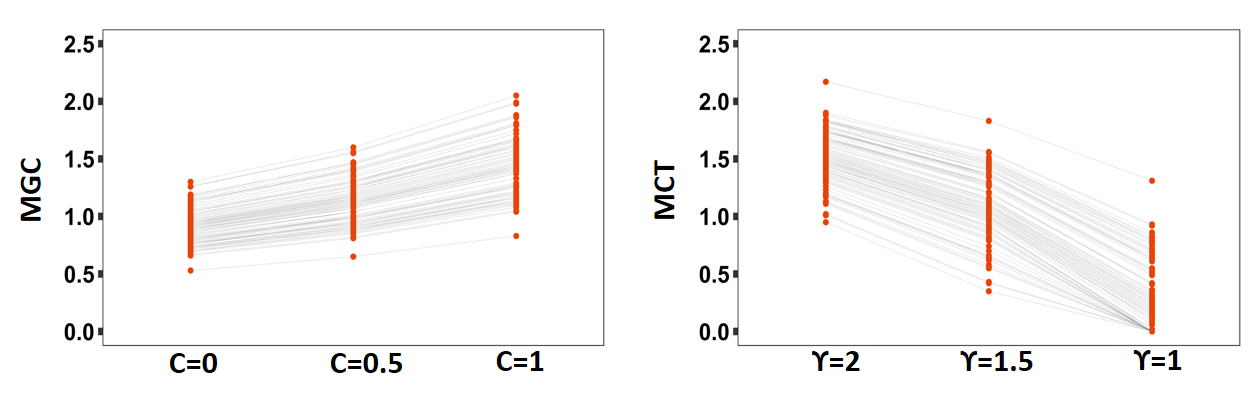
Further, to verify the prevalence of our findings on the effect of contamination on the coexistence and tipping of a mutualistic community, we plot the MCT for different level of and MGC for varying contamination level (), for all 105 empirical networks mentioned in section 2.2.1 (Fig. 4). For all the networks, the MCT decreases significantly with decreasing (Fig. 4.A). Also MGC increases with increasing contamination (Fig. 4.B). Which implies that in the presence of contamination, plant-pollinator communities with high average mutualistic strength () will coexists. Also the communities with low is prone to catastrophic collapse in the face of contamination.
3.2 The role of network topological properties in maintaining the coexistence
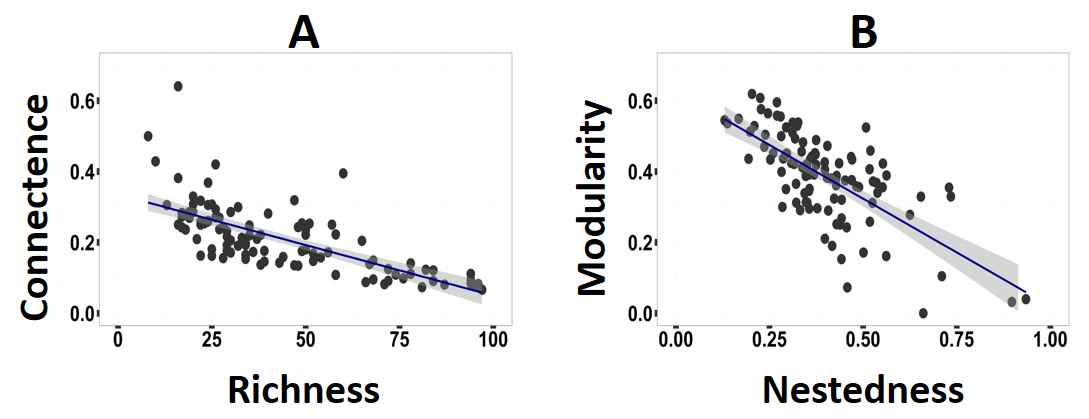
In this section, we study the role of several network architectural properties in maintaining the coexistence and the tipping of the community in the face of contamination. To do so, we plot MCT for all 105 networks with four important properties of a mutualistic network, richness, connectence, nestedness and modularity mentioned earlier, with varying average mutualistic strength (Fig. 5). In order to understand the linear dependency of the MCT of a community with the network properties, we mentioned the Pearson correlation coefficient between them in each plot. The same analysis is done for the case of MGC with varying contamination level in Fig. 6.
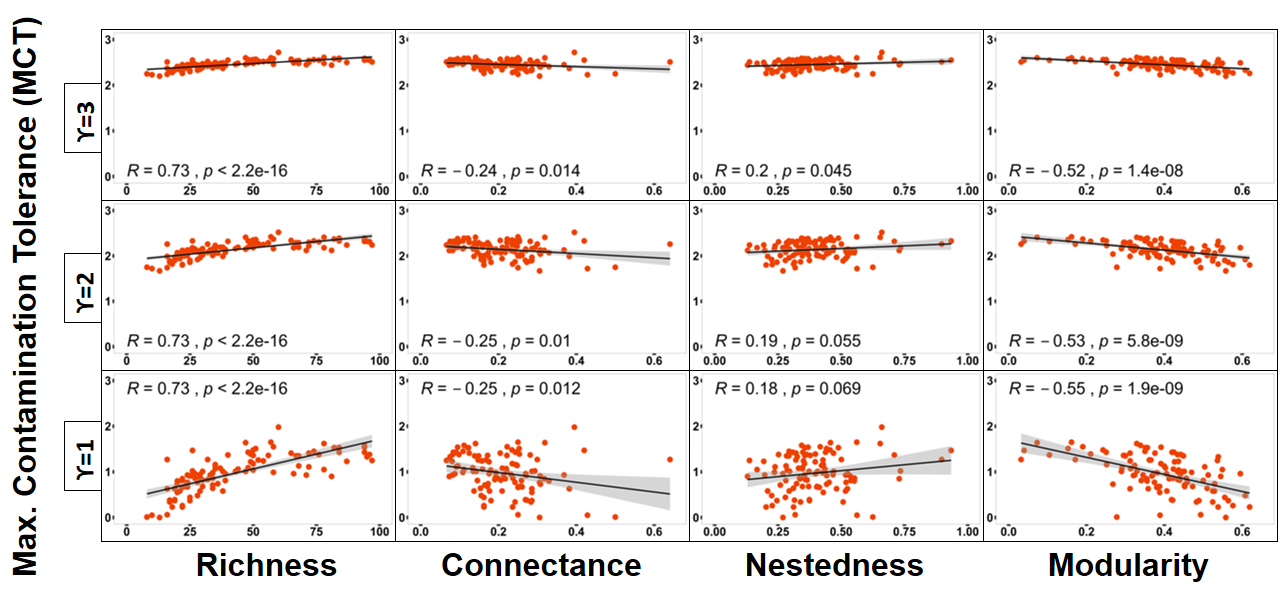
Species richness or diversity of a community has a significant positive correlation with the MCT, which means species rich communities can delay the abrupt collapse due to contamination (Fig. 5, 1st column). As increases, MCT increases for all the networks, but surprisingly, correlation remains the same. Also richness is negatively correlated with MGC, for any contamination level (Fig. 6, 1st column). This implies networks with higher richness can coexists with minimal average mutualistic strength under the toxin. Thus richness is beneficial for the persistence of a mutualistic community in the presence of contamination, which is agreeable to the previous studies where community size increases resilience of a mutualistic community (Okuyama and Holland, 2008) and also for the food webs (Garay-Narváez et al, 2013). Connectence or linkage density has a positive correlation with the MGC, for varied level of contamination (Fig. 6, 2nd column). Also connectence decreases the ability of a network to persists under contaminated environment as it negative correlated with the MCT (Fig. 5, 2nd column). So a densely connected mutualistic community is found to be more prone to extinction in the presence of contamination, which is opposite for the case of food web under pollution, where connectence is positively correlated with the persistence of the system (Garay-Narváez et al, 2013). Pollinators accumulate more contamination in a densely connected network. So their body burden increases, which acts antagonistically. Nestedness is beneficial for a mutualistic community as it is positively correlated with MCT (Fig. 5, 3rd column) and negatively correlated with MGC (see Fig. 5, 6, 3rd column, respectively). This indicates that nested communities is more robust in the face of contamination in the environment. Species in a nested networks are adhesively connected to a central core of interaction and creates a positive feedback loop between the interacting species. Harsh condition increases the dependency between the interacting species and this is why nestedness is beneficial for a community under environmental stress. The result is synergistic with previous studies (Saavedra et al, 2013; Rohr et al, 2014), where nestedness is shown to increase the tolerance level of a community in a fluctuating environment. Modularity acts opposite as nestedness as it has strong negative (positive) correlation with MCT (MGC) ( Fig. 5, 6, 4th column, respectively). A modular network is prone to collapse under environmental stress, which is opposite of the antagonistic interactions (Garay-Narváez et al, 2014). As species interactions are more restricted to specific modules, pollinators are more dependent with the plants within modules, the biomass loss of which can promote the collapse of that specific module, which in turn can trigger the extinction of the whole community.
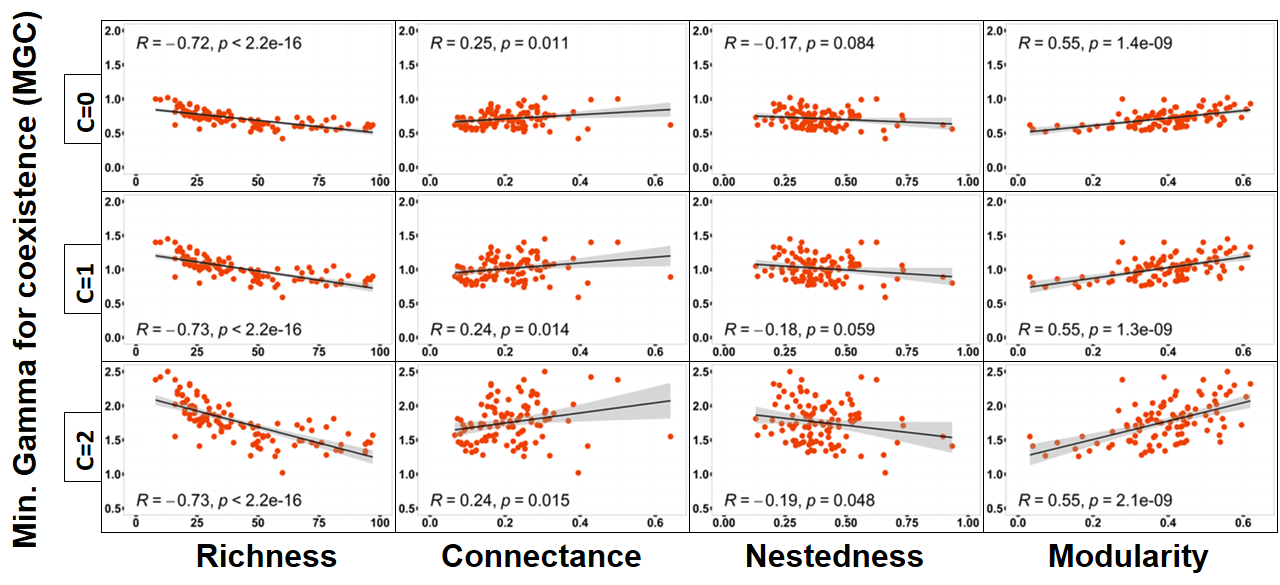
Overall MCT decreases with decreasing mutualistic strength and MGC increases with increasing contamination, for all 105 real networks studied. Large mutualistic community with high nestedness, low connectence and low modularity is found to be capable to functioning in the face of environmental contamination. Correlation between the network metrices and MCT (MGC) remains unchanged with varying the level of mutualistic strength (contamination). Which means that their linear associationship remains unchanged over varying conditions. But the slope of the regression line increases with increasing contamination level or decreasing mutualistic strength, in all the cases. So the community is more dependent with its topological properties. Also the variance of the data is higher, i.e., data points more scattered in the extreme conditions. This implies the tipping points of the community collapse largely varies over networks in harsh condition (i.e., less mutualistic strength and higher contamination level).
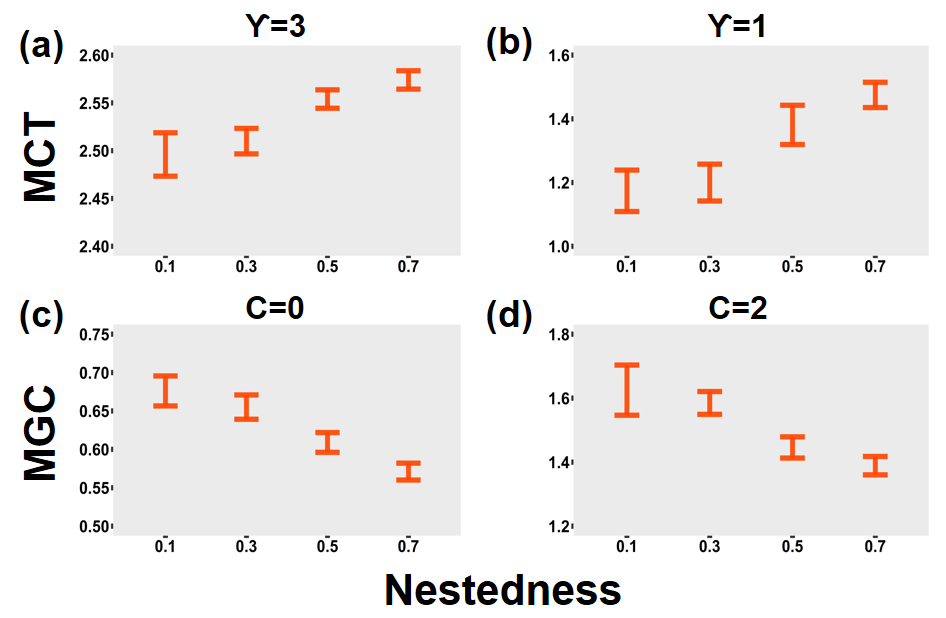
Mutualistic networks are often nested, entailing a core of species with many interactions among themselves, species with few interactions interacting with proper subsets of species with many interactions and few if any interactions among species with few interactions. Nestedness influences the positive stability-complexity relationship of a mutualistic community by increasing the positive feedback loop (Okuyama and Holland, 2008). Nestedness reduces effecting interspecific competition (Bastolla et al, 2009) and increase biodiversity. Nestedness increases the community resilience to species extinction (Memmott et al, 2004; Burgos et al, 2007). To verify the role of nestedness on the potential of the community to coexist under the contaminated environment, we plot MCT and MGC for simulated mutualistic networks with increasing nestedness (see Fig. 7). We use the algorithm stated in section 2.2.2 to simulate a network with specified nestedness. The results for simulated network is synergistic with that of the real empirical networks, MCT (MGC) increases (decreases) with nestedness. Also the positive effect of nestedness on evading the tipping significant under the deteriorating environment. Overall the more nested a network, the more ability to functioning properly under the effect of contamination.
4 Intervention strategy
In this section, we developed an ecologically feasible strategy to manage or delay the critical transition of a mutualistic community. Managing critical transitions or tipping typically means delaying the global extinction or altering global extinction to gradual extinction of individual species. Jiang et al (2019) proposed a biologically feasible intervention strategy by selecting a targeted pollinator species and then controlling its abundance or fixing its decay rate. This simple but effective intervention strategy can mitigate the abrupt collapse of a plant-pollinator community. In our system, we dealt with the agrochemical use in plants which is contaminant to the pollinators. So we propose an intervention strategy related to the management of the use of agrochemicals viz. pesticides, herbicides etc. in plants. A recent field study conducted by Pecenka et al (2021) claimed that decrease of the percentage of pesticide use can dramatically increase the crop production. Inspired from this, we make our strategy by selecting a ”targeted plant” from the community by a systematic way and then manage its contamination level, subsequent steps of which is stated below.
Target plant: A large number of research devoted on quantifying the most important node of a network or the central node of a network and the corresponding measure is called centrality. The target plant we choose in our study is the node with highest centrality. Of course there are many alternative measures of centrality. To justify our consideration of centrality for the target plant, we state here some widely used centrality measures for bipartite networks. Degree centrality, the number of degree a particular node have; Eigenvector centrality, the elements of the eigenvectors for the largest eigenvalue (Bonacich, 1987); Page rank centrality, where a node have higher centrality if it is connected to other nodes with high centrality. We choose degree centrality over all centrality measures for its simple yet effective concept, as high degree plants acts as hubs of a plant-pollinator community. Albeit all the centrality measures gives the same nodes for most of the real networks we studied, mentioned in section 2.2.1. Degree has generally been extended to the sum of weights when analysing weighted networks (Newman, 2004; Barrat et al, 2004). It is equal to the traditional definition of degree if the network is binary. However these two measures give same nodes for all the empirical networks we studied.
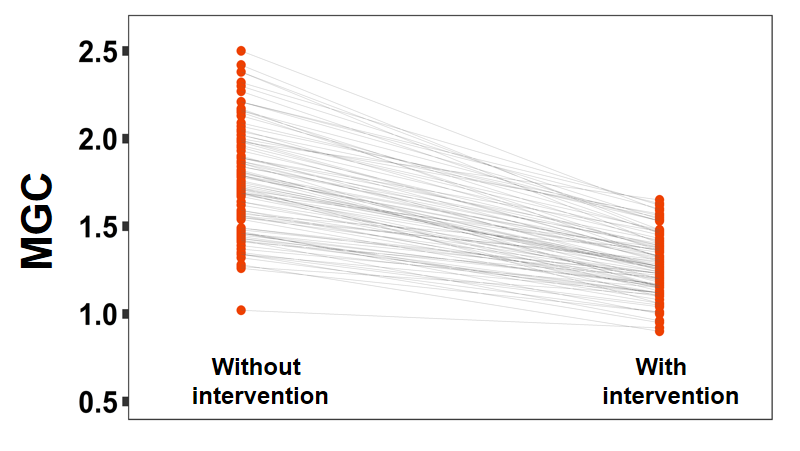
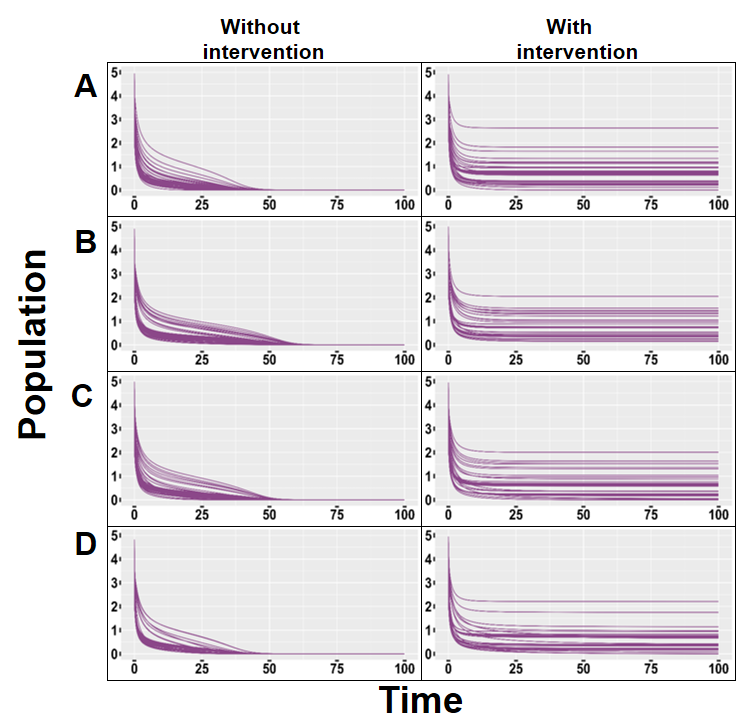
After choosing the target plant, we reduce the pesticide load of it by half (i.e. 50%). First we illustrate the effectiveness of the intervention for networks Ⓐ-Ⓓ. We plot the equilibrium abundance with respect to average mutualistic strength () in contaminated environment, without and with intervention strategy (see Fig. 8). Our results indicates that intervention strategy significantly decreases the extinction threshold of the community (i.e., MGC) with decreasing mutualistic strength. For instance, the network Ⓐ, Ⓒ cannot survive with average mutualistic strength in the contaminated environment. But when intervention acts, the coexistence is restored, though some of the species may go to extinction before the whole community collapse, but the global extinction is delayed (see Fig. 11 in Appendix B, for the time series plots). Similar results holds for networks Ⓑ and Ⓓ, for and , respectively. However extinction of few species may be regarded as a precursor of the critical transition in this case. Recovery threshold from the extinction state with increasing is also shifted due to the intervention. Which means that, community recovers from the extinction state for slight increase in mutualistic strength, when intervention acts. To generalize our findings, we plot the MGC for all 105 real networks for without and with intervention (Fig. 9). We see that, intervention effectively decreases the MGC, for all real networks considered, which means that the intervention strategy we proposed has the enough potential to delay the tipping.
Importance of systematic targeting: We further studied the importance of finding a targeted plant to apply the intervention strategy. To do so, we compare the effectiveness of the intervention for two cases; first, intervention in the target plant and secondly, intervention in any arbitrary plant in the community. We perform statistical significance test (see Appendix C) to the MGC for the two cases mentioned above and see that the MGC for the second case is significantly greater than the first case. That means the threshold deteriorating mutualistic strength level, below which community collapses, significantly decreases in case of targeted intervention. Therefore the intervention strategy is maximally beneficial when we apply it to a plant which is targeted in a systematic way.
5 Discussions
Plant-pollinator interactions are essential for terrestrial biodiversity and crop production. Chemical contamination due to excessive use of agrochemicals is an important driver of pollinator decline in the current era of anthropogenic changes as habitat loss, climate warming, parasite infection etc. But a mathematical study integrating the effect of contamination on a plant-pollinator mutualistic community is still lacking. Here we modelled a multispecies plant-pollinator community under the influence of environmental contamination, where pollinators accumulate toxin from the plants. Accumulated toxin affects pollinator decline rate and mutualistic strength between the plant and the pollinators, which in turn can act as a driver of abrupt and irreversible community collapse, from the stable coexisting state to community extinction, also known as tipping. We studied the effect of contamination level on the persistence of the community. We also investigated the role of different network architectural properties of a mutualistic community to maintaining the coexistence of the community in the face of contamination. Finally we proposed an intervention strategy regarding maintenance of the contamination level of a single target plant which can significantly evade the catestrophic collapse of the community.
Species abundance in a mutualistic community decreases with contamination level (Fig. 2). Elevated pollinator decline rate and reduced mutualistic strength due to contamination causes the population decline. Increasing contamination beyond a certain threshold can cause a catastrophic community collapse, as it triggers the two tipping elements of a plant-pollinator mutualistic community. Now a system backs to its functioning state i.e., recovers with much lower levels of contamination compared to MCT, thus forming a hysteresis loop. Within this contamination range, the system can coexists or may go to extinction, depending on the initial population level, thus showing bistability. Contamination mediated bistability is ubiquitous in a wide range of ecological systems (Huang et al, 2015; Banerjee et al, 2021; Chattopadhyay et al, 2022) and our finding adds one extra dimension into it. The systems with lower mutualistic strength has a very low potential to function under contamination as it possess much lower level contamination tolerance (Fig. 4) and broader bistability window (Fig. 2). Also there is sometimes no recovery from the extinction in some networks studied, that means the community is always prone to extinction, if the initial population is low. Further the MGC level below which community collapses, effectively increases with contamination for all the empirical networks studies (Fig. 3, 4.B), indicating that a plant-pollinator community needs higher mutualism strength to exists in the face of contamination.
Highly nested speciose communities with less connectence and modularity has the greater potential to endure contamination (Fig. 5, 6). Species richness is strongly positively correlated with MCT, the maximum threshold level of contamination after which community collapses, is relatively high for large systems. Also MGC, the minimum mutualistic strength below which community extinct, is low for species rich communities. Therefore species diversity has positive effects on the existence of a mutualistic community under contamination stress. Our results agrees with the conclusions of the previous studies (Okuyama and Holland, 2008; Thébault and Fontaine, 2010), where diversity is shown to be positively associated with the persistence and resilience of mutualistic communities. Connectence decreases with richness in mutualistic communities (Olesen and Jordano, 2002), which is also evident from our studied empirical networks (see Fig. 10.A in App. A). Local stability and degree of localization (metrices of stability; ability of a system to absorb perturbations) negatively depends on the connectence of a mutualistic community (Allesina and Tang, 2012; Suweis et al, 2015). Also extinction cascades, the tendency of secondary extinction of a mutualistic network increases with connectence (Vieira and Almeida-Neto, 2015). Overall connectence has negative impact on the stability of a mutualistic community (but see Okuyama and Holland (2008); Thébault and Fontaine (2010)). Our results is synergistic with the previous findings, as the MGC (MCT) has positive (negative) correlation with the connectence. Thus densely connected networks are less likely to function under contaminated environment. Pollinator’s contamination body burden increases when it is connected with more plants in a densely connected community, which in turn affects it’s demographic rates. This makes the community more prone to extinction under contamination exposure. Nestedness, the anomalous property of a mutualistic network (Bascompte et al, 2003), can boost the ability of the system to persists, especially in extreme circumstances (Thébault and Fontaine, 2010). Species in a nested networks are cohesively connected to a central core of interaction, where generalists and specialists both interacts with generalists and specialist-specialist interactions are rare. Nestedness creates a positive feedback loop between the interacting species and increase the diversity by reducing the interspecific competition (Bastolla et al, 2009). Community response to cascading extinction of pollinators is minimized for nested structure (Memmott et al, 2004). Nestedness has a positive effect on community persistence, resilience and structural stability (Okuyama and Holland (2008); Thébault and Fontaine (2010); Rohr et al (2014), but see Allesina and Tang (2012); Campbell et al (2012)). Results from our empirical and simulated networks shows that nestedness is positively associated with system’s ability to function in extreme conditions (high contamination level or low mutualistic strength). The interdependence within species in a nested community increases with deteriorating conditions which in turn delay the whole community collapse. Modularity has strong negative correlation with the system’s persistence under contamination; MCT (MGC) is low (high) for the communities with high modularity. Interactions becomes restricted into modules which prevents the stabilizing mechanism of mutualistic communities; specialists to generalists interaction. That’s why high modular networks has low degree of nestedness (see Fig. 10.B in Appendix A). Previous studies reported the negative relationship of modularity with the persistence and resilience of a mutualistic community (Thébault and Fontaine, 2010). However nestedness may be beneficial for the stability of a food web network (Thébault and Fontaine, 2010), especially under the contaminated environment (Garay-Narváez et al, 2014), opposite to our observed trends in case of mutualistic communities.
We further proposed an ecologically plausible intervention strategy which can helps a plant-pollinator community to function upto a certain extent of the increasing environmental contamination. Our intervention strategy involves managing of the contamination level of a single plant in the community. Reducing the contamination burden of it by half can effectively work as an intervention strategy. To apply the intervention, we choose one target plant from the community, the plant with highest interaction, i.e., highest degree. Our study indicates that managing the highest degree plant in the community can effectively evade the tipping of the community for decreasing average mutualistic strength or increasing contamination level. Pollinators, from most specialist to generalist status, are likely to interact with the highest degree plant of the network, that’s why this is called the hub of the network. So reducing the contamination burden of the most connected plant or hub of the community can effectively decrease the net contamination burden of the pollinators, which implicitly reduces the detrimental effect of the contamination on pollinators. This in turn helps the community to sustain by alleviating the effect of the deteriorating environment. As a result the minimum average mutualistic strength, below which the whole community collapses, effectively decreases when intervention acts. The difference between the two sets of MGC for all 105 real network studied is statistically significant when we apply the management on any arbitrary plant in the community. So our study emphasise the importance of the highly connected plant in the case of management. Furthermore, when intervention applies, extinction of some species is seen before the system reaches to its threshold tolerance level of the deteriorating environment, which may be pointed out as the precursor of the whole community collapse. Also the range of the bistability parameter window, where the fate of the community is dependent on its initial population level, decreases when intervention applies to the system. A recent study by Jiang et al (2019) proposed a management strategy on plant-pollinator community by fixing the abundance or the decay rate of a specific pollinator in the system and this strategy has the potential to delay the tipping and speed up the recovery of the system. Our proposed intervention adds extra dimension in the management policy under contamination exposure, which involves management of plants.
Appendix A Empirical networks plots
Appendix B Effectiveness of the intervention
Appendix C Statistical hypothesis test for the significance of targeting a plant
We verify that intervention in targeted plants is more effective than management in arbitrary plants in the community. It is enough to prove that the MGC’s for the case of randomly managed plants are significantly greater than that of targeted plants. Let and be the vector containing MGC’s for the formar and latter cases, respectively. We assumed that is normally distributed with mean and let be the mean of . Here we are to test the hypothesis: ”MGC’s for random intervention is equal to MGC’s for targeted intervention”.
So here we are to test the null hypothesis:
,
against the alternative hypothesis:
,
where is the mean of the vector , which is also a normal distribution with mean and unknown standard deviation.
Then the suitable test statistic is given by , whose sampling distribution is a t-distribution with degrees of freedom, is the size of the vector . is the mean of and , is the variance of .
Let us test the hypothesis at level of significance, i.e., .
Now the critical region at the significance level is , where is given by , and has t-distribution with mean degrees of freedom.
Here . From the density of the t-distribution with degrees of freedom, we have . Thus the critical region for rejecting the null hypothesis is: (see Fig. 12).
Now from our vector , the MGC’s for random intervention case, the value of the test statistic is , which lies in the critical region.
Thus the null hypothesis is rejected and alternative hypothesis accepted at level of significance.
So it is reasonable to believe that , i.e., MGC’s for the randomly managed plants is greater that that of targeted plants. In other words, targeted intervention is more effective than intervention in arbitrary plants in the community.

References
- \bibcommenthead
- Allesina and Tang (2012) Allesina S, Tang S (2012) Stability criteria for complex ecosystems. Nature 483(7388):205–208
- Arft et al (1999) Arft A, Walker M, Gurevitch J, et al (1999) Responses of tundra plants to experimental warming: meta-analysis of the international tundra experiment. Ecological monographs 69(4):491–511
- Banerjee et al (2021) Banerjee S, Saha B, Rietkerk M, et al (2021) Chemical contamination-mediated regime shifts in planktonic systems. Theoretical Ecology 14(4):559–574
- Barrat et al (2004) Barrat A, Barthelemy M, Pastor-Satorras R, et al (2004) The architecture of complex weighted networks. Proceedings of the national academy of sciences 101(11):3747–3752
- Bascompte and Jordano (2007) Bascompte J, Jordano P (2007) Plant-animal mutualistic networks: the architecture of biodiversity. Annual review of ecology, evolution, and systematics pp 567–593
- Bascompte and Jordano (2013) Bascompte J, Jordano P (2013) Mutualistic networks. Princeton University Press
- Bascompte et al (2003) Bascompte J, Jordano P, Melián CJ, et al (2003) The nested assembly of plant–animal mutualistic networks. Proceedings of the National Academy of Sciences 100(16):9383–9387
- Bastolla et al (2009) Bastolla U, Fortuna MA, Pascual-García A, et al (2009) The architecture of mutualistic networks minimizes competition and increases biodiversity. Nature 458(7241):1018–1020
- Belsky and Joshi (2020) Belsky J, Joshi NK (2020) Effects of fungicide and herbicide chemical exposure on apis and non-apis bees in agricultural landscape. Frontiers in Environmental Science 8:81
- Bhandary et al (2022) Bhandary S, Deb S, Dutta PS (2022) Rising temperature drives tipping points in mutualistic networks. bioRxiv
- Bonacich (1987) Bonacich P (1987) Power and centrality: A family of measures. American journal of sociology 92(5):1170–1182
- Bruno et al (2003) Bruno JF, Stachowicz JJ, Bertness MD (2003) Inclusion of facilitation into ecological theory. Trends in ecology & evolution 18(3):119–125
- Bryden et al (2013) Bryden J, Gill RJ, Mitton RA, et al (2013) Chronic sublethal stress causes bee colony failure. Ecology letters 16(12):1463–1469
- Burgos et al (2007) Burgos E, Ceva H, Perazzo RP, et al (2007) Why nestedness in mutualistic networks? Journal of theoretical biology 249(2):307–313
- Burkle et al (2013) Burkle LA, Marlin JC, Knight TM (2013) Plant-pollinator interactions over 120 years: loss of species, co-occurrence, and function. Science 339(6127):1611–1615
- Campbell et al (2012) Campbell C, Yang S, Shea K, et al (2012) Topology of plant-pollinator networks that are vulnerable to collapse from species extinction. Physical Review E 86(2):021,924
- Chattopadhyay et al (2022) Chattopadhyay A, Banerjee S, Samadder A, et al (2022) Environmental toxicity influences disease spread in consumer population. arXiv preprint arXiv:221108558
- Cresswell (2011) Cresswell JE (2011) A meta-analysis of experiments testing the effects of a neonicotinoid insecticide (imidacloprid) on honey bees. Ecotoxicology 20(1):149–157
- Di Prisco et al (2013) Di Prisco G, Cavaliere V, Annoscia D, et al (2013) Neonicotinoid clothianidin adversely affects insect immunity and promotes replication of a viral pathogen in honey bees. Proceedings of the National Academy of Sciences 110(46):18,466–18,471
- Dicks et al (2021) Dicks LV, Breeze TD, Ngo HT, et al (2021) A global-scale expert assessment of drivers and risks associated with pollinator decline. Nature Ecology & Evolution 5(10):1453–1461
- Fortuna and Bascompte (2006) Fortuna MA, Bascompte J (2006) Habitat loss and the structure of plant–animal mutualistic networks. Ecology letters 9(3):281–286
- Fortuna et al (2013) Fortuna MA, Krishna A, Bascompte J (2013) Habitat loss and the disassembly of mutalistic networks. Oikos 122(6):938–942
- Gallai et al (2009) Gallai N, Salles JM, Settele J, et al (2009) Economic valuation of the vulnerability of world agriculture confronted with pollinator decline. Ecological economics 68(3):810–821
- Garay-Narváez et al (2013) Garay-Narváez L, Arim M, Flores JD, et al (2013) The more polluted the environment, the more important biodiversity is for food web stability. Oikos 122(8):1247–1253
- Garay-Narváez et al (2014) Garay-Narváez L, Flores JD, Arim M, et al (2014) Food web modularity and biodiversity promote species persistence in polluted environments. Oikos 123(5):583–588
- Godfray et al (2014) Godfray HCJ, Blacquiere T, Field LM, et al (2014) A restatement of the natural science evidence base concerning neonicotinoid insecticides and insect pollinators. Proceedings of the Royal Society B: Biological Sciences 281(1786):20140,558
- Goulson et al (2015) Goulson D, Nicholls E, Botías C, et al (2015) Bee declines driven by combined stress from parasites, pesticides, and lack of flowers. Science 347(6229):1255,957
- Hale et al (2020) Hale KR, Valdovinos FS, Martinez ND (2020) Mutualism increases diversity, stability, and function of multiplex networks that integrate pollinators into food webs. Nature Communications 11(1):2182
- Harrison and Winfree (2015) Harrison T, Winfree R (2015) Urban drivers of plant-pollinator interactions. Functional Ecology 29(7):879–888
- Hegland et al (2009) Hegland SJ, Nielsen A, Lázaro A, et al (2009) How does climate warming affect plant-pollinator interactions? Ecology letters 12(2):184–195
- Henry et al (2012) Henry M, Beguin M, Requier F, et al (2012) A common pesticide decreases foraging success and survival in honey bees. Science 336(6079):348–350
- Huang et al (2015) Huang Q, Wang H, Lewis MA (2015) The impact of environmental toxins on predator–prey dynamics. Journal of theoretical biology 378:12–30
- Inouye et al (2003) Inouye DW, Saavedra F, Lee-Yang W (2003) Environmental influences on the phenology and abundance of flowering by androsace septentrionalis (primulaceae). American Journal of Botany 90(6):905–910
- Jiang et al (2018) Jiang J, Huang ZG, Seager TP, et al (2018) Predicting tipping points in mutualistic networks through dimension reduction. Proceedings of the National Academy of Sciences 115(4):E639–E647
- Jiang et al (2019) Jiang J, Hastings A, Lai YC (2019) Harnessing tipping points in complex ecological networks. Journal of the Royal Society Interface 16(158):20190,345
- Jordano (1987) Jordano P (1987) Patterns of mutualistic interactions in pollination and seed dispersal: connectance, dependence asymmetries, and coevolution. The American Naturalist 129(5):657–677
- Jordano et al (2003) Jordano P, Bascompte J, Olesen JM (2003) Invariant properties in coevolutionary networks of plant–animal interactions. Ecology letters 6(1):69–81
- Kasiotis et al (2014) Kasiotis KM, Anagnostopoulos C, Anastasiadou P, et al (2014) Pesticide residues in honeybees, honey and bee pollen by lc–ms/ms screening: Reported death incidents in honeybees. Science of the Total Environment 485:633–642
- Klein et al (2007) Klein AM, Vaissière BE, Cane JH, et al (2007) Importance of pollinators in changing landscapes for world crops. Proceedings of the royal society B: biological sciences 274(1608):303–313
- Kooi et al (2008) Kooi B, Bontje D, Van Voorn G, et al (2008) Sublethal toxic effects in a simple aquatic food chain. Ecological Modelling 212(3-4):304–318
- Lever et al (2014) Lever JJ, van Nes EH, Scheffer M, et al (2014) The sudden collapse of pollinator communities. Ecology letters 17(3):350–359
- Luoma and Rainbow (2005) Luoma SN, Rainbow PS (2005) Why is metal bioaccumulation so variable? biodynamics as a unifying concept. Environmental Science & Technology 39(7):1921–1931
- McWilliams et al (2019) McWilliams C, Lurgi M, Montoya JM, et al (2019) The stability of multitrophic communities under habitat loss. Nature Communications 10(1):1–11
- Medan et al (2007) Medan D, Perazzo RP, Devoto M, et al (2007) Analysis and assembling of network structure in mutualistic systems. Journal of theoretical biology 246(3):510–521
- Memmott et al (2004) Memmott J, Waser NM, Price MV (2004) Tolerance of pollination networks to species extinctions. Proceedings of the Royal Society of London Series B: Biological Sciences 271(1557):2605–2611
- Meng et al (2020) Meng Y, Lai YC, Grebogi C (2020) Tipping point and noise-induced transients in ecological networks. Journal of the Royal Society Interface 17(171):20200,645
- Mitchell et al (2017) Mitchell EA, Mulhauser B, Mulot M, et al (2017) A worldwide survey of neonicotinoids in honey. Science 358(6359):109–111
- Newman (2004) Newman ME (2004) Analysis of weighted networks. Physical review E 70(5):056,131
- Nicolson and Wright (2017) Nicolson SW, Wright GA (2017) Plant—pollinator interactions and threats to pollination. Functional Ecology 31(1):22–25
- Nieminen et al (2001) Nieminen M, Nuorteva P, Tulisalo E (2001) The effect of metals on the mortality of parnassius apollo larvae (lepidoptera: Papilionidae). Journal of Insect Conservation 5(1):1–7
- Okuyama and Holland (2008) Okuyama T, Holland JN (2008) Network structural properties mediate the stability of mutualistic communities. Ecology Letters 11(3):208–216
- Olesen and Jordano (2002) Olesen JM, Jordano P (2002) Geographic patterns in plant–pollinator mutualistic networks. Ecology 83(9):2416–2424
- Olesen et al (2007) Olesen JM, Bascompte J, Dupont YL, et al (2007) The modularity of pollination networks. Proceedings of the National Academy of Sciences 104(50):19,891–19,896
- Ollerton et al (2011) Ollerton J, Winfree R, Tarrant S (2011) How many flowering plants are pollinated by animals? Oikos 120(3):321–326
- Pecenka et al (2021) Pecenka JR, Ingwell LL, Foster RE, et al (2021) Ipm reduces insecticide applications by 95% while maintaining or enhancing crop yields through wild pollinator conservation. Proceedings of the National Academy of Sciences 118(44):e2108429,118
- Piiroinen and Goulson (2016) Piiroinen S, Goulson D (2016) Chronic neonicotinoid pesticide exposure and parasite stress differentially affects learning in honeybees and bumblebees. Proceedings of the Royal Society B: Biological Sciences 283(1828):20160,246
- Potts et al (2010) Potts SG, Biesmeijer JC, Kremen C, et al (2010) Global pollinator declines: trends, impacts and drivers. Trends in ecology & evolution 25(6):345–353
- Potts et al (2016) Potts SG, Imperatriz-Fonseca V, Ngo HT, et al (2016) Safeguarding pollinators and their values to human well-being. Nature 540(7632):220–229
- Proesmans et al (2021) Proesmans W, Albrecht M, Gajda A, et al (2021) Pathways for novel epidemiology: plant–pollinator–pathogen networks and global change. Trends in ecology & evolution 36(7):623–636
- Prosnier et al (2015) Prosnier L, Loreau M, Hulot FD (2015) Modeling the direct and indirect effects of copper on phytoplankton–zooplankton interactions. Aquatic toxicology 162:73–81
- Requier et al (2022) Requier F, Pérez-Méndez N, Andersson GK, et al (2022) Bee and non-bee pollinator importance for local food security. Trends in Ecology & Evolution
- Revilla et al (2015) Revilla TA, Encinas-Viso F, Loreau M (2015) Robustness of mutualistic networks under phenological change and habitat destruction. Oikos 124(1):22–32
- Rhodes (2018) Rhodes CJ (2018) Pollinator decline–an ecological calamity in the making? Science progress 101(2):121–160
- Rohr et al (2014) Rohr RP, Saavedra S, Bascompte J (2014) On the structural stability of mutualistic systems. Science 345(6195):1253,497
- Saavedra et al (2013) Saavedra S, Rohr RP, Dakos V, et al (2013) Estimating the tolerance of species to the effects of global environmental change. Nature communications 4(1):2350
- Schneider et al (2012) Schneider CW, Tautz J, Grünewald B, et al (2012) Rfid tracking of sublethal effects of two neonicotinoid insecticides on the foraging behavior of apis mellifera. PloS one 7(1):e30,023
- Spiesman and Inouye (2013) Spiesman BJ, Inouye BD (2013) Habitat loss alters the architecture of plant–pollinator interaction networks. Ecology 94(12):2688–2696
- Sponsler et al (2019) Sponsler DB, Grozinger CM, Hitaj C, et al (2019) Pesticides and pollinators: A socioecological synthesis. Science of the Total Environment 662:1012–1027
- Suweis et al (2015) Suweis S, Grilli J, Banavar JR, et al (2015) Effect of localization on the stability of mutualistic ecological networks. Nature communications 6(1):10,179
- Thébault and Fontaine (2010) Thébault E, Fontaine C (2010) Stability of ecological communities and the architecture of mutualistic and trophic networks. Science 329(5993):853–856
- Truitt et al (2019) Truitt LL, McArt SH, Vaughn AH, et al (2019) Trait-based modeling of multihost pathogen transmission: plant-pollinator networks. The American Naturalist 193(6):E149–E167
- Tsvetkov et al (2017) Tsvetkov N, Samson-Robert O, Sood K, et al (2017) Chronic exposure to neonicotinoids reduces honey bee health near corn crops. Science 356(6345):1395–1397
- Valdovinos (2019) Valdovinos FS (2019) Mutualistic networks: moving closer to a predictive theory. Ecology letters 22(9):1517–1534
- Vanbergen et al (2018) Vanbergen AJ, Espíndola A, Aizen MA (2018) Risks to pollinators and pollination from invasive alien species. Nature ecology & evolution 2(1):16–25
- Veltman et al (2008) Veltman K, Huijbregts MA, Hendriks AJ (2008) Cadmium bioaccumulation factors for terrestrial species: Application of the mechanistic bioaccumulation model omega to explain field data. Science of the total environment 406(3):413–418
- Vieira and Almeida-Neto (2015) Vieira MC, Almeida-Neto M (2015) A simple stochastic model for complex coextinctions in mutualistic networks: robustness decreases with connectance. Ecology Letters 18(2):144–152
- Wang et al (2020) Wang Y, Wu H, Wang S (2020) Persistence of pollination mutualisms under pesticides. Applied Mathematical Modelling 77:861–880
- Whitehorn et al (2012) Whitehorn PR, O’connor S, Wackers FL, et al (2012) Neonicotinoid pesticide reduces bumble bee colony growth and queen production. Science 336(6079):351–352
- Wright et al (2017) Wright AJ, Wardle DA, Callaway R, et al (2017) The overlooked role of facilitation in biodiversity experiments. Trends in Ecology & Evolution 32(5):383–390
- Wu et al (2011) Wu JY, Anelli CM, Sheppard WS (2011) Sub-lethal effects of pesticide residues in brood comb on worker honey bee (apis mellifera) development and longevity. PloS one 6(2):e14,720
- Zhang et al (2011) Zhang F, Hui C, Terblanche JS (2011) An interaction switch predicts the nested architecture of mutualistic networks. Ecology letters 14(8):797–803