Photometric and Spectroscopic monitoring of YSOs in nearby star forming regions. I. Eruptive YSOs
Abstract
Mid-infrared (mid-IR) variability in young stellar objects (YSOs) is driven by several physical mechanisms, which produce a variety of amplitudes and light curve shapes. One of these mechanisms, variable disk accretion is predicted by models of episodic accretion to drive secular variability, including in the mid-IR. Because the largest accretion bursts are rare, adding new objects to the YSO eruptive variable class aids our understanding of the episodic accretion phenomenon and its possible impact on stellar and planetary formation. A previous analysis of 6.5 yr of NeoWISE light curves (3–5 m) of 7000 nearby YSOs found an increase in the fraction of variability and variability amplitude for objects at younger stages of evolution. To help interpret these light curves, we have obtained low- and high-resolution near-IR spectra of 78 objects from this sample of YSOs. In this work, we present the analysis of nine nearby YSOs (d kpc) that show the characteristics of known classes of eruptive variable YSOs. We find one FUor-like source, one EX Lupi-type object, and six YSOs with mixed characteristics, or V1647 Ori-like objects. The varied characteristics observed in our sample are consistent with recent discoveries of eruptive YSOs. We discuss how a wide range in YSO outburst parameters (central mass, maximum accretion rate during outburst, evolutionary stage and/or instability leading to the outburst) may play a significant role in the observed spectro-photometric properties of YSO outbursts.
keywords:
stars: formation – stars: protostars – stars: pre-main-sequence – stars: variables: T Tauri, Herbig Ae/Be1 Introduction
Young stellar objects (YSOs) display variability over a wide wavelength range, from X-rays to the sub-mm, with a variety of amplitudes and timescales. Dedicated photometric observations at optical, near- to mid-IR and sub-mm wavelengths have been fundamental to understand the physical mechanisms, associated with the stellar photosphere, accretion disk and envelopes of YSOs, that give rise to variability in these systems (Herbst et al., 1994; Carpenter et al., 2001; Cody et al., 2014; Contreras Peña et al., 2017a; Venuti et al., 2017; Sergison et al., 2020; Lee et al., 2021). In particular, observations at mid-IR wavelengths are a powerful tool to evaluate the variability of embedded protostars that are usually too faint at optical and even near-IR wavelengths. The Young Stellar Object VARiability (YSOVAR) program (e.g. Morales-Calderón et al., 2011; Stauffer et al., 2014) and comparisons between Spitzer and Wide-field Infrared Survey Explorer (WISE) mid-IR photometry (Scholz et al., 2013; Antoniucci et al., 2014; Fischer et al., 2019) revealed the complexity of YSO variability at wavelengths between 3 and 5 m.
Recently, Park et al. (2021), hereafter P21, performed a statistical analysis of the mid-IR variability of 7000 YSOs in nearby star forming regions (SFRs). Monitoring from the Neo-WISE W1 (3.4 m) and W2 (4.6 m) filter observations from 2013 to 2020 allowed the classification of the many-year variability in these YSOs as either showing long-term trends (or secular variability) and stochastic variability. P21 find an increase in the fraction of variability towards the younger stages of evolution. Embedded objects are also found to show more secular variability and with higher amplitudes than evolved YSOs.
The variability at mid-IR wavelengths can be explained by various mechanisms, including extinction changes due to inhomogeneous mass distributions in the disk or varying disk geometry (Morales-Calderón et al., 2011; Covey et al., 2021), short-burst variability due to hydrodynamic interactions between stellar surfaces and inner disk edges (Stauffer et al., 2014), and hot or cold spots on the stellar surfaces (Cody et al., 2014). An important mechanism to drive secular variability is likely variable disk accretion rates, as predicted by the episodic accretion model (Contreras Peña et al., 2020; Park et al., 2021; Fischer et al., 2022).
Distinguishing between the different mechanisms is difficult through light curves alone. Spectroscopic observations are needed to gain a better understanding of the underlying physical mechanisms leading to the mid-IR variability in nearby YSOs seen in the sample of P21. With this goal in mind, we have been conducting a programme to follow-up a sub-sample of YSOs using low and high-resolution near-infrared spectrographs, including Gemini/GNIRS, Gemini/Flamingos-2, Gemini/IGRINS, IRTF/Spex and Palomar/Triplespec observations, in the period between 2020 May and 2022 June.
In this work, we focus on YSOs with spectra that confirmed that variability is driven by changes in the accretion rate of the system. YSO outbursts driven by large changes in the accretion rate are still a rare class of objects (see e.g. Connelley & Reipurth, 2018). The discovery of eruptive variable YSOs will aid to further understand these class of objects and the phenomenon of episodic accretion. In this work we show the spectroscopic follow-up of a sample of nearby YSOs from Park et al. (2021) that show photometric characteristics of eruptive variables in their light curves.
This work is divided as follows. In section 2 we present an overview of the classification of eruptive YSOs. In Section 3 we explain the sample selection and present a summary of the photometric and spectroscopic data used in this work. In Section 4, we describe the spectroscopic and photometric characteristics of individual sources analysed in this work. In Section 5 we discuss the mechanisms that could explain the high-amplitude variability in our sample. In Section 6 we argue how the different parameters in young stars can lead to the mixed spectro-photometric characteristics in outbursting YSOs. Finally, in Section 7 we present a summary of our findings.
2 An overview of episodic accretion
In the episodic accretion model of star formation, stars gain most of their mass during short-lived episodes of high accretion (reaching as high as M⊙ yr-1) followed by long periods of quiescent low-level accretion (Hartmann & Kenyon, 1996). Instabilities in the disc lead to sudden episodes of enhanced accretion. Many models could explain the instabilities that give rise to the outbursts, which include gravitational and magnetorotational instabilities (Zhu et al., 2009; Kadam et al., 2020), thermal viscous instability (Bell & Lin, 1994; Bell et al., 1995), disc fragmentation (Vorobyov & Basu, 2015), binary interaction (Reipurth et al., 2010), stellar flybys (Cuello et al., 2019) and planet-disc interaction (Lodato & Clarke, 2004).
Episodic accretion can have an effect on stellar and planet formation. It has been invoked as one of the accretion models that could explain the observed spread in the luminosity of protostars in areas of star formation (see review by Fischer et al., 2022). The intense accretion outbursts can also have a long-lasting impact on the structure of the central star (Baraffe et al., 2017, cf. with Kunitomo et al., 2017). The long periods spent at low accretion stages may allow the disc to cool sufficiently to fragment, helping in the production low-mass companions (Stamatellos et al., 2012). Accretion outbursts alter the chemistry of protoplanetary discs (Artur de la Villarmois et al., 2019), the location of the snowline of various ices (Cieza et al., 2016), and could affect orbital evolution of any planets, if present (Boss, 2013; Becker et al., 2021)
The class of YSOs that show accretion-related variability, or eruptive variable YSOs, provide observational evidence for episodic accretion (Hartmann & Kenyon, 1996). This class of objects is usually divided according to their photometric and spectroscopic characteristics during outburst (see e.g. Connelley & Reipurth, 2018). The original criteria was set by Herbig (1977, 1989) based on a handful of YSOs and on observations taken at optical wavelengths. More recently, this classification has been updated to also include characteristics at longer near- to mid-IR wavelengths (see e.g. Lorenzetti et al., 2012; Connelley & Reipurth, 2018)
2.1 The classical FUors and EX Lup type objects
FUors, named after the archetype FU Orionis, show high-amplitude outbursts (V6 mag, e.g. Hillenbrand & Rodriguez, 2022), that can last for decades (typically longer than 10 years), due to the sudden increase of the accretion rate which can reach as high as 10-4 M⊙ yr-1 (Hartmann & Kenyon, 1996). During outburst, FUors are characterised by an absorption spectrum with very few emission lines. The most common characteristics in FUors are the H line with a P Cygni profile, Na I D (5900 Å) absorption, 12CO bandhead absorption (22935 Å) and a triangular H-band continuum due to H2O absorption (13300 Å). FUors also show a change in spectral type with observed wavelength going from F-G in the optical to K-M in the near-infrared. During outburst, the accretion disk dominates emission in the system, where absorption lines arise due to a cooler disk surface compared with the viscously-heated midplane. The change in spectral type is due to emission arising at different disk radii (Herbig, 1977; Hartmann & Kenyon, 1996; Reipurth & Aspin, 2010; Connelley & Reipurth, 2018; Hillenbrand et al., 2018; Fischer et al., 2022).
EX Lup outbursts (originally named EXors by e.g. Herbig, 1977), are considered as the less dramatic counterparts of FUors. The outbursts in these systems can last a few weeks to several months and reach similar amplitudes to FUor outbursts. In addition, outbursts in these systems have sometimes been seen to be repetitive. The spectra of EX Lup type objects are also different to FUors, as they are dominated by emission lines during maximum light. In the near-IR, Na I (22060 Å) and 12CO bandhead (22935 Å) emission arise from the surface layers of a hot inner disc. These lines go into absorption during the quiescent state. The accepted interpretation is that at low accretion rates, the central star dominates the emission from the system, leading to the photospheric absorption profile. On the other hand, an increase in the value of the accretion rate leads to an increase of UV radiation at the accretion shock, which in turn increases the inner disk temperature and thus favours CO emission (Lorenzetti et al., 2009). In general, EX Lup type objects observed at minimum light were found to be no different than typical T Tauri stars (Herbig, 1989, 2008; Lorenzetti et al., 2012; Audard et al., 2014).
Due to the differences between the two classes, it was the accepted view that these represented distinct types of objects. FUors were a phenomenon related to YSOs at younger evolutionary stages, while EX Lup type objects were characteristic of more evolved Class II YSOs. New discoveries, however, have shown the existence of FUor outbursts during the Class II stage (Contreras Peña et al., 2019) and have blurred the two-class system of eruptive YSOs (Contreras Peña et al., 2017b; Guo et al., 2021).
2.2 Recent discoveries
Multi-epoch, optical (Gaia, ZTF, Pan-STARRS, ASSASN, Chambers et al., 2016; Bellm et al., 2018; Jayasinghe et al., 2018; Hodgkin et al., 2021), near-IR (UKIDSS GPS, VVV, PGIR, Lucas et al., 2008; Saito et al., 2012; Moore et al., 2016), mid-IR (Spitzer, WISE, NEOWISE, Benjamin et al., 2003; Wright et al., 2010; Mainzer et al., 2014) and sub-mm (JCMT, Herczeg et al., 2017) surveys have led to the discovery of a larger sample of eruptive YSOs. The new discoveries include examples of objects that fit the original classification, i.e. bona-fide FUors (e.g. VVVv721, Gaia17bpi, G286.2032+0.1740, Gaia18dvy, DR4_V20, PGIR 20cdi, Contreras Peña et al., 2017b; Hillenbrand et al., 2018; Cheng et al., 2020; Szegedi-Elek et al., 2020; Guo et al., 2021; Hillenbrand et al., 2021) and EX Lup type objects (e.g Gaia20eae, Cruz-Sáenz de Miera et al., 2022; Ghosh et al., 2022). The majority of recent discoveries, however, show a mixture of EX Lup/FUor spectroscopic and photometric characteristics. The latter are often classified under different names, such as V1647 Ori-like (Fischer et al., 2022), ‘peculiar’ (Connelley & Reipurth, 2018) or ‘MNors’ (Contreras Peña et al., 2017a).
These objects with mixed characteristics exhibit a wide range in behaviours. OO Ser (also known as a deeply embedded outburst star, Hodapp et al., 1996) had a 10 years-long outburst, but during maximum brightness it showed a featureless, red rising continuum spectrum (Kóspál et al., 2007). V1647 Ori, perhaps the archetype of eruptive YSOs with mixed characteristics, shows multiple outbursts with duration longer than EX Lup type objects (i.e. 2 years or longer). The outbursts in V1647 Ori show spectroscopic characteristics of both EX Lup type objects and FUors (see e.g. Fischer et al., 2022). The eruptive YSOs arising from the VVV survey are dominated by objects with emission line spectra and outbursts with duration longer than those of EX Lup type objects. For example, 17 out of 19 eruptive YSOs from the VVV survey presented in Contreras Peña et al. (2017b) are classified as V1647 Ori-like objects. These are interpreted as eruptive YSOs where, in spite of the large outbursts, magnetospheric accretion still controls how mass is accreted onto the central star (see Contreras Peña et al., 2017a, b; Guo et al., 2020, 2021). Similar characteristics are observed in eruptive YSOs ASASSN-13db (Sicilia-Aguilar et al., 2017), Gaia 19bey (Hodapp et al., 2020), ESO-H 99 (Hodapp et al., 2019), UKIDSS J185318.36012454.5 (Nikoghosyan et al., 2017) and V1318 Cyg (Hillenbrand et al., 2022a). There have also been examples of YSOs showing FUor-like spectra at peak brightness, but with outbursts that are much shorter than expected in bona-fide FUors (VVVv322, Gaia 21bty; Contreras Peña et al., 2017b; Hillenbrand, 2021).
Periodic outbursts, which do no fit into the original classification and are often classified as peculiar, have been observed in a number of YSOs. V371 Ser (EC53, Hodapp et al., 2012; Yoo et al., 2017) shows quasi-periodic variability across a wide wavelength range (1–1100 m) with a period of P573 d. The variability is likely due to a cyclical buildup and draining of mass in the inner disk (Lee et al., 2020). Similar periodic behaviour has been observed in L1634 IRS7 (Hodapp & Chini, 2015), V347 Aur (Dahm & Hillenbrand, 2020), and 71 VVV sources in Guo et al. (2022). Dynamical perturbations from stellar or planetary companions have been invoked as a possible driver of the periodic variability (Lee et al., 2020).
Finally, surveys conducted at mid-IR and sub-mm wavelengths have permitted the detection of outbursts in YSOs at the earlier stages of young stellar evolution (Class 0/I YSOs) and that are generally too faint to be observed at the wavelengths that are commonly used to classify outbursts (optical and near-IR). Classification at these stages is sometimes difficult, with some objects showing nearly featureless spectra similar to OO Ser (V723 Car, 2MASS 223523457517076, Tapia et al., 2015; Kun et al., 2019). Many outburst sources are too faint for spectroscopic follow up even at the brightest point of the outburst, making it difficult to classify these objects into the FUor/EX Lup scheme, as is the case for YSOs NWISE-F J213723.5665145, HOPS 383, HOPS 12 and HOPS 124 (Safron et al., 2015; Connelley & Reipurth, 2020; Zakri et al., 2022) and many of the YSOs discovered by the JCMT Transient Survey (Lee et al., 2021).
New discoveries of eruptive variables have raised more questions as to the phenomenon of accretion related variability. It seems that we are not observing just two distinct classes of objects with well defined characteristics but rather events with a continuum of empirical measurements (Fischer et al., 2022). Understanding this continuum requires the discovery and analysis of a larger sample of outbursting YSOs.
3 Observations
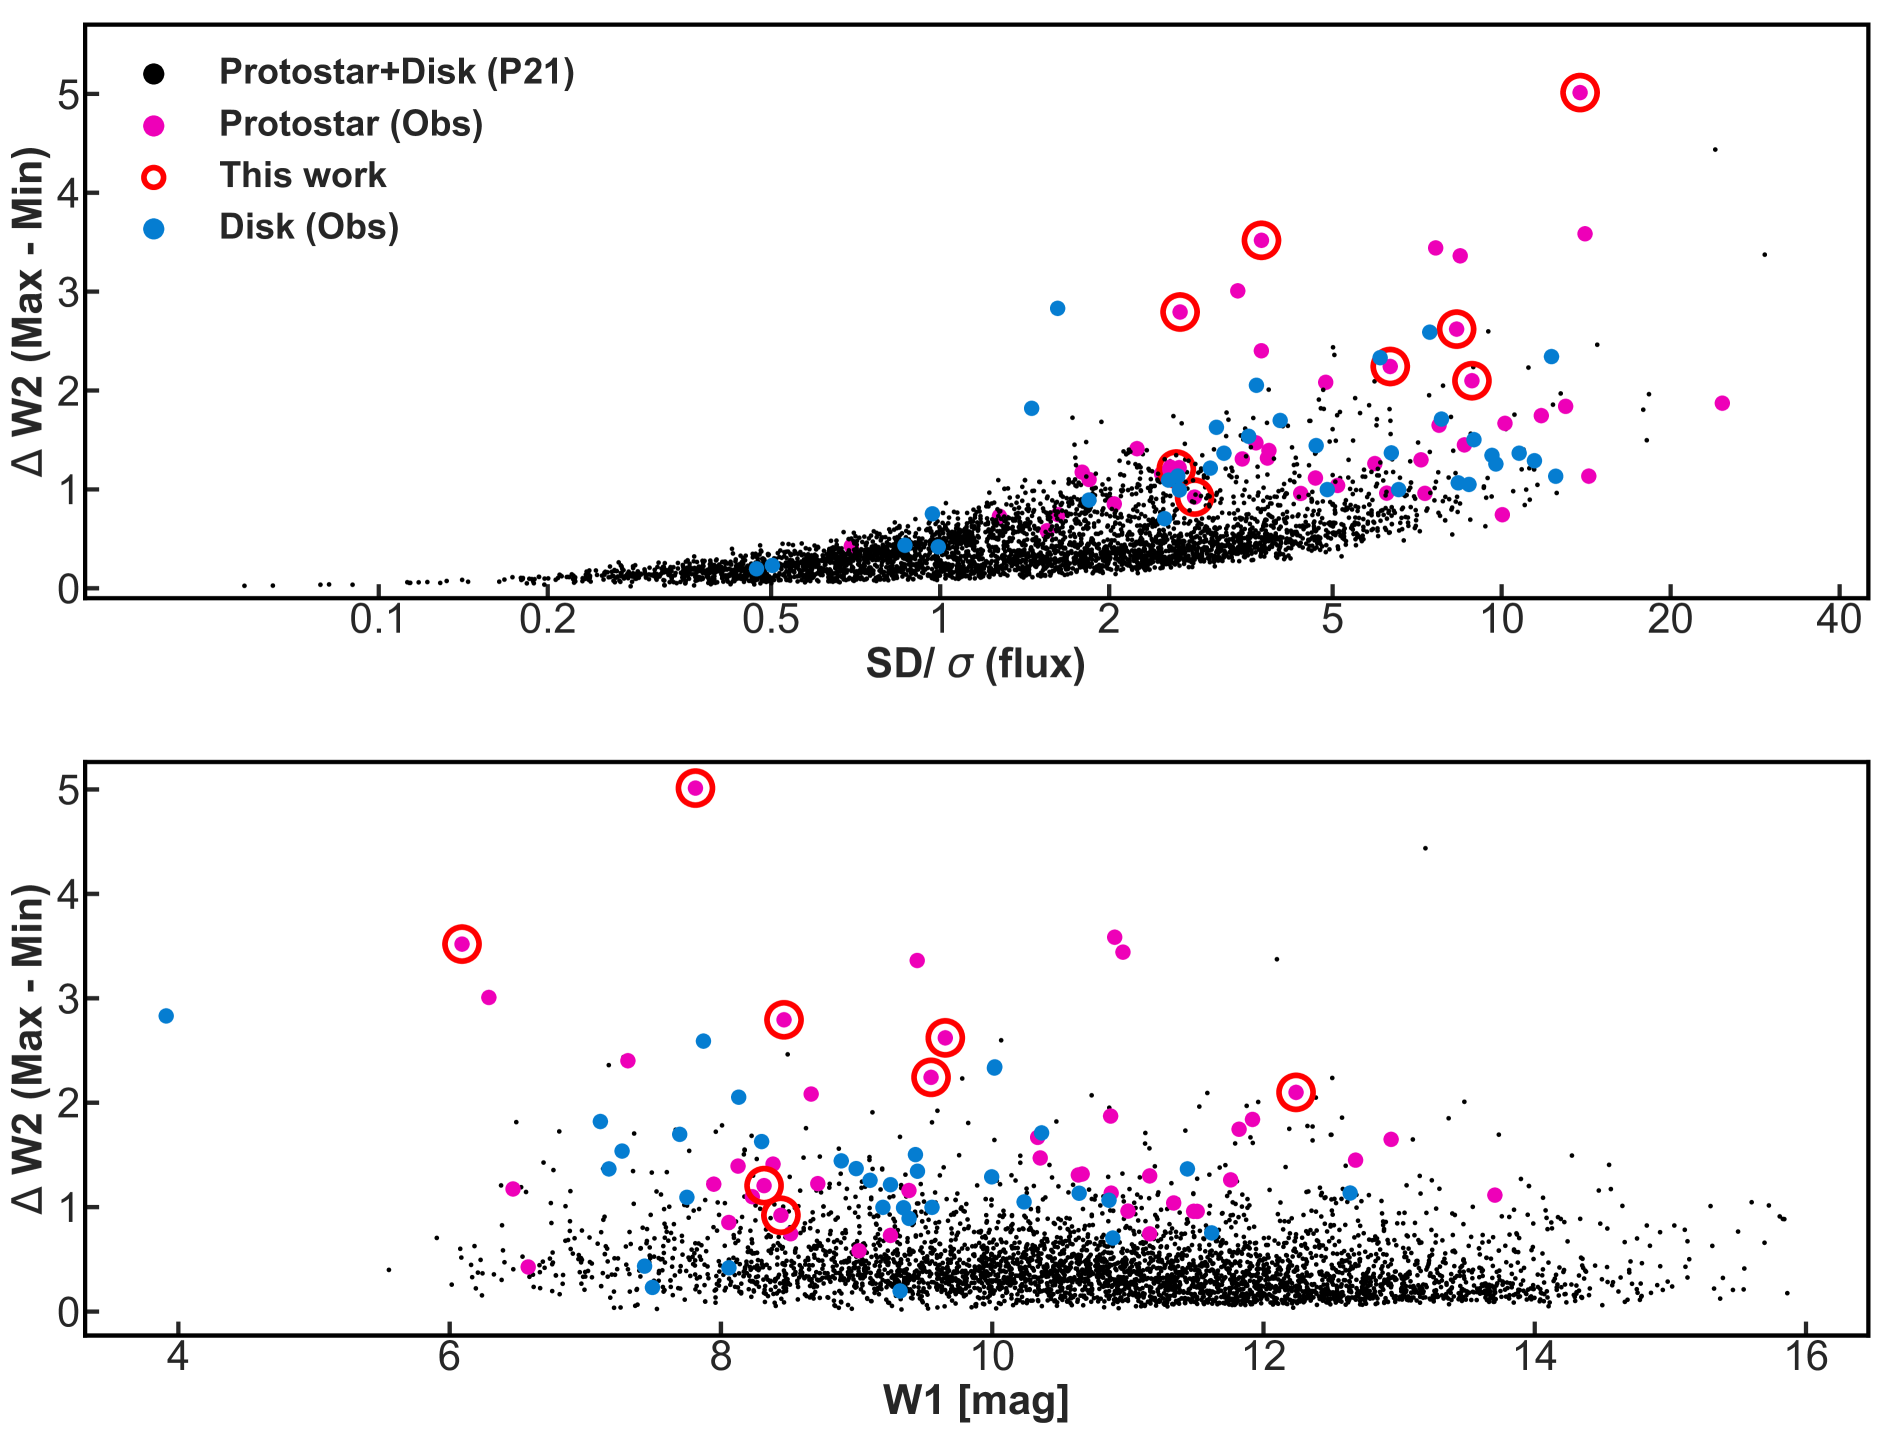
With the aim of understanding the physical mechanism driving the variability in the sources analysed by P21, we have collected spectroscopic data for 78 YSOs from P21. Figure 1 shows the amplitude, standard deviation over fiducial standard deviation (SD/ in flux space)111This parameter is used by P21 to quantify the likelihood that the mid-IR variability is real and not arising from measurement uncertainties., and magnitude of the 78 YSOs. The figure shows that YSOs with spectroscopic data tend to have the largest amplitudes within the sample of P21. In addition, we have observed the majority of YSOs with mag.
3.1 YSO sample
The YSOs presented in this work were selected as eruptive variables based on inspection of their near- to mid-IR light curves as well as their spectroscopic characteristics during follow-up. In this sense, we present only those objects where an interpretation as an eruptive variable was possible. Additional YSOs in the sample of P21 have light curves that could be classified as eruptive, however, due to lack of spectroscopic follow-up or difficult interpretation of the spectrum, we do not present them in this work.
For two YSOs from our sample, HOPS 315 and [LAL96] 213, we support our interpretation using additional 850 m data arising from the JCMT Transient Survey (Herczeg et al., 2017). The brightening event of HOPS 315 was first noticed in the sub-mm (Lee et al., 2021) and later associated to the mid-IR source, which is classified as non-variable in P21, and was therefore included in our follow-up. Sources that are seen to vary at sub-mm wavelengths are continuously cross-matched against the sample of P21 by our group.
One YSO included in our analysis is not in the sample of P21. V565 Mon was selected based on the similarity of its Gaia colour and magnitude to those expected in FUor objects, and was observed during one of the available nights of spectroscopic follow-up.
Figure 1 shows the properties for eight of the YSOs presented in this work, and that are part of P21. These YSOs are preferentially located towards the regions of the diagram with large values of both and SD/.
In Table 1 we show the general characteristics of the nine YSOs analysed in this work. The designation of the YSOs from P21 and their most common names are shown in columns 1 and 2. The right ascension and declination of the sources are presented in columns 3 and 4. The YSO class, luminosity and distances obtained from previous works are given in columns 5, 6 and 7, respectively. Finally, in columns 8 through 11, we show the amplitude and classification of the light curve from the analyses of P21 and this work. The differences observed between the amplitudes of columns 8 and 10 arise due to the additional epochs added during the analysis presented in this work (see Section 3.2).
The distances presented in Table 1 are taken from the latest available values for the clouds where the YSOs are located (usually determined from Gaia DR2 observations). The luminosities presented in this table are also corrected to reflect any changes in the assumed distances. The only exception is for V565 Mon, as there are no Gaia-based estimates for the dark cloud L1653. Andreasyan (2021) provides a range of distances to the dark cloud that are based on kinematic distances to CO clouds and photometric distances to OB stars (Maddalena et al., 1986; Kim et al., 2004). In the case of V565 Mon the distance ( pc) is taken as the average of the distances presented in Andreasyan (2021). The latter is in agreement with the Gaia distance estimated for V565 Mon itself , pc (Bailer-Jones et al., 2021).
| YSO ID (P21) | Other name | (J2000) | (J2000) | Class | Luminosity (L⊙) | Distance (pc) | (P21) | Class (P21) | (this work) | Class (this work) |
| (1) | (2) | (3) | (4) | (5) | (6) | (7) | (8) | (9) | (10) | (11) |
| D2369a | LDN 1455 IRS3 | 03:28:00.3 | 30:08:01.0 | I | 0.36 | 300 | 2.24 | Irregular | 2.24 | Irregular |
| M457 | HOPS 267 | 05:41:19.7 | 07:50:41.0 | I | 1.1 | 429 | 0.79 | Irregular | 5.01 | Burst |
| M713b | HOPS 154 | 05:38:20.1 | 06:59:04.9 | I | 0.09 | 389 | 2.15 | Irregular | 2.1 | Irregular |
| D1486c | 2MASS J210132806811204 | 21:01:32.8 | 68:11:20.0 | I | 6.9 | 341 | 1.98 | Burst | 2.62 | Linear |
| D1826d | 2MASS J215334724720439 | 21:53:34.7 | 47:20:44.0 | F/I | 3.97 | 800 | 0.92 | Linear | 0.92 | Linear |
| M3159 | HOPS 315 | 05:46:03.6 | 00:14:49.2 | I | 6.2 | 427 | 0.44 | non-variable | 1.21 | non-variable |
| D2439e | [LAL96] 213 | 03:29:07.7 | 31:21:57.0 | I | 25.9 | 300 | – | – | 3.52 | Curved |
| D1607f | GM Cha | 11:09:28.5 | 76:33:28.0 | I | 1.5 | 191 | – | – | 2.79 | Curved |
| – | V565 Mon | 06:58:02.7 | 07:56:43.6 | II | 130 | 1150 | – | – | 0.4 | non-variable |
| Dunham et al. (2015) estimates the luminosity as 0.29 L⊙ using a distance of 250 pc. The corrected distance is taken from Zucker et al. (2018) | ||||||||||
| Furlan et al. (2016) estimates the luminosity as 0.1 L⊙ using a distance of 420 pc. The corrected distance is taken from Tobin et al. (2020) | ||||||||||
| Dunham et al. (2015) estimates the luminosity as 3.1 L⊙ using a distance of 228 pc. The corrected distance is taken from Szilágyi et al. (2021) | ||||||||||
| Dunham et al. (2015) estimates the luminosity as 5.6 L⊙ using a distance of 950 pc. The corrected distance is taken from Wang et al. (2020). | ||||||||||
| Dunham et al. (2015) estimates the luminosity as 18 L⊙ using a distance of 950 pc. The corrected distance is taken from Zucker et al. (2018) | ||||||||||
| Dunham et al. (2015) estimates the luminosity as 0.9 L⊙ using a distance of 150 pc. The corrected distance is taken from Galli et al. (2021) | ||||||||||
3.2 Photometry
The original variability analysis from P21 is based on mid-IR multi-epoch observations from the WISE telescope. WISE surveyed the entire sky in four bands, W1 (3.4 m), W2 (4.6 m), W3 (12 m), and W4 (22 m), with the spatial resolutions of 6.1″, 6.4″, 6.5″, and 12″, respectively, from 2010 January to September (Wright et al., 2010). The survey continued as the NEOWISE Post-Cryogenic Mission, using only the W1 and W2 bands, for an additional 4 months (Mainzer et al., 2011). In 2013 September, WISE was reactivated as the NEOWISE-reactivation mission (NEOWISE-R, Mainzer et al., 2014). NEOWISE-R is still operating and the latest released data set contains observations until mid-December 2021.
The analysis of P21 only used 6.5 yr NEOWISE-R data taken between 2013 and 2020. For the photometric analysis presented here, we use the complete WISE/NEOWISE data, covering observations between 2010 until 2021, corresponding to 3 to 4 additional epochs. The data was collected from the NASA/IPAC Infrared Science Archive (IRSA) catalogues, where the queries and averaging of the data was done with the same method as P21.
In their analysis, P21 search for secular and stochastic variability in the long-term data of 7000 YSOs. Candidate variable stars are selected if they show . Lomb-Scargle (Lomb, 1976; Scargle, 1989) periodogram and linear fits are used to search for secular trends in the light curves of variable objects. YSOs that are well fitted by a linear model are classified as Linear. YSOs that do not show linear trends, but are well fitted by a sinusoidal light curve are classified as Periodic, if they have periods of d, or Curved if their periods are longer than 1200 d. YSOs that do not fall into the secular variability classes are defined as showing stochastic variability. The latter is further divided into Burst, Drop and Irregular classes. The variability class determined by P21 for the YSOs analysed in this work is shown in Table 1.
We follow a similar procedure to classify the updated light curves of the YSOs presented in this work. The new classifications are shown in Table 1. When searching for secular trends in the data, we follow P21 and only use NEOWISE-R data (2013-2021) when using the Lomb-Scargle periodogram, but we use the complete 2010-2021 light curve to fit linear trends. Parameters such as amplitude, average magnitudes and uncertainties are also estimated from the complete light curve. The additional WISE epochs obtained in 2010 as well as the epochs added during the latest data release explain the observed differences in parameters and classifications found in Table 1.
Additional near- and mid-IR photometry was collected for our YSO sample. The data was collected using public catalogues available in Vizier and the NASA/IPAC IRSA. The additional data was only used to visually inspect the longer term (20 years) trends and was not used in the determination of parameters, such as amplitude, nor was it included to re-classify the variability of the YSO.
3.3 Spectroscopic observations
The near-IR observations presented here were obtained as part of a larger programme to follow up interesting variables in the sample of P21 using low and high resolution spectrographs at Gemini, Palomar and IRTF observatories.
Our first proposals requested observations with FLAMINGOS-2 through Gemini partnerships with Republic of Korea and the Dominion of Canada. After an initial set of observations, we then accessed time on Palomar/Triplespec through the Telescope Access Program in People’s Republic of China and NASA IRTF/SpeX through open time offered by the United States of America. With this range in facilities, we assigned fainter sources to Gemini and brighter sources to IRTF and Palomar.
In the following we describe the data acquisition and reduction for the different instruments used in the observations presented in this work. A summary is presented in Table 2.
3.3.1 Flamingos-2
We obtained K-band spectra of GM Cha on 22 February 2021 using Flamingos-2 (Eikenberry et al., 2004) on the 8.1 m Gemini South telescope at Cerro Pachon, Chile (programme GS-2021A-Q-110, PI Johnstone). We used the R3K grism with a 3-pxiel wide long-slit to achieve a resolution of . We obtained s exposures nodding along the slit in an ABBA pattern. Observations of B9V star HD 96092 were also acquired in the same setup for a telluric correction. All reduction steps were executed with standard procedures using the GEMINI package in IRAF.
3.3.2 SpeX
We obtained near-IR spectra of the YSOs LDN 1455 IRS3, HOPS267, HOPS 154, 2MASS J215334724720439, HOPS 315 and LAL96 213 on 23-27 November 2021 with SpeX (Rayner et al., 2003) mounted at the NASA Infrared Telescope Facility (IRTF) on Mauna Kea (programme 2021B043, PI Herczeg). The cross-dispersed spectra cover 0.7–2.5 m spectra at , obtained with the 0.3″and 0.5″slits. Total integration times ranged from 1800 to 3600s, with individual exposures of 300s. Bright A0V standard stars were observed for telluric calibration. All spectra were reduced and calibrated using Spextool version 4.1 (Cushing et al., 2004).
3.3.3 TripleSpec
We obtained 1–2.4 m observations () of 2MASS J210132806811204 and V565 Mon on 12 December 2021 using Triplespec (Herter et al., 2008) mounted on the Palomar 200-inch Hale telescope (PI Herczeg). We obtained 430s and 4300s exposures, nodding along the list on an ABBA pattern, for V565 Mon and 2MASS J210132806811204, respectively. Bright A0V standard stars were observed for telluric calibration. All spectra were reduced and calibrated using Spextool version 4.1 (Cushing et al., 2004).
| YSO | Instrument | Date | |
|---|---|---|---|
| LDN 1455 IRS3 | IRTF/Spex | 2000 | 27-Nov-2021 |
| HOPS 267 | IRTF/Spex | 2000 | 27-Nov-2021 |
| HOPS 154 | IRTF/Spex | 2000 | 27-Nov-2021 |
| 2MASS J210132806811204 | Palomar/TripleSpec | 2700 | 12-Dec-2021 |
| 2MASS J215334724720439 | IRTF/Spex | 2000 | 23-Nov-2021 |
| HOPS 315 | IRTF/Spex | 2000 | 23-Nov-2021 |
| LAL96 213 | IRTF/Spex | 2000 | 24-Nov-2021 |
| GM Cha | Gemini/Flamingos 2 | 1600 | 22-Feb-2021 |
| V565 Mon | Palomar/TripleSpec | 2700 | 12-Dec-2021 |
4 The YSOs
In this section we discuss the various characteristics of individual sources, including information from the literature, photometric behaviour and classifications, and the observed spectroscopic characteristics. These characteristics are only briefly analysed, as it is the purpose of this work to place these sources into the broader context of the classification of eruptive variability.
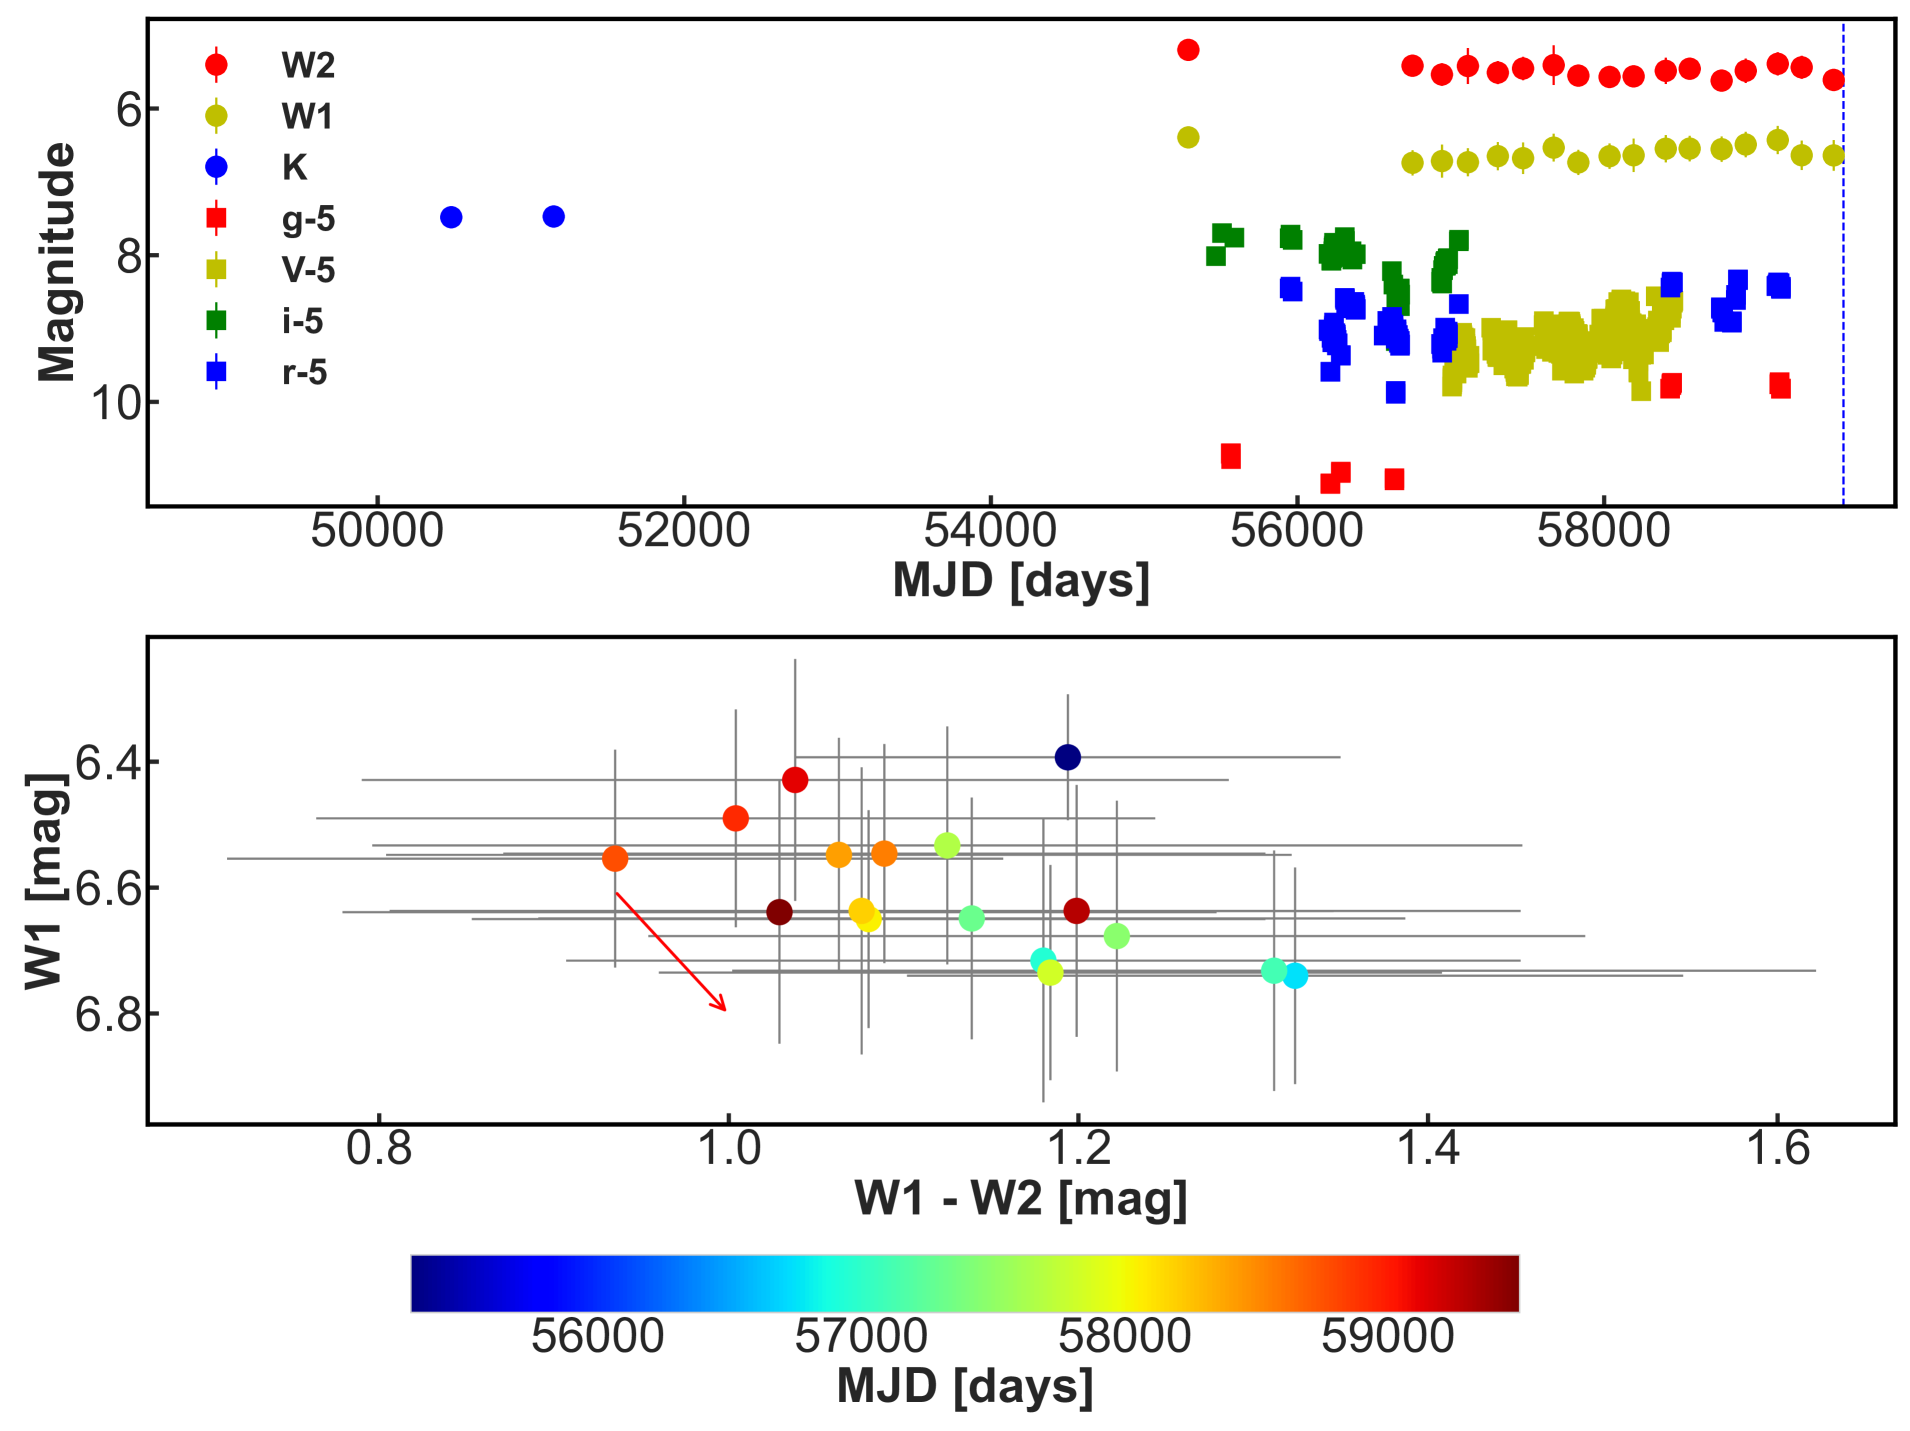
LDN 1455 IRS3: Located in the LDN 1455 dark cloud and a member of the Perseus complex, at a distance of 300 pc (Zucker et al., 2018). This Class I YSO (Kryukova et al., 2012) had already been catalogued as a candidate EX Lup type object based only on its high-amplitude variability between Spitzer and WISE observations (Antoniucci et al., 2014). Both P21 and this work detect high-amplitude variability (W2 mag) that result in the source being classified as Irregular (see Table 1). The light-curve classification, as defined in P21, determines how well the variation can be fitted by either a sinusoidal or linear model. The light curve of the YSO cannot be fitted by these specific models, hence the Irregular classification. However the light curve does show indications of some periodicity in the brightening events of the source.
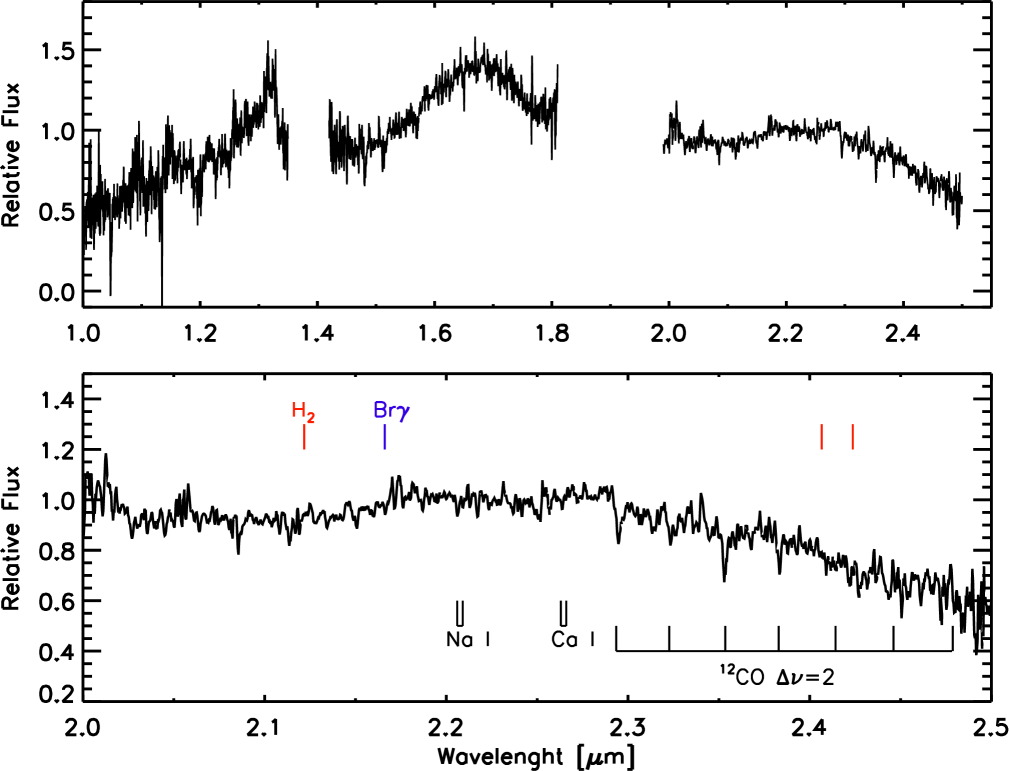
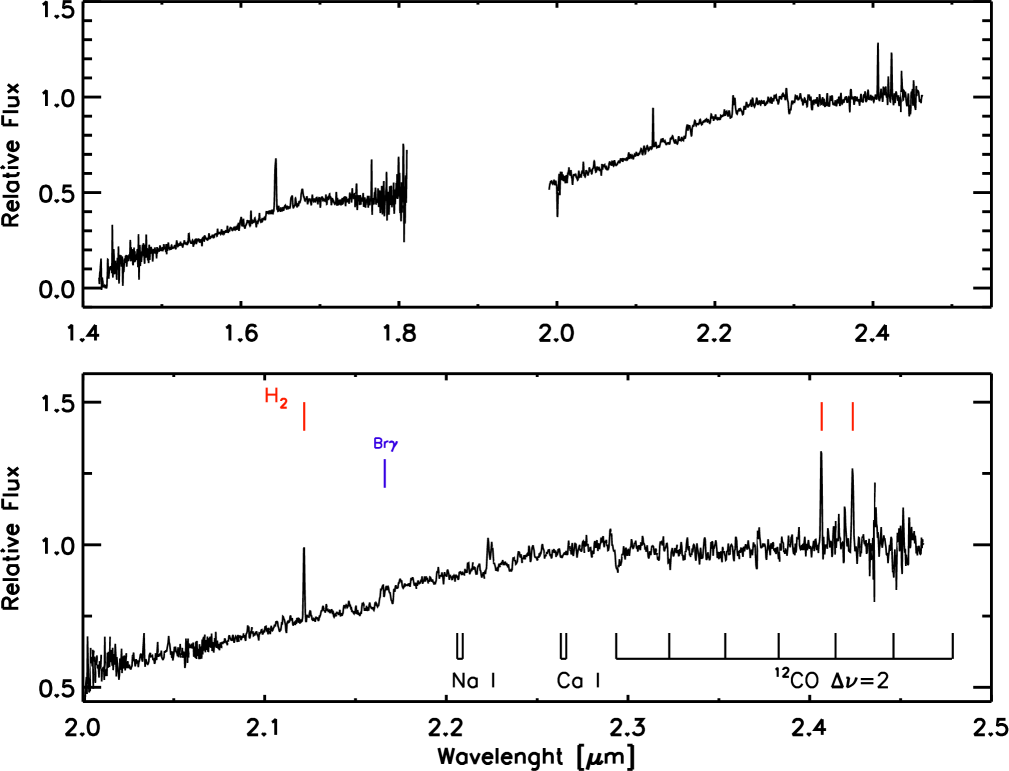
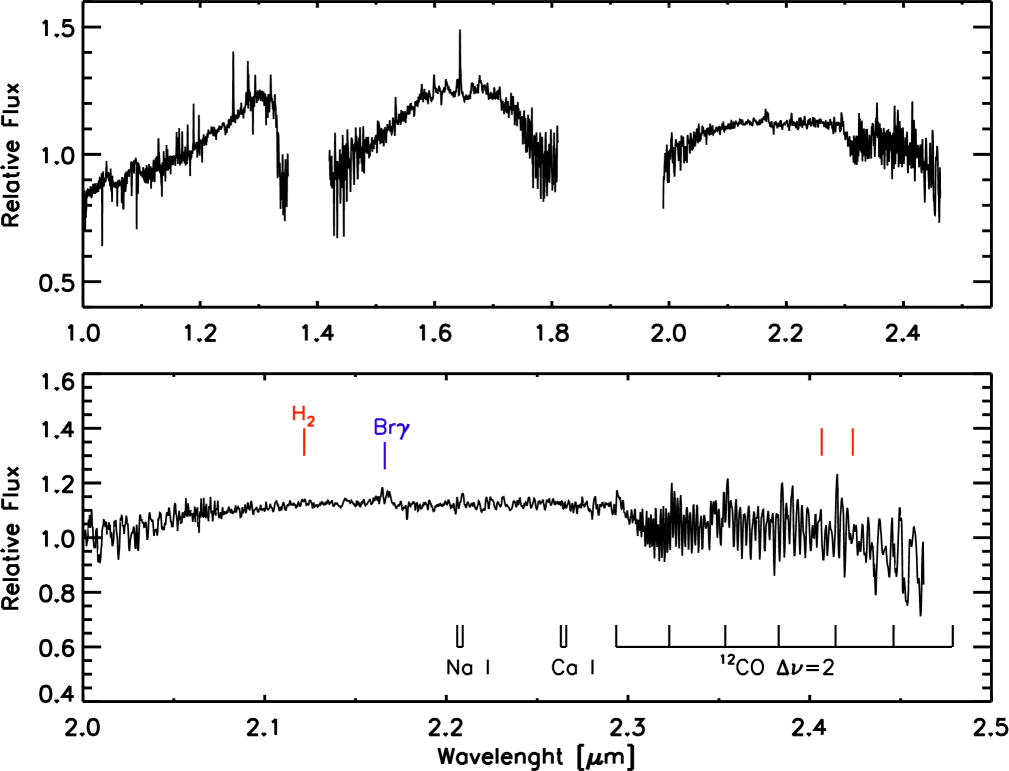
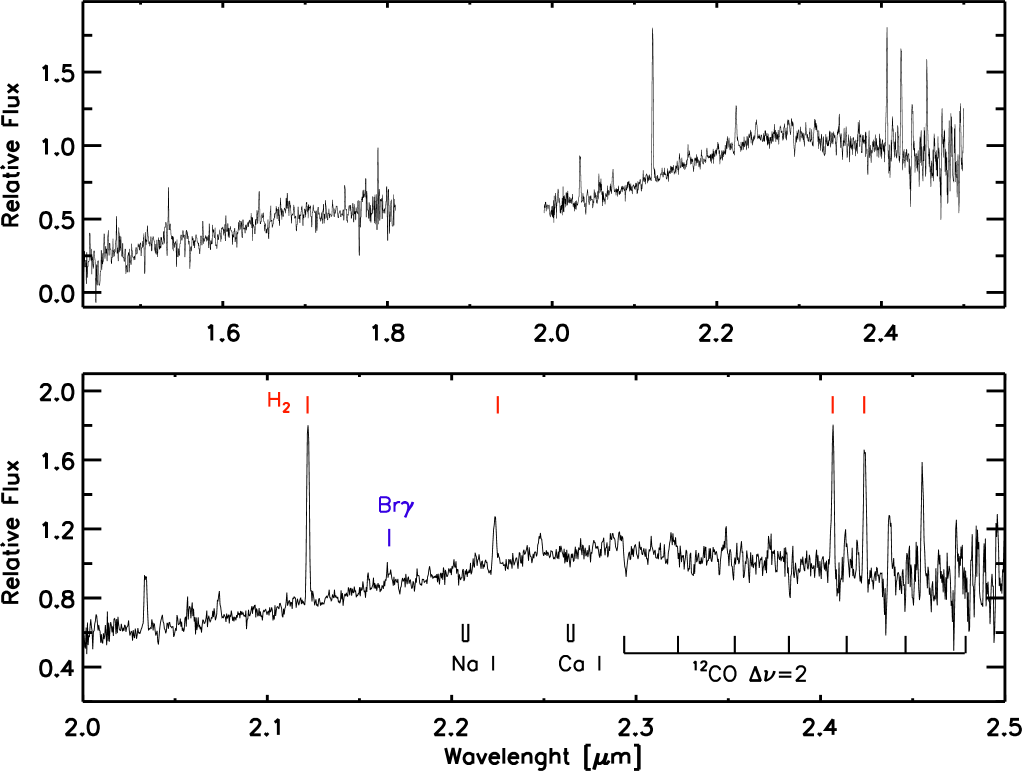
The IRTF spectrum (Fig. 2) shows strong H2 emission, as well as CO and H2O absorption (beyond 2.29 m), although only the 12CO band appears to be detected. Br emission is apparent but weak. The faint H-band continuum shows some hints of triangular shape due to the H2O absorption. The closest photometric point to the epoch of spectroscopic observations shows the YSO at minimum brightness. However, if the object follows the same pattern of past variability, it is very likely that the YSO was observed close to maximum brightness.
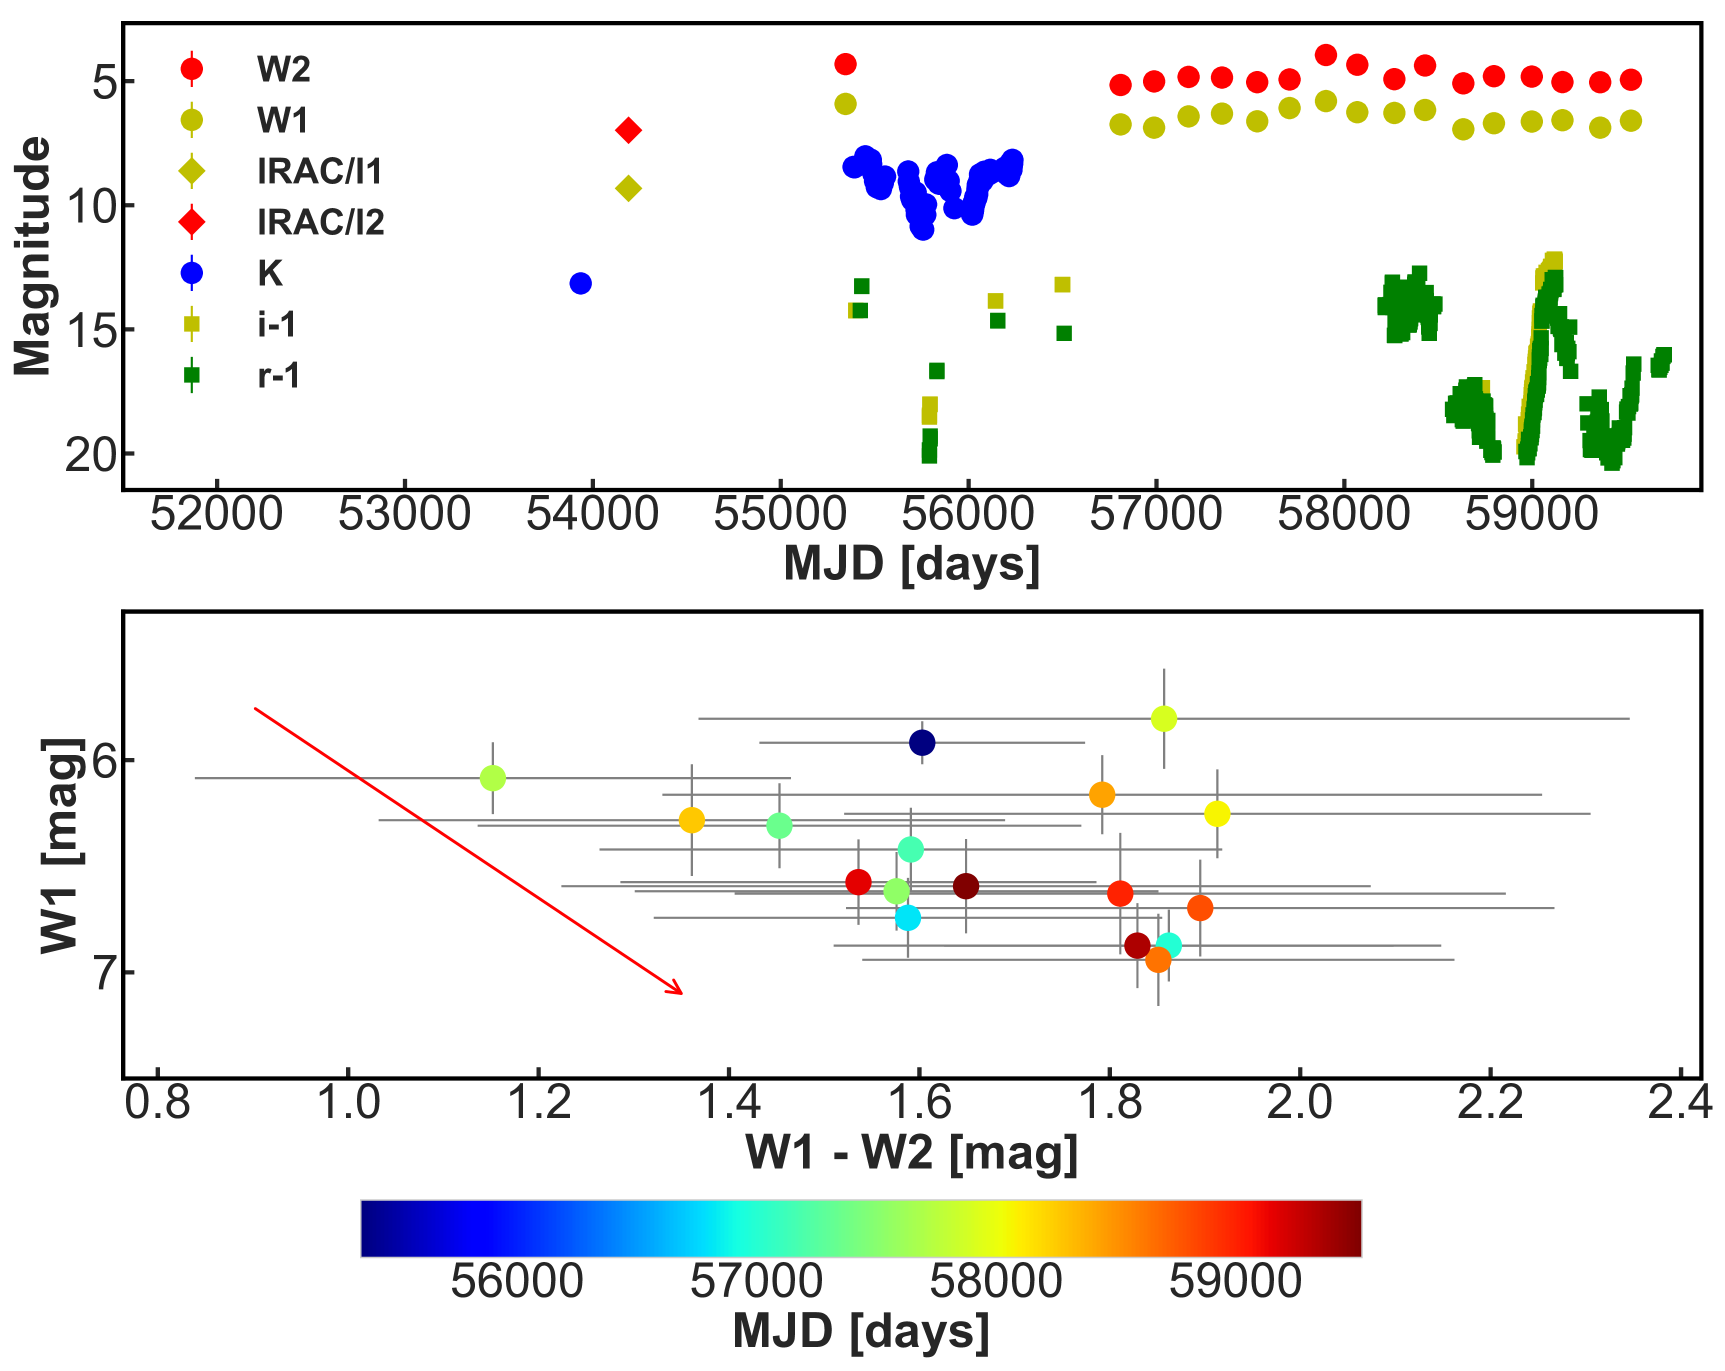
HOPS 267: This YSO is located in the Orion Nebula Cluster at a distance of 429 pc (Tobin et al., 2020). It was first classified as a Class I YSO by Megeath et al. (2012) and is part of The Herschel Orion Protostar Survey (HOPS, Furlan et al., 2016), with an SED that is well fit by a YSO model with .
Figure 2 shows that the YSO displays irregular low amplitude variability up to the epochs analysed by P21. This variability seems to follow the interstellar reddening line. However, the latest epochs in NEOWISE show a large amplitude (W2=5.01 mag) increase, with the source becoming much redder in the process. The high-amplitude variability in the last epochs changes its classification to the Burst class.
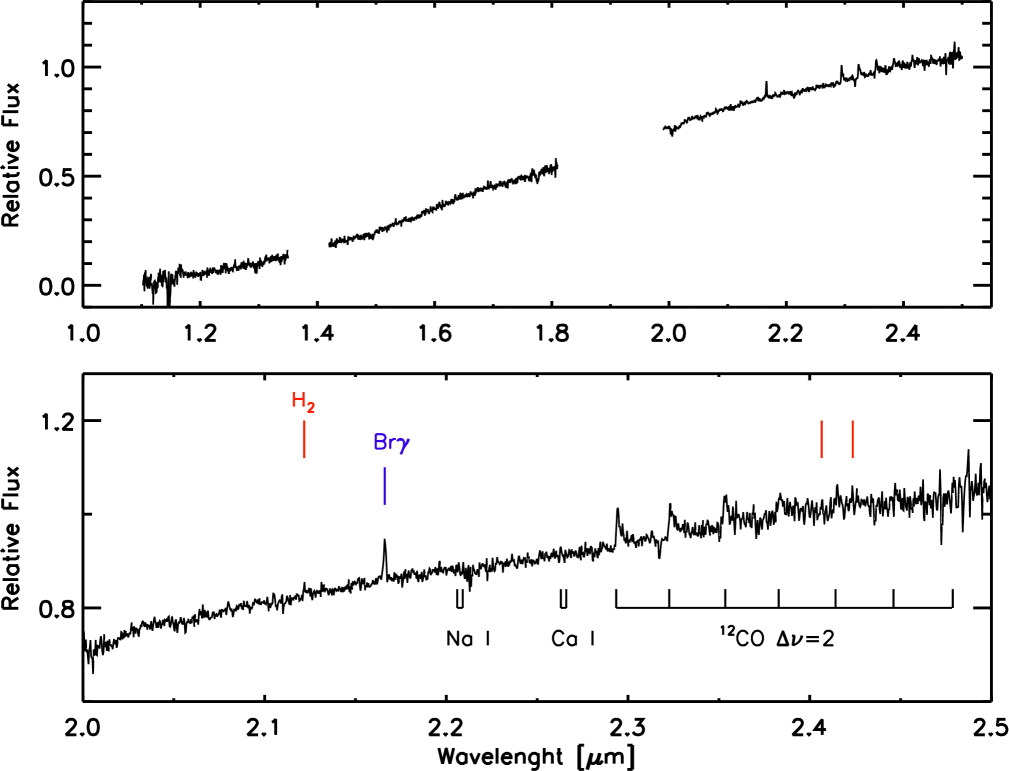
We obtained spectroscopic observations apparently as the system was still getting brighter. The object shows a red rising spectrum with marked Br- and CO emission.
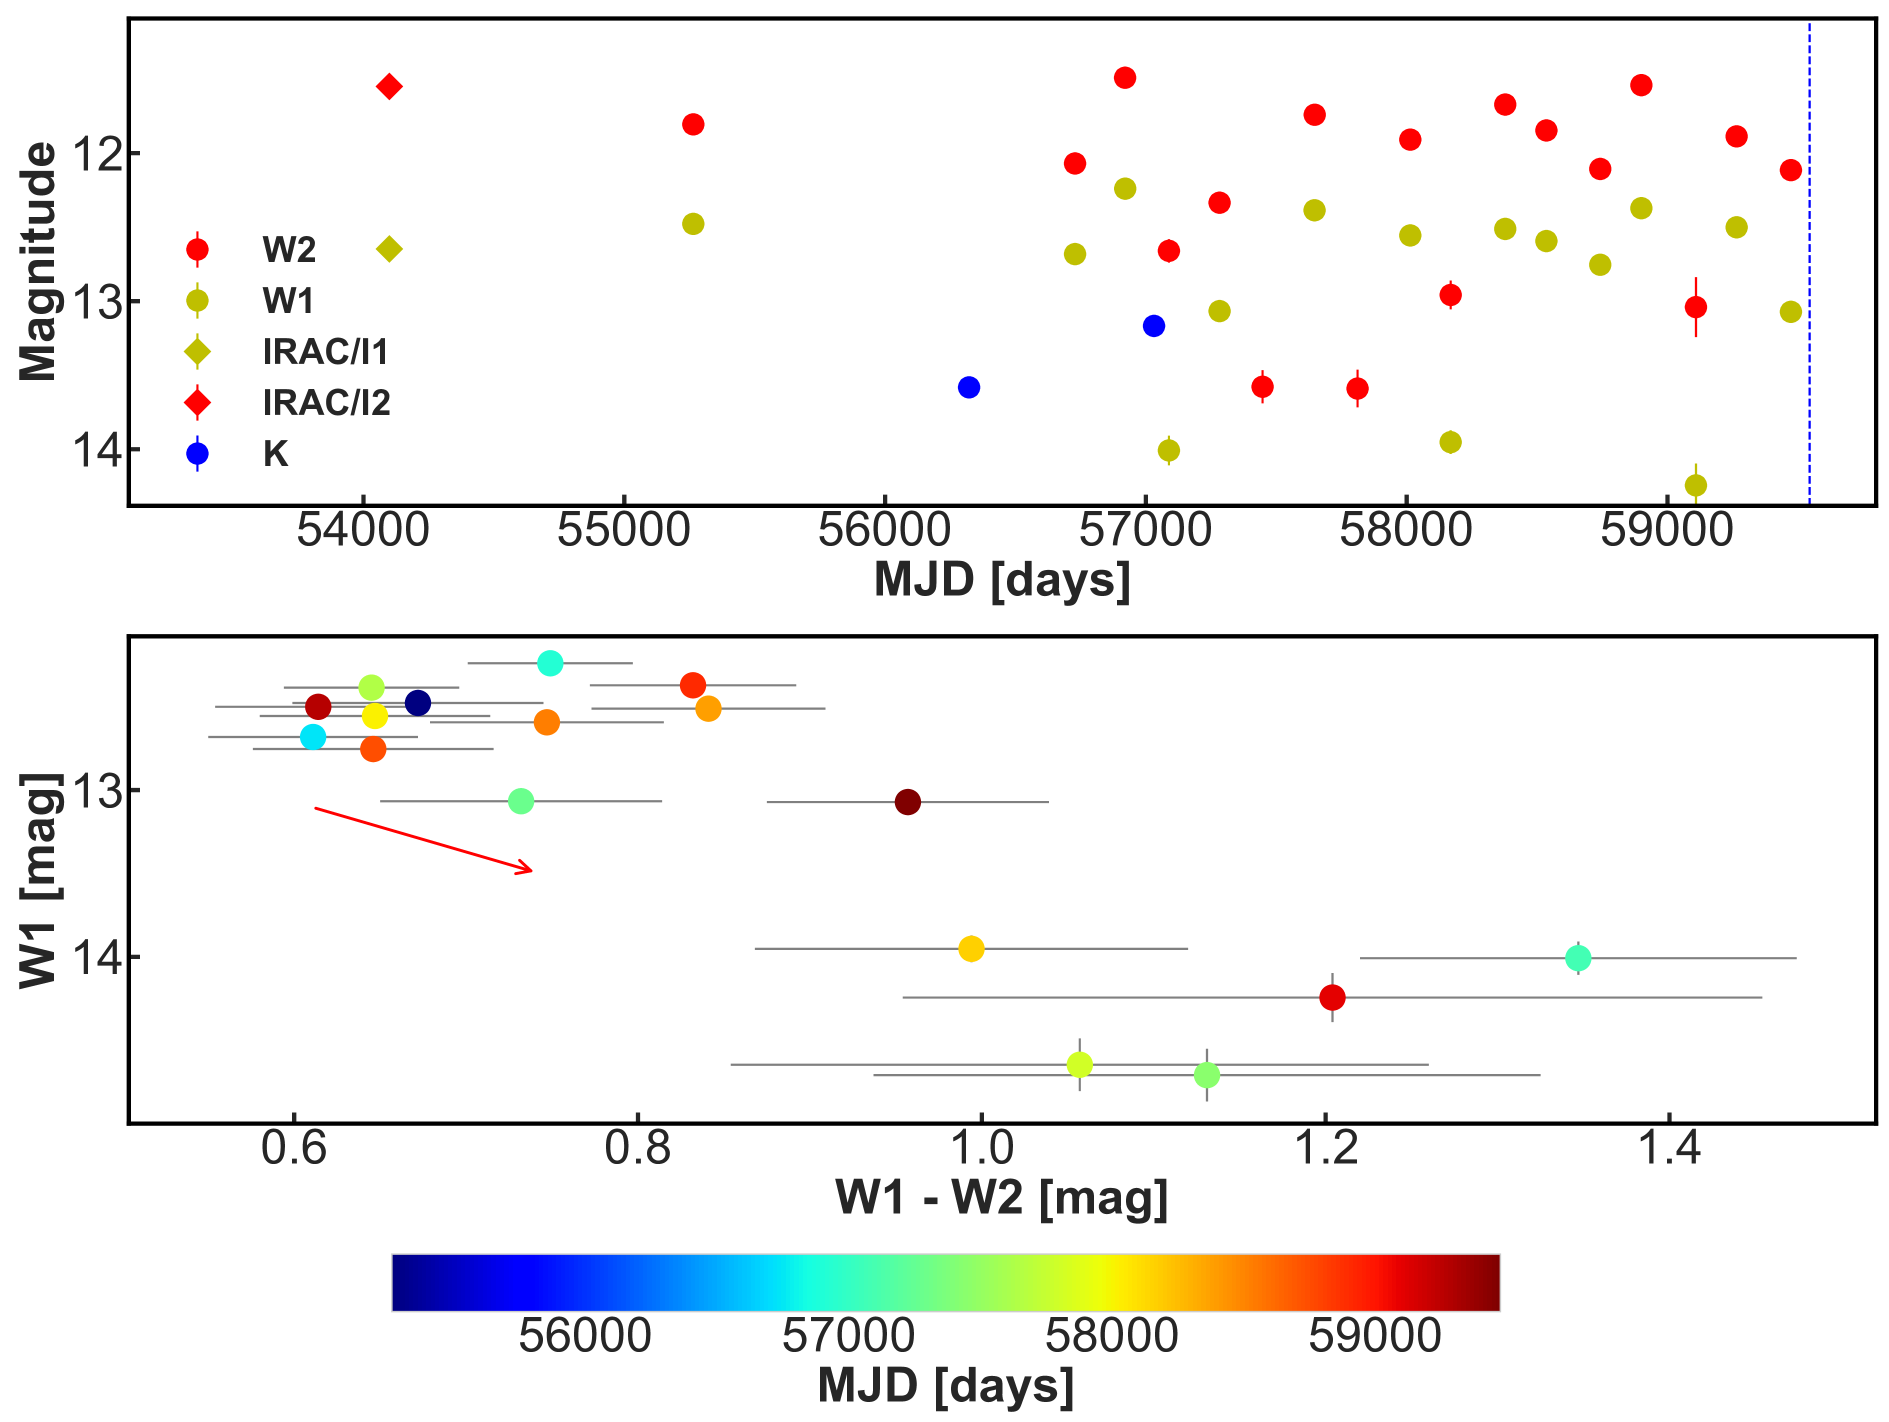
HOPS 154: This YSO is located in the Orion Nebula Cluster at a distance of 389 pc (Tobin et al., 2020). It was first detected and classified as a protostar by Megeath et al. (2012) based on 2MASS and Spitzer observations. The YSO is part of the HOPS survey, with a SED that is well fit by a model with a bolometric luminosity of . Kryukova et al. (2012) classifies the object as a Class I YSO based on its m spectral index of , although the large variability of this object (see Fig. 4) likely affects the spectral slope . Nevertheless, the bolometric temperature and luminosity of the system estimated by Furlan et al. (2016) agree with a Class I SED classification.
The near-to mid-IR light curve of HOPS 154 (Fig. 4) shows irregular, high-amplitude variability. The YSO is classified by P21 as an Irregular variable star with an amplitude of mag. The additional epochs analysed in this work do not change the classification nor the amplitude of this system. The vs colour-magnitude diagram of Fig. 4 shows that the YSO gets systematically bluer as it changes into the bright state. This behaviour appears to repeat throughout the different outbursts of the YSO.
The IRTF spectrum, obtained when the YSO was close to its brightest magnitude, shows a H-band continuum with a triangular shape due to H2O absoprtion, and strong CO bandhead absorption beyond 2.29 m (Fig. 4 ).
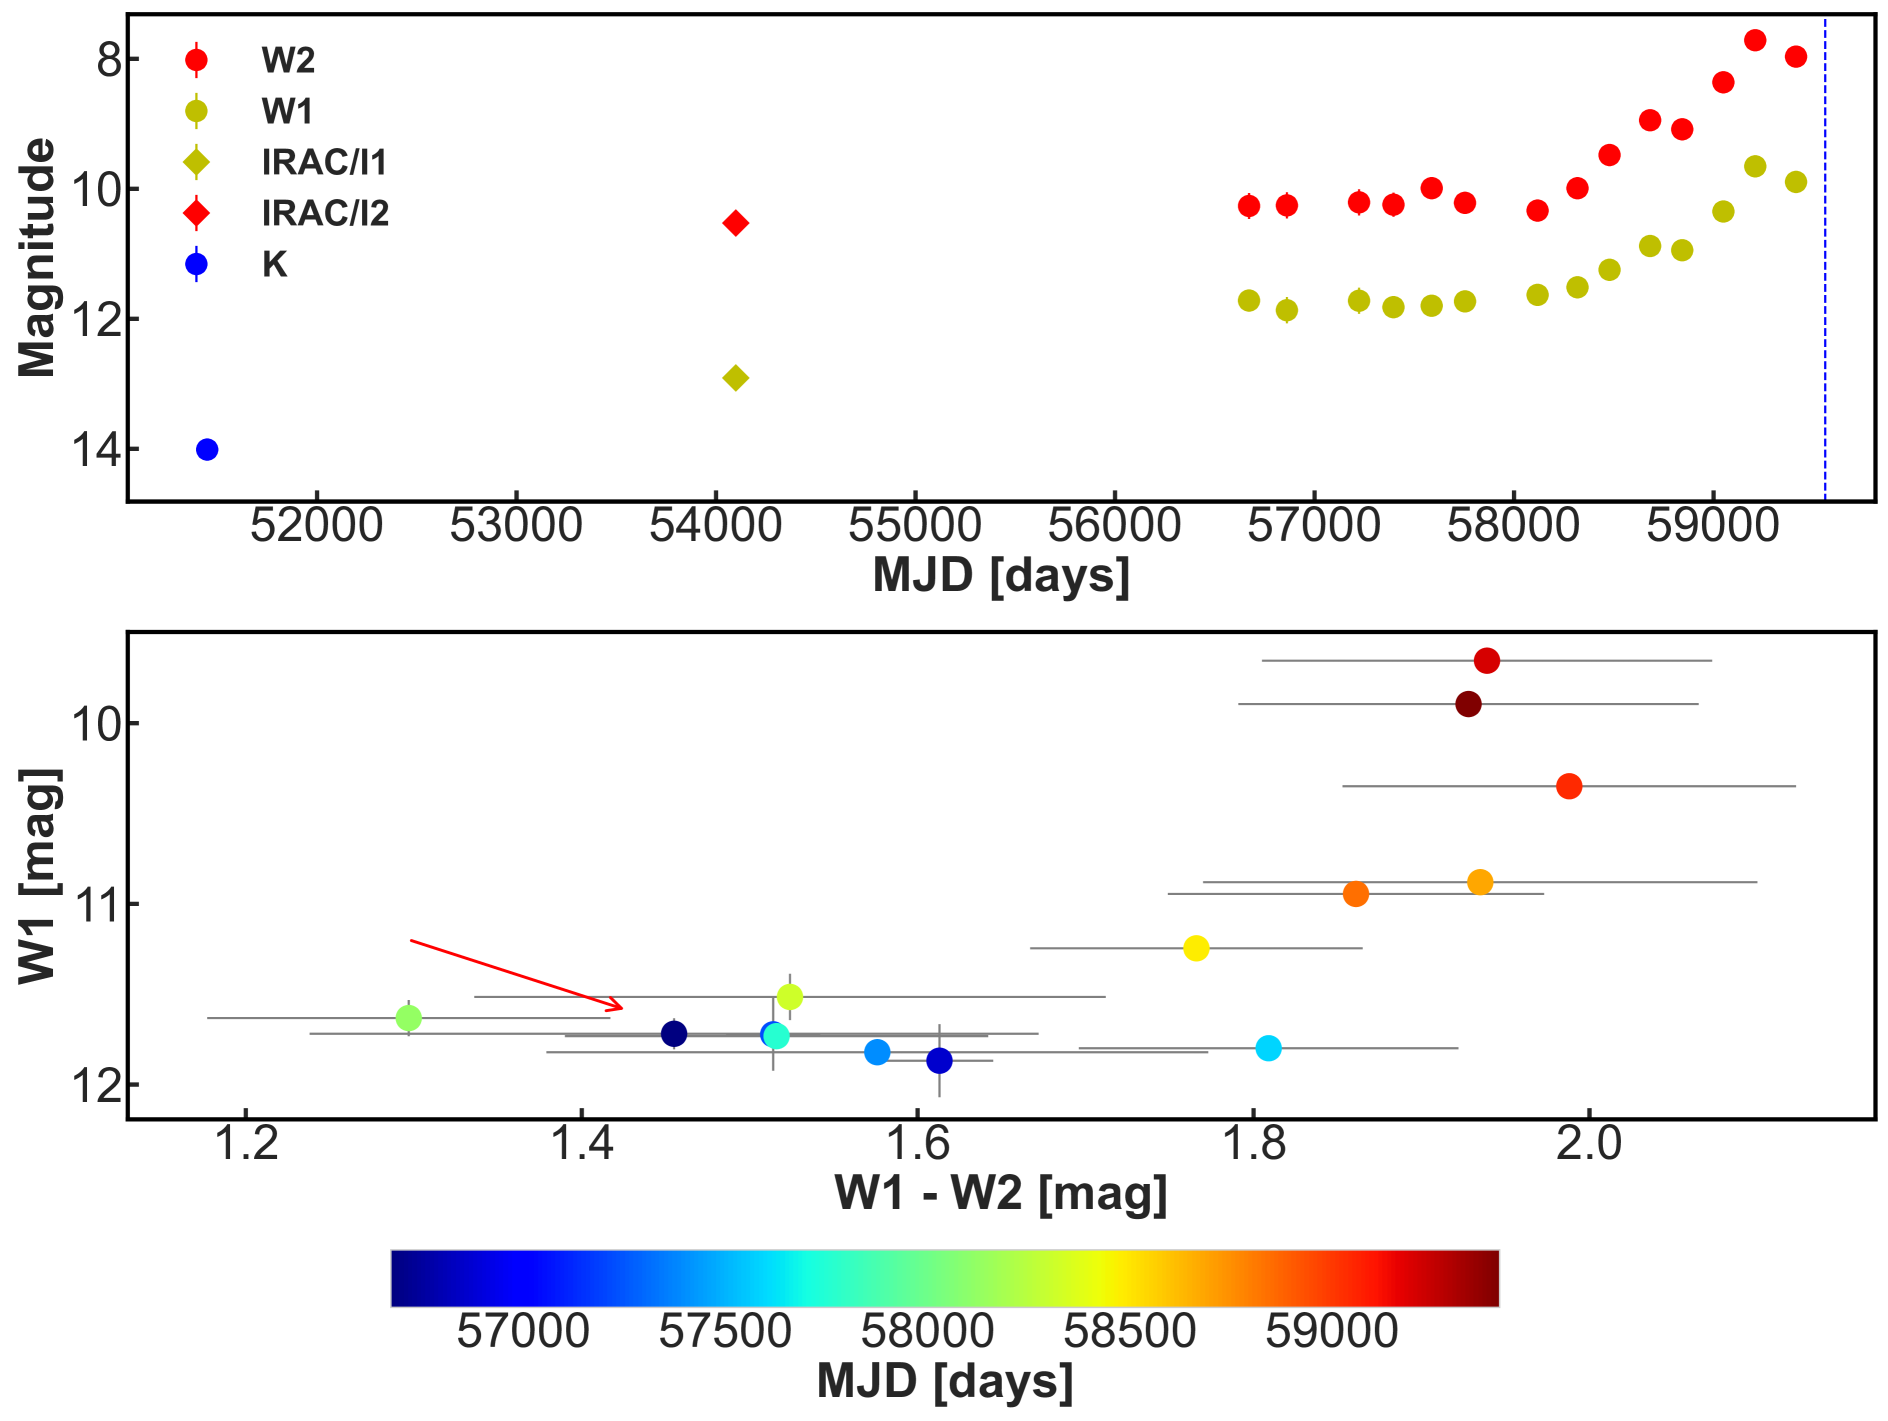
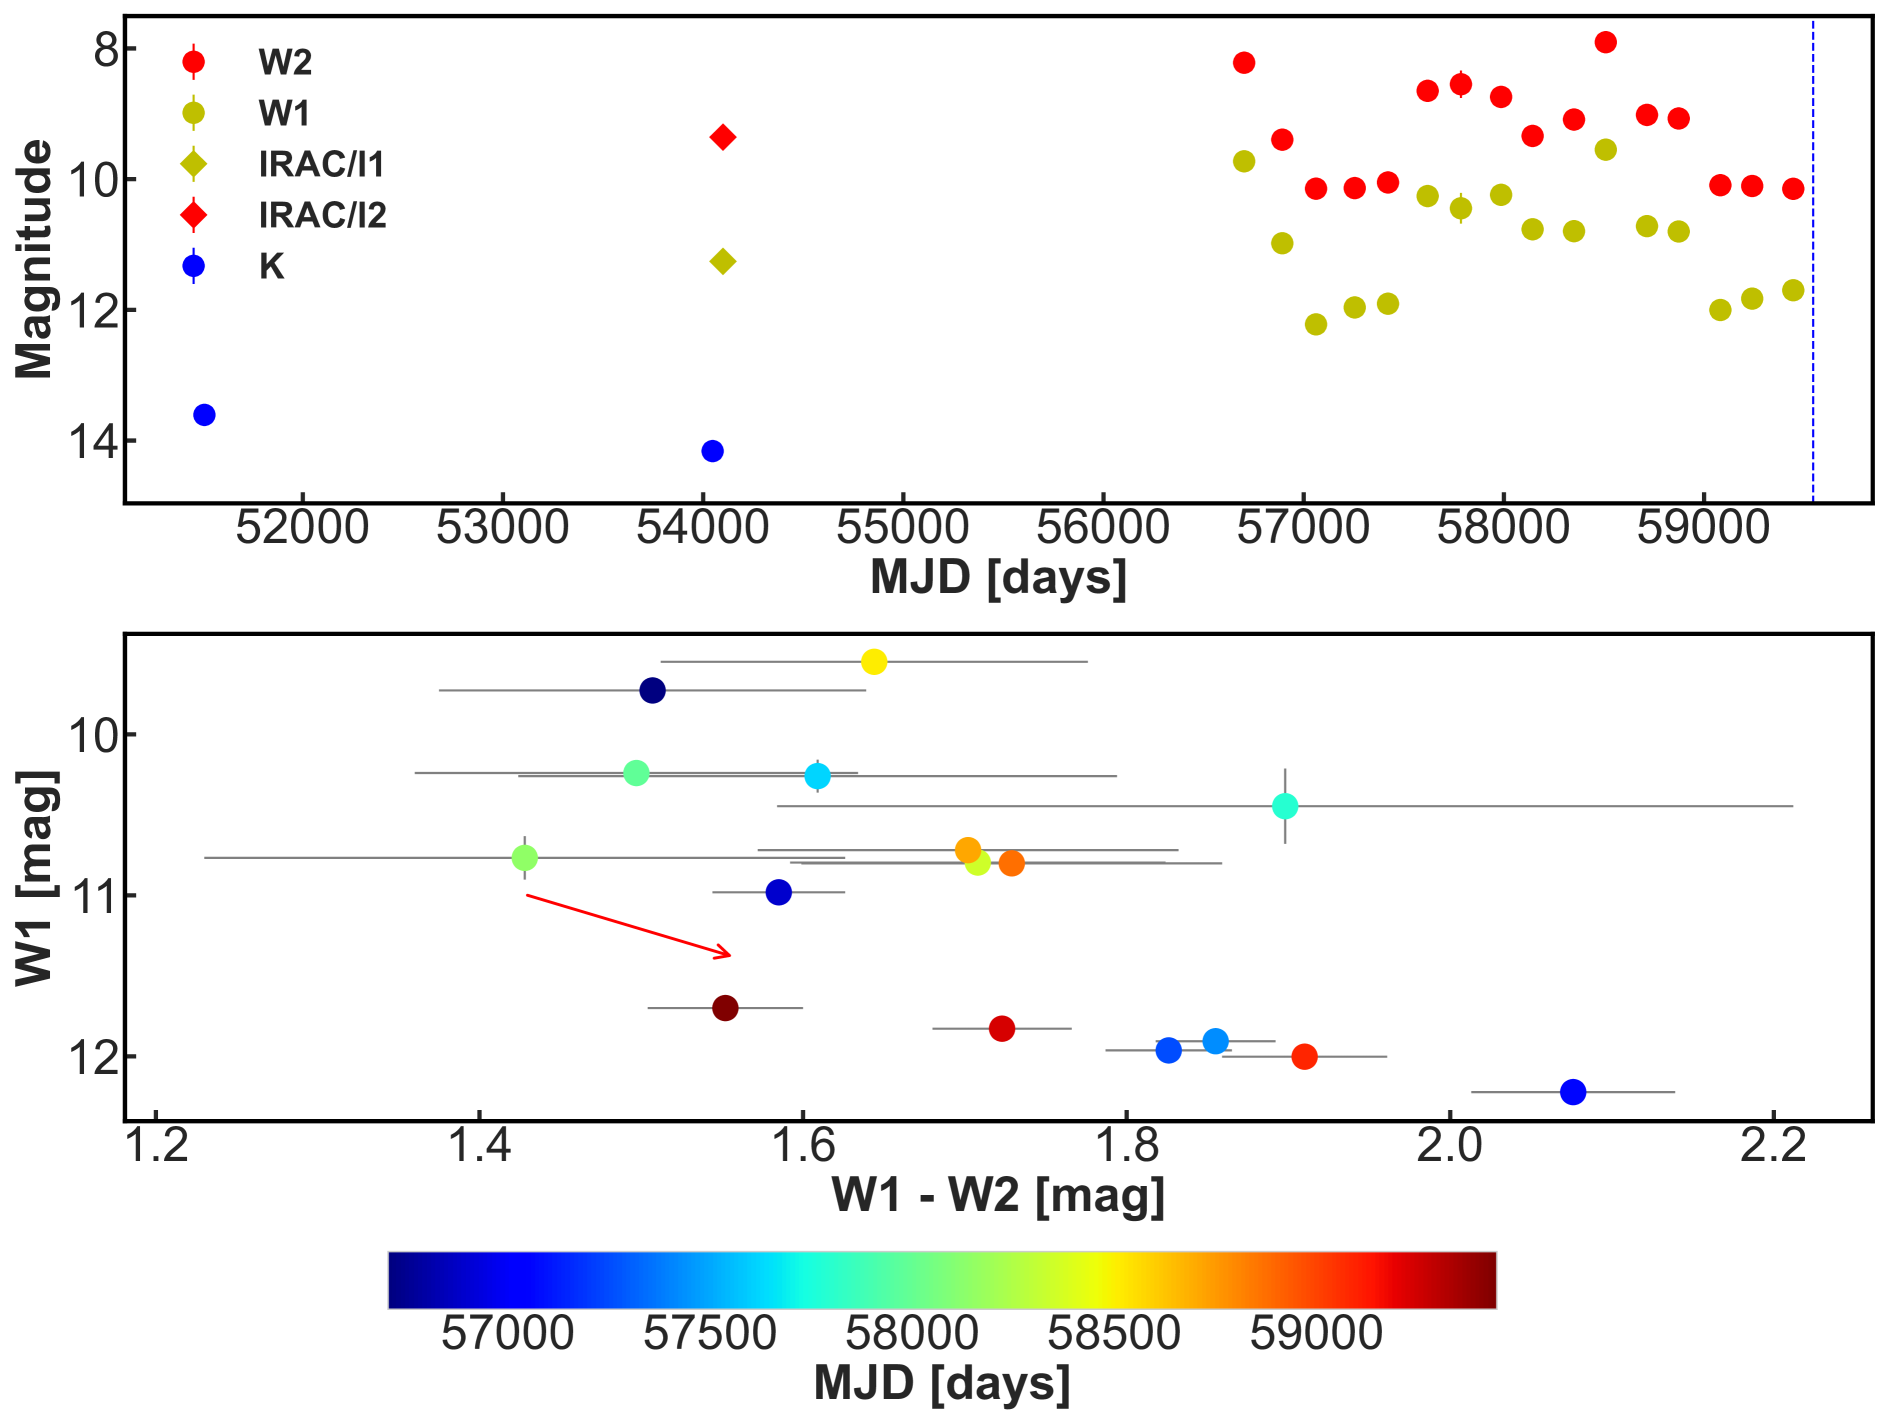
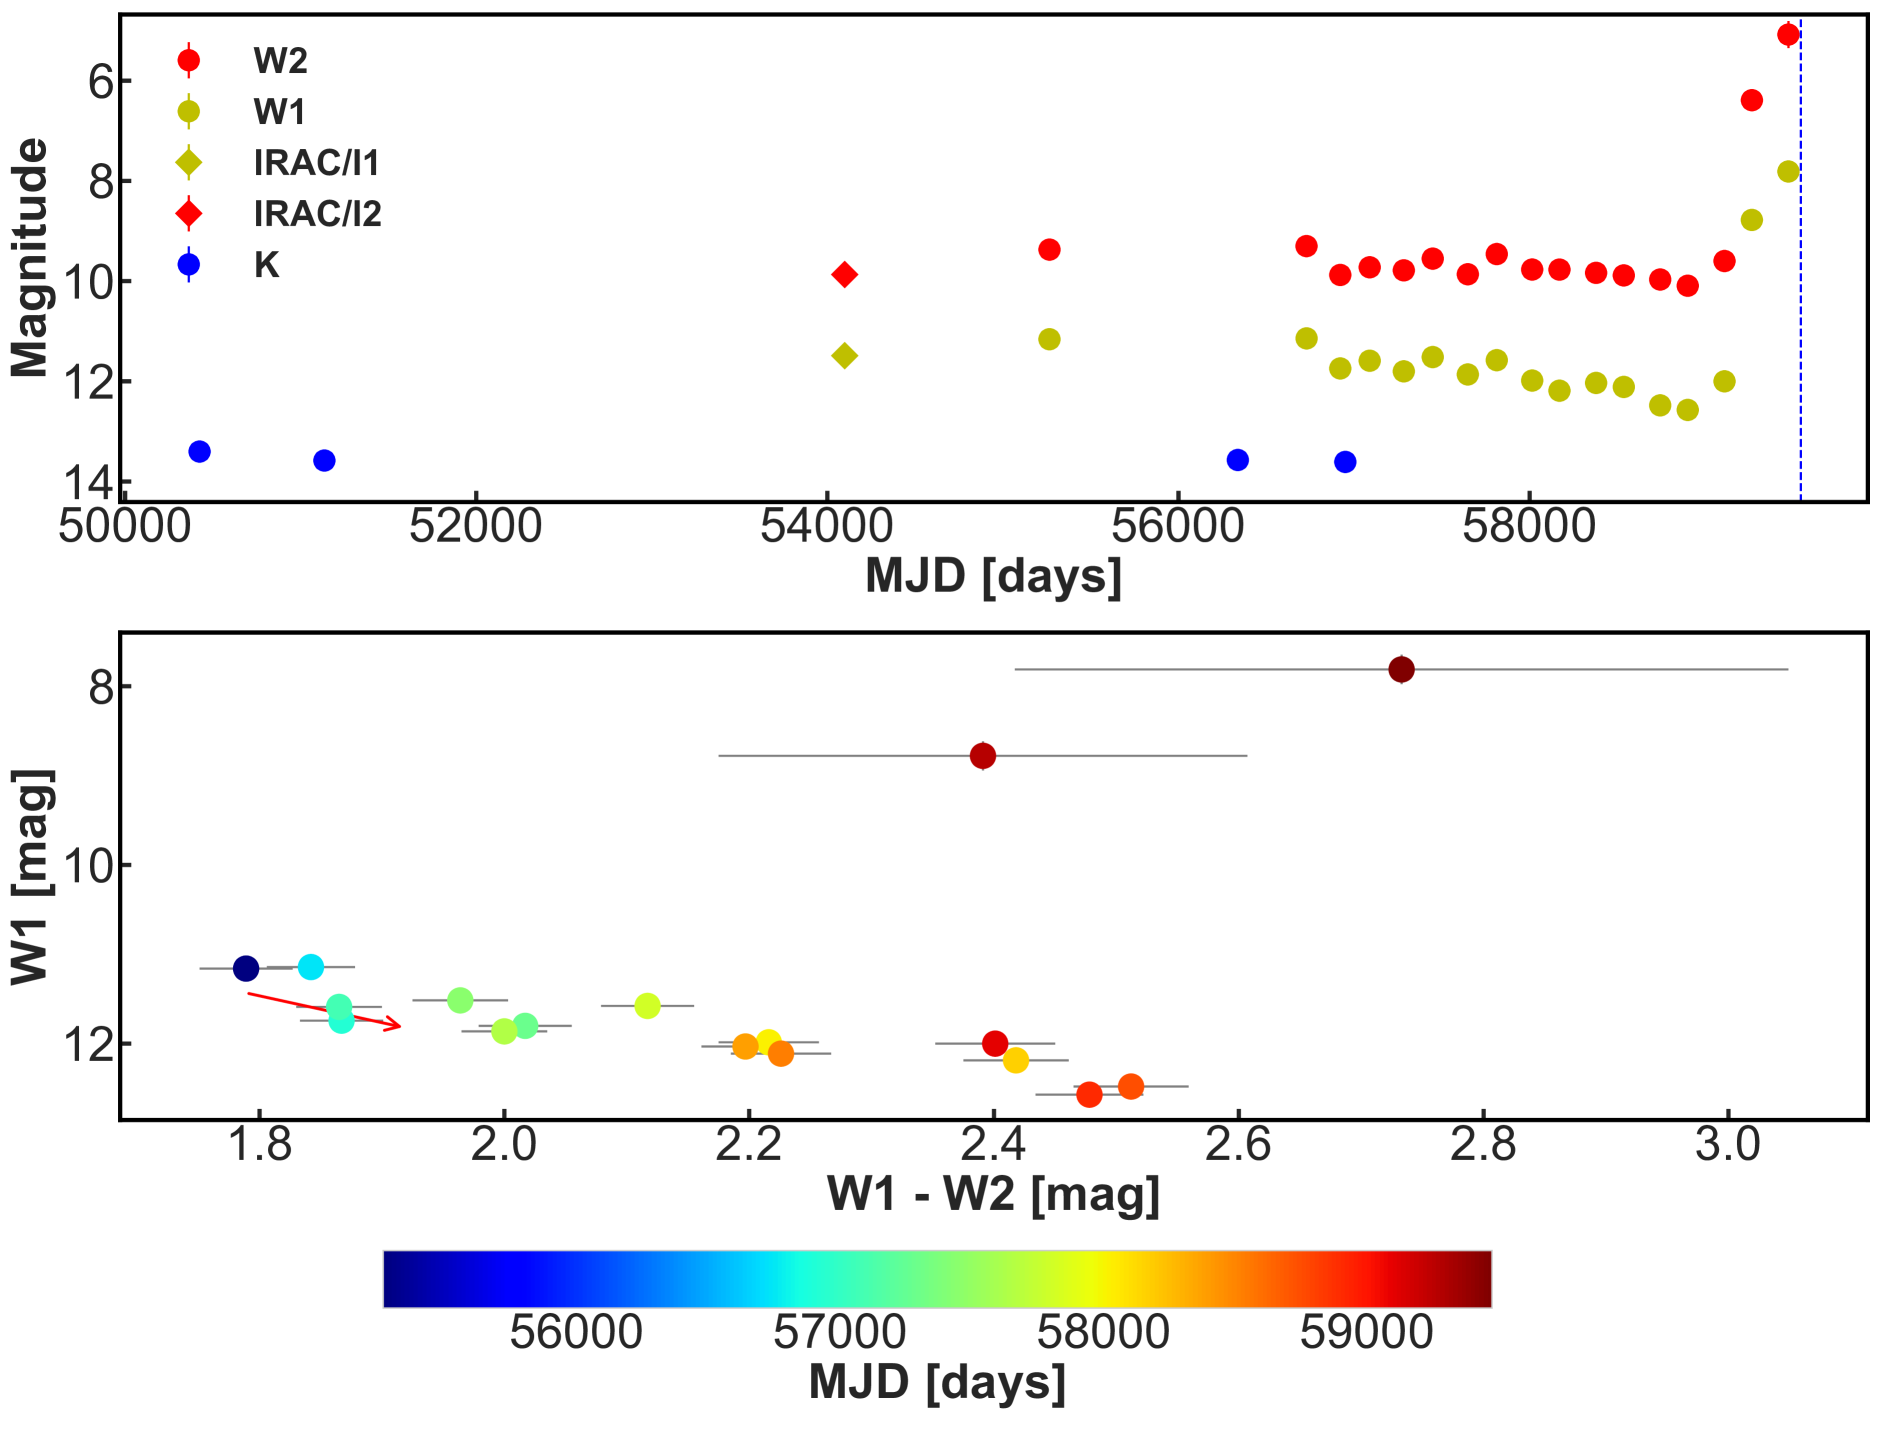
2MASS J210132806811204: This source is a Class I YSO located in the Lynds 1172/1174 dark cloud at a distance of 341 pc (Szilágyi et al., 2021).
The mid-IR light curve of the YSO is classified as Linear due to the recent outburst (starting close to MJD58000 d) with mag. The evolution of the W1 vs W1W2 curve during the outburst (Fig. 5) does not follow the reddening line, therefore we can discard changes in the extinction along the line of sight as the driving mechanism for the variability of the YSO.
The Palomar/TripleSpec spectrum of the YSO, taken close to maximum, shows a triangular H-band spectrum, 12CO bandhead absorption, and no emission from atomic Hydrogen lines. H2 emission, likely associated to an outflow, can be seen in the spectrum of the source.
2MASS J215334724720439: This object is part of the YSO sample of Dunham et al. (2015) and is located in the IC5146 molecular cloud at a distance of 800 pc (Wang et al., 2020). The YSO has an infrared spectral index that ranges between 0.24 (Gutermuth et al., 2009) and 0.4 (Dunham et al., 2015), giving a classification as either a flat-spectrum or Class I YSO.
The mid-IR light curve of the YSO (Fig. 5) is categorised as Linear with and amplitude of 0.92 mag in W2. Both the classification and amplitude remain the same between the analysis by P21 and this work. The IRTF/Spex spectrum (5) appears as a relatively featureless red rising spectrum. Only Br and 12CO bandhead emission are apparent.
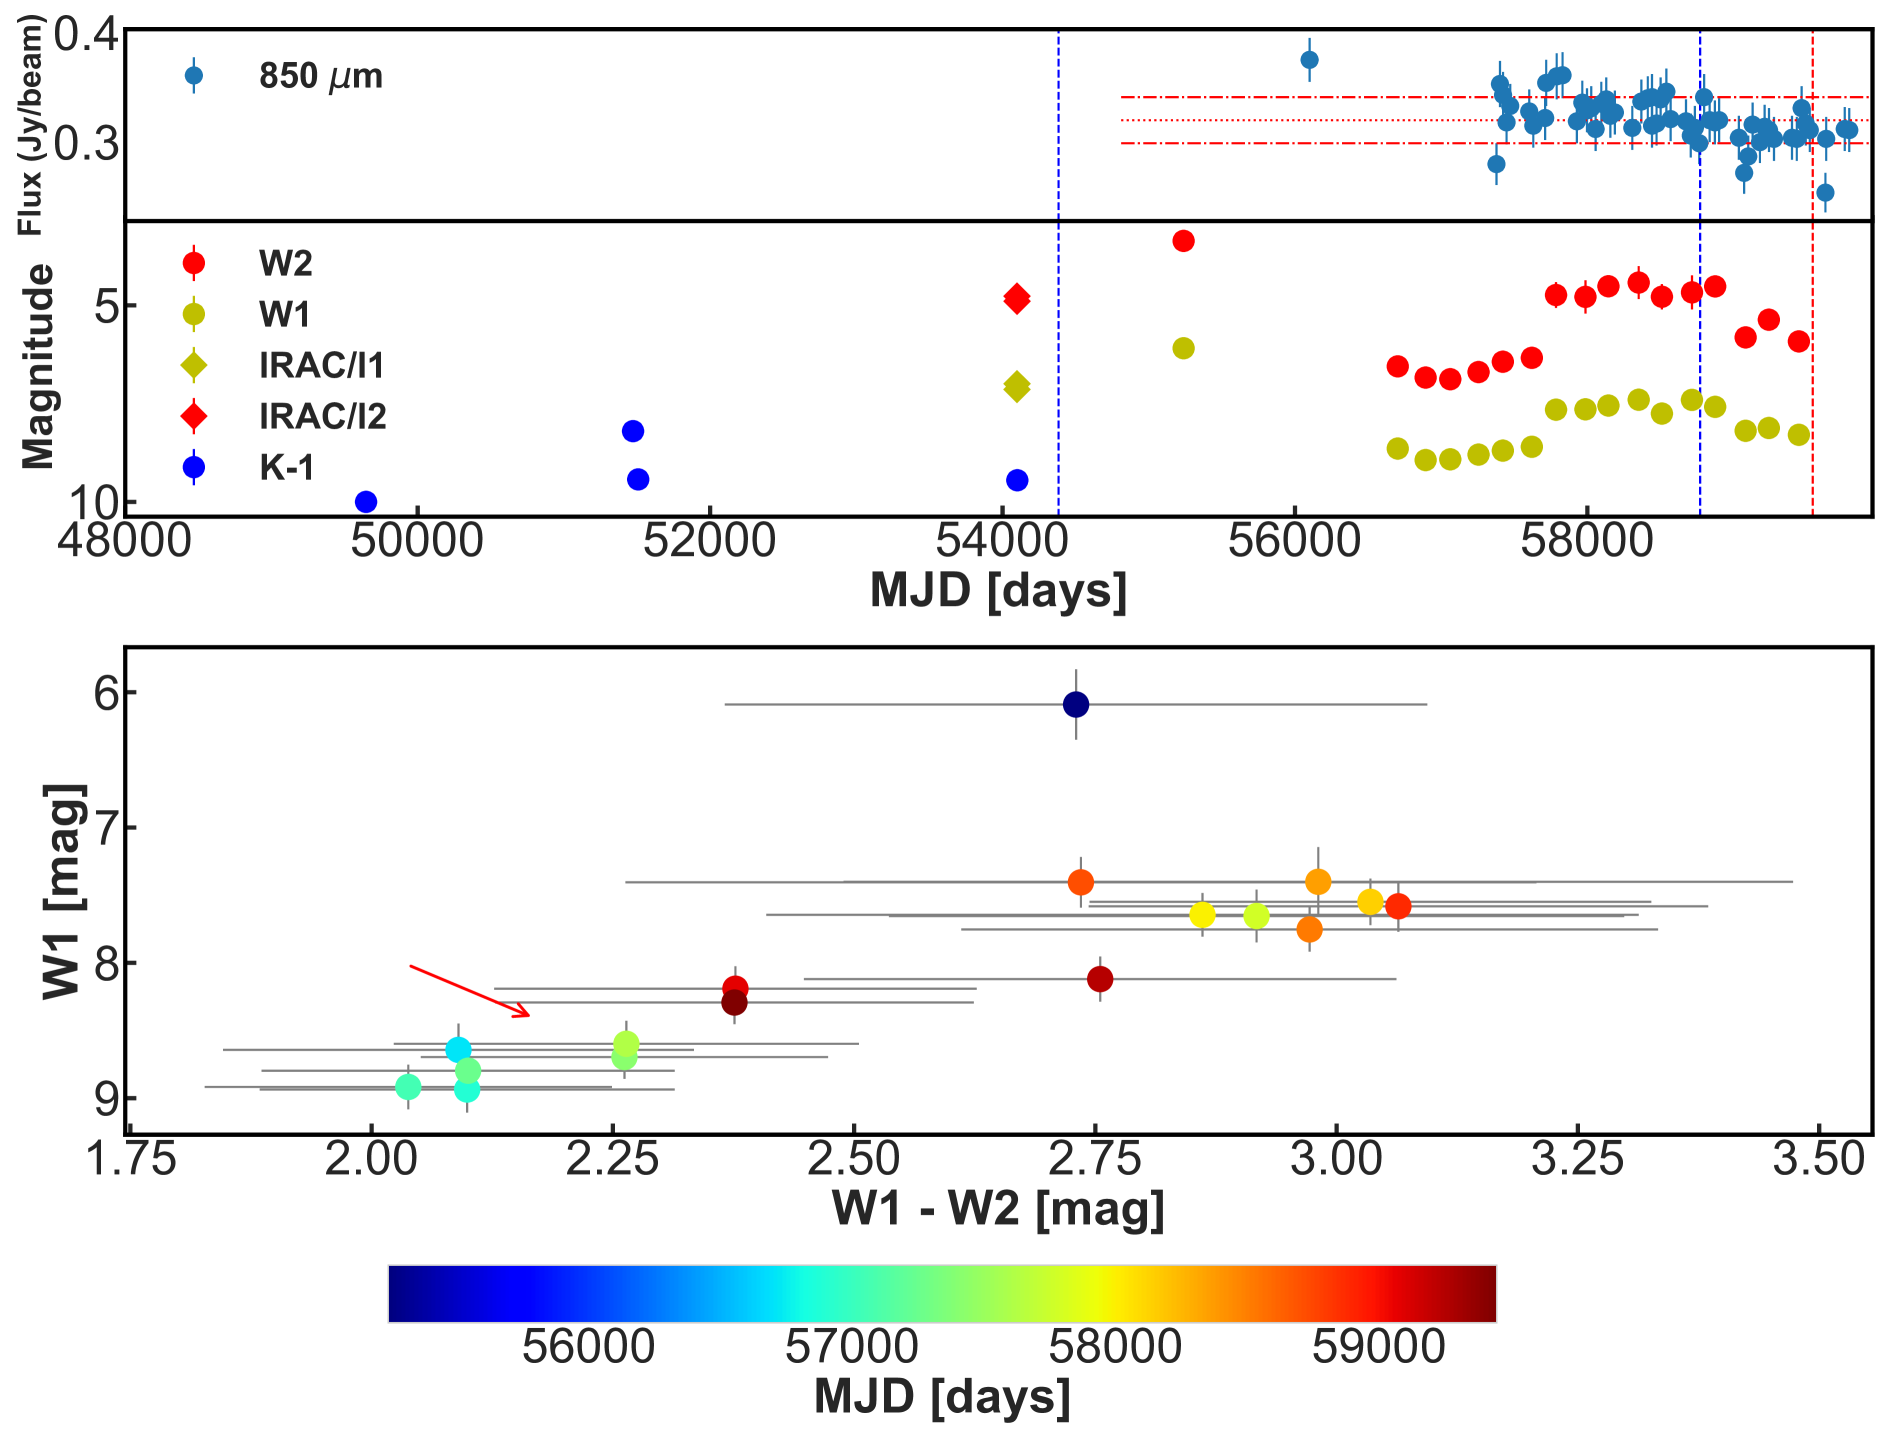
HOPS 315: The YSO (also commonly known as HH26 IRS, see e.g. Davis et al., 1997) is located in the L1630 molecular cloud at a distance of 427 pc (Tobin et al., 2020). The SED of the source has a spectral index, , consistent with a Class I classification. HOPS 315 is also the exciting source of the large scale molecular outflow HH26A/C/D (Davis et al., 1997; Antoniucci et al., 2008).
The mid-IR light curve shows a change in amplitude between the analysis by P21 and our work, going from 0.42 to 1.21 mag in W2. In both cases the light curve does not pass the criteria established by P21 to classify the YSO into any of the variability classes. However, this object is included as the mid-IR brightness increase from the latest 2 epochs of NEOWISE is also observed by the JCMT transient survey (Lee et al., 2021) at 850 m (Fig. 6). The correlated variability between mid-IR and sub-mm wavelengths is likely related to changes in the accretion rate, with the sub-mm flux variability arising as the envelope temperature increases as a response to the rise in the accretion luminosity (see e.g. Contreras Peña et al., 2020). The most recent observations of HOPS 315 at sub-mm wavelengths also shows it rising more steeply (Mairs et al. in preparation). We may be catching the initial stages of the recent outburst.
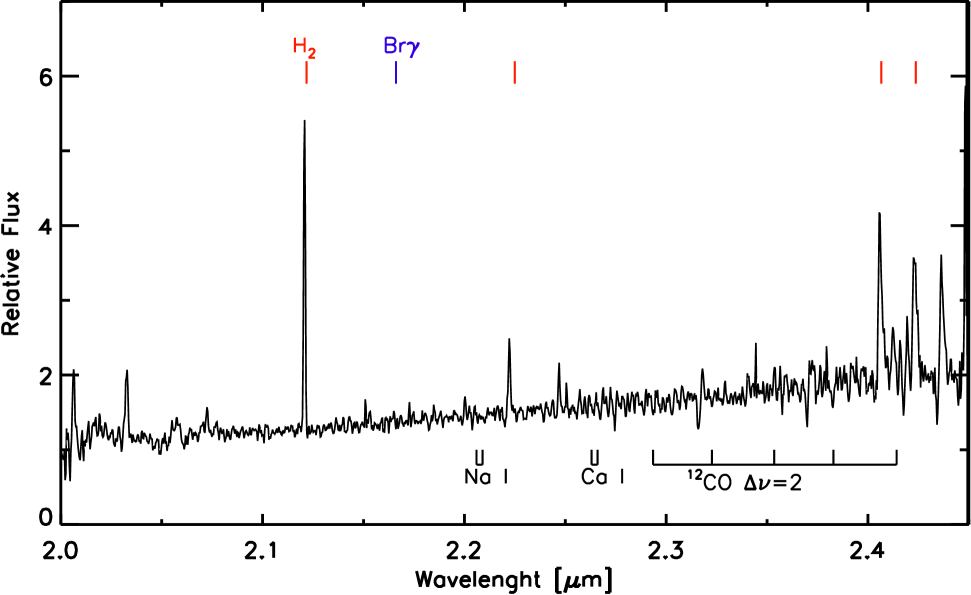
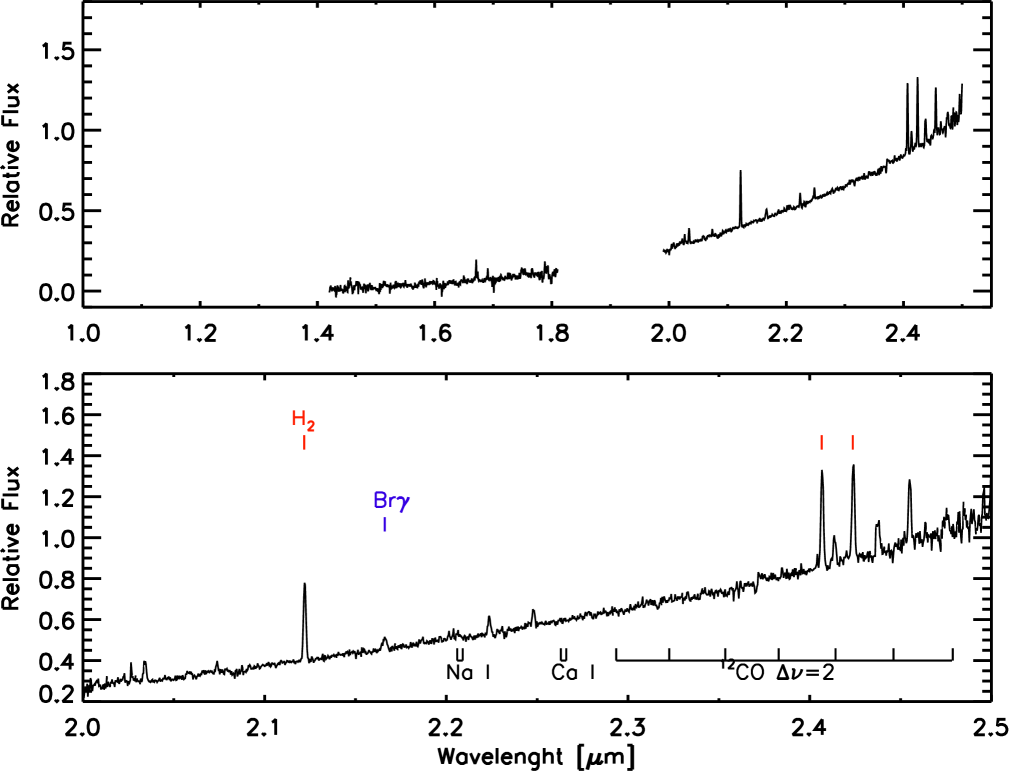
Previous observations of HOPS 315 show a spectrum dominated by emission lines of H2, Br and 12CO bandhead (Simon et al., 2004; Antoniucci et al., 2008; Davis et al., 2011). The IRTF spectrum observed in this work (Fig. 6) shows the same characteristics.
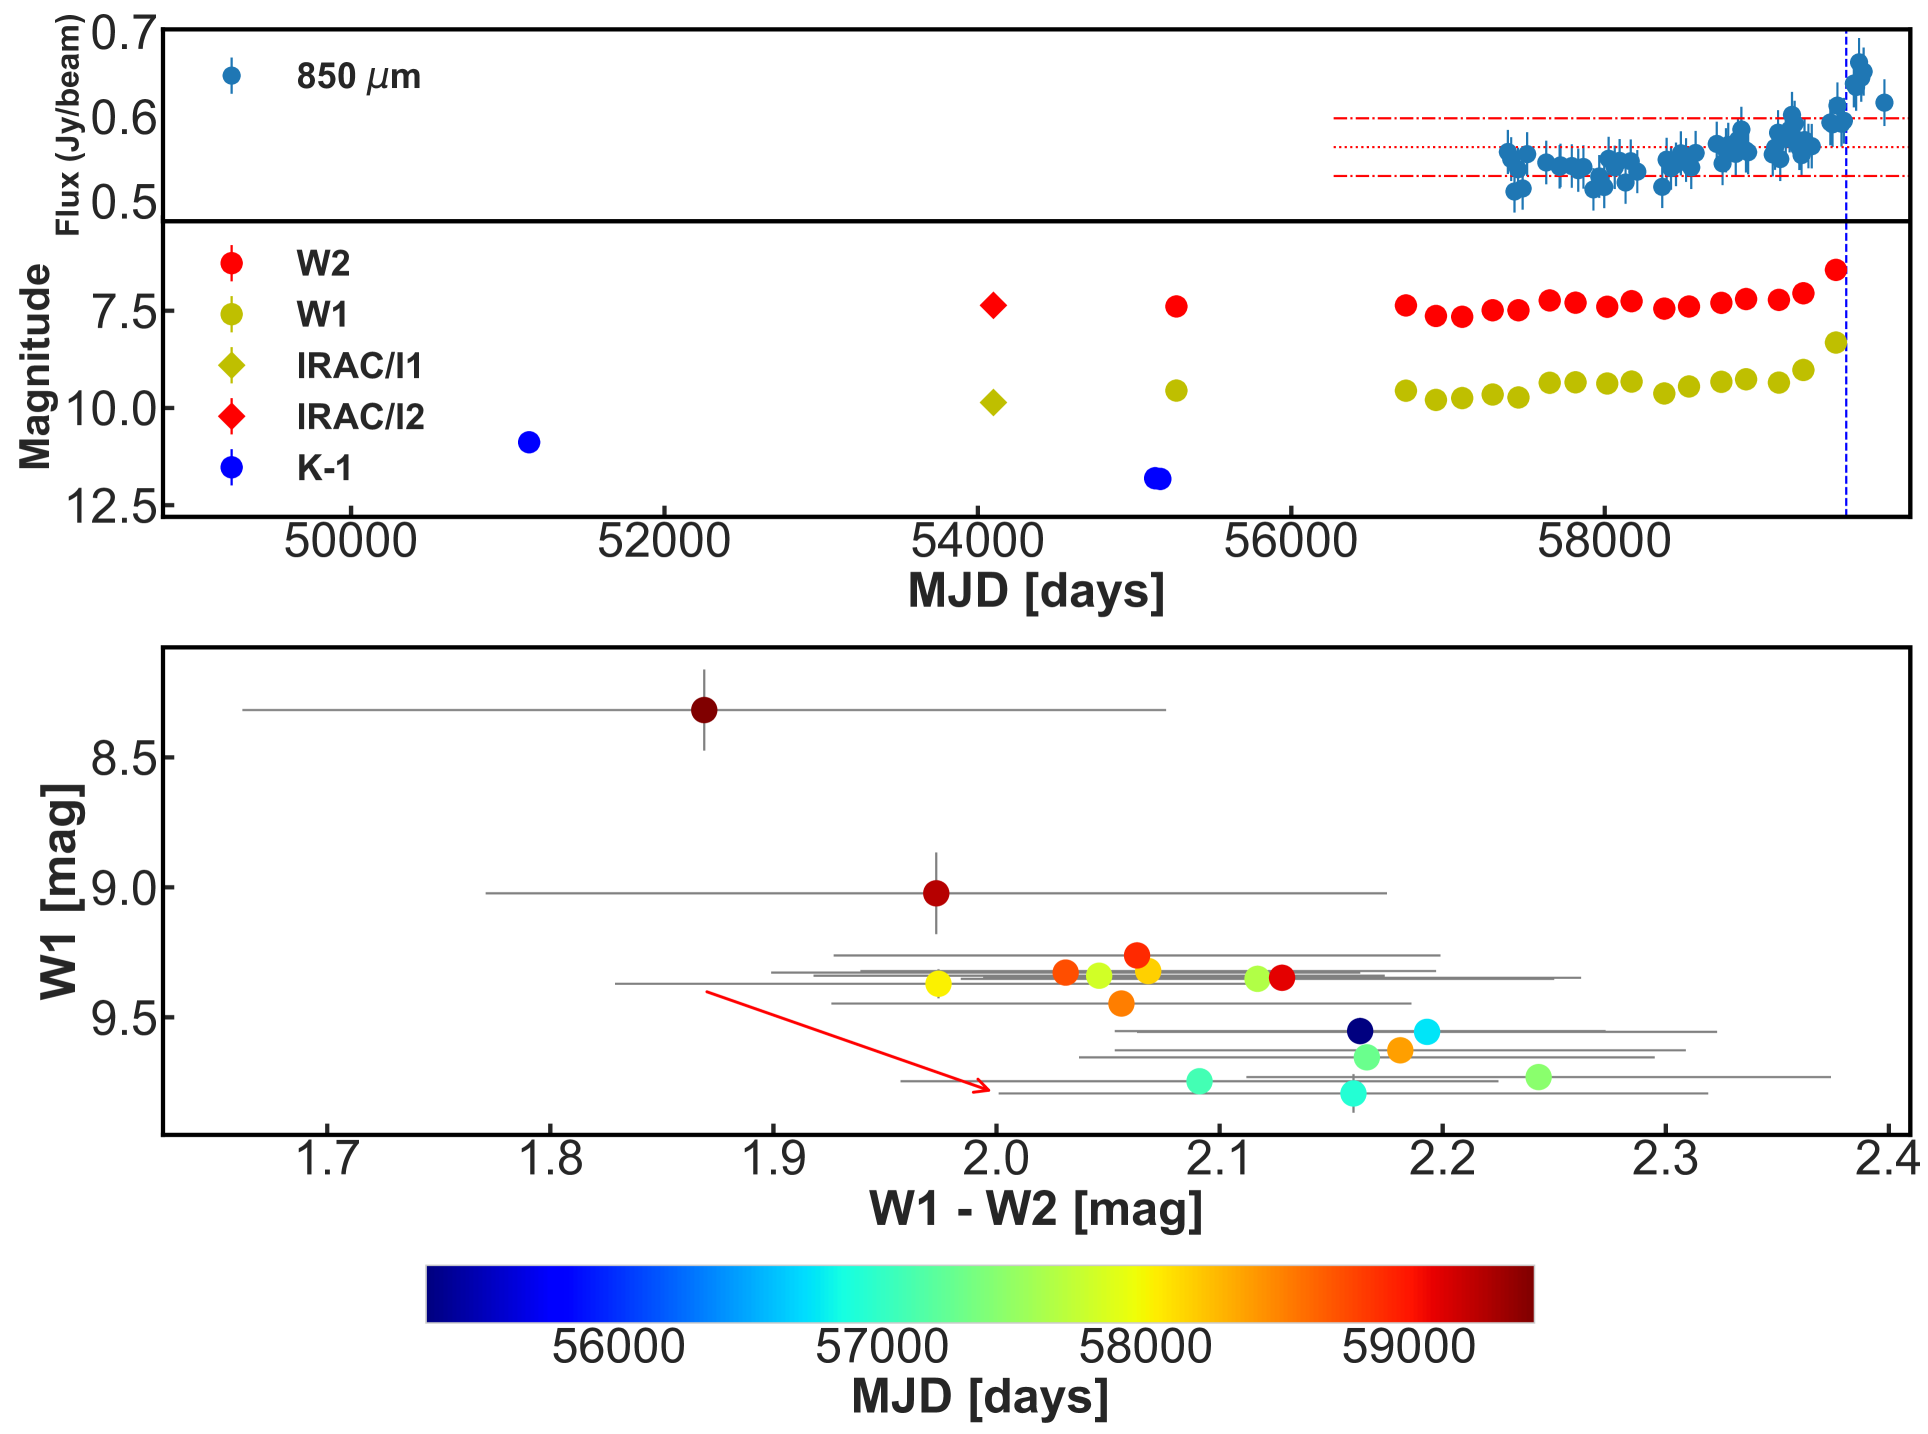
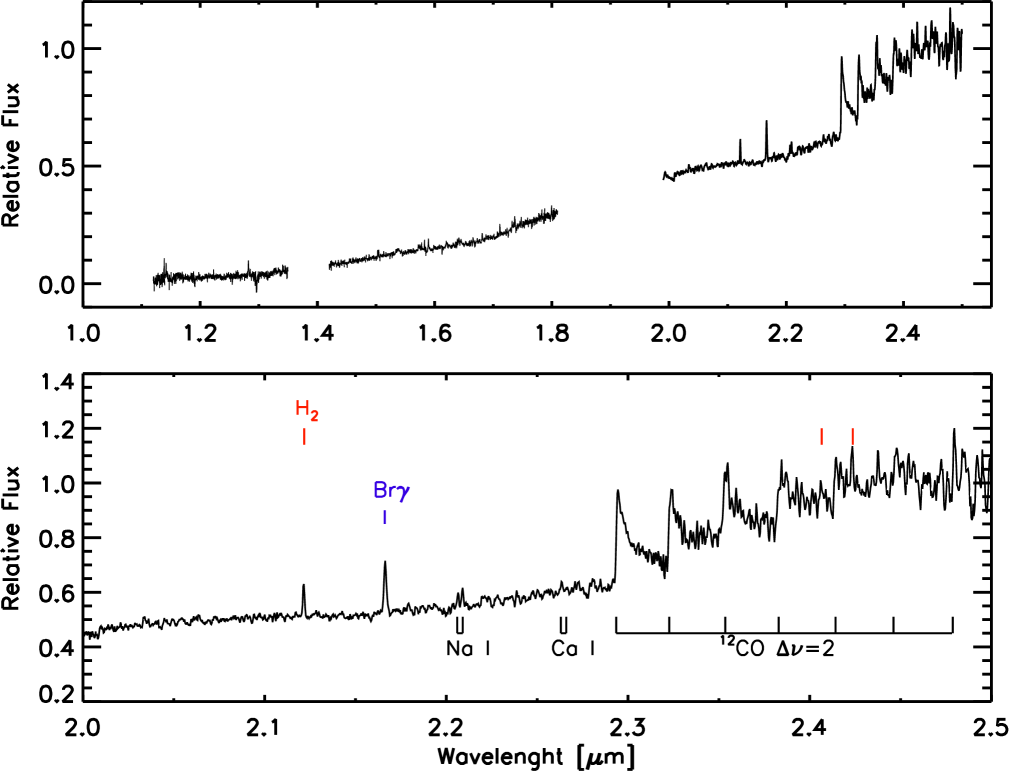
[LAL96] 213: This source was originally classified as a YSO by Lada et al. (1996) in their study of the NGC1333 region. Located at a distance of 300 pc (Zucker et al., 2018), the YSO shows a rising SED and has been categorised as a Class I YSO by several authors (see e.g. Evans et al., 2009; Gutermuth et al., 2009; Connelley & Greene, 2010; Dunham et al., 2015).
This YSO has the second largest variability amplitude within our sample with mag and also shows correlated variability with the sub-mm observations of the Gould Belt Survey (Mairs et al., 2017b; Ward-Thompson et al., 2007) and the JCMT transient survey (see Fig. 6). This correlated variability between the mid-IR and sub-mm has already been noticed by the work of Contreras Peña et al. (2020), and it is very likely due to variable accretion in the system.
Previous near-IR spectra of the source has been collected in 2006 and 2019 by Connelley & Greene (2010) and Fiorellino et al. (2021) respectively. The former observations detect H2, Na I, Br and weak 12CO emission, whilst in the KMOS spectrum from Fiorellino et al. (2021) Br and H2 emission are present, but there are no obvious features at the wavelengths of Na I or 12CO. Fig. 6 shows that those observations appear to have taken place at different brightness levels. Our observation, taken close to the lowest point in the light curve, shows similarities to the spectrum of Fiorellino et al. (2021), with no obvious features of Na I or 12CO. The changes between the Connelley & Greene (2010) spectrum and those of Fiorellino et al. (2021) and our work are likely due to the large magnitude changes between the epochs of observations. The W1 vs W1W2 CMD shows the variability strongly departs from the expected changes due to variable extinction along the line of sight.
GM Cha: This source is a Class I YSO located in the Chamaleon I dark cloud (distance of 191 pc, Long et al., 2017; Galli et al., 2021). It has been previously classified as an eruptive variable by Persi et al. (2007). The classification arises due to an observed =2 mag brightening over a period of 3 years. Persi et al. (2007) find similarities to known FUor/EX Lup outbursts. However, the accretion rate at maximum brightness measured by Persi et al. (2007) is M⊙ yr-1, a value that places this YSO into the EX Lup class according to the authors.
The mid-IR light curve of the YSO (Fig. 4) is classified as Curved as it is well fitted by a sinusoidal function, albeit with a long period of days. On top of this long-term behaviour the YSO displayed a 2.8 mag outburst that lasted for about 1 year. The figure also shows the near-IR K-band photometry of the source, which includes the data published by Persi et al. (2007). The changes observed by Persi et al. (2007) at these wavelengths do not seem related to a high-amplitude, short-term burst, but rather seem to follow the long-term Curved trend.
The mid-IR variability of GM Cha, both the long-term trend and the short-term outburst, are likely being driven by changes in the accretion rate, as the variation does not follow the reddening line in Fig. 4. The 1 year outburst probably lead to much higher values of the accretion rate than those found by Persi et al. (2007).
The K-band spectrum of the source (Fig. 4) is dominated by emission from ro-vibrational transitions of H2, probably related to the YSO outflow. A spectrum of GM Cha presented in Gómez & Mardones (2003) shows similar features as the spectrum presented in this work. From Fig. 4 the observations of Gómez & Mardones (2003) appear to have been taken at a similar brightness level as our observations. Given this, the similarity of the characteristics between the two spectra is not surprising.
Unfortunately our spectroscopic observations were taken after the 2.8 mag outburst has subsided. Therefore we are unable to observe the expected characteristics of outbursting YSOs at high accretion levels (e.g. 12CO in emission or absorption). This points to the difficulties in classifying eruptive variable YSOs when these are not observed at maximum brightness (see Section 6).
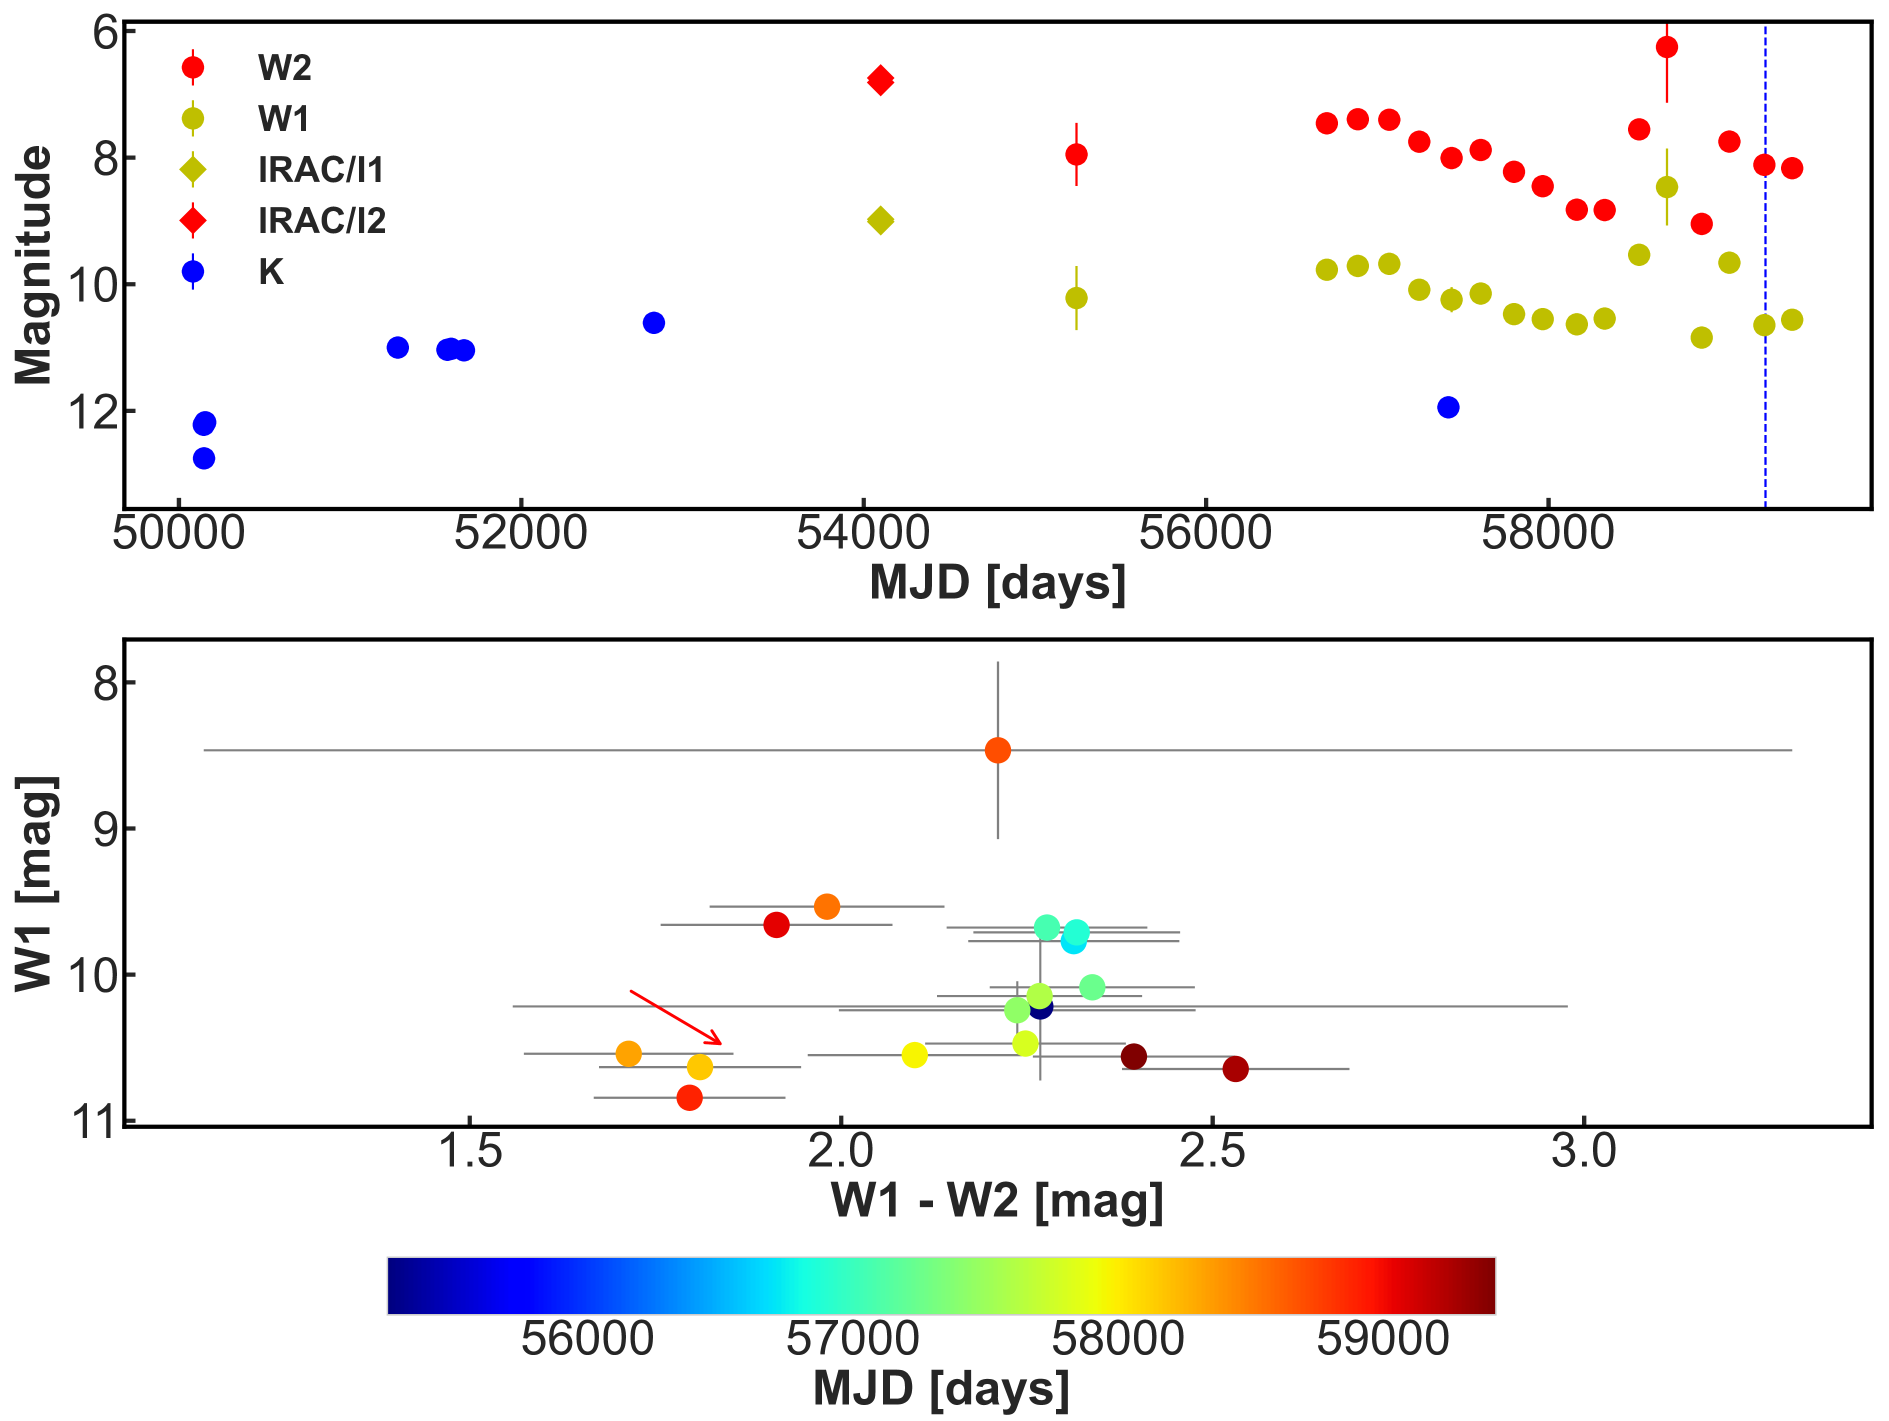
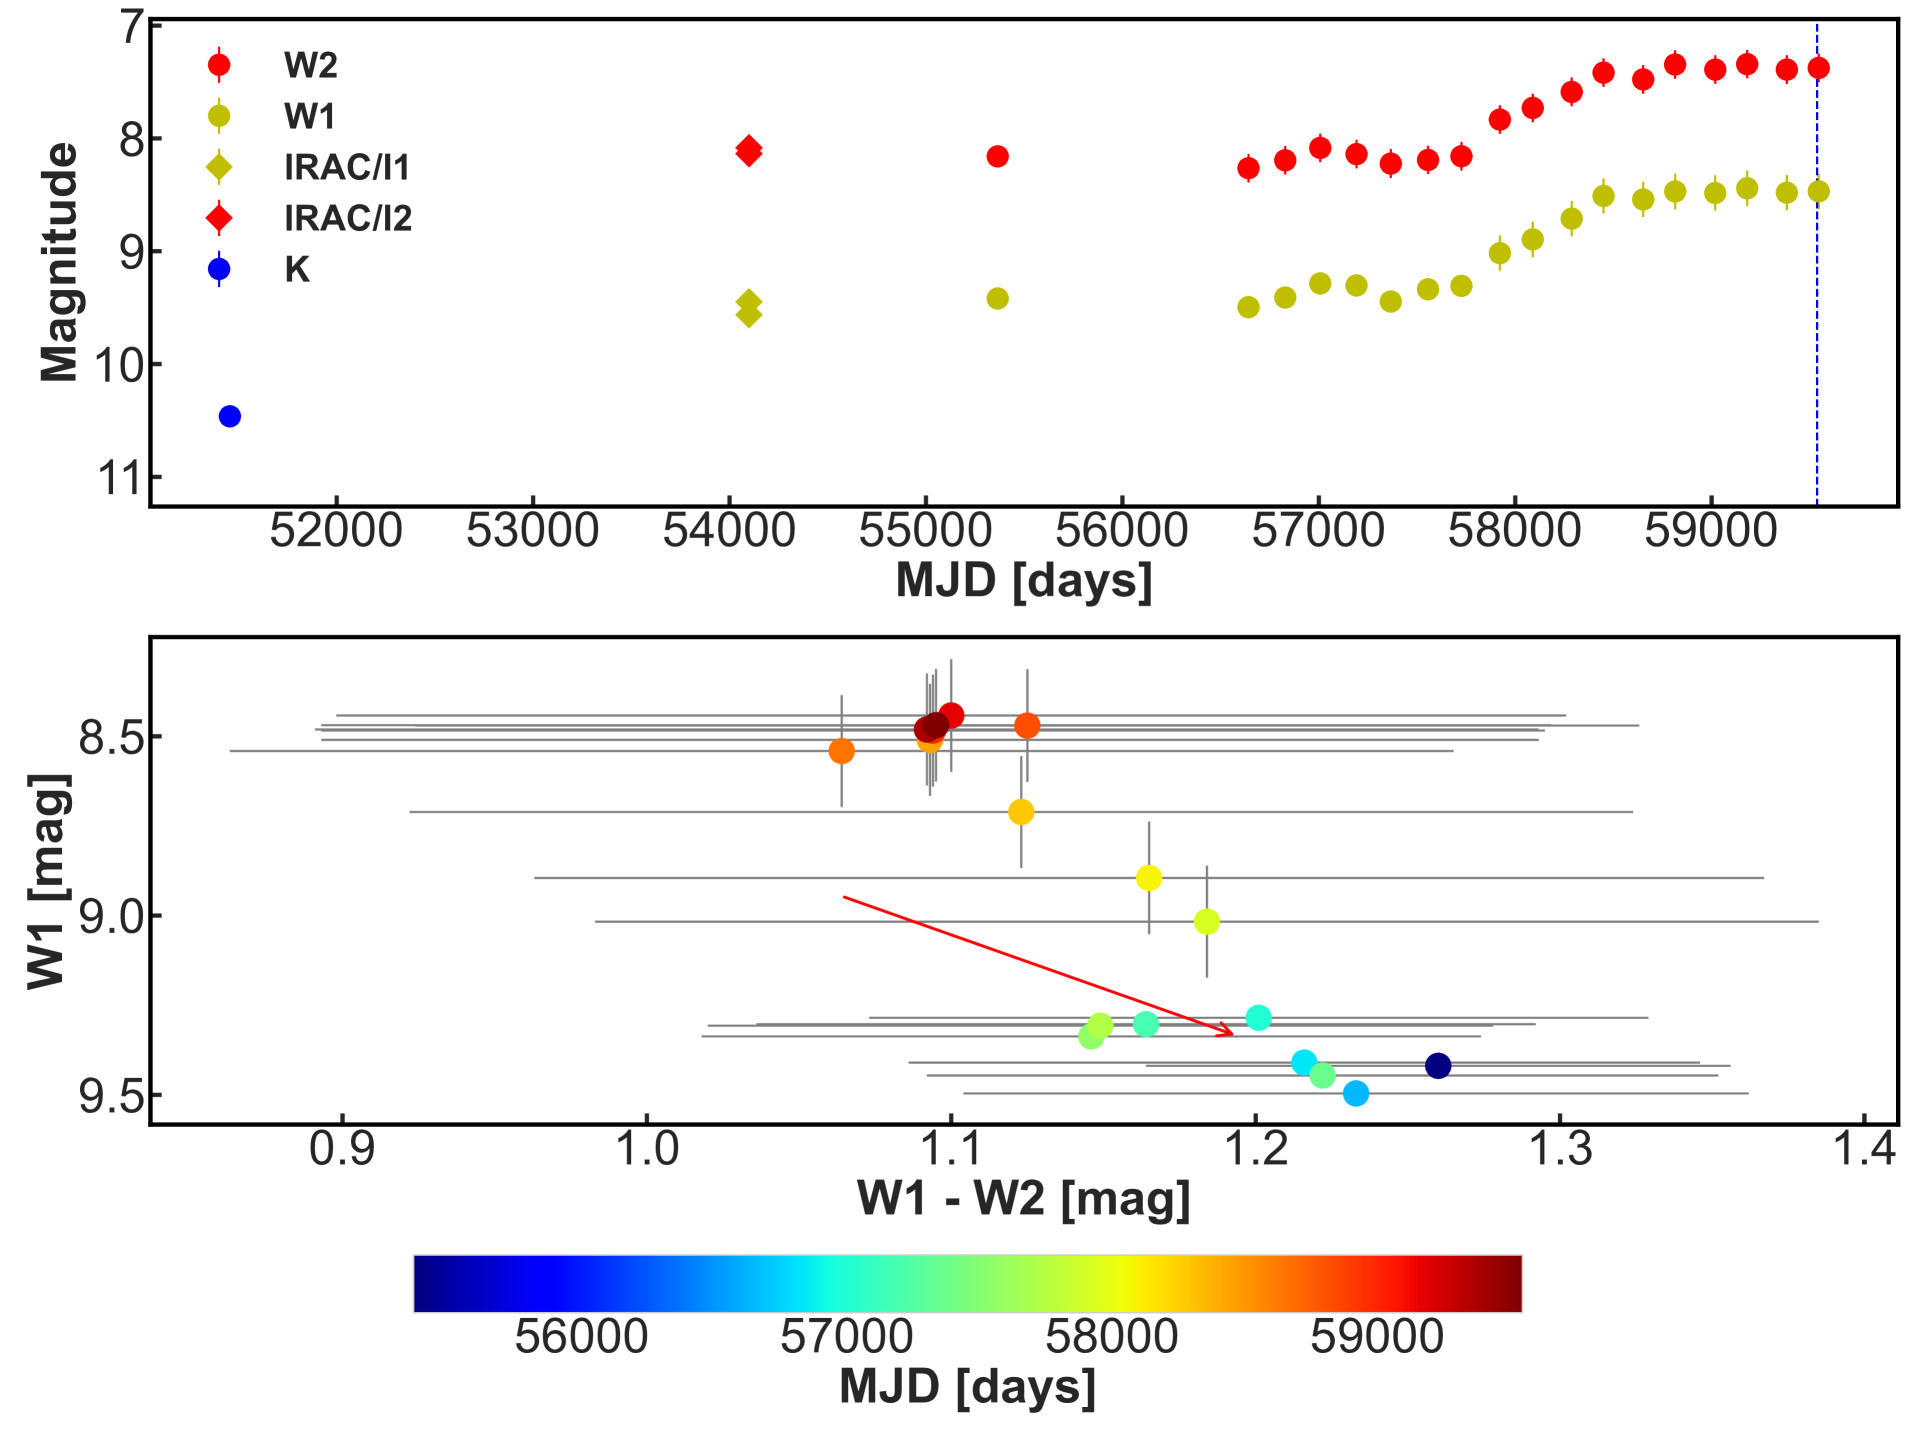
V565 Mon: This YSO is the illuminating source of the Parsamian 17 nebula, located in the dark cloud LDN 1653 at a distance of 1120 pc (Andreasyan, 2021). The system is considered to be the driver of the Herbig-Haro outflow HH 947 A/B (Magakian et al., 2008). The SED of the YSO is consistent with that of a source with (see Andreasyan, 2021). Based on its WISE colours, Fischer et al. (2016) classifies this source as a Class II YSO.
V565 Mon has been the subject of previous optical spectroscopic observations, where Andreasyan (2021) finds a late F to early G-type spectrum with strong double-peaked H emission that is divided by a narrow absorption component. In addition the YSO shows Na I Doublet and Ba II absorption. Li I (6707 Å) absorption, indicating the youth of the system, is also observed. Given the characteristics of the optical spectrum along with the high luminosity of the source, Andreasyan (2021) suggests a possible FUor classification. However, the lack of an H P Cygni profile in the system and the presence of wide photometric absorption features, argue against the FUor classification, according to Andreasyan (2021).
The mid-IR light curve of the source (Fig. 7) is classified as non-variable and there is no obvious trend in the data. , and data obtained from the ASAS-SN catalogue of variable stars (Jayasinghe et al., 2018) and the Bochum Galactic Disk Survey (Hackstein et al., 2015), show non-periodic irregular variability with an amplitude of 0.9 mag. Inspection of digitised photographic plate images from 1953 observations, acquired from the SuperCosmos Sky Survey (SSS Hambly et al., 2001), show V565 Mon at a similar brightness as recent observations from i.e. Pan-STARRS. If the object is truly an FUor, then the beginning of the outburst must have occurred before 1953.
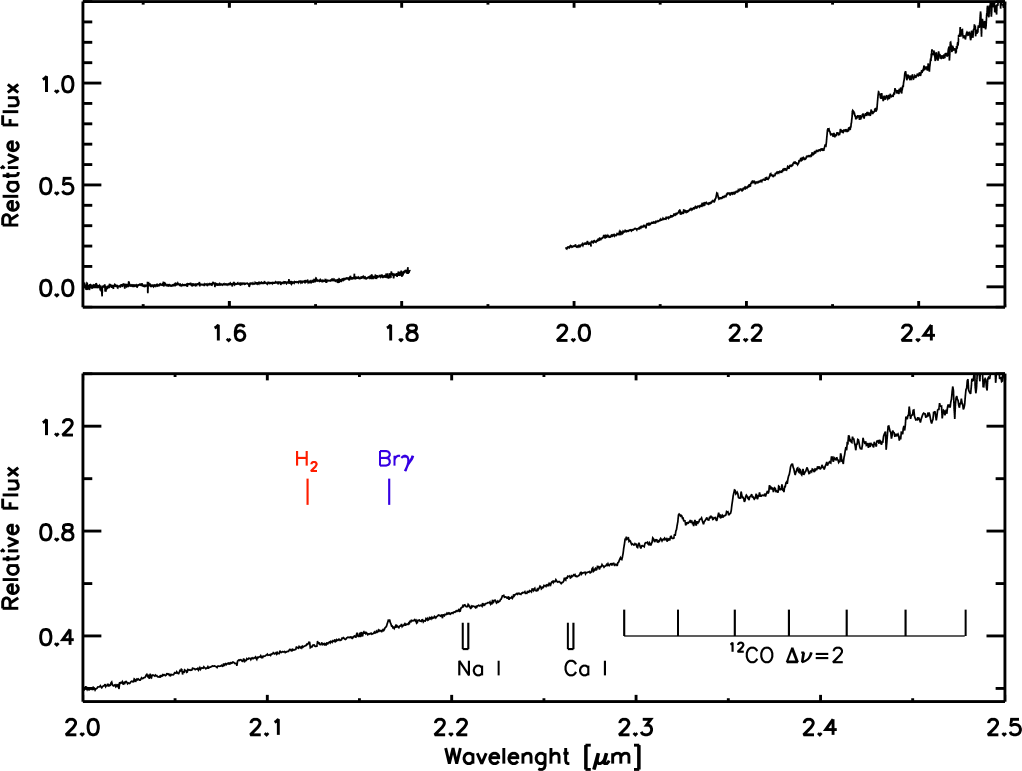
The TripleSpec JHK spectrum obtained in our programme (Fig. 7) shows H2O absorption, an H-band triangular shape continuum, and 12CO absorption beyond 2.29m. [Fe II] forbidden emission at 1.64 m is clearly detected in the system. There is also weak Br emission, which appears double-peaked, but cannot be confirmed at this resolution.
5 Nearby eruptive YSOs
In the continuum light curve analysis of shorter wavelength data (optical, near-IR), one of the main problems when classifying high-amplitude variable YSOs into the eruptive variable class, is that large amplitudes are also expected from other physical mechanisms (see e.g Contreras Peña et al., 2017a; Cody & Hillenbrand, 2018; Hillenbrand et al., 2022b). In the mid-IR, the majority of YSOs vary with amplitudes that are lower than 1 magnitude (Morales-Calderón et al., 2011; Park et al., 2021). Larger changes are consistent with variable accretion (Scholz et al., 2013). However, our interpretation of mid-IR colours and amplitudes can be complicated by the effects of molecular emission in W2 (Yoon et al., 2022). In addition, there are rare types of variable stars that could show similarly high amplitudes and perhaps mimic the light curves of eruptive variable YSOs. In the following we discuss some of these variability mechanisms to determine if they could explain the temporal nature of the sources in our sample.
5.1 Mechanisms driving mid-IR variability in YSOs
Occultations of a binary system by a circumbinary ring lead to periodic, with P d, high-amplitude, reaching up to mag, achromatic variability (García Soto et al., 2020; Zhu et al., 2022). The most famous member of this class is V582 Mon (KH15D, Aronow et al., 2018). As the brightness changes are not wavelength dependent, mid-IR variability can also reach these high-amplitudes. However, this type of variability is extremely rare (Zhu et al., 2022) and the short periods, as compared with the cadence of WISE observations, make it unlikely that this form of variability would be mistaken for an outbursting YSO.
Obscuration by structural inhomogeneities in the circumstellar disk also lead to variability in YSOs. The timescale of the variability depends on the location of the structure in the disk, whilst its amplitude is effectively limitless and wavelength dependent (Carpenter et al., 2001; Hillenbrand et al., 2013; Contreras Peña et al., 2017a; Guo et al., 2018). Due to this physical mechanism the colour-magnitude variability of the YSO should move along the reddening line, with objects becoming redder as they become fainter.
For example, a warped inner disk and clumps of dust and gas at the inner edge of the circumstellar disk, are responsible for the extinction variability in dippers (also known as AA Tau-like systems) and UX ori-type stars, respectively. The timescale for the variability is on the order of days to weeks and with amplitudes that are no larger than 3 magnitudes in the optical (Dullemond et al., 2003; Stauffer et al., 2015). The group of dippers in the Orion Nebula Cluster (Morales-Calderón et al., 2011) show maximum amplitudes of 0.6 magnitudes at 3 m. Long-term fading events, which could be associated with occultation by inhomogeneities located at larger distances in the disk, have been observed in e.g. AA Tau222Covey et al. (2021) interpret the changes as an increase in the scale height of the inner disk. and RW Aur (Bouvier et al., 2013; Bozhinova et al., 2016). The difference in visual extinction in these events, however, is not large enough to explain the high-amplitudes observed in our sample.
Changes in the scale height of the inner disk can obscure the central object leading to optical fading, but at the same time increase the brightness of the system at mid-IR wavelengths (Flaherty et al., 2012; Covey et al., 2021). However, this type of variability in the mid-IR has only been observed in a handful of YSOs (Bryan et al., 2019) with amplitudes that do not surpass 1 magnitude at 3 m (e.g. Covey et al., 2021). We note that radiative transfer models of changes in the scale height predict amplitudes that could reach 1.5 mag, but this only for extreme increases in scale height and for large inclinations of the disk (Bryan et al., 2019). It is therefore unlikely that we are observing such changes in our sample, where mag for all but three sources.
Nevertheless, in the analysis of the sources in Section 4, we see that the colour-magnitude variability in 5 out of 9 objects follows the interstellar reddening line (see Table 3). Of these, V565 Mon has strong reasons to be classified as an eruptive YSO (discussed later in this section), and as such is not included in the following discussion. Assuming that variable extinction is driving the variability, and using the amplitudes of Table 1, we have estimated the expected maximum difference in extinction, AV. Following a standard extinction law (e.g., Wang & Chen, 2019), the maximum values of changes in AV would range between 35 and 192 mag, with a mean value of A mag.
The extremely high values of extinction variability determined above are rare, but have been observed for V2492 Cyg. This is an eruptive variable Class I YSO that shows a complex light curve behaviour. It went into outburst somewhere between Spitzer and WISE observations, and has shown quasi-periodic variations with a timescale of 221 days since 2010 (Hillenbrand et al., 2013). The near-IR colour changes of the quasi-periodic variations are in agreement with a change in the extinction along the line of sight with a maximum value of A mag. If a dusty structure is responsible for the periodic variability, and assuming that is in a rotating disk around a M⊙ star, then this structure would be located at au from the central star (Hillenbrand et al., 2013). The maximum value of AV estimated for the quasi-periodic variation of V2492 Cyg is similar to the lower-end of AV values derived for our sample.
To determine if this type of extinction-related variability could be contaminating our sample of eruptive YSOs, we studied the mid-IR variability of V2492 Cyg over the 2010 to 2021 period (shown in Fig. 3) following the same analysis done for the YSOs in our sample. The statistical analysis shows a mid-IR light curve with W1=1.1 and W2=1.2 mag. Despite the high amplitude, V2492 Cyg does not fulfill the criteria from P21 to be classified as a variable object. This is likely due to the high uncertainties in the magnitudes of the source as it lies in the saturated region of WISE. However, the mid-IR amplitudes do agree with the expectations from variable extinction.
It is unlikely that an object displaying similar quasi-periodic, extinction-related variations (as displayed by V2492 Cyg after its outburst) would have been selected as a candidate eruptive variable star. The WISE/NEOWISE light curve of V2492 Cyg itself is not classified into any of the variable classes following P21 and even inspection of the WISE/NEOWISE light curve would have not lead to a candidate eruptive YSO classification.
Variable extinction, changes in the structure of the inner disk or obscuration by a circumbinary ring could drive some of the variability in the overall sample of YSOs from P21. We cannot completely discard that these processes may play a role in the mid-IR variability of the YSOs presented in this work (especially variable extinction), however, given the arguments presented above it seems unlikely that these mechanisms are the main drivers of the brightness changes in the YSO sample presented in this paper.
5.2 Variable accretion
The amplitudes of the variability for 7 out of 9 YSOs presented in this work agree with the expected amplitudes for accretion related outburst in the mid-IR ( mag, see e.g. Scholz et al., 2013; Hillenbrand & Rodriguez, 2022; Liu et al., 2022), with two exceptions: V565 Mon and 2MASS J215334724720439.
2MASS J215334724720439 is perhaps the most difficult source to classify as an eruptive variable. The colour variability seems to follow the reddening line in Fig. 5. If so, the maximum value of extinction, A mag, estimated for the source is similar to that of V2492 Cyg discussed above, so an extinction clearing event for this YSO cannot be ruled out completely. The observed spectrum, however, shows CO in emission, consistent with a YSO accreting at high rates. In addition, the shape of the mid-IR light curve is similar to the initial stages of the outburst of Gaia 17bpi (Hillenbrand et al., 2018). In the latter, the mid-IR outburst started 1.5-2 years before the onset of the optical outburst. Such behaviour is expected in outbursts that start at greater distances in the disk and propagate inwards (see e.g. Figure 21 in Liu et al., 2022). Whether the mid-IR brightening of 2MASS J215334724720439 marks the initial stages of an outside-in outburst will only be revealed by continuous monitoring of the source. Given these arguments we classify the YSO as a candidate eruptive variable and propose further monitoring of the source over the next few years in order to confirm the eruptive status of the source.
V565 Mon does not show strong variability but has supporting evidence to be classified as a FUor. It is the illuminating source of a reflection nebula and it has a large bolometric luminosity. The near-IR spectrum of Fig. 7 is consistent with an M spectral type, whilst Andreasyan (2021) estimate a late F to early G type for the optical spectrum. The change of spectral type between optical and near-infrared wavelengths is one of the defining characteristics of FUor objects. There are, however, some peculiarities in its spectrum that defy the standard FUor classification. Andreasyan (2021) found that the lack of a P Cygni profile for the H line, and the widths of the photospheric absorption lines were inconsistent with FUor classification. The near-infrared spectrum of Fig. 7 shows absorption from low energy rotational transitions of the line but lacks features from higher vibrational levels. As there is no documented outburst, the source does not fulfill all of the criteria to be classified as a bona-fide FUor, and thus this source is classified as a FUor-like object.
| YSO ID (P21) | Other name | Light Curve | Colour | t (outburst) | Observations | Spectral class | Photometric Class | Final Class |
|---|---|---|---|---|---|---|---|---|
| D2369 | LDN 1455 IRS3 | Irregular | bluer when brighter | 4.5 yr | Bright Statea | FUor | V1647 Ori | V1647 Ori |
| M457 | HOPS 267 | Burst | redder when brighter | 1 yr | Rising | EX Lup | V1647 Ori | V1647 Ori |
| M713 | HOPS 154 | Irregular | bluer when brighter | 1 yr | Bright State | FUor | EX Lup | V1647 Ori |
| D1486 | 2MASS J210132806811204 | Linear | redder when brighter | 3.5 yr | Rising | FUor | V1647 Ori | V1647 Ori |
| D1826b | 2MASS J215334724720439 | Linear | bluer when brighter | 5 yr | Bright state | EX Lup | V1647 Ori? | Outburst Candidate |
| M3159 | HOPS 315 | non-variable | bluer when brighter | 1 yr | Rising | EX Lup | V1647 Ori | V1647 Ori |
| D2439 | [LAL96] 213 | Curved | redder when brighter | yr | quiescence | EX Lupb | V1647 Ori | V1647 Ori |
| D1607 | GM Cha | Curved | redder when brighter | 1.5 yr | quiescence | – | EX Lup | EX Lup |
| – | V565 Mon | non-variable | bluer when brighter | yr | Bright state | FUor | none | FUor-like |
| See description in Section 4 | ||||||||
| Amplitude and colour behaviour might not be consistent with an eruptive YSO classification (Sections 4 and 5.1). | ||||||||
The spectra of HOPS 154, LDN 1455 IRS3 and 2MASS J210132806811204 show spectroscopic characteristics of bona-fide FUors. In all cases the spectra were taken close to maximum light. However, the light curves of these sources show different characteristics. HOPS 154 and LDN 1455 IRS3 show irregular high-amplitude outbursts with duration of between 1 and 4.5 years, intermediate between EX Lup type and FUor outbursts. The outburst of 2MASS J210132806811204 is still ongoing and, even though its timescale is now longer than those of EX Lup type outbursts, it cannot be immediately placed on the FUor category, as longer monitoring is needed.
In the case of HOPS 267, the epochs obtained from the latest NEOWISE data release show a mag outburst. The spectrum of HOPS 267, obtained close to maximum in the light curve, shows strong emission lines from Br and CO. These are usual spectral characteristics of EX Lup type objects in outburst. The duration of the outburst is still unknown, but it looks longer than at least one year, which would likely place it into an intermediate category between EX Lup type and FUor outbursts. This source requires continued monitoring.
HOPS315, [LAL96] 213 and GM Cha, all show EX Lup type spectra, but with various photometric characteristics and/or previous studies that support variable accretion as the driving mechanism of variability.
A summary on the different spectroscopic and photometric characteristics of our sample is provided in Table 3. In the table we also show a classification based on light curves or spectra alone, as well as the final classification given by the combined characteristics. The sample of nearby YSOs shows a variety of classifications, with V1647 Ori type sources dominating the sample.
6 The parameter space of outbursting YSOs
Recent discoveries of eruptive variables are often challenging to classify, but the underlying physical mechanism remains the same, variable accretion (Fischer et al., 2022). It is possible that the timing of observations and physical parameters of outbursting YSOs, such as central mass, evolutionary stage and/or the instability leading to the outburst, result in the varied spectro-photometric characteristics of eruptive variable YSOs discussed in Section 2.2 and the sample of nearby YSOs presented in this work.
One of the primary difficulties in classifying eruptive YSOs is timing. In our sample, GM Cha shows an outburst with an amplitude and colour variation that strongly suggests variable accretion as the main driver. Unfortunately, by the time we were able to follow-up this source, the outburst had subsided and we did not detect any evidence of high accretion rates in the spectrum, making it difficult to place this object into any of the eruptive variable classes. Similar problems are found for WISEA J142238.82611553.7 (Lucas et al., 2020) or Gaia 19fct (Park et al., 2022).
Recently, Liu et al. (2022) explored the parameter space of FUor-like outbursts to understand the effect of the mass of the central star (for the range M⊙) and mass accretion rate (for the range M⊙ yr-1) on the observed spectral energy distributions and spectra of these outbursting YSOs. The models show that as the outburst reaches a determined value of , the viscously-heated accretion disk dominates the emission from the system. At this point, the typical spectroscopic characteristics of bona-fide FUors appear, i.e., a triangular shape of the H-band continuum and strong 12CO absorption at 2.3m. Importantly, the value of at which the viscously-heated disk dominates emission depends sensitively on . For example, the viscous disk dominates emission from a YSO for accretion rates with M⊙ yr-1. For a more massive YSO, with M⊙, the viscous disk dominates emission when M⊙ yr-1.
In the analysis by Liu et al. (2022), when an outburst reaches an accretion rate of M⊙ yr-1, we should observe a FUor spectrum, regardless of the mass of the central star. It is in this region where the so-called bona-fide FUors probably reside. At values of M⊙ yr-1, YSOs could be in a transition region between the point where the fluxes of the disk and the stellar photosphere are equal, and the point where the viscous disk sufficiently outshines the photosphere (see figure 14 in Liu et al., 2022). The near-IR spectroscopic characteristics of YSO outbursts (specifically 12CO) falling in this transition region have contributions of both the stellar photosphere and the viscous disk. Although not included by Liu et al. (2022), a larger stellar irradiation due to an increase in can lead to 12CO emission from the upper layers of the accretion disk (see e.g. Calvet et al., 1991). This would also influence the observed characteristics of the 12CO band.
The above shows that the mass of the central star and the value of the accretion rate play an important role in the observed spectroscopic characteristics and therefore the classification of eruptive YSOs. This may help us understand the characteristics of some of the V1647 Ori-like sources.
The effect of various sources contributing to the 2.3m flux could explain the somewhat weak 12CO absorption observed in LDN 1455 IRS3, although continuous monitoring will be necessary to confirm the change in the 12CO line with the brightness of the source. In addition, it is interesting to see that the YSOs in our sample with the higher luminosities (see Table 1) show spectra with the 12CO bandhead in emission. Perhaps these are more massive YSOs where accretion rates have not reached sufficiently high values for viscous accretion to dominate the system. However, this conclusion is affected by the fact that luminosities and spectra were measured at different points in the light curve.
The instability leading to the outburst also plays a role, especially in the shape of the light curve. Instabilities driven by a stellar/planetary companion lead to periodic light curves, which have been observed in several eruptive variable YSOs (Hodapp & Chini, 2015; Yoo et al., 2017; Dahm & Hillenbrand, 2020; Guo et al., 2022). This type of light curve has generally been classified as peculiar, as they do not fit the classical definition of FUor/EX Lup type outbursts. In our case, the light curves of HOPS 154 and LDN 1455 IRS3 both show high-amplitude quasi-periodic variability (classified as Irregular in our analysis). Perhaps the observed light curves might be due to an unseen companion in the YSOs.
The picture also gets complicated for YSOs that are still deeply embedded in their nascent envelopes. Radiative transfer modelling of the embedded YSO EC53 (Baek et al., 2020) shows that parameters such as envelope radius or cavity opening angle affect greatly the observed flux at mid-IR wavelengths. This implies that the amplitudes and light curve shapes of outbursting embedded YSOs could strongly depend on the geometry of their surrounding envelopes. These complicated geometries can affect our ability to analyse the outbursts at the youngest stages of evolution (Lucas et al., 2020; Yoon et al., 2022). Sub-mm observations of the light echo shape and delay due to the reprocessing of an accretion burst by the envelope, however, may provide additional useful information (Johnstone et al., 2013; Francis et al., 2022).
The majority of sources in our sample are classified as Class I YSOs and are too faint to be observed at optical wavelengths. It is likely that the youth of these systems is also affecting the observed characteristics of the sample.
7 Summary
We have analysed the mid-IR light curves and near-IR spectra of eight YSOs from the sample of P21 that are likely new additions to the eruptive variable class. An additional YSO, V565 Mon, that is selected from GaiaWISE analysis was also presented in this work.
We discuss physical mechanisms that drive mid-IR variability in YSOs, however, we find that the amplitudes of the mid-IR light curves in our sample are more consistent with variable accretion. Nevertheless, we cannot completely discard that changes in the extinction along the line of sight could play a role on the observed variability.
Based on the spectro-photometric characteristics of our sample, such as outburst duration, 12CO in emission/absorption and/or triangular H-band continuum, we attempt to classify the sources into the more commonly known sub-classes of eruptive variables, i.e. EX Lupi-type or FUors. None of the YSOs in our sample can be classified as a bona-fide FUor, and only in one object falls into the EX Lup class. V565 Mon can only be classified as FUor-like due to the absence of an observed outburst.
In the majority of cases, the outbursts show a mixture of characteristics between those of EX Lupi-type and FUor outbursts. These type of objects, usually classified as V1647 Ori-type outbursts, are the most common class among the recent discoveries of eruptive variable YSOs.
We argue that the varied characteristics in our sample, and in general among eruptive variable YSOs, might be driven by the wide range in the parameters of YSO systems. The mass of the central star, the maximum accretion rate reached during the outburst, the evolutionary stage of the YSO and/or the instability leading to an outburst, can all play a significant role in the observed spectroscopic and photometric characteristics of outbursting YSOs.
We will continue to monitor the nine YSOs presented in this work, as well as the YSOs analysed in Park et al. (2021) using new data releases from mid-IR (NEOWISE) and optical (ZTF) surveys. Eruptive YSOs will be more thoroughly analysed in subsequent works, including modelling of the spectra taking into account the different parameters discussed above.
In addition the discovery of eruptive YSOs located within 1 kpc, provides ideal candidates for further follow-up using for example the Atacama Large Millimeter/submillimeter Array (ALMA). The sudden rise in luminosity due to an outburst quickly expands the water snow line to larger radii, allowing the observation of complex organic molecules (COMs) in the disk of these YSOs (e.g. Lee et al., 2019). The nearby outbursting YSOs will be proposed for ALMA observations to study COMs in the early stages of young stellar evolution.
Acknowledgements
This work was supported by the National Research Foundation of Korea (NRF) grant funded by the Korean government (MSIT) (grant number 2021R1A2C1011718). GJH, XY, and HL are supported by grant 12173003 from the National Natural Science Foundation of China. JJ and MA acknowledge the financial support received through the DST-SERB grant SPG/2021/003850. DJ is supported by NRC Canada and by an NSERC Discovery Grant.
This work was in part supported by K-GMT Science Program (GS-2021A-Q-110) of Korea Astronomy and Space Science Institute (KASI). Based on observations obtained at the international Gemini Observatory, a program of NSF’s NOIRLab, which is managed by the Association of Universities for Research in Astronomy (AURA) under a cooperative agreement with the National Science Foundation on behalf of the Gemini Observatory partnership: the National Science Foundation (United States), National Research Council (Canada), Agencia Nacional de Investigación y Desarrollo (Chile), Ministerio de Ciencia, Tecnología e Innovación (Argentina), Ministério da Ciência, Tecnologia, Inovações e Comunicações (Brazil), and Korea Astronomy and Space Science Institute (Republic of Korea).
This research has made use of the NASA/IPAC Infrared Science Archive, which is funded by the National Aeronautics and Space Administration and operated by the California Institute of Technology.
This research has made use of the VizieR catalogue access tool, CDS, Strasbourg, France (DOI : 10.26093/cds/vizier). The original description of the VizieR service was published in 2000, A&AS 143, 23.
Data Availability
The data underlying this article are available in the article and in its online supplementary material.
The spectra for various sources will be shared on reasonable request to the corresponding author.
References
- Andreasyan (2021) Andreasyan H., 2021, Research in Astronomy and Astrophysics, 21, 064
- Antoniucci et al. (2008) Antoniucci S., Nisini B., Giannini T., Lorenzetti D., 2008, A&A, 479, 503
- Antoniucci et al. (2014) Antoniucci S., Giannini T., Li Causi G., Lorenzetti D., 2014, ApJ, 782, 51
- Aronow et al. (2018) Aronow R. A., Herbst W., Hughes A. M., Wilner D. J., Winn J. N., 2018, AJ, 155, 47
- Artur de la Villarmois et al. (2019) Artur de la Villarmois E., Jørgensen J. K., Kristensen L. E., Bergin E. A., Harsono D., Sakai N., van Dishoeck E. F., Yamamoto S., 2019, A&A, 626, A71
- Audard et al. (2014) Audard M., et al., 2014, Protostars and Planets VI, pp 387–410
- Baek et al. (2020) Baek G., et al., 2020, ApJ, 895, 27
- Bailer-Jones et al. (2021) Bailer-Jones C. A. L., Rybizki J., Fouesneau M., Demleitner M., Andrae R., 2021, AJ, 161, 147
- Baraffe et al. (2017) Baraffe I., Elbakyan V. G., Vorobyov E. I., Chabrier G., 2017, A&A, 597, A19
- Becker et al. (2021) Becker J. C., Batygin K., Adams F. C., 2021, ApJ, 919, 76
- Bell & Lin (1994) Bell K. R., Lin D. N. C., 1994, ApJ, 427, 987
- Bell et al. (1995) Bell K. R., Lin D. N. C., Hartmann L. W., Kenyon S. J., 1995, ApJ, 444, 376
- Bellm et al. (2018) Bellm E. C., et al., 2018, Publications of the Astronomical Society of the Pacific, 131, 018002
- Benjamin et al. (2003) Benjamin R. A., et al., 2003, PASP, 115, 953
- Boss (2013) Boss A. P., 2013, ApJ, 764, 194
- Bouvier et al. (2013) Bouvier J., Grankin K., Ellerbroek L. E., Bouy H., Barrado D., 2013, A&A, 557, A77
- Bozhinova et al. (2016) Bozhinova I., et al., 2016, MNRAS, 463, 4459
- Bryan et al. (2019) Bryan G. R., Maddison S. T., Liffman K., 2019, MNRAS, 489, 3879
- Calvet et al. (1991) Calvet N., Patino A., Magris G. C., D’Alessio P., 1991, ApJ, 380, 617
- Carpenter et al. (2001) Carpenter J. M., Hillenbrand L. A., Skrutskie M. F., 2001, AJ, 121, 3160
- Chambers et al. (2016) Chambers K. C., et al., 2016, preprint, (arXiv:1612.05560)
- Cheng et al. (2020) Cheng Y., Andersen M., Tan J., 2020, ApJ, 897, 51
- Cieza et al. (2016) Cieza L. A., et al., 2016, Nature, 535, 258
- Cody & Hillenbrand (2018) Cody A. M., Hillenbrand L. A., 2018, AJ, 156, 71
- Cody et al. (2014) Cody A. M., et al., 2014, AJ, 147, 82
- Connelley & Greene (2010) Connelley M. S., Greene T. P., 2010, AJ, 140, 1214
- Connelley & Reipurth (2018) Connelley M. S., Reipurth B., 2018, ApJ, 861, 145
- Connelley & Reipurth (2020) Connelley M., Reipurth B., 2020, The Astronomer’s Telegram, 14035, 1
- Contreras Peña et al. (2017a) Contreras Peña C., et al., 2017a, MNRAS, 465, 3011
- Contreras Peña et al. (2017b) Contreras Peña C., et al., 2017b, MNRAS, 465, 3039
- Contreras Peña et al. (2019) Contreras Peña C., Naylor T., Morrell S., 2019, MNRAS, 486, 4590
- Contreras Peña et al. (2020) Contreras Peña C., Johnstone D., Baek G., Herczeg G. J., Mairs S., Scholz A., Lee J.-E., JCMT Transient Team 2020, MNRAS, 495, 3614
- Covey et al. (2021) Covey K. R., Larson K. A., Herczeg G. J., Manara C. F., 2021, AJ, 161, 61
- Cruz-Sáenz de Miera et al. (2022) Cruz-Sáenz de Miera F., et al., 2022, ApJ, 927, 125
- Cuello et al. (2019) Cuello N., et al., 2019, MNRAS, 483, 4114
- Cushing et al. (2004) Cushing M. C., Vacca W. D., Rayner J. T., 2004, PASP, 116, 362
- Dahm & Hillenbrand (2020) Dahm S. E., Hillenbrand L. A., 2020, AJ, 160, 278
- Davis et al. (1997) Davis C. J., Ray T. P., Eisloeffel J., Corcoran D., 1997, A&A, 324, 263
- Davis et al. (2011) Davis C. J., et al., 2011, A&A, 528, A3
- Dullemond et al. (2003) Dullemond C. P., van den Ancker M. E., Acke B., van Boekel R., 2003, ApJ, 594, L47
- Dunham et al. (2015) Dunham M. M., et al., 2015, ApJS, 220, 11
- Eikenberry et al. (2004) Eikenberry S. S., et al., 2004, in Moorwood A. F. M., Iye M., eds, Society of Photo-Optical Instrumentation Engineers (SPIE) Conference Series Vol. 5492, Ground-based Instrumentation for Astronomy. pp 1196–1207, doi:10.1117/12.549796
- Evans et al. (2009) Evans II N. J., et al., 2009, ApJS, 181, 321
- Fiorellino et al. (2021) Fiorellino E., et al., 2021, A&A, 650, A43
- Fischer et al. (2016) Fischer W. J., Padgett D. L., Stapelfeldt K. L., Sewiło M., 2016, ApJ, 827, 96
- Fischer et al. (2019) Fischer W. J., Safron E., Megeath S. T., 2019, ApJ, 872, 183
- Fischer et al. (2022) Fischer W. J., Hillenbrand L. A., Herczeg G. J., Johnstone D., Kóspál Á., Dunham M. M., 2022, arXiv e-prints, p. arXiv:2203.11257
- Flaherty et al. (2012) Flaherty K. M., Muzerolle J., Rieke G., Gutermuth R., Balog Z., Herbst W., Megeath S. T., Kun M., 2012, ApJ, 748, 71
- Francis et al. (2022) Francis L., et al., 2022, ApJ, 937, 29
- Furlan et al. (2016) Furlan E., et al., 2016, ApJS, 224, 5
- Galli et al. (2021) Galli P. A. B., et al., 2021, A&A, 646, A46
- García Soto et al. (2020) García Soto A., Ali A., Newmark A., Herbst W., Windemuth D., Winn J. N., 2020, AJ, 159, 135
- Ghosh et al. (2022) Ghosh A., et al., 2022, ApJ, 926, 68
- Gómez & Mardones (2003) Gómez M., Mardones D., 2003, AJ, 125, 2134
- Guo et al. (2018) Guo Z., et al., 2018, ApJ, 852, 56
- Guo et al. (2020) Guo Z., et al., 2020, MNRAS, 492, 294
- Guo et al. (2021) Guo Z., et al., 2021, MNRAS, 504, 830
- Guo et al. (2022) Guo Z., et al., 2022, MNRAS, 513, 1015
- Gutermuth et al. (2009) Gutermuth R. A., Megeath S. T., Myers P. C., Allen L. E., Pipher J. L., Fazio G. G., 2009, ApJS, 184, 18
- Hackstein et al. (2015) Hackstein M., et al., 2015, Astronomische Nachrichten, 336, 590
- Hambly et al. (2001) Hambly N. C., et al., 2001, MNRAS, 326, 1279
- Hartmann & Kenyon (1996) Hartmann L., Kenyon S. J., 1996, ARA&A, 34, 207
- Herbig (1977) Herbig G. H., 1977, ApJ, 217, 693
- Herbig (1989) Herbig G. H., 1989, in European Southern Observatory Conference and Workshop Proceedings. pp 233–246
- Herbig (2008) Herbig G. H., 2008, AJ, 135, 637
- Herbst et al. (1994) Herbst W., Herbst D. K., Grossman E. J., Weinstein D., 1994, AJ, 108, 1906
- Herczeg et al. (2017) Herczeg G. J., et al., 2017, ApJ, 849, 43
- Herter et al. (2008) Herter T. L., et al., 2008, in McLean I. S., Casali M. M., eds, Society of Photo-Optical Instrumentation Engineers (SPIE) Conference Series Vol. 7014, Ground-based and Airborne Instrumentation for Astronomy II. p. 70140X, doi:10.1117/12.789660
- Hillenbrand (2021) Hillenbrand L. A., 2021, The Astronomer’s Telegram, 14590, 1
- Hillenbrand & Rodriguez (2022) Hillenbrand L. A., Rodriguez A. C., 2022, Research Notes of the American Astronomical Society, 6, 6
- Hillenbrand et al. (2013) Hillenbrand L. A., et al., 2013, AJ, 145, 59
- Hillenbrand et al. (2018) Hillenbrand L. A., et al., 2018, The Astrophysical Journal, 869, 146
- Hillenbrand et al. (2021) Hillenbrand L. A., et al., 2021, AJ, 161, 220
- Hillenbrand et al. (2022a) Hillenbrand L. A., Isaacson H., Rodriguez A. C., Connelley M., Reipurth B., Kuhn M. A., Beck T., Perez D. R., 2022a, AJ, 163, 115
- Hillenbrand et al. (2022b) Hillenbrand L. A., Kiker T. J., Gee M., Lester O., Braunfeld N. L., Rebull L. M., Kuhn M. A., 2022b, AJ, 163, 263
- Hodapp & Chini (2015) Hodapp K. W., Chini R., 2015, ApJ, 813, 107
- Hodapp et al. (1996) Hodapp K.-W., Hora J. L., Rayner J. T., Pickles A. J., Ladd E. F., 1996, ApJ, 468, 861
- Hodapp et al. (2012) Hodapp K. W., Chini R., Watermann R., Lemke R., 2012, ApJ, 744, 56
- Hodapp et al. (2019) Hodapp K. W., et al., 2019, AJ, 158, 241
- Hodapp et al. (2020) Hodapp K. W., et al., 2020, AJ, 160, 164
- Hodgkin et al. (2021) Hodgkin S. T., et al., 2021, A&A, 652, A76
- Jayasinghe et al. (2018) Jayasinghe T., et al., 2018, MNRAS, 477, 3145
- Johnstone et al. (2013) Johnstone D., Hendricks B., Herczeg G. J., Bruderer S., 2013, ApJ, 765, 133
- Johnstone et al. (2022) Johnstone D., et al., 2022, ApJ, 937, 6
- Kadam et al. (2020) Kadam K., Vorobyov E., Regály Z., Kóspál Á., Ábrahám P., 2020, ApJ, 895, 41
- Kim et al. (2004) Kim B. G., Kawamura A., Yonekura Y., Fukui Y., 2004, PASJ, 56, 313
- Kóspál et al. (2007) Kóspál Á., Ábrahám P., Prusti T., Acosta-Pulido J., Hony S., Moór A., Siebenmorgen R., 2007, A&A, 470, 211
- Kryukova et al. (2012) Kryukova E., Megeath S. T., Gutermuth R. A., Pipher J., Allen T. S., Allen L. E., Myers P. C., Muzerolle J., 2012, AJ, 144, 31
- Kun et al. (2019) Kun M., Ábrahám P., Acosta Pulido J. A., Moór A., Prusti T., 2019, MNRAS, 483, 4424
- Kunitomo et al. (2017) Kunitomo M., Guillot T., Takeuchi T., Ida S., 2017, A&A, 599, A49
- Lada et al. (1996) Lada C. J., Alves J., Lada E. A., 1996, AJ, 111, 1964
- Lee et al. (2019) Lee J.-E., et al., 2019, Nature Astronomy, 3, 314
- Lee et al. (2020) Lee Y.-H., et al., 2020, ApJ, 903, 5
- Lee et al. (2021) Lee Y.-H., et al., 2021, ApJ, 920, 119
- Liu et al. (2022) Liu H., et al., 2022, ApJ, 936, 152
- Lodato & Clarke (2004) Lodato G., Clarke C. J., 2004, MNRAS, 353, 841
- Lomb (1976) Lomb N. R., 1976, Ap&SS, 39, 447
- Long et al. (2017) Long F., et al., 2017, ApJ, 844, 99
- Lorenzetti et al. (2009) Lorenzetti D., Larionov V. M., Giannini T., Arkharov A. A., Antoniucci S., Nisini B., Di Paola A., 2009, ApJ, 693, 1056
- Lorenzetti et al. (2012) Lorenzetti D., et al., 2012, ApJ, 749, 188
- Lucas et al. (2008) Lucas P. W., et al., 2008, MNRAS, 391, 136
- Lucas et al. (2020) Lucas P. W., et al., 2020, MNRAS, 499, 1805
- Maddalena et al. (1986) Maddalena R. J., Morris M., Moskowitz J., Thaddeus P., 1986, ApJ, 303, 375
- Magakian et al. (2008) Magakian T. Y., Movsessian T. A., Nikogossian E. G., 2008, Astrophysics, 51, 7
- Mainzer et al. (2011) Mainzer A., et al., 2011, ApJ, 743, 156
- Mainzer et al. (2014) Mainzer A., et al., 2014, ApJ, 792, 30
- Mairs et al. (2017a) Mairs S., et al., 2017a, The Astrophysical Journal, 843, 55
- Mairs et al. (2017b) Mairs S., et al., 2017b, ApJ, 849, 107
- Megeath et al. (2012) Megeath S. T., et al., 2012, AJ, 144, 192
- Moore et al. (2016) Moore A. M., et al., 2016, in Hall H. J., Gilmozzi R., Marshall H. K., eds, Society of Photo-Optical Instrumentation Engineers (SPIE) Conference Series Vol. 9906, Ground-based and Airborne Telescopes VI. p. 99062C (arXiv:1608.04510), doi:10.1117/12.2233694
- Morales-Calderón et al. (2011) Morales-Calderón M., et al., 2011, ApJ, 733, 50
- Nikoghosyan et al. (2017) Nikoghosyan E. H., Azatyan N. M., Khachatryan K. G., 2017, A&A, 603, A26
- Park et al. (2021) Park W., et al., 2021, ApJ, 920, 132
- Park et al. (2022) Park S., et al., 2022, arXiv e-prints, p. arXiv:2211.02137
- Persi et al. (2007) Persi P., Tapia M., Gòmez M., Whitney B. A., Marenzi A. R., Roth M., 2007, AJ, 133, 1690
- Rayner et al. (2003) Rayner J. T., Toomey D. W., Onaka P. M., Denault A. J., Stahlberger W. E., Vacca W. D., Cushing M. C., Wang S., 2003, PASP, 115, 362
- Reipurth & Aspin (2010) Reipurth B., Aspin C., 2010, in Harutyunian H. A., Mickaelian A. M., Terzian Y., eds, Evolution of Cosmic Objects through their Physical Activity. pp 19–38
- Reipurth et al. (2010) Reipurth B., Herbig G., Aspin C., 2010, AJ, 139, 1668
- Safron et al. (2015) Safron E. J., et al., 2015, ApJ, 800, L5
- Saito et al. (2012) Saito R. K., et al., 2012, A&A, 537, A107
- Scargle (1989) Scargle J. D., 1989, ApJ, 343, 874
- Scholz et al. (2013) Scholz A., Froebrich D., Wood K., 2013, MNRAS, 430, 2910
- Sergison et al. (2020) Sergison D. J., Naylor T., Littlefair S. P., Bell C. P. M., Williams C. D. H., 2020, MNRAS, 491, 5035
- Sicilia-Aguilar et al. (2017) Sicilia-Aguilar A., et al., 2017, A&A, 607, A127
- Simon et al. (2004) Simon T., Andrews S. M., Rayner J. T., Drake S. A., 2004, ApJ, 611, 940
- Stamatellos et al. (2012) Stamatellos D., Whitworth A. P., Hubber D. A., 2012, MNRAS, 427, 1182
- Stauffer et al. (2014) Stauffer J., et al., 2014, AJ, 147, 83
- Stauffer et al. (2015) Stauffer J., et al., 2015, The Astronomical Journal, 149, 130
- Szegedi-Elek et al. (2020) Szegedi-Elek E., et al., 2020, ApJ, 899, 130
- Szilágyi et al. (2021) Szilágyi M., Kun M., Ábrahám P., 2021, MNRAS, 505, 5164
- Tapia et al. (2015) Tapia M., Roth M., Persi P., 2015, MNRAS, 446, 4088
- Tobin et al. (2020) Tobin J. J., et al., 2020, ApJ, 890, 130
- Venuti et al. (2017) Venuti L., et al., 2017, A&A, 599, A23
- Vorobyov & Basu (2015) Vorobyov E. I., Basu S., 2015, ApJ, 805, 115
- Wang & Chen (2019) Wang S., Chen X., 2019, ApJ, 877, 116
- Wang et al. (2020) Wang J.-W., Lai S.-P., Clemens D. P., Koch P. M., Eswaraiah C., Chen W.-P., Pandey A. K., 2020, ApJ, 888, 13
- Ward-Thompson et al. (2007) Ward-Thompson D., et al., 2007, PASP, 119, 855
- Wright et al. (2010) Wright E. L., et al., 2010, AJ, 140, 1868
- Yoo et al. (2017) Yoo H., et al., 2017, ApJ, 849, 69
- Yoon et al. (2022) Yoon S.-Y., et al., 2022, ApJ, 929, 60
- Zakri et al. (2022) Zakri W., et al., 2022, ApJ, 924, L23
- Zhu et al. (2009) Zhu Z., Hartmann L., Gammie C., 2009, ApJ, 694, 1045
- Zhu et al. (2022) Zhu W., et al., 2022, ApJ, 933, L21
- Zucker et al. (2018) Zucker C., Schlafly E. F., Speagle J. S., Green G. M., Portillo S. K. N., Finkbeiner D. P., Goodman A. A., 2018, ApJ, 869, 83
Appendix A Individual sources