Does Cyclomatic or Cognitive Complexity Better Represents Code Understandability? An Empirical Investigation on the Developers Perception
Abstract
Background. Code understandability is fundamental. Developers need to clearly understand the code they are modifying. A low understandability can increase the amount of coding effort and misinterpretation of code has impact on the entire development process. Ideally, developers should write clear and understandable code with the least possible effort.
Objective. The goal of this work is to investigate if the McCabe Cyclomatic Complexity or the Cognitive Complexity can be a good predictor for the developers’ perceived code understandability to understand which of the two complexities can be used as criteria to evaluate if a piece of code is understandable.
Method. We designed and conducted an empirical study among 216 junior developers with professional experience ranging from one to four years. We asked them to manually inspect and rate the understandability of 12 Java classes that exhibit different levels of Cyclomatic and Cognitive Complexity.
Results. Cognitive Complexity slightly outperforms the Cyclomatic Complexity to predict the developers’ perceived understandability.
Conclusion. The identification of a clear and validated measure for Code Complexity is still an open issue. Neither the old fashioned McCabe Cyclomatic Complexity and the most recent Cognitive Complexity are good predictors for code understandability, at least when considering the complexity perceived by junior developers.
keywords:
Cyclomatic Complexity , Cognitive Complexity , Empirical Study1 Introduction
Code understandability is the ability of software developers to comprehend and effectively work with code written by others or by themselves in the past. In other words, it refers to how easy it is to read and interpret a piece of code.
Code understandability is an essential aspect of software development, as it can greatly impact the efficiency and effectiveness of the development process. When code is easy to understand, developers can more easily identify and fix errors, modify existing code, and integrate new code into existing projects. On the other hand, code that is difficult to understand can lead to confusion, errors, and time-consuming troubleshooting.
There are several factors that contribute to code understandability, including the use of clear and concise syntax, consistent formatting and naming conventions, and well-organized code structure. Additionally, documentation and comments can also play a crucial role in improving code understandability.
Code understandability can be defined as the measure to which “code possesses the characteristic of understandability to the extent that its purpose is clear to the inspector” [1]. Having a poor code understandability in the program code can increase the amount of coding effort by more than 50% [2, 3] and any misinterpretation of the code will influence the entire development process. To avoid misinterpretation of the code, developers should write code that requires the least amount of effort to be understood [4].
Different metrics, such as the McCabe Cyclomatic Complexity [5], and the Cognitive Complexity [6] have been proposed in the past to evaluate the complexity of the code. Current static analysis tools allow the developers to keep track of these metrics in their code on real-time. Cognitive Complexity has been introduced by SonarQube111 https://www.sonarqube.org as an extension of the McCabe Cyclomatic Complexity, to better evaluate code understandability [6]. The effect of Cognitive Complexity on code understandably was investigated by two recent studies [7, 4]. Based on their results, Cognitive Complexity seems to be a good indicator of understandability where a higher value means a reduction of understandability. However, both studies did not consider the opinion of the developers on the perceived complexity of the code. Yet, we believe that only two studies (of which one was conducted by the original authors of the Cognitive Complexity metric) are not enough to demonstrate the effectiveness of a new metric. Moreover, as highlighted by Munoz [4], the different complexity and understandability metrics are not deeply investigated and validated. In particular, it is still not evident which of the metrics better support the prediction of code understandability [7].
As consequence, Lavazza et al. [8] extended [4] correlating Cognitive and Cyclomatic complexity to identify which metric provides advantage for code understandability. Unfortunately, the achieved results are not proposing for a particular metric.
Code can be complex also due to problems in the code such as design issues or code smells. As highlighted by Politowski et al. [9], the presence of anti-patterns in the code can decrease the code understandability, and increase the effort needed to modify the code. Therefore, if the complexity metrics are correlated with code understandability, also problems in the code can be correlated with the complexity measures.
Since the previous studies highlighted the need to understand whether Cognitive complexity is correlated with understandability better than the other existing metrics and the previous results, based on mining software repository studies, were not able to tip the scales, we decided to investigate the impact of these two metrics on code understandably from the point of view of the developer’s perception.
To this purpose, we designed and conducted an empirical study involving 216 developers with at least one year of experience. We asked them to manually inspect twelve Java classes that exhibit different levels of Cyclomatic and Cognitive Complexity measured by SonarQube. The tasks requested for each class were to rate the code understandability.
Moreover, if a positive correlation exists between complexity measures and code understandability, we also aim at understanding if complexity measures are correlated with the developers’ perceived severity of problems in the Java code.
While there seems to be some differences between developers’ opinions on the perception of complexity of the code, the overall data indicates that Cognitive Complexity is a better indicator on the perceived understandability of the code.
The paper is structured as follows: In Section 2 we introduce the background of this work, while in Section 3 we outline the research methodology adopted in this study. Section 4 presents and discusses the obtained results. Section 6 identifies the threats to validity, while Section 7 describes the related work. Finally, Section 8 draws the conclusions.
2 Background
In this Section, we briefly describe the two complexity measures we considered in this work. Both measures are included in the SonarQube suite.
2.1 Cyclomatic Complexity
Cyclomatic Complexity is a metric introduced by McCabe already in 1976 [5]. It is a graph theoretical measure for program complexity. The idea behind Cyclomatic Complexity is to measure the amount of linearly independent paths in the program. It is based on the assumption that the more independent paths there are in a program, the more complex the program is likely to be.
The definition of Cyclomatic Complexity is based on representing program code as a control flow graph, i.e. a directed graph with all execution paths of the program depicted. Each node in the graph represents a basic code block and each edge a pass of control between the blocks. Based on the graph, Cyclomatic Complexity is calculated as where is the number of edges, the number of nodes and the number of strongly connected components in the graph. While Cyclomatic Complexity is a widely used metric to indicate the error proneness of program code, it fails to address certain code issues especially when it comes to computational complexity. Cyclomatic Complexity is poor at handling nested condition and iterative structures [10]. Also it has been regarded as a poor metric for code understandability [6].
In SonarQube, the Complexity measure is calculated based on the Cyclomatic Complexity of the code [11] where each split in the control flow of a function increments the complexity measure by one. However, there are small differences between languages in how the complexity gets calculated due to differences in language structures.
Cyclomatic complexity can be used as an indicator of how difficult a program is to test, maintain, or modify. Programs with high cyclomatic complexity are generally more difficult to understand, analyze, and change, as they contain more decision points and potential paths through the code. As such, cyclomatic complexity is often used as a quality metric to evaluate the maintainability and overall complexity of software programs.
2.2 Cognitive Complexity
Cognitive complexity is based on the idea that not all decision points in a program are equally difficult for a human to understand. Some decisions are simple and easy to reason about, while others are more complex and require more mental effort. Therefore, cognitive complexity assigns a weight to each decision point in the code based on its level of complexity, with more complex decisions receiving a higher weight.
In SonarQube, Cognitive Complexity was introduced as “a new metric for measuring the understandability of any given piece of code” [6]. Based on the documentation [12], Cognitive Complexity exhibits some similarity with Cyclomatic Complexity defined by McCabe [5], since Cognitive Complexity can address some of the “common critiques and shortcomings belonging to Cyclomatic Complexity” [10]. Moreover, Cognitive Complexity can fill the gap related to understandability present in the Cyclomatic Complexity [6].
Investigating the construction model, Cognitive Complexity is based on three basic rules [6]:
-
1.
“Ignore structures that allow multiple statements to be readably shorthanded into one”;
-
2.
“Increment for each break in the linear flow of the code”;
-
3.
“Increment when flow-breaking structures are nested”.
The first rule implicates to obtain no increment of complexity for a method declaration or null-coalescing operators like “??” in C# or PHP, to not penalize developers writing shorter code than those using the operators written on multiple lines.
The second rule increments complexity whenever the flow of statements is broken, i.e., [6]:
-
•
switch, if, else if, else, ternary operator
-
•
for, foreach, while, do while
-
•
catch
-
•
goto LABEL, break LABEL, continue LABEL
-
•
sequences of like binary logical operators
-
•
each method in a recursion cycle.
The last rule increases the complexity value to take the level of nesting of control flow structures into account. The following structures increment the nesting level [6]:
-
•
switch, if, else if, else, ternary operator
-
•
for, foreach, while, do while
-
•
catch
-
•
nested methods and method-like structures
3 The Empirical Study
We designed and conducted an empirical study by following the guideline proposed by Runeson and Höst [13]. In this section, we present the goal, the research questions, metrics and hypotheses for the empirical study. We outline the study context, the data collection and the data analysis.
3.1 Goal and Research Questions
The goal of this study is to compare cyclomatic complexity and cognitive complexity with the purpose of understanding which complexity metric better represents the developer’s perceived complexity of the Java code. The perspective is of researchers, since they are interested in understanding what complexity metrics can be more helpful to understand the code complexity.
Based on the aforementioned goal, we derived the following Research Questions:
- RQ1:
-
Which complexity metric has a higher correlation with the perceived understandability level of a given developer for a specific code snippet?
- RQ2:
-
Is there a correlation between the complexity metrics and the perceived severity of an existing problem in the code?
These research questions are further divided into the following sub-research questions:
- RQ1.1:
-
What is the correlation between the Cyclomatic Complexity and the perceived understandability level of a given developer for a specific code snippet?
- RQ1.2:
-
What is the correlation between the Cognitive Complexity and the perceived understandability level of a given developer for a specific code snippet?
- RQ2.1:
-
Is there a correlation between Cyclomatic Complexity and the perceived severity of existing problems in the code?
- RQ2.2:
-
Is there a correlation between Cognitive Complexity and the perceived severity of existing problems in the code?
In RQ1, we investigated correlations between perceived code understandability and Cyclomatic (RQ1.1) and Cognitive (RQ1.2) complexities. The goal of this question is to understand if it is possible to use only one of the two complexities to represent code understandability. In particular, since Cognitive Complexity is considered a “more contextualized form of quantitative data on code complexity”, we are interested to understand if Cognitive Complexity is a better predictor for the code understandability. Since the Cognitive Complexity was build upon the Cyclomatic Complexity, we hypothesized that it might better represent the code understandability.
Complex code is considered hard to modify [2, 3]. Moreover, code affected by high levels of Cyclomatic Complexity is usually affected by more severe problems [2, 3]. Therefore, in our second research question (RQ2), we aim at understanding if Cognitive Complexity can better represent the severity of the problems in the code (RQ2.2) compared to Cyclomatic Complexity (RQ2.1).
Moreover, we considered that a lower code understandability can lead to a misleading in the problem identification in the inspected code and, consequently, a wrong perception of its severity (RQ2).
3.2 Empirical Study Design
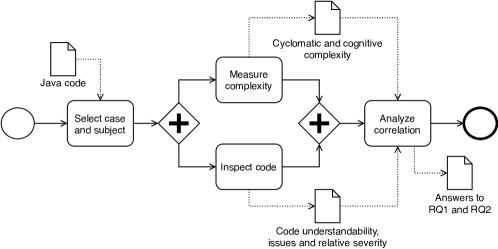
To answer our research questions, we designed our empirical study consisting of the five steps below. Fig. 1 illustrates the process using the Business Process Model and Notation (BPMN) [14] specification language.
-
1.
Code Selection: We selected Java code affected by problems of different severity from Apace Software Foundation projects.
-
2.
Complexity measurement: We measured the Cyclomatic and Cognitive Complexity of the selected Java code using SonarQube.
-
3.
Developers selection: we identified the junior developers to be included in our study.
-
4.
Code inspection: We asked developers to inspect the selected Java code and to provide their opinion on the understandability of the code, on the presence of issues, and to rate the severity of the existing problem, if any.
-
5.
Data Analysis: We analyzed the developers’ answers and correlated the developer’s perceived understandability with the Cyclomatic and Cognitive Complexity.
In the remainder of this Section, we describe the all aforementioned steps in detail.
3.2.1 Code Selection
In this section, we report the case and subject selection for this study. We selected classes written in Java affected by different problems that can influence code understandably from Apace Software Foundation projects. Two of three authors, together with a senior Java developer, evaluated independently the presence of issues in the code. Then, all the three persons discussed possible inconsistencies and finally defined a list of 12 classes where all of them agree on the presence of the same issues (Table 2). More details of the selected classes and of the problems identified in the code are available in Table 1.
| Class | Validated problem in the code |
|---|---|
| C1 | Maintainability low because of code smells present in the code |
| \hdashline[1pt/1pt] C2 | As C1, and in addition, cognitive complexity exceeds threshold defined by SonarQube |
| \hdashline[1pt/1pt] C3 | Code is not tested |
| \hdashline[1pt/1pt] C4 | As C2, and in addition, code contains faults |
| \hdashline[1pt/1pt] C6 | Duplicated code |
| \hdashline[1pt/1pt] C5 | Combination of C1 (constants missing) and C6 |
| \hdashline[1pt/1pt] C7 | Variation of C1 with a higher criticality (unimplemented functions) |
| \hdashline[1pt/1pt] C8 | Variation of C1 with a lower criticality |
| \hdashline[1pt/1pt] C9 | Code smell: exception handling |
| \hdashline[1pt/1pt] C10 | Code is not tested |
| \hdashline[1pt/1pt] C11 | Code is not tested |
| \hdashline[1pt/1pt] C12 | Minor code smell |
-
•
Details about the classes (name and path) are available in the replication package4
3.2.2 Complexity Measurement.
We measured the code complexity by means of Cognitive Complexity and Cyclomatic Complexity applying SonarQube version 7.51.
3.2.3 Developers Selection
As for participants, we selected junior developers. The reason for selecting them, instead of senior developers, is because they are the developers that most frequently need to approach new code. In particular, junior developers commonly need to extend existing code in the company they work, fixing bugs or integrating new features. Therefore, we selected master or bachelor students in their last year of studies, with at least one year of experience as developer in a company. The selected participants, are exactly these developers that are working on existing code and that need to understand problems in the code when extending it or when they are fixing bugs.
We finally involved 216 junior developers with an experience in Java that range from one to four years.
We did not present to the participants the Cyclomatic Complexity and Cognitive Complexity values, in order not to influence them in their ability to recognize a potential design problem only because they see the complexity values in advance.
| Class | Cyclomatic Complexity | Cognitive Complexity |
|---|---|---|
| C1 | 37 | 38 |
| \hdashline[1pt/1pt] C2 | 130 | 73 |
| \hdashline[1pt/1pt] C3 | 113 | 36 |
| \hdashline[1pt/1pt] C4 | 56 | 68 |
| \hdashline[1pt/1pt] C5 | 57 | 3 |
| \hdashline[1pt/1pt] C6 | 35 | 6 |
| \hdashline[1pt/1pt] C7 | 110 | 0 |
| \hdashline[1pt/1pt] C8 | 23 | 6 |
| \hdashline[1pt/1pt] C9 | 2 | 1 |
| \hdashline[1pt/1pt] C10 | 6 | 0 |
| \hdashline[1pt/1pt] C11 | 7 | 1 |
| \hdashline[1pt/1pt] C12 | 3 | 0 |
-
•
Details about the classes (name and path) are available in the replication package4
3.2.4 Code Inspection.
We asked developers to manual inspect the 12 Java classes and provide their opinion about the code understandability. To collect the information, we organized the questionnaire into four sections:
-
•
Respondents’ Background. We collected the profile of the respondents considering development experience.
-
•
Code Inspection. In this section of the questionnaire we asked participants to manually inspect a Java class and provide their opinion about their perceived Code Understandability through a five-point Likert Scale (1 means “very easy” and 5 means “very difficult”).
-
•
Perceived Problem Criticality in the code, reporting if the problem exists in the class and rating their severity through a five-point Likert Scale (1 means “very low severity” and 5 means “very high severity”).
We implemented the questionnaire using Google Forms. The Questionnaire is available in the replication package4.
| RQ | Question | Answer type |
|---|---|---|
| RQ1 | How easy is it to understand the code of this class? | Five-point scales |
| \hdashline[1pt/1pt] RQ2 | Does, in your opinion, this class has design, coding style, or any other problems? | Yes/No |
| If YES, please rate the severity of the problem | Five-point Likert Scales |
3.3 Study Execution
We provided the participants the instructions describing how to access the classes and how to answer the survey. The participants were allowed to inspect the classes and fill out the online questionnaire in a single round. We informed the participants, according to the GDPR222https://gdpr-info.eu, about their rights and that they can abandon the study anytime. Moreover, all information provided by each participant have been treated as confidential, without disclosing any sensible data, such as name and surname.
3.4 Data Analysis
Concerning the results of the code inspection phase, we first verified the participants’ background analyzing the distribution of their education level (bachelor or master) and their experience as developers in software companies.
To answer our RQ, we first quantitatively analyzed the perceived code understandability reported by the developers.
Then, we investigated the correlations between the perceived code understandability (dependent variable) and the Cyclomatic Complexity (RQ1.1) and Cognitive Complexity (RQ1.2) as independent variables. We adopted the Spearman rank correlation coefficient [15], which measures how well a monotonic function can be fitted between two groups of values measured from the same samples. This is a non-parametric method and the values of range between -1 and 1, where 1 means perfect positive monotonic association, -1 means perfect negative monotonic association, and 0 means there is no monotonic association between the groups.
For interpreting the other values of , we followed the guideline suggested by Cohen [16]: no correlation if , small correlation if , medium correlation if , and large correlation if . Corresponding limits apply for negative correlation coefficients. We determined the statistical significance of the correlations checking p-values, that should be lower than 0.05 (significance level alpha). Therefore, we adopted the value of to compare the correlations obtained in (RQ1.1) and (RQ1.2). To enable to visualize the key value of our results, we plotted the results with box-plots.
We applied statistical tests to verify whether the differences are statistically significant. Since the data are not normally distributed, we exploited the Friedman Test with the Nemenyi post-hoc test [17] on all the machine learning models. This is a post-hoc test that identifies the groups of data that differ after a statistical test of multiple comparisons has rejected the null hypothesis (the groups are similar), making a pair-wise performance. We selected this test because it is robust to multiple comparisons - which is our case since we had to compare multiple models on multiple features. To conduct the statistical analysis, we used the Nemenyi package for Python333The Nemenyi Python package: https://scikit-posthocs.readthedocs.io/en/latest/..
Then, we first manually validated if the problems reported by the developers in the code refer to actual problems in the code (Table 1). As for (RQ2), the qualitative data analysis has been conducted individually by each author. Moreover, in order to to get a fair/good agreement on the first iteration of this process, pairwise inter-rater reliability was measured across the three sets of decisions. Based on the disagreements, we clarified possible discrepancies and different classifications. A second iteration resulted in 100% agreement among all the authors.
We conducted the next analysis only for the cases where participants correctly identified a problem in the code.
We analyzed the correlations between the perceived problem severity (dependent variable) and the Cyclomatic Complexity (RQ2.1) and Cognitive Complexity (RQ2.2) as independent variables with the Spearman rank correlation coefficient [15], following the same approach adopted in (RQ1.1).
3.5 Replicability
In order to allow our study to be replicated, we have published the complete raw data together with the instruction of the assignment and the complete questionnaire in the replication package444https://figshare.com/s/0044c83c4fcb45dd831f.
4 Results
In this section, we report the results obtained answering our RQs. We collected information from 216 students.
Background Information. The respondents were 170 master students (79%) and 46 (21%) were bachelor students. 96 (79.34%) of them had between 1 and 2 years of developing experience, while the remaining 25 (20.66%) had more than 3 and 4 years (Table 4).
| Role | Developer Experience | ||
|---|---|---|---|
| Bachelor | 21% | less than 2 years | 84% |
| \hdashline[1pt/1pt] Master | 79% | 3 and 4 years | 16% |
4.1 Which is the correlation between complexity metrics and the perceived code understandability (RQ1)
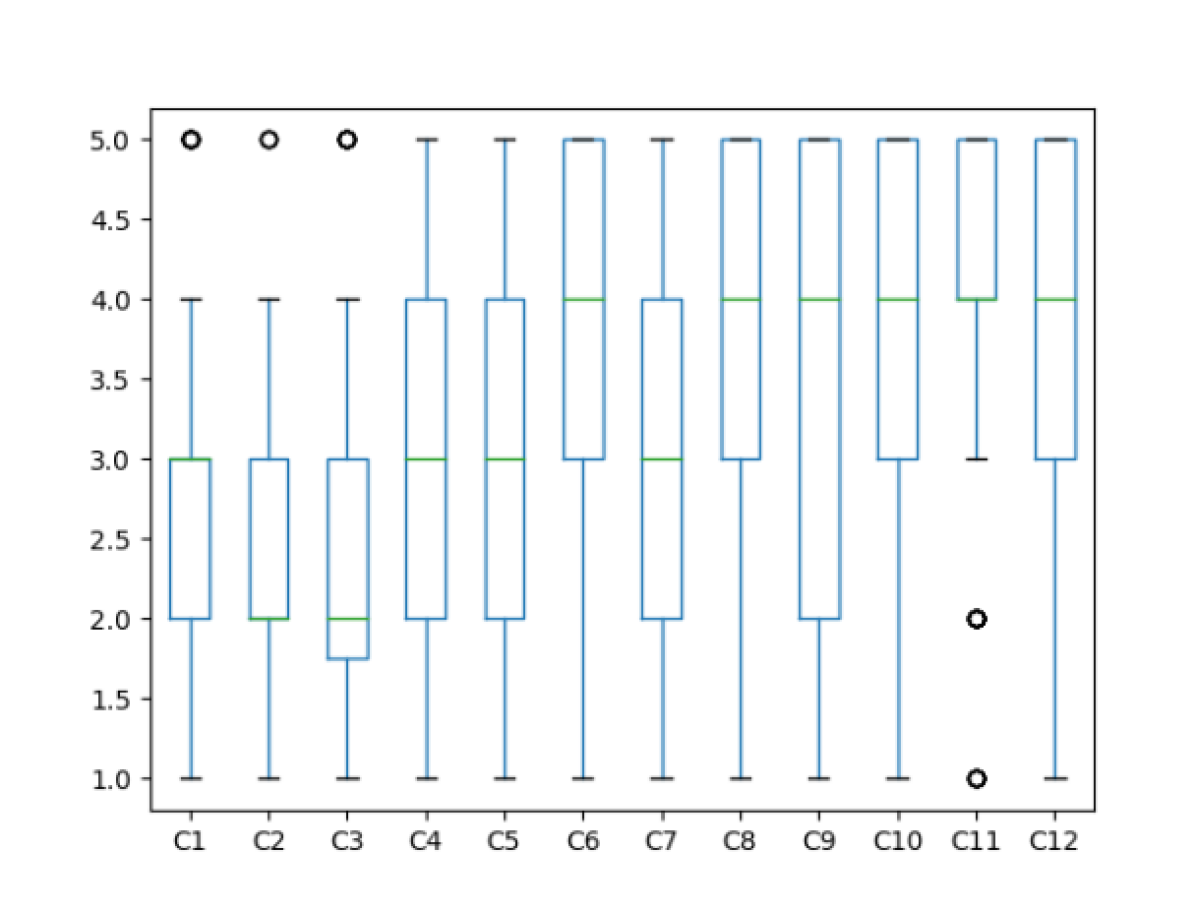
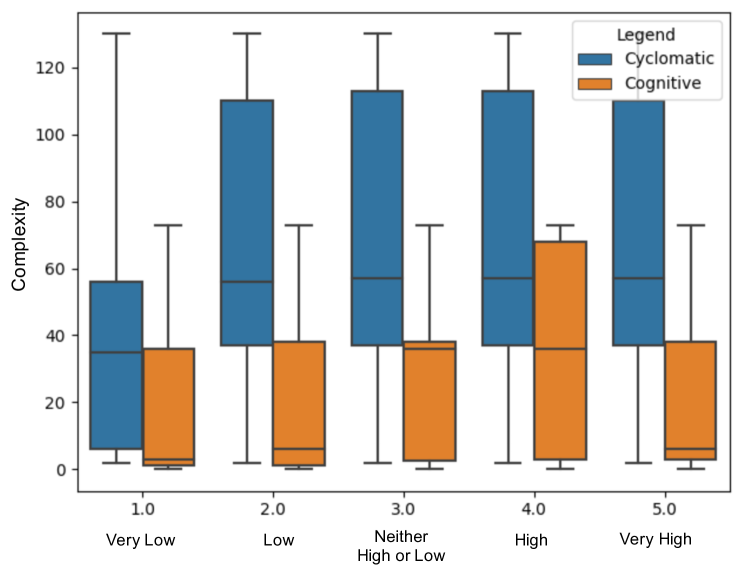
As we can see from Table 5, the respondents considered the vast majority of the classes (83%) neither to easy (median 3) or hard to understand (median 3), while the remaining classes (C3 and C4) are easy to understand (median 2).
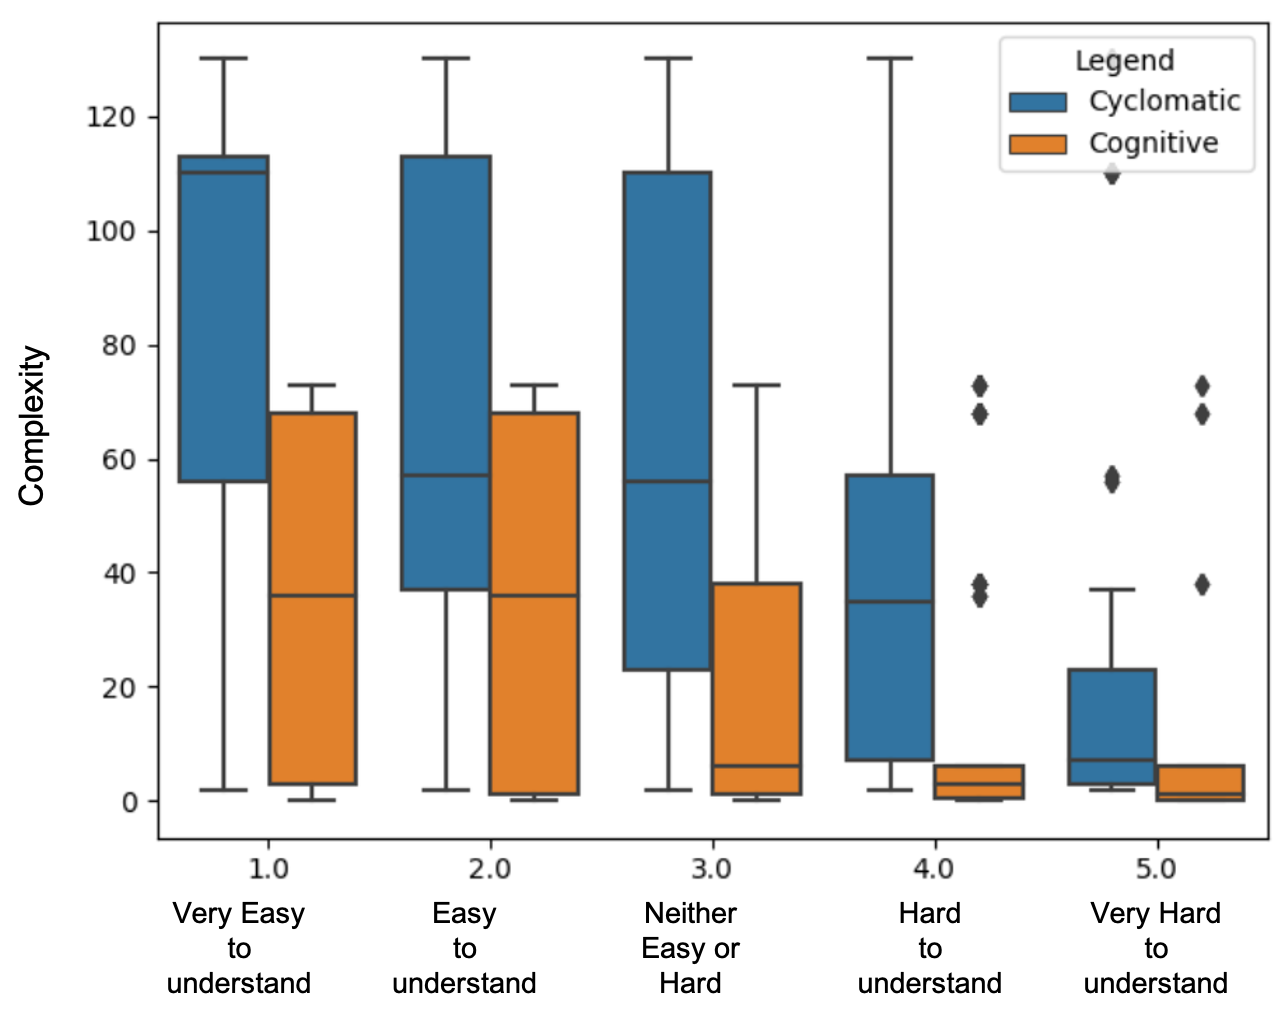
As evidence on the application on Cognitive Complexity as an understandability measure is scarce, we set out to study how junior developers perceive code with different Cyclomatic and Cognitive Complexity levels. Our results indicate that cognitive complexity seems a better indicator on severity across developers and that while there is quite a lot of variance cognitive complexity also is better agreed on as a complexity indicator. It was evident that less complex classes were considered easy to understand indicating that low Cyclomatic and Cognitive Complexity supports understandability of the code. However, if Cyclomatic or Cognitive Complexity was high, the opinion on understandability was varied.
This is a very interesting result and requires further investigation. It does seem that low Cognitive Complexity makes the code more understandable despite the high Cyclomatic Complexity but reducing the Cognitive Complexity does not make the understandability of the code universally better for all developers. What is especially eyeopening is that having both complexity measures high, the perception on understandability varied.
Understandability appears to be a little more correlated with Cognitive Complexity. However, the difference to Cyclomatic Complexity was not drastic. The developers were more agreed on Cognitive Complexity as a complexity measure which means that it could be more useful of the two. Prior results [7, 18] have indicated that the metrics themselves do not indicate understandability.
Investigating the correlation between the overall code understandability and the Cyclomatic and Cognitive Complexities, results are statistical significant, since p-values is equal to 0.000 (Table 6). Overall, both metrics are not correlated with the perceived problem ( equal to 0.364 for Cyclomatic and 0.466 for Cognitive [16]).
| Class id. | Perc. Understandability | # respondent | Mode |
|---|---|---|---|
| C1 | 1-Very Easy | 20 | 3 |
| 2-Easy | 54 | ||
| 3-Neither Easy or Hard | 76 | ||
| 4-Hard | 42 | ||
| 5-Very Hard | 8 | ||
| \hdashline[1pt/1pt] C2 | 1-Very Easy | 48 | 2 |
| 2-Easy | 55 | ||
| 3-Neither Easy or Hard | 58 | ||
| 4-Hard | 28 | ||
| 5-Very Hard | 3 | ||
| \hdashline[1pt/1pt] C3 | 1-Very Easy | 51 | 2 |
| 2-Easy | 49 | ||
| 3-Neither Easy or Hard | 58 | ||
| 4-High | 29 | ||
| 5-Very Hard | 7 | ||
| \hdashline[1pt/1pt] C4 | 1-Very Easy | 27 | 3 |
| 2-Easy | 46 | ||
| 3-Neither Easy or Hard | 65 | ||
| 4-Hard | 40 | ||
| 5-Very Hard | 12 | ||
| \hdashline[1pt/1pt] C5 | 1-Very Easy | 22 | 4 |
| 2-Easy | 35 | ||
| 3-Neither Easy or Hard | 67 | ||
| 4-Hard | 49 | ||
| 5-Very Hard | 23 | ||
| \hdashline[1pt/1pt] C6 | 1-Very Easy | 8 | 3 |
| 2-Easy | 21 | ||
| 3-Neither Easy or Hard | 34 | ||
| 4-Hard | 72 | ||
| 5-Very Hard | 60 | ||
| \hdashline[1pt/1pt] C7 | 1-Very Easy | 18 | 4 |
| 2-Easy | 35 | ||
| 3-Neither Easy or Hard | 61 | ||
| 4-Hard | 52 | ||
| 5-Very Hard | 29 | ||
| \hdashline[1pt/1pt] C8 | 1-Very Easy | 7 | 4 |
| 2-Easy | 14 | ||
| 3-Neither Easy or Hard | 39 | ||
| 4-Hard | 50 | ||
| 5-Very Hard | 83 | ||
| \hdashline[1pt/1pt] C9 | 1-Very Easy | 29 | 4 |
| 2-Easy | 29 | ||
| 3-Neither Easy or Hard | 38 | ||
| 4-Hard | 35 | ||
| 5-Very Hard | 66 | ||
| \hdashline[1pt/1pt] C10 | 1-Very Easy | 10 | 4 |
| 2-Easy | 18 | ||
| 3-Neither Easy or Hard | 35 | ||
| 4-Hard | 52 | ||
| 5-Very Hard | 75 | ||
| \hdashline[1pt/1pt] C11 | 1-Very Easy | 6 | 4 |
| 2-Easy | 10 | ||
| 3-Neither Easy or Hard | 31 | ||
| 4-Hard | 57 | ||
| 5-Very Hard | 88 | ||
| \hdashline[1pt/1pt] C12 | 1-Very Easy | 6 | 4 |
| 2-Easy | 19 | ||
| 3-Neither Easy or Hard | 28 | ||
| 4-Hard | 51 | ||
| 5-Very Hard | 92 |
| Complexity | ||
|---|---|---|
| Spearman | Cyclomatic | Cognitive |
| r | 0.364 | 0.466 |
| \hdashline[1pt/1pt] p-value | 0.000 | 0.000 |
4.2 Which complexity metric better represents the severity of an existing problem in the code (RQ2)
To answer RQ2, we first investigated if they perceived a design or coding style problem and if they correctly detected and identified it.
Perceived design or coding style problem. The percentage of respondents than consider a class affected by a design or coding style problem is less than 75%.
Design coding style problem identification. It is interesting to note that, almost all the participants that identified a problem in the classes, correctly identified at least one of the actual problems. The only exception is for classes C7 and C12 not all the developers provided a description. 77.85% of them correctly identified the correct problem for C7 and 89% considering C12 class. Table 7 shows the results for the identification of the problems grouped by Class (C).
Therefore, as also highlighted by Table 7, we can conclude that the understandability of the code is independent from the perception of a problem.
| Class | Problem | Mode | |||||
|---|---|---|---|---|---|---|---|
| Perceived | Described | Severity | |||||
| # | % | # | % | # | # | ||
| C1 | 146 | 69 | 146 | 100 | 1-Very Easy | 5 | 3 |
| 2-Easy | 11 | ||||||
| 3-Neither Easy or Hard | 25 | ||||||
| 4-Hard | 24 | ||||||
| 5-Very Hard | 16 | ||||||
| \hdashline[1pt/1pt] C2 | 159 | 75 | 159 | 100 | 1-Very Easy | 7 | 3 |
| 2-Easy | 29 | ||||||
| 3-Neither Easy or Hard | 23 | ||||||
| 4-Hard | 21 | ||||||
| 5-Very Hard | 8 | ||||||
| \hdashline[1pt/1pt] C3 | 154 | 74 | 154 | 100 | 1-Very Easy | 9 | 3 |
| 2-Easy | 21 | ||||||
| 3-Neither Easy or Hard | 35 | ||||||
| 4-Hard | 16 | ||||||
| 5-Very Hard | 10 | ||||||
| \hdashline[1pt/1pt] C4 | 127 | 60 | 127 | 100 | 1-Very Easy | 8 | 3 |
| 2-Easy | 17 | ||||||
| 3-Neither Easy or Hard | 17 | ||||||
| 4-Hard | 21 | ||||||
| 5-Very Hard | 12 | ||||||
| \hdashline[1pt/1pt] C5 | 145 | 69 | 145 | 100 | 1-Very Easy | 11 | 3 |
| 2-Easy | 17 | ||||||
| 3-Neither Easy or Hard | 21 | ||||||
| 4-Hard | 22 | ||||||
| 5-Very Hard | 15 | ||||||
| \hdashline[1pt/1pt] C6 | 81 | 38 | 81 | 100 | 1-Very Easy | 4 | 4 |
| 2-Easy | 5 | ||||||
| 3-Neither Easy or Hard | 9 | ||||||
| 4-Hard | 11 | ||||||
| 5-Very Hard | 21 | ||||||
| \hdashline[1pt/1pt] C7 | 149 | 71 | 116 | 78 | 1-Very Easy | 9 | 3 |
| 2-Easy | 10 | ||||||
| 3-Neither Easy or Hard | 24 | ||||||
| 4-Hard | 24 | ||||||
| 5-Very Hard | 13 | ||||||
| \hdashline[1pt/1pt] C8 | 60 | 28 | 60 | 100 | 1-Very Easy | 0 | 4 |
| 2-Easy | 4 | ||||||
| 3-Neither Easy or Hard | 8 | ||||||
| 4-Hard | 8 | ||||||
| 5-Very Hard | 17 | ||||||
| \hdashline[1pt/1pt] C9 | 96 | 46 | 75 | 78 | 1-Very Easy | 6 | 4 |
| 2-Easy | 9 | ||||||
| 3-Neither Easy or Hard | 11 | ||||||
| 4-Hard | 9 | ||||||
| 5-Very Hard | 20 | ||||||
| \hdashline[1pt/1pt] C10 | 39 | 19 | 39 | 100 | 1-Very Easy | 1 | 4 |
| 2-Easy | 4 | ||||||
| 3-Neither Easy or Hard | 5 | ||||||
| 4-Hard | 3 | ||||||
| 5-Very Hard | 10 | ||||||
| \hdashline[1pt/1pt] C11 | 53 | 25 | 53 | 100 | 1-Very Easy | 1 | 5 |
| 2-Easy | 0 | ||||||
| 3-Neither Easy or Hard | 5 | ||||||
| 4-Hard | 9 | ||||||
| 5-Very Hard | 16 | ||||||
| \hdashline[1pt/1pt] C12 | 89 | 42 | 55 | 62 | 1-Very Easy | 1 | 4 |
| 2-Easy | 6 | ||||||
| 3-Neither Easy or Hard | 10 | ||||||
| 4-Hard | 15 | ||||||
| 5-Very Hard | 20 | ||||||
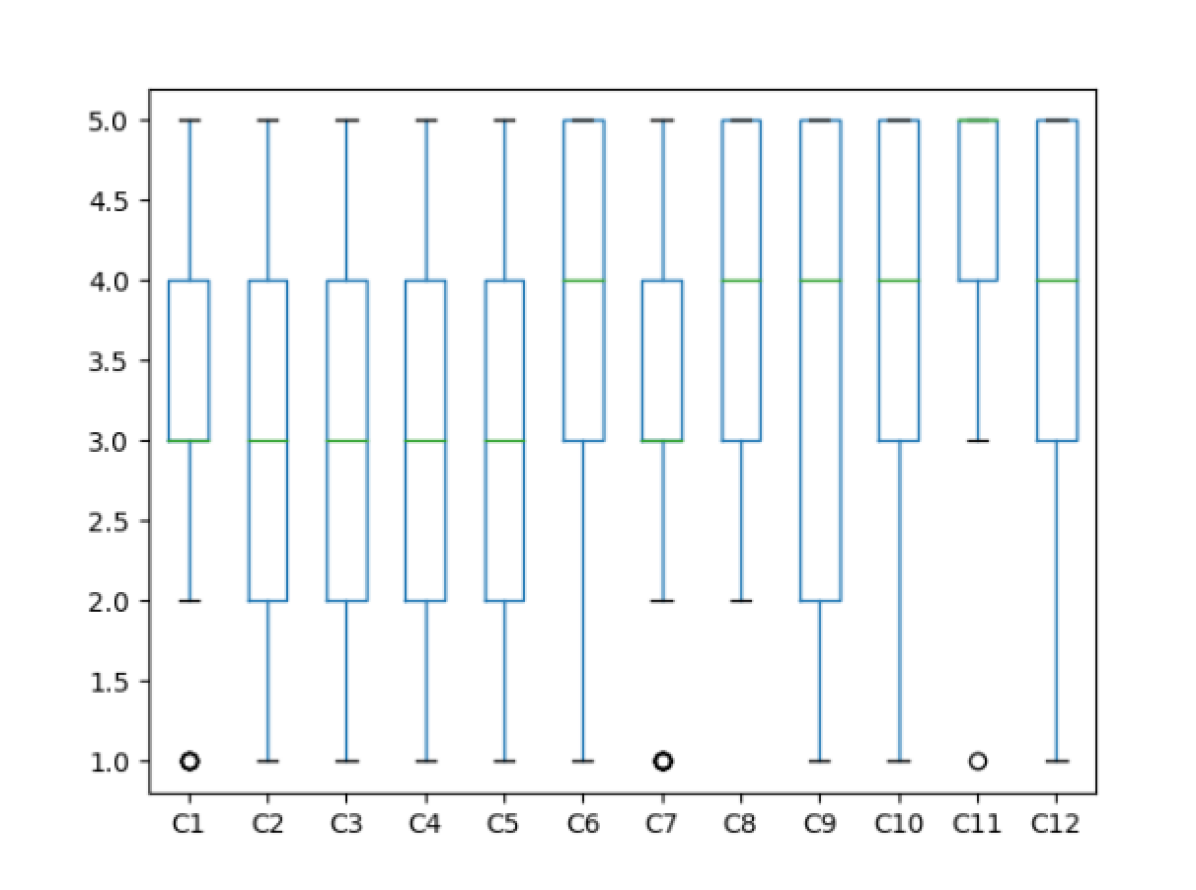
Design or coding style problem severity. The participants rated how concerned they were with respect to the design problem identified in the inspected code for each class. The participants rated their evaluation based on a 5-point Likert scale (1 means “very low” and 5 means “very high”).
Table 7 shows the obtained results grouped by Class (C), 5-point Likert scale levels (from 1 to 5), and number of respondents. We report the average and the median of the perceived Severity. Almost all the respondents that perceived a problem in the inspected classes considered it at least with a medium severity (median 3).
| Complexity | ||
|---|---|---|
| Spearman | Cyclomatic | Cognitive |
| r | -0.268 | -0.152 |
| \hdashline[1pt/1pt] p-value | 0.000 | 0.001 |
5 Discussion
As evidence on the application on Cognitive Complexity as an understandability measure is scarce, we set out to study how junior developers perceive code with different Cyclomatic and Cognitive Complexity levels. Our results indicate that cognitive complexity seems a better indicator on severity across developers and that while there is quite a lot of variance cognitive complexity also is better agreed on as a complexity indicator.
It was evident that less complex classes were considered easy to understand indicating that low Cyclomatic and Cognitive Complexity supports understandability of the code. However, if Cyclomatic or Cognitive Complexity was high, the opinion on understandability was varied. This is a very interesting result and requires further investigation. It does seem that low Cognitive Complexity makes the code more understandable despite the high Cyclomatic Complexity but reducing the Cognitive Complexity does not make the understandability of the code universally better for all developers. What is especially eyeopening is that having both complexity measures high, the perception on understandability varied. Understandability appears to be a little more correlated with Cognitive Complexity. However, the difference to Cyclomatic Complexity was not drastic. The developers were more agreed on Cognitive Complexity as a complexity measure which means that it could be more useful of the two.
Prior results [8, 7, 18] have indicated that the metrics themselves do not indicate understandability and that the different proposed metrics are not positive correlated [8]. Based on our findings low complexity measures do seem to indicate good understandability but having either Cognitive or Cyclomatic high, makes understandability unpredictable. Moreover, out results also confirm that both complexity metrics are also not correlated with the perceived severity of the problems in the code.
When looking into RQ2 the increased complexity increased the perception on severity as well. However, there was large variance especially with Cyclomatic Complexity.
The perception on the code issues was good among the junior developers. If the class was considered to be affected by a design problem the developers are also able to describe what the problem is. This shows that highlighting the issues contributing to complexity measures can help in keeping understandability high. The understandability, however, is not dependent on the type of the problem. This may indicate that the developers should take also the more minor design issues more seriously.
6 Threats to Validity
In this Section, we introduce the threats to validity, following the structure suggested by Yin [19], reporting construct validity, internal validity, external validity, and reliability. Moreover, we will also discuss the different tactics adopted to mitigate them.
Construct validity. Concerning the set of tasks, we considered classes whose code complexity was measured by the same tool (SonarQube) that allows to compute both complexities considered in this work (cyclomatic and cognitive complexities). We checked each question to avoid potential misunderstandings, negative questions, and threats. The perceived priority of the design problem was collected by asking the participants to first describe the problem they perceived to understand if their perception is actually related to the identified problem and not to other potential issue in the code. We asked the participants to rate the severity of the problem by means of a Likert scale, to allow us to compare the responses based on an homogeneous scale. To reduce this threat, we checked the correctness of the identification both manually and by means of automated tools.
Internal Validity. Considering the respondents, we selected junior developers with maximum 4 years of experience in programming skills to better focus on our goal. However, we are aware that the results could be biased by the selection of participants belonging to a set of developers more deeply trained in this tasks.
External validity. It can be concerned to the subjects of the study and the selected objects. To mitigate this threat, we adopted a treatment set of classes measure was possible to use the same tool to measured cognitive and cyclomatic complexities. Moreover, we are aware that further studies with different analyzed classes considering also the missing groups are needed to confirm our results.
Conclusion validity. Conclusion validity focuses on how sure we can be that the tasks we adopted are related to the actual outcome we observed. The survey were checked by three experts on empirical studies. Moreover, it was ensured that the subjects of both groups had similar backgrounds and knowledge regarding code understandability and code inspection.
7 Related Work
Code understandability is described as the measure of how well “code possesses the characteristic of understandability to the extent that its purpose is clear to the inspector” [1]. To better understand a piece of code, legibility is one of the main factors to take under control, since if code is harder to read, it could be harder to understand [1]. Code understanding requires building high-level abstractions from code statements or visualizations or models [20, 21]. However, also readable code could be difficult to be understand [7].
Code understandability can be measured considering several different factors. One possibility is based on the perceived understandability reported by developers answering comprehension questions [22, 23], or filling out blank program parts [24], or extending and/or modifying existing piece of code [25]. To be more accurate, some studies traced the time to perform the assigned task, both questions or developing ones [18, 26, 25]. Other approaches evaluate code understandability focusing on physiological metrics detected by biometrics sensors [27, 28] or eye-tracking devices [29, 30].
Moreover, considering the perceived understandability by rating the different pieces of code under analysis, can provide a positive step forward in this field [7]. Different factors can positively or negatively influence how developers perceive the understandability of a piece of code [7], that can be useful to develop a model to automatically measure the understandability.
Several studies investigated the role of software metrics focusing on complexity as well as source-level metrics, such as LOC [7] and Cyclomatic Complexity [31, 7] or Cognitive Complexity [6] during the developing process or during maintenance tasks [18]. Moreover, other types of metrics such as documentation related metrics such as comment readability and metrics relating to a developer’s experience were considered from researchers [7]. Results showed that none of the investigated metrics accurately represent code understandability [18, 7]. However, all the software metrics considered in these studies suffered of empirical validation of their ability to measure code understandability. In particular, Cognitive Complexity needs more accurate validation [6]. However, the results demonstrated that such metrics can improve the effectiveness of the code understandability under evaluation [7].
A deeper investigation of Cognitive Complexity has been performed by Munoz et al. [4] and later by Lavazza et al. [8]. Munoz et al. [4] considered as Cognitive Complexity the metric measured by SonarQube and evaluated the association with different code understandability metrics: the time taken to understand a code snippet, the percentage of correctly answered comprehension questions on a code snippet, subjective ratings of a comprehension task, and physiological measures on the subjects engaged in understanding code. Results showed that Cognitive Complexity is correlated with the time spent by a developer to understand source code. However, they did not compared the magnitude of this correlation against different complexity metrics. As Lavazza et al. [8] reported in their work “before embracing the use of Cognitive Complexity, we need to understand whether Cognitive Complexity is really correlated with understandability better than the measures that were proposed in the past for the same purpose”. To assess it, Lavazza et al. [8] conducted an empirical study extending study [4]. They correlated Cognitive and Cyclomatic complexity to identify which metric provides advantage for code understandability. Unfortunately, the achieved results are not proposing for a particular metric.
8 Conclusion
We designed and conducted a case study among 216 junior developers (bachelor and master level students). We asked them to manually inspect 12 Java classes that exhibit different code complexity levels as Cognitive and Cyclomatic Complexity measured by SonarQube. For each class, developers had to rate the code understandability.
Our finding show that Cognitive Complexity better represents the code understandability than Cyclomatic Complexity, even if its correlation with the code understandability is not high.
-
•
Cognitive Complexity better represents the code understandability than Cyclomatic Complexity, even if its correlation with the code understandability is not high.
-
•
The severity problems in the code are not correlated with the complexity (both Cyclomatic and Cognitive). We expected to find more problems in classes with higher levels of complexities, mainly because we were expecting these classes to be harder to understand. Therefore, we cannot claim that classes with a higher Cyclomatic or Cognitive complexity are affected by more severe problems than these with lower levels of complexity.
Future works will include a replication of this work with more developers asking them to suggest the refactoring action in order to fix the identified problem. Moreover, future work will include the comparison between the perceived understandability of the code of junior and senior developers, and the consideration of other programming languages such as Python and Javascript.
References
- Boehm et al. [1976] B. W. Boehm, J. R. Brown, M. Lipow, Quantitative Evaluation of Software Quality, in: 2nd International Conference on Software Engineering, ICSE ’76, IEEE Computer Society Press, 1976, pp. 592–605.
- Minelli et al. [2015] R. Minelli, A. Mocci, M. Lanza, I Know What You Did Last Summer - An Investigation of How Developers Spend Their Time, in: 23rd International Conference on Program Comprehension, pp. 25–35.
- Xia et al. [2018] X. Xia, L. Bao, D. Lo, Z. Xing, A. E. Hassan, S. Li, Measuring Program Comprehension: A Large-Scale Field Study with Professionals, IEEE Transactions on Software Engineering 44 (2018) 951–976.
- Muñoz Barón et al. [2020] M. Muñoz Barón, M. Wyrich, S. Wagner, An Empirical Validation of Cognitive Complexity as a Measure of Source Code Understandability, in: International Symposium on Empirical Software Engineering and Measurement (ESEM).
- McCabe [1976] T. J. McCabe, A Complexity Measure, IEEE Transactions on Software Engineering SE-2 (1976) 308–320.
- Campbell [2018] G. A. Campbell, Cognitive Complexity - An Overview and Evaluation, in: International Conference on Technical Debt (TechDebt’18), pp. 57–58.
- Scalabrino et al. [2019] S. Scalabrino, G. Bavota, C. Vendome, M. Linares-V?squez, D. Poshyvanyk, R. Oliveto, Automatically Assessing Code Understandability, IEEE Transactions on Software Engineering (2019) 1–1.
- Lavazza et al. [2023] L. Lavazza, A. Z. Abualkishik, G. Liu, S. Morasca, An empirical evaluation of the “Cognitive Complexity” measure as a predictor of code understandability, Journal of Systems and Software 197 (2023) 111561.
- Politowski et al. [2020] C. Politowski, F. Khomh, S. Romano, G. Scanniello, F. Petrillo, Y.-G. Guéhéneuc, A. Maiga, A large scale empirical study of the impact of Spaghetti Code and Blob anti-patterns on program comprehension, Information and Software Technology 122 (2020) 106278.
- Suleman Sarwar et al. [2013] M. M. Suleman Sarwar, S. Shahzad, I. Ahmad, Cyclomatic complexity: The nesting problem, in: Eighth International Conference on Digital Information Management (ICDIM 2013), pp. 274–279.
- SonarSource [2022] SonarSource, Metric Definitions, https://docs.sonarqube.org/latest/user-guide/metric-definitions/, accessed on July 28, 2022.
- Campbell [2022] G. A. Campbell, Cognitive Complexity, a new way of measuring understandability, https://www.sonarsource.com/docs/CognitiveComplexity.pdf, accessed on July 28, 2022.
- Runeson and Höst [2009] P. Runeson, M. Höst, Guidelines for Conducting and Reporting Case Study Research in Software Engineering, Empirical Softw. Engg. 14 (2009).
- OMG [2011] OMG, Business Process Model and Notation (BPMN), Version 2.0, 2011.
- Student [1921] Student, An Experimental Determination of the Probable Error of Dr Spearman’s Correlation Coefficients, Biometrika 13 (1921) 263.
- Cohen [1988] J. Cohen, Statistical power analysis for the behavioral sciences, Lawrence Earlbaum Associates 2 (1988).
- Nemenyi [1962] P. Nemenyi, Distribution-free multiple comparisons, in: Biometrics, volume 18, p. 263.
- Feigenspan et al. [2011] J. Feigenspan, S. Apel, J. Liebig, C. Kastner, Exploring Software Measures to Assess Program Comprehension, in: International Symposium on Empirical Software Engineering and Measurement, pp. 127–136.
- Yin [2014] R. Yin, Case Study Research: Design and Methods, 5th Edition, SAGE Publications, Inc, 5th edition, 2014.
- Storey et al. [2000] M.-A. Storey, K. Wong, H. Muller, How do program understanding tools affect how programmers understand programs?, Science of Computer Programming 36 (2000) 183–207.
- Lin and Wu [2006] J. Lin, K. Wu, A Model for Measuring Software Understandability, in: International Conference on Computer and Information Technology, pp. 192–192.
- Dolado et al. [2003] J. J. Dolado, M. Harman, M. C. Otero, L. Hu, An empirical investigation of the influence of a type of side effects on program comprehension, IEEE Transactions on Software Engineering 29 (2003) 665–670.
- Salvaneschi et al. [2014] G. Salvaneschi, S. Amann, S. Proksch, M. Mezini, An Empirical Study on Program Comprehension with Reactive Programming, in: International Symposium on Foundations of Software Engineering, pp. 564–575.
- Borstler and Paech [2016] J. Borstler, B. Paech, The Role of Method Chains and Comments in Software Readability and Comprehension—An Experiment, IEEE Transactions on Software Engineering 42 (2016) 886–898.
- Hofmeister et al. [2017] J. Hofmeister, J. Siegmund, D. V. Holt, Shorter identifier names take longer to comprehend, in: 24th International Conference on Software Analysis, Evolution and Reengineering (SANER), pp. 217–227.
- Aljunid et al. [2012] S. Aljunid, A. Zin, Z. Shukur, A Study on the Program Comprehension and Debugging Processes of Novice Programmers, Journal of Software Engineering 6 (2012) 1–9.
- Fucci et al. [2019] D. Fucci, D. Girardi, N. Novielli, L. Quaranta, F. Lanubile, A Replication Study on Code Comprehension and Expertise using Lightweight Biometric Sensors, in: 27th International Conference on Program Comprehension (ICPC), pp. 311–322.
- Yeh et al. [2017] M. K. . Yeh, D. Gopstein, Y. Yan, Y. Zhuang, Detecting and comparing brain activity in short program comprehension using EEG, in: IEEE Frontiers in Education Conference (FIE), pp. 1–5.
- Fritz et al. [2014] T. Fritz, A. Begel, S. C. Müller, S. Yigit-Elliott, M. Züger, Using Psycho-Physiological Measures to Assess Task Difficulty in Software Development, in: Int. Conference on Software Engineering, pp. 402–413.
- Turner et al. [2014] R. Turner, M. Falcone, B. Sharif, A. Lazar, An Eye-Tracking Study Assessing the Comprehension of C++ and Python Source Code, in: Symposium on Eye Tracking Research and Applications, pp. 231–234.
- Kasto and Whalley [2013] N. Kasto, J. Whalley, Measuring the Difficulty of Code Comprehension Tasks Using Software Metrics, in: Fifteenth Australasian Computing Education Conference - Volume 136, pp. 59–65.