From valence fluctuations to long-range magnetic order
in EuPd2(Si1-xGex)2 single crystals
Abstract
EuPd2Si2 is a valence-fluctuating system undergoing a temperature-induced valence crossover at K. We present the successful single-crystal growth using the Czochralski method for the substitution series EuPd2(Si1-xGex)2, with substitution levels . A careful determination of the germanium content revealed that only half of the nominal concentration is built into the crystal structure. From thermodynamic measurements it is established that is strongly suppressed for small substitution levels and antiferromagnetic order from stable divalent europium emerges for . The valence transition is accompanied by a pronounced change of the lattice parameter of order 1.8%. In the antiferromagnetically-ordered state below K, we find sizeable magnetic anisotropy with an easy plane perpendicular to the crystallographic direction. An entropy analysis revealed that no valence fluctuations are present for the magnetically-ordered materials. Combining the obtained thermodynamic and structural data, we construct a concentration-temperature phase diagram demonstrating a rather abrupt change from a valence-fluctuating to a magnetically-ordered state in EuPd2(Si1-xGex)2.
I Introduction
Within the last years, attention has been drawn towards modeling the thermodynamic behavior of materials by explicitly considering a coupling between a material’s electronic degrees of freedom and its lattice degrees of freedom. Propositions were made how to describe the entanglement between electronic thermodynamical and quantum phase transitions and the elastic responses of the crystal lattice in form of a (quantum) critical elasticity theory [1]. For example, when examining the Mott metal-insulator transition in the organic charge transfer salt -(BEDT-TTF)2CuCl, simultaneously to the electronic transition between the conducting and the insulating state, a breakdown of Hooke’s law can be observed [2], tying the behavior of the crystal lattice closely to the behavior of the electronic system. In some iron-based superconductors, a strong contraction of the direction of the crystal lattice can be observed, with strong effects on the magnetic and superconducting properties [3, 4, 5]. More systems that offer electronic transitions accompanied by strong lattice effects shall be investigated in order to function as probe systems for the theoretical framework [1].
By searching for such systems displaying closely linked electronic and lattice effects, europium-based intermetallic systems have shifted back into the focus of attention. In the 1980’s, polycrystalline samples of EuPd2Si2 served as a model system for valence fluctuations between two valence states of europium: Eu2+ and Eu3+ [6, 7] being shiftable between different states of intermediate valence by manipulating the materials using temperature [8, 9, 10, 11, 12] or external pressure [13, 14, 15, 16]. Large volume changes accompany the valence transition between the spatially larger Eu2+ and the smaller Eu3+ configuration, resulting in a shrinking of the a lattice parameter of 0.18 Å when going from the Eu(2+δ)+ to the Eu valence state [6, 17]. The precise europium valencies of EuPd2Si2 were determined by hard X-ray photoelectron spectroscopy and values of Eu2.23+ at 300 K and Eu2.75+ at 20 K were determined [18].
Together with other europium-based intermetallic systems, displaying either valence-fluctuating states or magnetically-ordered Eu2+ states, EuPd2Si2 was located in a generalized phase diagram close to the critical endpoint of the valence transition based on investigations on single-crystalline samples [19]. The Eu2+ systems and their transitions into a long-range magnetically-ordered phase can be located at the low pressure side of the phase diagram. Towards higher pressures, two different intermediate valent states, the Eu(2+δ)+ state at high temperatures, and the Eu(3-’)+ state at low temperatures, occur. They are separated by a line of first order transitions at , that ends in a critical endpoint of second order, beyond which a crossover area is entered at higher pressures. In this paper, we denote the temperature, at which this valence crossover occurs with . In a region in proximity to the critical endpoint, the changes in the electronic system of the europium valence might induce a critical elastic response in the crystal lattice. This makes EuPd2Si2 a suitable target material for probing the predictions of critical elasticity theory.
Unsubstituted EuPd2Si2 is already a promising candidate, displaying large lattice effects accompanying the change in valence [6, 20]. Earlier investigations on polycrystalline material located the system on the high pressure side of the critical endpoint in the crossover area [14]. In order to use this system as a testbed for probing anomalous behavior related to the proximity of a critical endpoint in pressure studies, negative pressure would need to be exerted to shift the system to the low pressure side. Usually, this is done by substituting one of the elements of the compound partly by a larger element, forcing the unit cell to expand. For polycrystalline samples of EuPd2Si2, such substitutions have been performed, replacing palladium with platinum [21] and gold [22], or silicon with germanium [23] and tin [24]. Recently, we have shown that a change of the Pd-Si ratio in EuPd2Si2 can also cause a shift in the valence crossover temperature [25], which explains the different values of reported in literature for this system [21, 18, 19]. In addition, it was possible to grow epitaxial thin films of EuPd2Si2 on Mg(001) substrates using molecular beam epitaxy [26]. Due to a clamping effect of the EuPd2Si2 thin film to the MgO substrate with negligible thermal expansion, the abrupt change of the lattice parameter of EuPd2Si2 is suppressed, leading to a highly strained thin film upon cooling, which do not show a valence transition anymore, but probably a magnetically-ordered ground state [26].
In this work, we will focus on the germanium-substituted system, EuPd2(Si1-xGex)2, bringing two new approaches to what is known about the system so far: First, we will shift attention towards the silicon rich, valence-fluctuating regime of the system, while previous works focused on its germanium rich, long-range antiferromagnetically-ordered regime [23]. Cho et al. [23] were able to give an estimation of a substitution level for polycrystalline samples, at which long-range magnetic order breaks down and is replaced by valence-fluctuating behavior, but no systematic characterization of this crossover region has been done. A more detailed investigation of electronic and lattice behavior is due in order to map the suppression of valence fluctuations and the occurrence of antiferromagnetism in the system. Second, we apply the Czochralski method to grow single-crystalline samples of germanium-substituted EuPd2Si2. These large crystals will allow for a proper characterization of magnetic anisotropies and elastic responses in the crystal lattice in proximity to the critical endpoint of the proposed first-order valence transition. The present study is complemented by detailed investigations of the effect of hydrostatic (He-gas) pressure on selected crystals [27].
II Experimental Details
Czochralski growth of EuPd2(Si1-xGex)2 was performed for different nominal substitution levels after a procedure established in previous work [25]. High purity materials Eu (99.99%, chunks, EvoChem), Pd (99.99%, rod, Heraeus), Si (99.9999%, pieces, Cerac) and Ge (99.9999%, pieces, Otavi Minen) with an initial stoichiometry of Eu1.45Pd2(Si1-xGex)2 and an initial mass of 15 g were used. Before performing the actual Czochralski growth process, two steps of prereaction were applied to make the materials accessible in the growth experiment. To overcome high melting temperatures of palladium (C) and silicon (C), in a first step palladium, silicon and germanium were melted together by arc melting. Since both binary compounds PdSi and PdGe melt at about C, a comparable lowering of the melting temperature can be expected in the given ternary case. In a second step, the prereacted Pd, Si and Ge are brought together with Eu (melting temperature C) in a glassy carbon inner crucible, sealed inside a niobium outer crucible, and heated to C for 1 h under an argon protective atmosphere (box furnace by Linn company).


The actual Czochralski growth is performed in a growth chamber by Arthur D. Little, the precursor is inductively heated with a Hüttinger generator. For the growth process, argon over pressure of 20 bar was applied to slow down europium evaporation from the melt. During the process, the melt levitates by virtue of an inhomogeneous magnetic field within a cold copper crucible. We used this method since previously strong reactions with any accessible crucible materials were seen. In the top part of Fig. 1, we show the liquidus temperatures as function of the nominal Ge-concentration, measured with an IRCON pyrometer during the different Czochralski growths. The area above the full red points denotes the homogeneous melt after heating. The temperature where solidification starts during cooling down, without a seed crystal, is marked as open black points. Therefore, the area between the red and black curves is the so-called Ostwald-Miers area, where crystallization without new nucleation is possible [28]. This area is shifted to lower temperatures and gets narrower with increasing , which means that the occurrence of competing grains during the growth gets more likely with increasing .
Five substitution levels with nominal concentrations of = 0.05, 0.10, 0.15, 0.20, 0.30 were prepared. As a reference for the overall characterization, results from the unsubstituted system [25] were included in the discussions. Czochralski growth experiments were performed at seeding temperatures between C and C (see Fig. 1), and the samples were pulled with rates between 0.8 mm/h and 3.3 mm/h. Growth experiments were seeded iteratively with single crystals from previously grown samples with neighboring . The initial seed for the sample stemmed from the previously grown unsubstituted EuPd2Si2 system.
The samples were characterized using a variety of probing techniques. Sample composition and germanium incorporation were determined by Energy Dispersive X-ray analysis (EDX) using a Zeiss-DSM940A Scanning Electron Microscope with an EDAX detector. Lattice parameters were quantified by temperature-dependent powder X-ray diffractometry (PXRD) utilizing a Siemens D500 diffractometer with a helium-gas cooling system capable of reaching temperatures down to 10 K and using Cu K radiation. Refinement of the X-ray powder diffractometry data was performed using GSAS II [29]. Single crystal X-ray diffraction data on representative EuPd2(Si1-xGex)2 samples from the corresponding batches were collected at 295 K on a STOE imaging plate diffraction system (IPDS-2T) using Mo radiation. For the investigated specimen all accessible reflections () were measured up to a maximum angle of . The data were corrected for Lorentz, polarization, extinction, and absorption effects. Using SHELXL [30] and JANA2006 [31], all averaged symmetry-independent reflections () were included for the refinements. For all compositions the unit cell and the space group were determined, the atoms were localized in the unit cell utilizing random phases as well as Patterson superposition methods, the structure was completed and solved using difference Fourier analysis, and finally the structure was refined. In all cases the refinements converged quite well and show excellent reliability factors (see GOF, , and in Table 2).
Sample orientation was carried out using a Laue camera with white X-ray radiation from a tungsten anode. Heat capacity, resistivity, and magnetization of the samples were measured using the standard measurement options (HC, ACT, VSM) of a 9 T Quantum Design PPMS. Some measurements of the magnetic susceptibility were performed by utilizing a commercial superconducting quantum interference device (SQUID) magnetometer (MPMS, Quantum Design). The ac-susceptibility was measured at different frequencies with the corresponding option of a MPMS3 using a driving field of 4 Oe.
| [Å] | [Å] | [K] | [K] | ||
| 0 | 0 | 4.2392(6) | 9.8674(12) | 140-160 | - |
| 0.05 | 0.034(6) | 4.2507(6) | 9.8704(20) | 105 | - |
| 0.10 | 0.058(7) | 4.2549(5) | 9.8722(15) | 87 | - |
| 0.15 | 0.089(11) | 4.2584(3) | 9.8940(11) | 54/64 | - |
| 0.20 | 0.105(8) | 4.2828(6) | 9.9047(18) | - | 47 |
| 0.30 | 0.154(9) | - | - | - | 42 |
| 1 | 1 | 4.376 | 10.072 | - | 17 |
| 0 | 0.05 | 0.10 | 0.15 | 0.20 | |
|---|---|---|---|---|---|
| 0 | 0.034(9) | 0.070(8) | 0.111(7) | 0.174(11) | |
| lattice parameters , | |||||
| (Å) | 4.2392(6) | 4.2507(6) | 4.2549(5) | 4.2584(3) | 4.2828(6) |
| (Å) | 9.8674(12) | 9.8704(20) | 9.8722(15) | 9.8940(11) | 9.9047(18) |
| (Å3) | 177.3 | 178.3 | 178.7 | 179.4 | 181.7 |
| Eu, : | |||||
| (Å2) | 0.00866(27) | 0.00906(23) | 0.00945(24) | 0.00780(25) | 0.01168(73) |
| (Å2) | 0.00961(31) | 0.00668(27) | 0.01066(27) | 0.00719(29) | 0.01093(91) |
| Pd, : | |||||
| (Å2) | 0.00985(25) | 0.01035(26) | 0.01151(24) | 0.00979(24) | 0.01497(72) |
| (Å2) | 0.00965(29) | 0.00689(30) | 0.01131(28) | 0.00722(30) | 0.01248(105) |
| (%) | 2.9(5) | 3.2(6) | 2.2(4) | 2.7(3) | 3.8(12) |
| (Si,Ge), : | |||||
| 0.37783(19) | 0.37738(9) | 0.37718(17) | 0.37697(17) | 0.37787(53) | |
| (Å2) | 0.00944(58) | 0.00997(83) | 0.01134(71) | 0.01038(64) | 0.01171(180) |
| (Å2) | 0.01229(85) | 0.01010(99) | 0.01490(86) | 0.01262(79) | 0.01151(247) |
| selected bond lengths | |||||
| Eu-(Si,Ge) (Å) | 3.2309(9) | 3.2402(10) | 3.2438(8) | 3.2479(7) | 3.2611(19) |
| Eu-Pd (Å) | 3.2524(7) | 3.2567(9) | 3.2584(7) | 3.2637(5) | 3.2737(9) |
| Pd-(Si,Ge) (Å) | 2.4665(11) | 2.4694(12) | 2.4703(10) | 2.4722(9) | 2.4883(31) |
| (Si,Ge)-(Si,Ge) (Å) | 2.4110(30) | 2.4211(31) | 2.4252(29) | 2.4341(22) | 2.4194(71) |
| Goodness of fit and R values | |||||
| GOF | 1.90 | 1.69 | 1.55 | 1.72 | 2.32 |
| (%) | 4.15 | 3.91 | 3.53 | 3.85 | 7.29 |
| (%) | 1.72 | 1.40 | 1.45 | 1.63 | 3.57 |
III Results and Discussion
III.1 Crystal growth and germanium incorporation
The resulting crystals for each crystal growth experiment look similar to the one shown at the bottom of Fig. 1. In this figure, S marks the seeding crystal, which for the nominal growth stemmed from unsubstituted EuPd2Si2. A denotes the area, in which the target phase could usually be found without or with a minor amount of inclusions of a secondary phase. The mass of part A is between 3 g and 5 g. Here, facets were regularly found to ease the first orientation of the sample. B marks the area in which an Eu-rich secondary phase occurred more regularly, stemming from the Eu excess in the original melt. Therefore, the growth direction in Fig. 1 is from right to left. The germanium concentration in the crystal was determined using the EDX method. The results of this analysis concerning the germanium distribution are shown in Table 1 for the different nominal stoichiometries. The germanium incorporation rate is between 50% and 70%, being higher for lower germanium concentration in the melt. This value was determined by performing between 30 and 60 single-point EDX analyses over the whole length of section A of the respective crystal, and then determining statistical mean and standard deviation assuming a Gauss distribution. We note that the germanium content determined by single-crystal XRD, , is higher for the nominal 0.15 and 0.20 batches (see Table 2). Nevertheless, we will use the EDX content as -value when discussing the physical characterization measurements, as the measured samples were characterized by EDX.
For small , the germanium concentration is constant over the whole length of the crystal. For , also in the A region of the crystal two coexisting phases were observed, one being the target phase, and another quaternary phase with a
higher europium content and a silicon/germanium ratio of about 3:1. The amount of this secondary phase varies along the growth direction for the different growth batches and is clearly visible as a secondary phase coexisting with the target phase in the electron microscope images as well as through additional peaks in the PXRD data. For the physical measurements the crystals were chosen such, that the contribution from the additional phase is as small as possible. However, for the growth, this phase gets rather dominant and it was not possible to extract a phase-pure crystal with the EuPd2(Si1-xGex)2 target phase.
III.2 Magnetic susceptibility data
In Fig. 2, we present the data of the magnetic susceptibility as a function of temperature for all different germanium concentrations investigated. A drastic change in the overall temperature dependence is observed between the samples with (light blue) and (light red). As we will later show in detail, the ground state of the two crystals is markedly different, although their Ge-concentration varies by only . In order to locate the temperature of the valence crossover from the magnetic susceptibility data for , the maximum of the quantity dd was used. This quantity is proportional to the magnetic contribution to the heat capacity, and for the valence-fluctuating systems, its maximum corresponds to the inflection point of the magnetic susceptibility, see also Ref. [27] for details. For the antiferromagnetic (AFM) samples (red data), the Néel temperature was identified with the position of the sharp kink in , below which distinct magnetic anisotropy develops. Table 1 gives an overview over the characteristic temperatures (valence crossover and magnetic transition) extracted from the susceptibility data.

All samples with also show a second anomaly at 17 K, most clearly visible for . Since the prominence of this anomaly is strongly sample dependent, this hints towards a secondary phase that is included in the sample. As discussed above, we have observed a quaternary compound in EDX as secondary phase for the higher Ge concentrations. For this phase gets dominant in the B section of the grown crystal (see Fig. 1) and we were able to extract this unknown phase for a susceptibility measurement (not shown). This revealed the characteristics of a typical antiferromagnetically-ordered Eu2+ system, with K and a Curie-Weiss behavior above 50 K with an effective moment of 7.9 per europium. Therefore, we can attribute the second anomaly in the susceptibility data of Fig. 2 at 17 K (dashed arrow with a star) to this additional phase.

Comparative studies of the magnetic susceptibility for two different directions of the magnetic field ( and ) are presented in Fig. 3. The difference between the samples with and becomes again very apparent. Samples with show pronounced magnetic anisotropy below the transition temperature, with the magnetic easy plane perpendicular to the crystallographic axis. This, along with other characteristics discussed below, identifies them clearly as antiferromagnets with a Néel temperature of 47 K and 42 K for and , respectively. Samples with on the other hand do not show significant magnetic anisotropy below the transition. In addition, the small anisotropy at high temperatures is reversed for the two cases: Whereas the magnetically-ordered systems show an easy-plane anisotropy, the valence-fluctuating crystals are characterized by an almost isotropic magnetic response with a slightly lower out-of-plane susceptibility. In the inset of Fig. 3, we present the field dependence of the susceptibility for in-plane magnetic fields up to 9 T. The strong decrease below is observed for fields below 1 T. Only the hump around 17 K, due to the magnetic secondary phase discussed earlier, is affecting this. For 9 T, the magnetic-ordering temperature is slightly suppressed down to 45 K, which is in agreement with AFM order. Below , the temperature dependence is strongly affected by the higher magnetic field and a pronounced increase is apparent at 9 T. For the other field direction, , the field dependence of the susceptibility is considerably weaker (not shown). Also this behavior is in agreement with AFM ordering of Eu2+ moments with the magnetic easy plane perpendicular to the direction. For the crystals with , we do not observe a pronounced field dependence of the susceptibility and no comparable anisotropy below for fields up to 9 T.
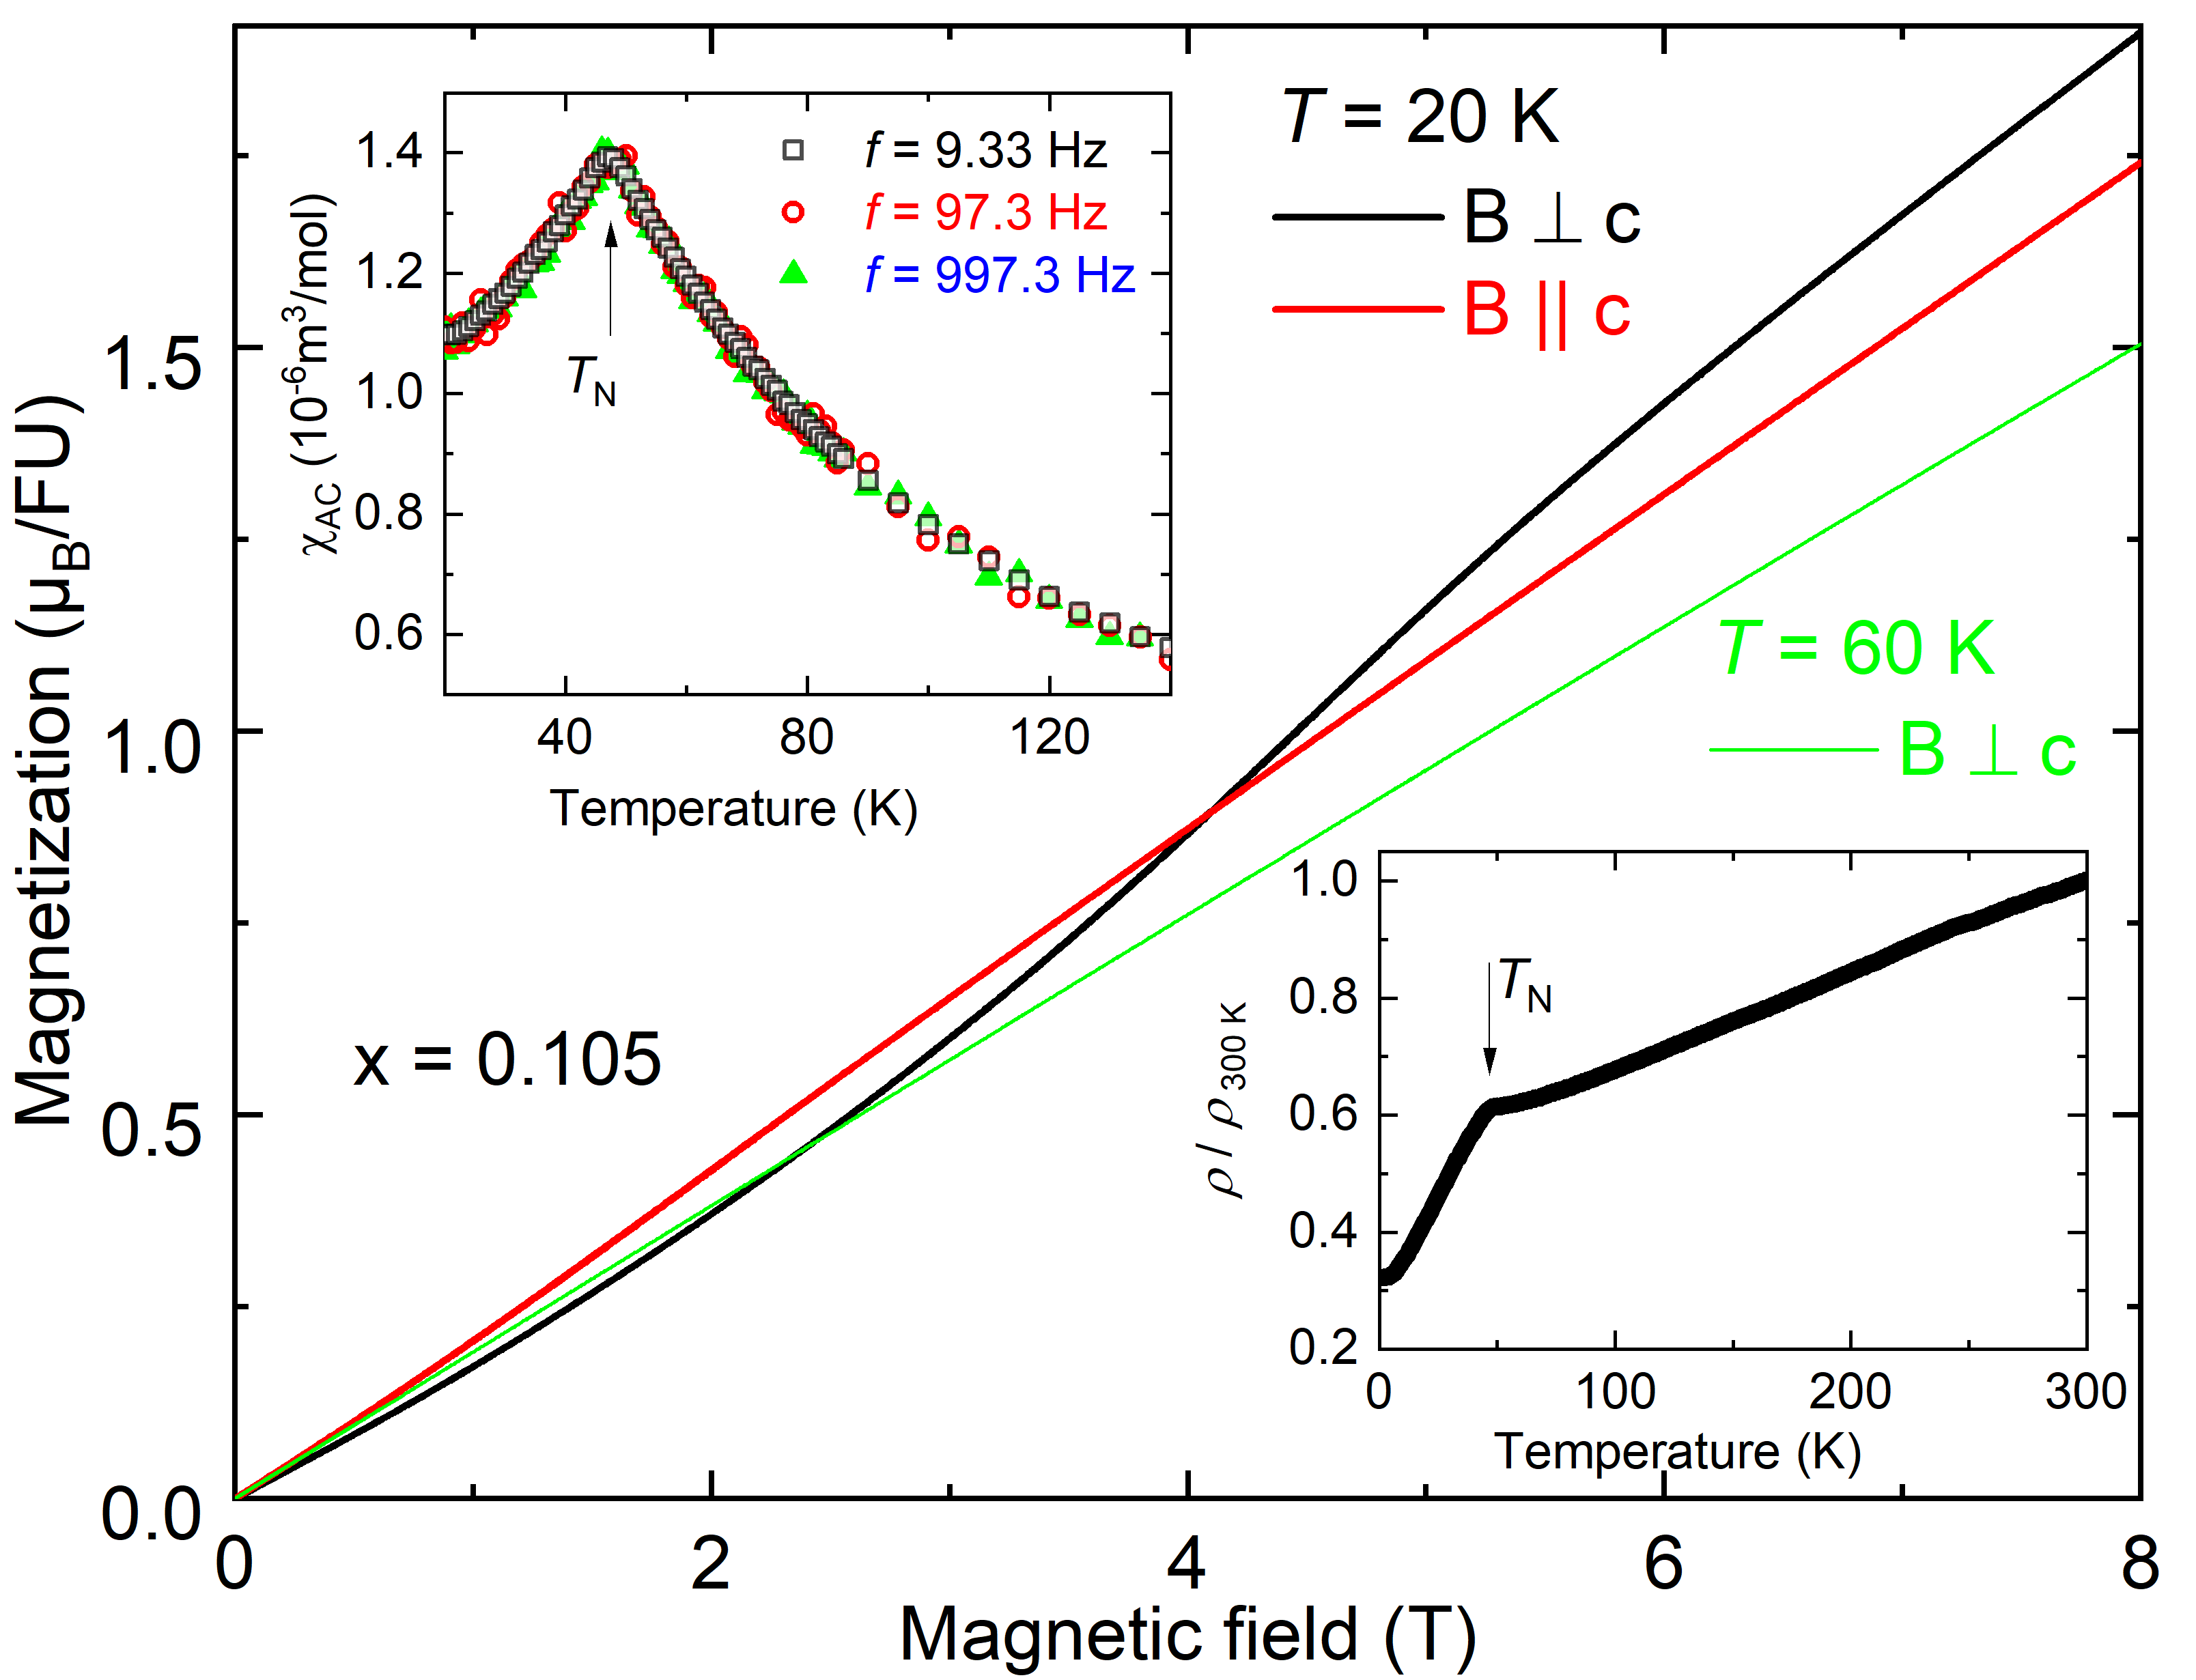
To further characterize the AFM ordered phase in the sample, we present magnetization measurements at 20 K in the main part of Fig. 4. There, a weak metamagnetic transition around 4.5 T is observed for a magnetic field perpendicular to , whereas the curve for field along is a straight line. Above at 60 K, the curve with the in-plane field is again linear in , as expected for a paramagnetic system. This overall behavior is in agreement with the above discussed susceptibility data, which classifies this material as an easy-plane antiferromagnet below . In addition, we show ac-susceptibility data with a small driving field of 4 Oe perpendicular to in the upper left inset of Fig. 4. The motivation behind was to exclude signatures of spin-glass behavior in this material, which might occur due to the statistical substitution of Ge on the Si site. However, we do not observe any frequency dependence in the range of from Hz, excluding spin-glass behavior below . Accordingly, we do not observe any differences in the susceptibility in field-cooled versus zero-field-curve measurement protocols.
Finally, we present resistivity measurements (with current ) for the sample in the lower right inset of Fig. 4. The temperature dependence above is linear in with a pronounced drop at . This is a typical behavior for an Eu-based system with localized moments undergoing magnetic order, as e.g. EuGe2Si2 [19] or EuRh2Si2 [33]. However, this temperature dependence is in contrast to the behavior of a system with a valence crossover, which usually results in a broad upturn above the crossover temperature as observed in EuPd2Si2 [19, 25]. Therefore, also the resistivity data is in agreement with the proposed scenario, that the sample is an ordered AFM system without any signatures of a valence crossover.

III.3 Heat-capacity measurements
Further evidence for the different nature of the observed phase transitions comes from heat-capacity measurements between 2 and 200 K shown in Fig. 5. The shape of the heat-capacity anomalies differs strongly between the samples with (blue, symmetrical) and (red, mean-field type), showing the difference between valence-fluctuating and AFM samples. The double-peak anomaly in the sample is probably due to a small phase separation between two areas with slightly different substitution level. Within the accuracy of our EDX measurements this separation could not be resolved, so it is of the order of the error bar of the EDX measurements given in Table 1. A slight shoulder of similar origin is probably seen for the data. At 17 K, we observe a small hump in the heat-capacity data for the samples with , which is more pronounced for the sample. Also here, we observe varying significance from sample to sample and relate this to the magnetic impurity phase, similar to what was observed in the susceptibility data. Having in mind the generally established phase diagram of Eu-based valence-fluctuating systems under pressure [19], we carefully measured large heating pulses ( K) covering the transition at or , following the procedure described in Ref. [34], but none of the samples showed latent heat, i.e. indications of a first-order valence transition, which is in agreement with the overall shape of the anomalies.

To analyze the anomalies of the heat-capacity data for the two different ground states in more detail, the phonon background was determined using an analytic Debye-model function [35]. We found that using a single Debye temperature did not lead to satisfactory agreement to the measured data, therefore, we allowed for two different Debye temperatures, which led to a significant improvement of the overall fit quality. The resulting Debye fits are shown in Fig. 6 for the two concentrations and . For the former concentration, we found Debye temperatures of K and K, for the latter the high-temperature Debye fit yields K and K. The contribution from the conduction electrons (apart from ) to the heat capacity was estimated from the respective contribution to the heat capacity in LaPd2Si2, where a Sommerfeld coefficient of mJ/molK2 was reported [36]. Subtracting the phonon and this conduction-electron contribution from the measured data
allows us to extract the contribution of electrons to the heat capacity, shown as open symbols in Fig. 6. It becomes evident, that besides the very different shape of the anomaly at and , the contribution is also very different below the characteristic temperatures, resulting from magnonic excitations for the magnetically-ordered compound with . This contribution is absent for the valence-fluctuating material, without long-range magnetic order. This can be even directly seen in Fig. 5, at e.g. 30 K, where the heat capacity is much smaller for all valence-fluctuating samples (blue curves) in comparison to the magnetically-ordered samples (red curves). Integrating the heat capacity divided by temperature gives the
contribution of the electrons to the entropy, which is shown as red line in Fig. 6. For we find an entropy contribution close to which corresponds to the expected entropy contribution of a localized magnetic Eu2+ () moment. In contrast, the contribution of the electrons to the entropy found for amounts to only , which accounts for the valence-crossover behavior, i.e., a dynamical admixture of non-magnetic Eu3+ () states. For the data of the sample, we were able to describe the heat-capacity data using a molecular-field theory for Heisenberg antiferromagnets, developed in Ref. [37]. There, the only free parameter to model the heat capacity for a system, which orders antiferromagnetially with local moments, is the ordering temperature . Using the value K for the sample, we obtain a theoretical curve, which reproduces the magnetic heat capacity very well (green dashed line in Fig. 6b). In particular the shoulder at around , which is due to the large Zeeman degeneracy of the ground state and frequently observed in magnetically-ordered systems with a electronic configuration (Eu2+ or Gd3+), is well described.

III.4 Lattice effects
Temperature dependent PXRD data were collected on powdered crystals between 10 K and 300 K for the different Ge concentrations with . The lattice parameters and were refined using the established tetragonal unit cell of the ThCr2Si2 structure type (I4/mmm) for . In Fig. 7, the temperature-dependent datasets were shown for a) and b) . In the datasets of samples with , reflections connected to the direction of the crystal (most prominently visible for the (112) and (200) reflections) undergo a large shift around the respective characteristic temperature of the valence crossover - so the crystal contracts significantly within the tetragonal plane. For samples with , no such pronounced shift can be observed. In the dataset shown in Fig. 7b, the reflections connected to the direction remain roughly at the same angle down to 10 K. However, for the (112) peak, we observe that a sizeable portion of the reflection is shifting out below 50 K. This suggests, that due to slightly different germanium inclusion levels, some parts of this specific sample is valence fluctuating, leading to a shift of the (112) reflection, whereas the resuming part of this sample shows no strong shift below 40 K. This observation underlines that for germanium incorporation, the system is at the brink of the occurrence of long-range magnetic order. The results of the temperature-dependent PXRD data are summarized in Fig. 8, where the lattice parameter from PXRD is shown as a function of temperature. The data for (blue data in Fig. 8) all reveal a pronounced anomaly, i.e., a shrinkage of the lattice parameter upon cooling by about 1.8%, which agrees well with previous thermal expansion measurements [38]. The inflection point of the parameter anomaly coincides well with the inflection point of the magnetic susceptibility (see Fig. 2) and the maximum of the heat-capacity data (see Fig. 5), tying the lattice anomaly closely to the electronic transition. For the sample, we show the lattice parameters below 50 K for both parts of the sample in Fig. 8. The open stars reflect the part of the sample which undergoes a valence transition and the closed stars present the reflections which remain at a constant value. In contrast, overall no strong change is observed for the lattice parameter within the experimental resolution (not shown), similar to what was observed for [6, 25].
A more thorough structural characterization was done on single-crystalline samples at 295 K (Table 2). We observe a pronounced increase of the volume of the unit cell with as shown in the inset of Fig. 8. The increase is not perfectly linear, but seem to be larger for small and significantly stronger towards the point with largest . A similar trend with was observed for the Eu-Pd bond length, shown as red stars in the inset of Fig. 8 and the Eu-Si(Ge) bond length (not shown in Fig. 8, but given in Table 2). This structural evolution is strongly connected to the observed magnetic ground state in this series. The large increase of the unit-cell volume with increasing of order 2.5 %, leads to a rapid stabilization of the divalent Eu-configuration. In recent ab-initio density functional theory (DFT) calculations it was shown that the change of the electronic structure of EuPd2Si2 is intimately related to changes of the Eu-Pd and Eu-Si bond lengths [39]. For the antiferromagnetically-ordered system we observe Eu-Pd and Eu-Si(Ge) bond distances of 3.2737(9) Å and 3.2611(19) Å, respectively. In comparison to the structural data of other EuT2(Si,Ge)2 systems [39], this would correspond to a divalent ground state of europium. In addition, the temperature evolution of the lattice parameters for are in agreement with the lattice parameters calculated by DFT for the different valence states. When going from Eu2.23+ at high temperatures to Eu2.75+ at low temperatures [18], DFT predicts for EuPd2Si2 a relative change of the lattice parameters of about 2.5%, whereas the change for is significantly smaller and amounts to only 0.26% [39], which is in good agreement with the observed structural data.

IV Phase diagram
Bringing all the findings together allows for drawing a concentration-temperature phase diagram for the EuPd2(Si1-xGex)2 system with which is shown in Fig. 9. For low substitution levels (blue area), the valence crossover of EuPd2Si2 is maintained, but strongly suppressed down to K. In this region, the thermodynamic signatures of the valence crossover are strongly tied to a pronounced decrease of the in-plane lattice parameter (crosses in Fig. 9). For higher substitution levels (red area), the ground state of the system changed to long-range AFM order below K. From these findings it is evident that the critical concentration , where valence fluctuations are suppressed and AFM order sets in, is slightly below . For the next lower concentration level we clearly observe the valence crossover as function of temperature. Therefore, the critical concentration is somewhere in between and we determined it from the presented data as .

Ge-substitution of EuPd2Si2 can be seen mainly as chemically induced negative pressure, since Si and Ge are isoelectronically and the volume of the room-temperature unit cell for EuPd2Ge2 is about 9% larger compared to EuPd2Si2 (see Table 1). Assuming a bulk modulus for EuPd2Ge2 of the order of GPa [32] we can estimate the pressure to reach the volume of EuPd2Si2 when pressurizing EuPd2Ge2, using GPa. Therefore, the substitution level at which valence-fluctuating behavior changes into long-range magnetic order would correspond to a negative pressure scale applied to EuPd2Si2 of about 0.7 GPa. The proposition derived from the general pressure-temperature phase diagram of Eu-based materials [19], that Eu2+ systems undergoes a first-order valence transition under pressure followed by a critical endpoint at finite temperatures, is not precisely seen in the substitution series studied here. For none of the samples the valence transition showed the characteristics of a first-order phase transition. Instead, the valence transition remains a rather broad crossover, until it is replaced by the sharp AFM phase transition for increasing . This is in contrast to the observations made, e.g., in the series EuNi2(Si1-xGe [40] or Eu(Rh1-xIrSi2 [41], where clear indications of first-order valence transitions were observed.
On the other hand, there exist several Eu-based systems showing a different type of general phase diagram without a first-order valence transition. One example is the series EuCu2(Ge1-xSi, where the occurrence of the valence crossover is observed in direct proximity to the AFM phase at around [42, 43]. In addition, resistivity measurements under pressure on EuCu2Ge2 indicate that the AFM transition suddenly drops to zero at a critical pressure of 6.2 GPa and the authors suggest the existence of a quantum critical point of the valence transition from a nearly divalent state to that with trivalent weight [44]. This is corroborated by an increased effective mass and a linear-in- resistivity around the critical pressure [44]. The measurements presented here suggest that the EuPd2(Si1-xGex)2 series might follow a similar scenario, as we do observe a similar abrupt change from an AFM transition towards the valence-crossover regime. Measurements under He-gas pressure, which will be presented elsewhere [27], study this region in more detail and reveal that a critical endpoint at finite temperatures emerges directly out of the antiferromagnetically-ordered state. Further measurements are needed to evaluate this exciting interplay between fluctuating charge-, spin-, and lattice degrees of freedom at around in this series.
V Summary
In conclusion, we have presented the successful single-crystal growth by using the Czochralski technique for a series of EuPd2(Si1-xGex)2 samples with . The germanium concentration incorporated into the crystals was found to be significantly smaller compared to the initial concentration from which the crystal growth was started. We found that the valence crossover, established in EuPd2Si2 at K, can be strongly suppressed with increasing Ge-concentrations down to temperatures of about 60 K. Remarkably, the character of the valence transition remains crossover-like for all measured samples. At the critical concentration the system changes its magnetic ground state abruptly from valence fluctuating to long-range antiferromagnetically ordered. We observe a sizeable magnetic anisotropy in the ordered state with an easy magnetic plane perpendicular to the tetragonal direction. For the samples with very close to the critical concentration, the magnetic entropy involved in the magnetic transition is close to , supporting that in these samples valence fluctuations are practically non-existent. This is reflected also in the temperature-dependence of the lattice parameters for the magnetically-ordered samples, which do not show an additional contraction due to valence fluctuations. In contrast, all valence fluctuating samples show a large continuous change of the the lattice parameter with temperature of order 1.8% when going through the valence transition. This corroborates the strong coupling between electronic and lattice degrees of freedom in this series and the crystals with are well suited to study their interplay under pressure.
Acknowledgments
We thank K.-D. Luther, T. Förster and F. Ritter for their valuable technical support. Discussions with Dominik Hezel and Christoph Geibel are highly appreciated. We acknowledge funding by the Deutsche Forschungsgemeinschaft (DFG, German Research Foundation) via the TRR 288 (422213477, projects A01, A03, and B03).
References
- [1] M. Zacharias, I. Paul, and M. Garst, Quantum Critical Elasticity, Phys. Rev. Lett. 115, 025703 (2015).
- [2] E. Gati, M. Garst, R. S. Manna, U. Tutsch, B. Wolf, L. Bartosch, H. Schubert, T. Sasaki, J. A. Schlueter, and M. Lang, Breakdown of Hooke’s law of elasticity at the Mott critical endpoint in an organic conductor, Sci. Adv. 2, e1601646 (2016).
- [3] A. Kreyssig, M. A. Green, Y. Lee, G. D. Samolyuk, P. Zajdel, J. W. Lynn, S. L. Bud’ko, M. S. Torikachvili, N. Ni, S. Nandi, J. B. Leao, S. J. Poulton, D. N. Argyriou, B. N. Harmon, R. J. McQueeney, P. C. Canfield, and A. I. Goldman, Pressure-induced volume-collapsed tetragonal phase of CaFe2As2 as seen via neutron scattering, Phys. Rev. B 78, 184517 (2008).
- [4] J. H. Soh, G. S. Tucker, D. K. Pratt, D. L. Abernathy, M. B. Stone, S. Ran, S. L. Bud’ko, P. C. Canfield, A. Kreyssig, R. J. McQueeney, and A. I. Goldman, Inelastic neutron scattering study of a nonmagnetic collapsed tetragonal phase in nonsuperconducting CaFe2As2: Evidence of the impact of spin fluctuations on superconductivity in the iron-arsenide compounds, Phys. Rev. Lett. 111, 227002 (2013).
- [5] R. L. Stillwell, X. Wang, L. Wang, D. J. Campbell, J. Paglione, S. T. Weir, Y. K. Vohra, and J. R. Jeffries, Observation of two collapsed phases in CaRbFe4As4, Phys. Rev. B 100, 045152 (2019).
- [6] E. V. Sampathkumaran, R. Vijayaraghavan, K. V. Gopalakrishnan, R. G. Pillay, and H. G. Devare, L. C. Gupta, B. Post, R. D. Parks, A new and unique Eu-based mixed valence system, EuPd2Si2, Valence Fluctuations in Solids, eds. L. M. Falicov, W. Hanke, M. B. Maple (Amsterdam, North-Holland) p. 193 (1981).
- [7] E. V. Sampathkumaran, L. C. Gupta, R. Vijayaraghavan, K. V. Gopalakrishnan, R. G. Pillay, and H. G. Devare, A new and unique Eu-based mixed valence system: EuPd2Si2, J. Phys. C: Solid State Phys. 14, L237 (1981).
- [8] E. Kemly, M. Croft, V. Murgai, L. Gupta, C. Godart, R.D. Parks, C.U. Segre, Mössbauer effects and LIII absorption measurements on EuPd2Si2, J. Magn. Magn. Mat. 49, 325 (1985).
- [9] G. Wortmann, K. H. Frank, E.V. Sampathkumaran, B. Perscheid, G. Schmiester, G. Kaindl, Combined Mø"ssbauer and LIII-edge X-ray absorption study of mixed- valent EuPd2Si2 and EuNi2P2, J. Magn. Magn. Mat. 47-48, 403 (1985).
- [10] M. M. Abd-Elmeguid, Ch. Sauer, W. Zinn, On the problem of the valence determination of Eu in mixed-valence compounds EuCu2Si2 and EuPd2Si2, J. Phys. C: Solid State Phys. 18, 345 (1985).
- [11] E. Holland-Moritz, E. Braun, B. Roden, B. Perscheid, E. V. Sampathkumaran, and W. Langel, Neutron scattering, magnetization, and Mössbauer measurements on EuPd2Si2 with enriched 153Eu isotopes, Phys. Rev. B 35, 3122 (1987).
- [12] K. Mimura, Y. Taguchi, S. Fukuda, A. Mitsuda, J. Sakurai, K. Ichikawa, and O. Aita, Bulk-sensitive high-resolution photoemission study of a temperature-induced valence transition system EuPd2Si2, J. Electron Spectrosc. Relat. Phenom. 137-140, 529 (2004).
- [13] V. Vijayakumar, S.N. Vaidya, E.V. Sampathkumaran, L.C. Gupta, R. Vijayaraghavan, Effect of pressure on the electrical resistivity and the thermoelectric power of EuPd2Si2, Phys. Lett. A 83, 469 (1981).
- [14] B. Batlogg, A. Jayaraman, V. Murgai, L. Gupta, R. D. Parks, and M. Croft, Pressure-temperature studies and the - diagram of EuPd2Si2, in: P. Wachter and H. Boppart (eds.), Valence instabilities, North-Holland publishing company (1982).
- [15] R. Srinivasan, S. Usha, E. V. Sampathkumaran, and R. Vijayaraghavan, , Effect of pressure on the electrical resistivity and the thermoelectric power of EuPd2Si2, J. Phys. F: Met. Phys. 14, L33 (1984).
- [16] D. M. Adams, A. E. Heath, H. Jhans, and A. Norman, The effect of high pressure upon the valence transition in EuPd2Si2, J. Phys.: Cond. Mat. 3, 5465 (1991).
- [17] H. Jhans, M. Croft, E. Kemly, B. Grier, C. U. Segre, X-ray diffraction and Mössbauer effect measurements near a valence transition, in: L. C. Gupta and S. K. Malik (eds), Theoretical and Experimental Aspects of Valence Fluctuations and Heavy Fermions. Springer, Boston, MA (1987).
- [18] K. Mimura, T. Uozumi, T. Ishizu, S. Motonami, H. Sato, Y. Utsumi, S. Ueda, A. Mitsuda, K. Shimada, Y. Taguchi, Y. Yamashita, H. Yoshikawa, H. Namatame, M. Taniguchi, and K. Kobayashi, Temperature-induced valence transition of EuPd2Si2 studied by hard X-ray photoelectron spectroscopy, Jpn. J. Appl. Phys. 50, 05FD03 (2011).
- [19] Y. Onuki, A. Nakamura, F. Honda, D. Aoki, T. Tekeuchi, M. Nakashima, Y. Amako, H. Harima, K. Matsubayashi, Y. Uwatoko, S. Kayama, T. Kagayama, K. Shimizu, S. Esakki Muthu, D. Braithwaite, B. Salce, H. Shiba, T. Yara, Y. Ashitomi, H. Akamine, K. Tomori, M. Hedo, and T. Nakama, Divalent, trivalent, and heavy fermion states in Eu compounds, Philos. Mag. Lett. 97, 3399 (2017).
- [20] M. Ye, M. J. von Westarp, S.-M. Souliou, M. Peters, R. Möller, K. Kliemt, M. Merz, R. Heid, C. Krellner, and M. Le Tacon, Strong electron-phonon coupling and enhanced phonon Grüneisen parameters in valence-fluctuating metal EuPd2Si2, Phys. Rev. B 107, 195111 (2023).
- [21] H. Wada, H. Gomi, A. Mitsuda, and M. Shiga, Specific heat anomaly due to valence transition in Eu(Pd1-xPtx)2Si2, Solid State Commun. 117, 703 (2001).
- [22] C. U. Segre, M. Croft, J. A. Hodges, V. Murgai, L. C. Gupta, and R. D. Parks, Valence instability in Eu(Pd1-xAux)2Si2. The Global Phase Diagram, Phys. Rev. Lett. 49, 1947 (1982).
- [23] B. K. Cho, J. S. Rhyee, and H. C. Ri, Antiferromagnetic order and valence fluctuations in EuPd2(Ge1-xSix)2, J. Phys. Soc. Jpn. 71, 252 (2002).
- [24] S. N. Mishra and H. G. Devare, Valence transition and magnetic ordering in Sn doped EuPd2Si2, Hyperfine Interactions 16, 633 (1983).
- [25] K. Kliemt, M. Peters, I. Reiser, M. Ocker, D.-M. Tran, E. Cho, F. Ritter, D. Hezel, M. Merz, C. Krellner, Influence of the Pd-Si ratio on the valence transition in EuPd2Si2 single crystals, Cryst. Growth Des. 22, 5399 (2022).
- [26] S. Kölsch, A. Schuck, M. Huth, O. Fedchenko, D. Vasilyev, S. Chernov, O. Tkach, H.-J. Elmers, G. Schönhense, C. Schlüter, T. R. F. Peixoto, A. Gloskowski, and C. Krellner, Clamping effect on temperature-induced valence transition in epitaxial EuPd2Si2 thin films grown on MgO(001), Phys. Rev. Materials 6, 115003 (2022).
- [27] B. Wolf, T. Lundbeck, J. Zimmermann, M. Peters, K. Kliemt, C. Krellner, and M. Lang, Pressure study on the interplay between magnetic order and valence-change crossover in EuPd2(Si1-xGex)2, arXiv:2303.07767 (2023).
- [28] D. Elwell and H. J. Scheel, Crystal growth from high-temperature solutions, Academic Press (1975).
- [29] B. H. Toby and R. B. Von Dreele, GSAS-II: the genesis of a modern open-source all purpose crystallography software package, J. Appl. Cryst. 46, 544 (2013).
- [30] G. M. Sheldrick, A short history of SHELX, Acta Crystallogr., Sect. A: Found. Crystallogr. 64, 112 (2008).
- [31] V. Petricek, M. Dusek, and L. Palatinus, Crystallographic Computing System JANA2006: General features, Z. Kristallogr., Cryst. Mater. 229, 345 (2014).
- [32] Y. Onuki, M. Hedo, and F. Honda, Unique electronic states of Eu-based compounds, J. Phys. Soc. Jpn. 89, 102001 (2020).
- [33] S. Seiro and C. Geibel, Complex and strongly anisotropic magnetism in the pure spin system EuRh2Si2 , J. Phys.: Condens. Matter 26, 046002 (2014).
- [34] J. C. Lashley, M. F. Hundley, A. Migliori, J. L. Sarrao, P. G. Pagliuso, T. W. Darling, M. Jaime, J. C. Cooley, W. L. Hults, L. Morales, D. J. Thoma, J. L. Smith, J. Boerio-Goates, B. F. Woodfield, R. A. Fisher, and N. E. Phillips, Critical examination of heat capacity measurements made on a Quantum Design physical property measurement system, Cryogenics 43, 369 (2003).
- [35] W. W. Anderson, An analytic expression approximating the Debye heat capacity function, AIP Advances 9, 075108 (2019).
- [36] M. J. Besnus, A. Braghta, and A. Meyer, Kondo behaviour in magnetic (Ce-La)Pd2Si2, Z. Phys. B Cond. Mat. 83, 207 (1991).
- [37] D. C. Johnston, Unified molecular field theory for collinear and noncollinear Heisenberg antiferromagnets, Phys. Rev. B 91, 064427 (2015).
- [38] B. Wolf, F. Spathelf, J. Zimmermann, T. Lundbeck, M. Peters, K. Kliemt, C. Krellner, and M. Lang, From magnetic order to valence-change crossover in EuPd2(Si1-xGex)2 using He-gas pressure, SciPost 202207-00023v2 (2022).
- [39] Y.-J. Song, S. Schulz, K. Kliemt, C. Krellner, and R. Valenti, Microscopic analysis of the valence transition in tetragonal EuPd2Si2, Phys. Rev. B 107, 075149 (2023).
- [40] H. Wada, A. Nakamura, A. Mitsuda, M. Shiga, T. Tanaka, H. Mitamura, and T. Gotox, Temperature- and field-induced valence transitions of EuNi2(Si1-xGex)2, J. Phys.: Condens. Matter 9, 7913 (1997).
- [41] S. Seiro and C. Geibel, From stable divalent to valence-fluctuating behaviour in Eu(Rh1-xIrx)2Si2 single crystals, J. Phys.: Condens. Matter 23, 375601 (2011).
- [42] S. Fukuda, Y. Nakanuma, J. Sakurai, A. Mitsuda, Y. Isikawa, F. Ishikawa, T. Goto, and T. Yamamoto, Application of Doniach Diagram on Valence Transition in EuCu2(SixGe1-x)2, J. Phys. Soc. Jpn. 72, 3189 (2003).
- [43] Z. Hossain, C. Geibel, N. Senthilkumaran, M. Deppe, M. Baenitz, F. Schiller, and S. L. Molodtsov, Antiferromagnetism, valence fluctuation, and heavy-fermion behavior in EuCu2(Ge1-xSix)2, Phys. Rev. B 69, 014422 (2004).
- [44] J. Gouchi, K. Miyake, W. Iha, M. Hedo, T. Nakama, Y. Onuki, and Y. Uwatoko, Quantum criticality of valence transition for the unique electronic state of antiferromagnetic compound EuCu2Ge2, J. Phys. Soc. Jpn. 89, 053703 (2020).