increases with effective redshift in CDM cosmology
Abstract
Hubble constant and weighted amplitude of matter fluctuations determinations are biased to higher and lower values, respectively, in the late Universe with respect to early Universe values inferred by the Planck collaboration within flat CDM cosmology. If these anomalies are physical, i.e. not due to systematics, they naively suggest that decreases and increases with effective redshift. Here, subjecting matter density today to a prior, corresponding to a combination of Planck CMB and BAO data, we perform a consistency test of the Planck-CDM cosmology and show that determinations from constraints increase with effective redshift. Due to the redshift evolution, a tension in the parameter with Planck at lower redshifts remarkably becomes consistent with Planck within at high redshifts. This provides corroborating support for an discrepancy that is physical in origin. We further confirm that the flat CDM model is preferred over a theoretically ad hoc model with a jump in at a given redshift. In the absence of the CMB+BAO prior, we find that tensions with Planck in low redshift data are ameliorated by shifts in the parameters in high redshift data. Results here and elsewhere suggest that the CDM cosmological parameters are redshift dependent. Fitting parameters that evolve with redshift is a recognisable hallmark of model breakdown.
keywords:
cosmological parameters, large-scale structure of Universe1 Introduction
Modern cosmology is a pursuit where one theoretically guesses a function (or model) and compares it to another a priori unknown function, the Hubble parameter , extracted observationally from Nature. Given the possibilities, the guess is invariably wrong, but existing cosmological data can mask disagreement until precision improves. Viewed historically, concordance Lambda cold dark matter (CDM) cosmology emerged when a spatially flat, homogeneous & isotropic Universe, filled exclusively with radiation and (pressure-less) matter, required a dark energy sector to explain observations Riess et al. (1998); Perlmutter et al. (1999). Further improvements in data in recent years have unveiled anomalies in the Hubble constant Aghanim et al. (2020); Riess et al. (2022); Freedman (2021); Pesce et al. (2020); Blakeslee et al. (2021); Kourkchi et al. (2020), the weighted amplitude of matter fluctuations Aghanim et al. (2020); Heymans et al. (2013); Joudaki et al. (2017); Troxel et al. (2018); Hikage et al. (2019); Asgari et al. (2021); Abbott et al. (2022), the lensing parameter and/or curvature Aghanim et al. (2020); Addison et al. (2016); Handley (2021); Di Valentino et al. (2019), the late-time integrated Sachs-Wolfe (ISW) effect Granett et al. (2008); Kovács et al. (2017, 2019); Kovács et al. (2022), and high redshift galaxies that seemingly defy CDM expectations Adams et al. (2022); Labbé et al. (2023); Castellano et al. (2022); Naidu et al. (2022). See Di Valentino et al. (2021); Perivolaropoulos & Skara (2022); Abdalla et al. (2022) for reviews of CDM anomalies. It is plausible that the (flat) CDM cosmological model is breaking down. What remains is to confirm this diagnosis.
To that end, a simple insight comes directly to us from the Friedmann equations; is by construction an integration constant. In other words, it is theoretically a constant within the Friedmann-Lemaître-Robertson-Walker (FLRW) framework on which CDM is established by assuming spatial flatness. Nevertheless, it is observationally a constant only when one has the correct cosmological model Krishnan et al. (2021); Krishnan & Mondol (2022). This statement is true not only for , but also for other model parameters that are integration constants, such as matter density parameter (today) ( being the matter energy density today) in the CDM model. Thus, if the CDM model is breaking down, as all cosmological models must at some precision for the reason outlined above, one expects , , etc, to evolve with effective redshift. There are now numerous observations suggesting that evolves, more accurately decreases with effective redshift Wong et al. (2020); Millon et al. (2020); Krishnan et al. (2020); Dainotti et al. (2021); Dainotti et al. (2022); Ó Colgáin et al. (2022); Ó Colgáin et al. (2022); Malekjani et al. (2023) (see also Hu & Wang (2022); Jia et al. (2023)). Likewise there are claims of increasing with effective redshift Ó Colgáin et al. (2022); Ó Colgáin et al. (2022); Malekjani et al. (2023) (see also Risaliti & Lusso (2019); Lusso et al. (2020); Yang et al. (2020); Khadka & Ratra (2020, 2021, 2022); Pourojaghi et al. (2022); Pastén & Cárdenas (2023)). Furthermore, it has been noted in Ó Colgáin et al. (2022); Ó Colgáin et al. (2022); Malekjani et al. (2023) that evolution of and within CDM are anti-correlated with each other. Note that if evolves with effective redshift, it is unlikely that is a constant, because conspiring to balance evolution in represents a contrived or unnatural scenario.
Here we focus on the discrepancy Aghanim et al. (2020); Heymans et al. (2013); Joudaki et al. (2017); Troxel et al. (2018); Hikage et al. (2019); Asgari et al. (2021); Abbott et al. (2022). Taken at face value, this anomaly says that as inferred by the Planck collaboration (high redshift inference) has a larger value than galaxy surveys (low redshift measurement). This can be independently verified with growth rate data, in particular measurements of , which are independent of galaxy bias. Concretely, we will assume expressions that are valid for CDM cosmology and fit constraints in a single bin of increasing effective redshift. However, since growth rate data suffers from large fractional errors, we will leverage a working assumption in modern cosmology that is tightly constrained to elucidate the trend. This means that the increases observed in are driven by increases in . Interestingly, this effect is also evident when one compares constraints from number counts of galaxy clusters identified through the Sunyaev-Zeldovich effect at low redshifts with constraints from Lyman- spectra at high redshifts Esposito et al. (2022). Moreover, CMB lensing, an observable most sensitive to redshift ranges and peaking in sensitivity at , recovers the Planck result Qu et al. (2023); Madhavacheril et al. (2023). This seemingly constrains any “ tension” to the late Universe Marques et al. (2023) 111Intriguingly, higher redshift observables may prefer lower values of relative to Planck Miyatake et al. (2022); Alonso et al. (2023). is poorly constrained at high redshifts.. Admittedly, may not be a constant Ó Colgáin et al. (2022); Ó Colgáin et al. (2022), but this is currently a fringe viewpoint. While or tension in growth rate data is well studied in the literature Macaulay et al. (2013); Battye et al. (2015); Nesseris et al. (2017); Kazantzidis & Perivolaropoulos (2018); Skara & Perivolaropoulos (2020); Quelle & Maroto (2020); Li et al. (2021); Benisty (2021); Nunes & Vagnozzi (2021), our goal in this letter is to explore redshift evolution of within CDM in the late Universe under standard assumptions.
2 Warm Up
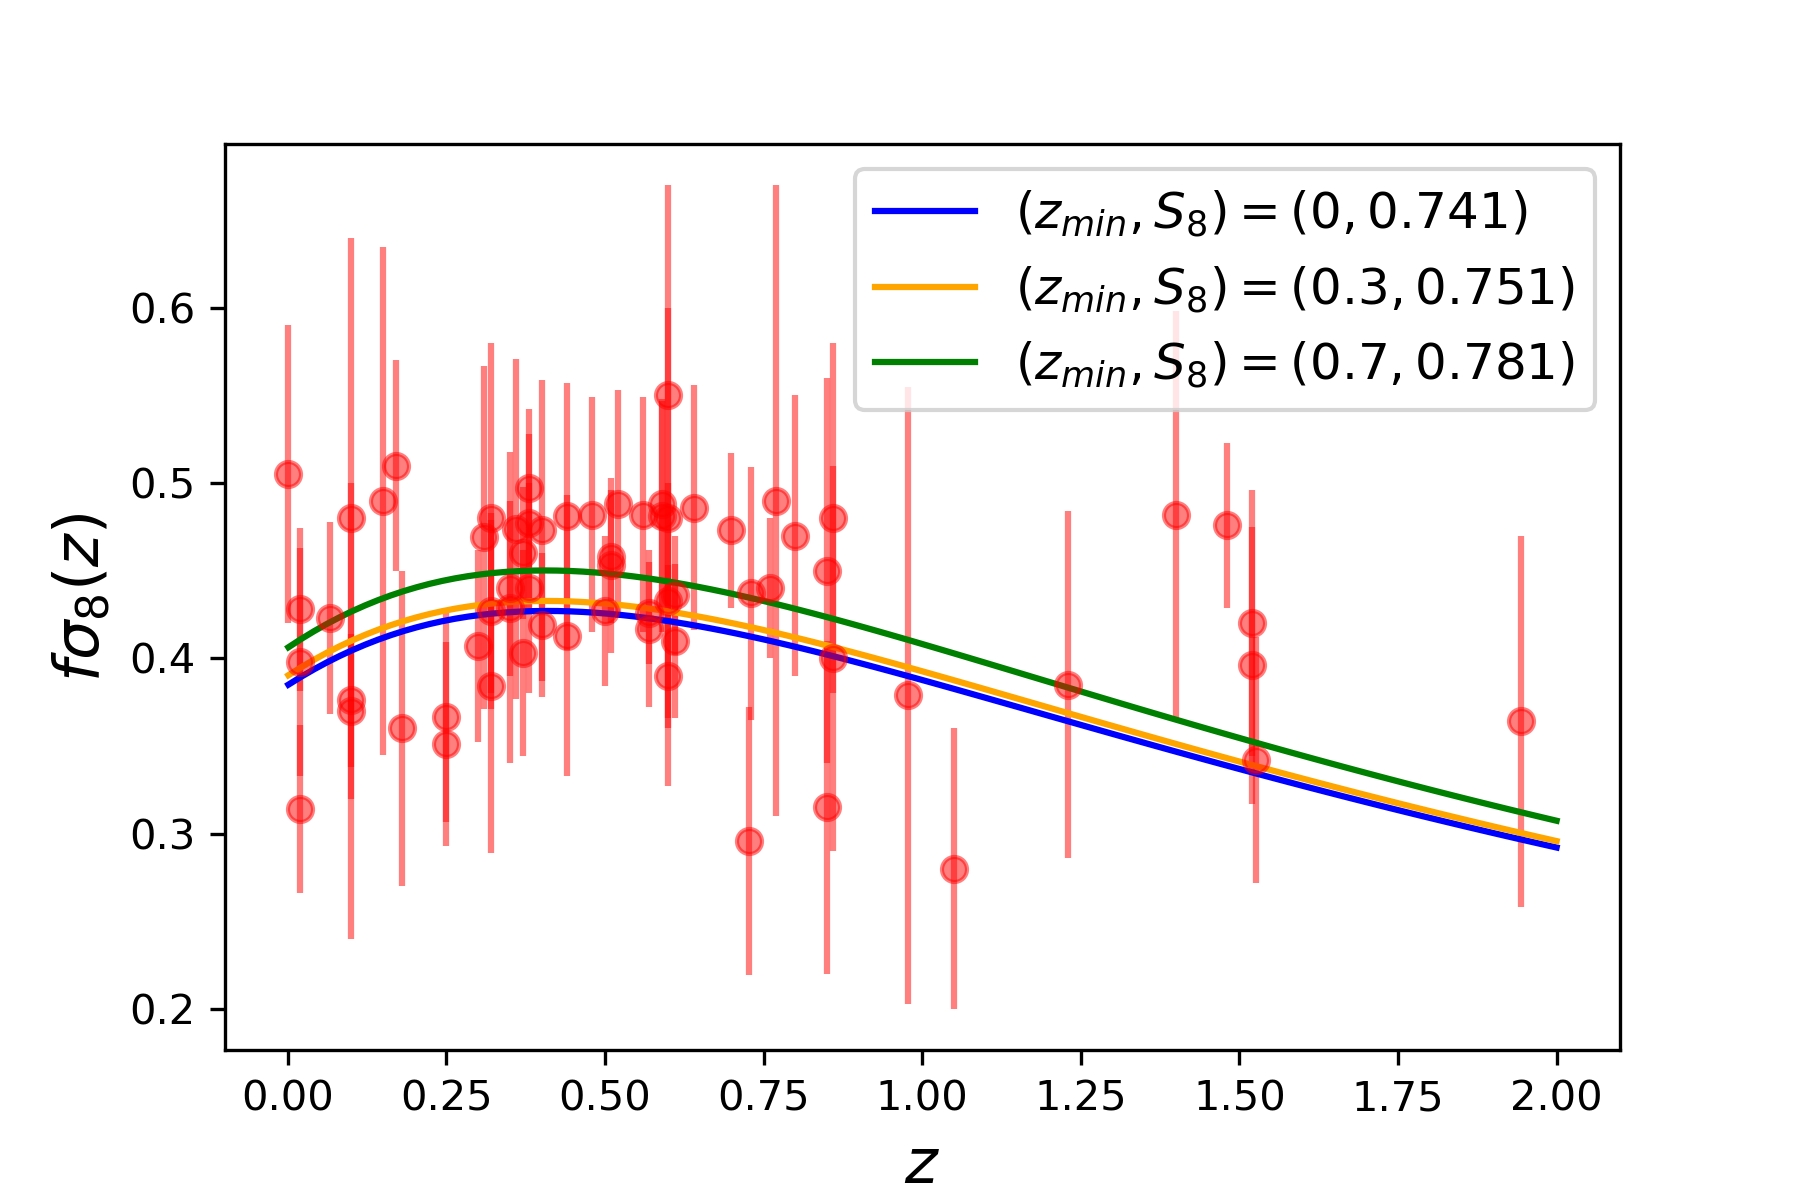
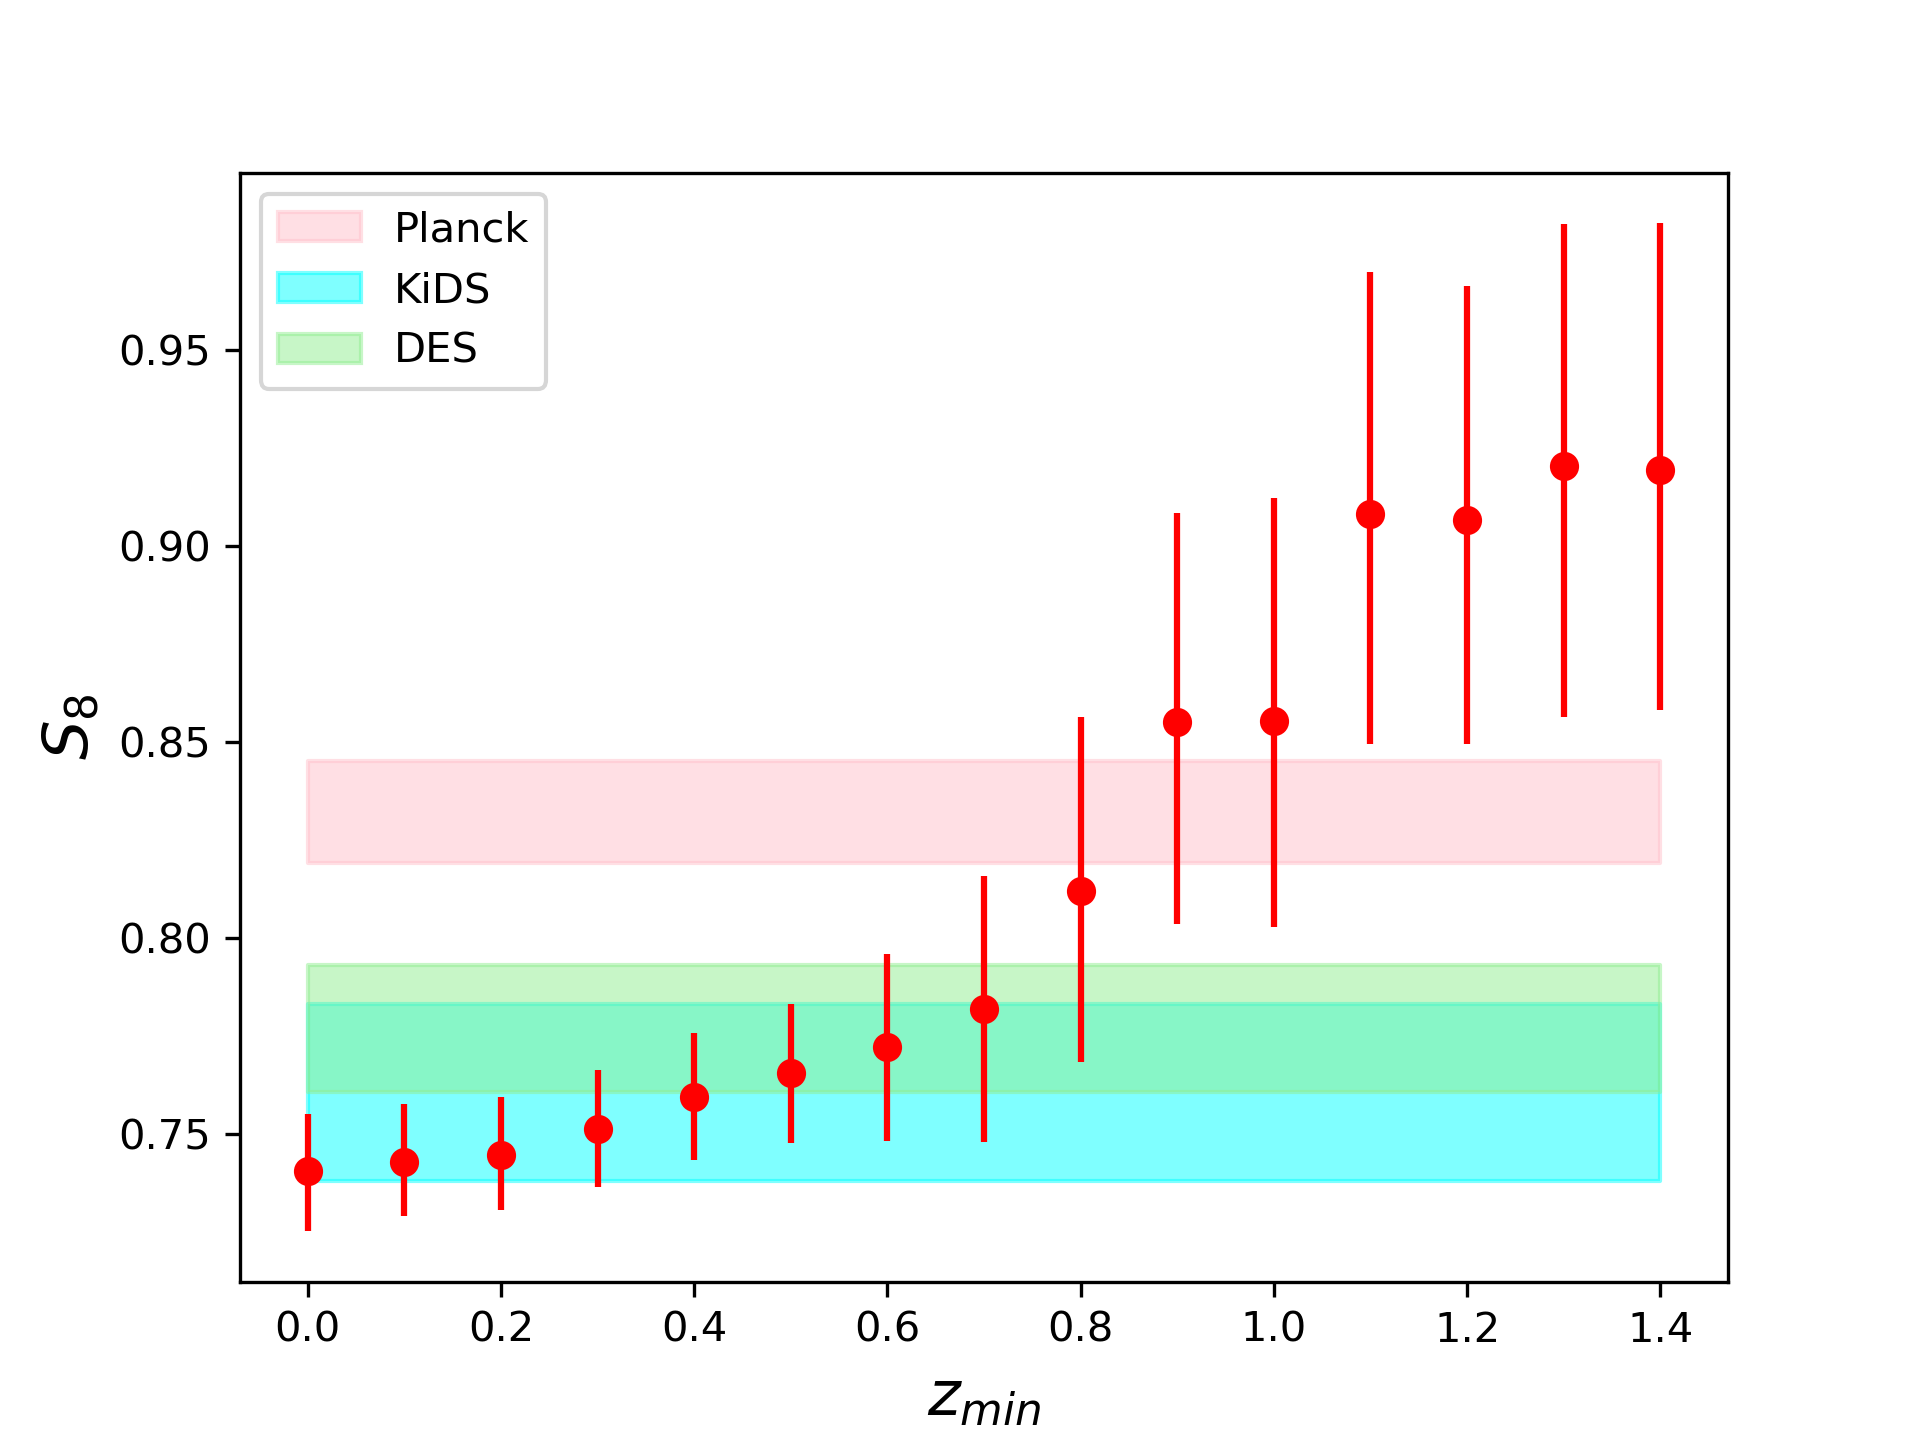
To get oriented, we impose a Gaussian prior, , which arises from combining Cosmic Microwave Background (CMB), galaxy, quasar and Lyman- baryon acoustic oscillation (BAO) constraints Aghanim et al. (2020); Alam et al. (2017); Hou et al. (2020); Neveux et al. (2020). In line with standard practice, we assume there is no discrepancy between CMB and BAO on inferences, i. e. that the key success of the CDM model is not undermined. The CMB+BAO prior is needed to compensate for the relatively low quality of the growth rate data, which will be further reduced by the removal of low redshift data. Compared to Planck Aghanim et al. (2020), our constraint is marginally more constraining, but remains representative of a Planck prior. In the absence of Gaussian priors, we employ uninformative uniform priors and throughout. We combine this prior with 20 measurements of from peculiar velocity and redshift-space distortion (RSD) data Said et al. (2020); Beutler et al. (2012); Huterer et al. (2017); Boruah et al. (2020); Turner et al. (2022); Blake et al. (2011, 2013); Howlett et al. (2015); Okumura et al. (2016); Pezzotta et al. (2017); Alam et al. (2021), as compiled recently in Nguyen et al. (2023). Modulo the removal of low redshift data, we follow the methodology of Nguyen et al. (2023). We illustrate the constraints in Fig. 1 in red. We will be interested in the combination
| (1) |
where the constant is the amplitude of matter fluctuations in spheres of Mpc with . Following Wang & Steinhardt (1998), we introduce the matter density parameter,
| (2) |
thereby allowing us to obtain
| (3) |
As explained in Wang & Steinhardt (1998), these expressions are a valid approximation for CDM. Concretely, we checked that the fractional error between the approximation and the exact expression for based on the hypergeometric function (see Nesseris et al. (2017)) is greatest at at . In the range , the fractional error is less than . This uncertainty is negligible compared to the observational uncertainties in Fig. 1. Working with an approximation may seem obsolete, but it allows us to shed light on evolution that is hidden in the analysis of Nguyen et al. (2023) 222In Nguyen et al. (2023) it is assumed that there is no evolution in cosmological parameters across the constraints., where the same approximation and data are employed. For all redshifts , the function is bounded . In particular, as , so that dependence drops out as an overall factor in (3) at high redshifts, but some knowledge of is retained through the integral. Thus, one expects to be poorly constrained at higher redshifts. As we show in the appendix, one risks encountering a degeneracy between the fitting parameters that is difficult to cleanly break with exclusively high redshift binned data. Mathematically, one is guaranteed to run into a problem constraining in high redshift bins, so it is prudent to impose an prior. Later we will relax the prior and comment on the changes.
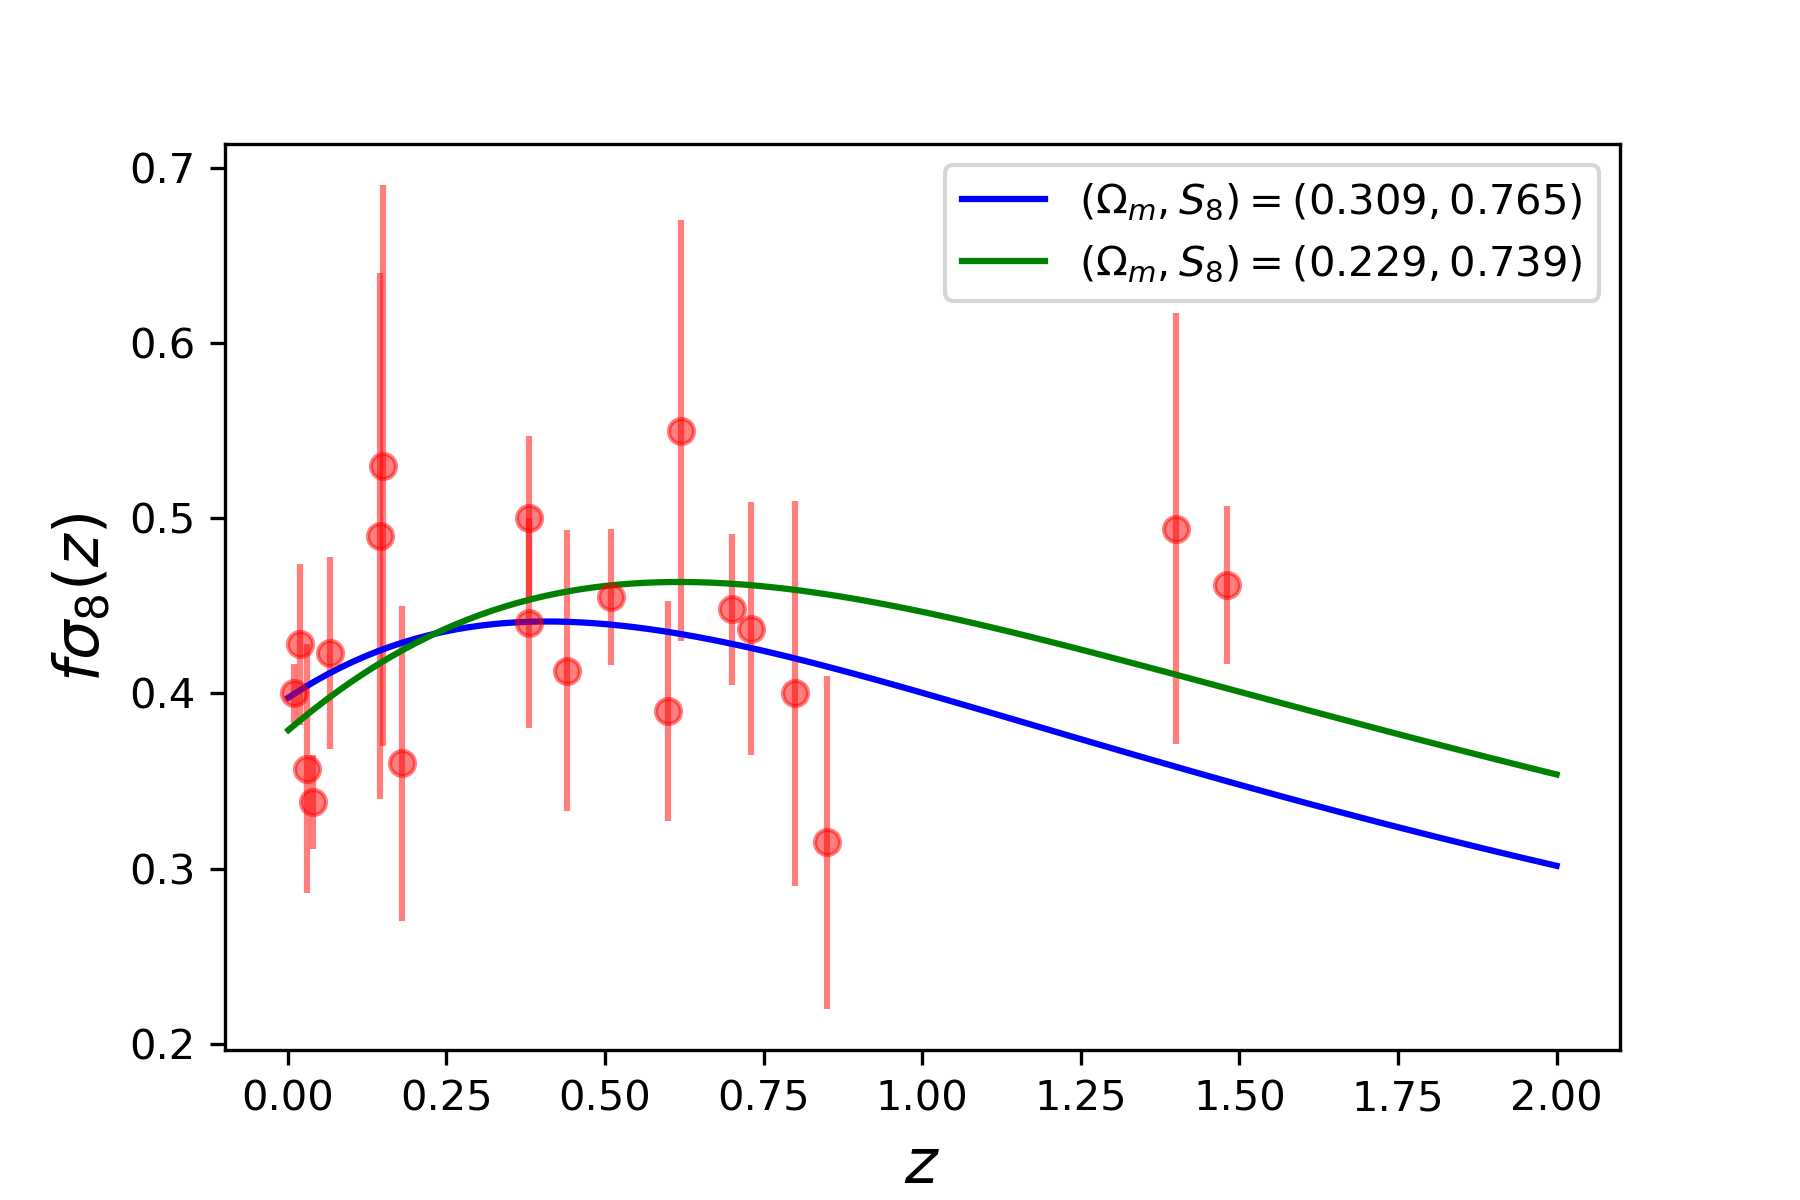
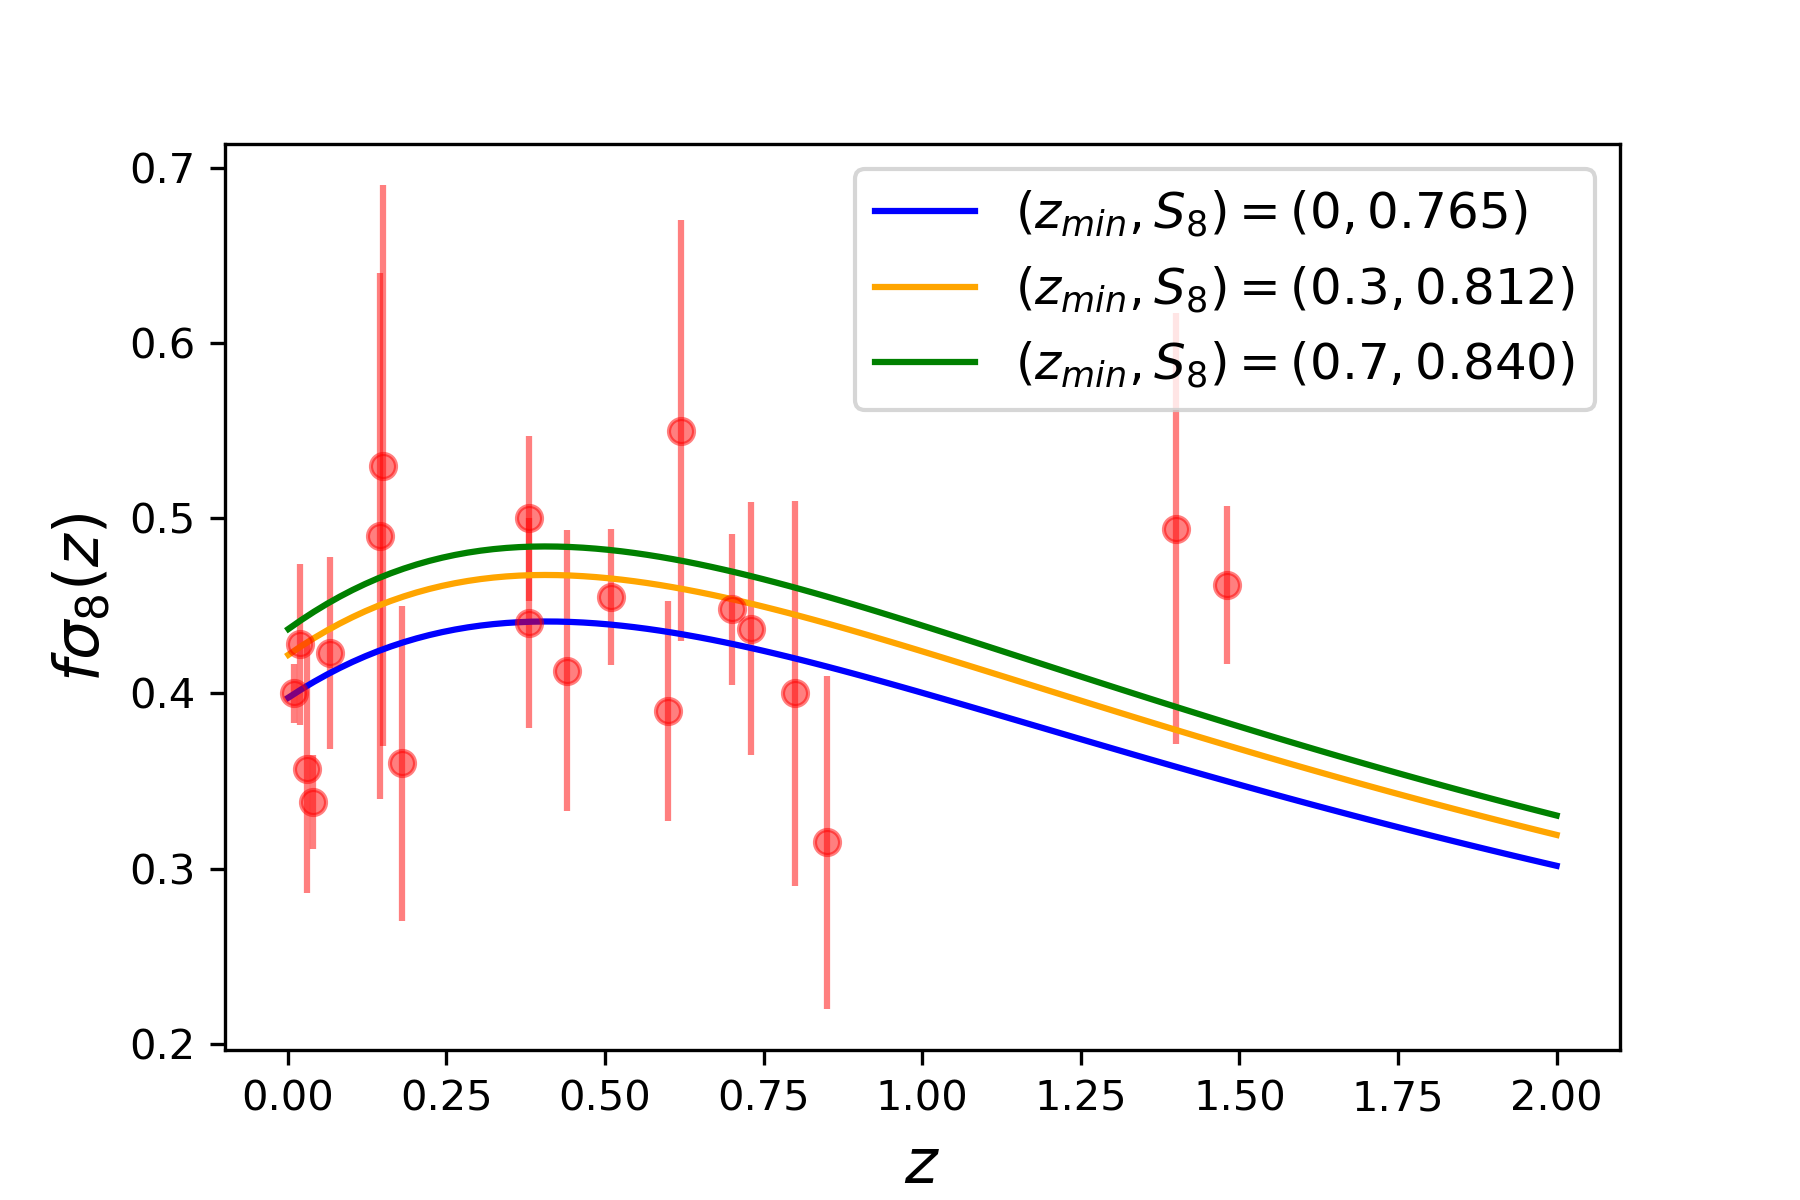
The green curve in Fig. 1 denotes the best fit of the CDM model to the 20 data points, whereas the blue curve documents the effect of introducing the Gaussian prior on . It is worth noting that this increases the inference and visibly worsens the fit to the constraints at and , thereby underscoring the tension between the prior and the lower value of preferred by data. The blue curve worsens the fit to data by . The constraints are weak while the Gaussian prior is strong. Therefore, the prior effectively fixes , so that the only parameter being fitted is . As is clear from (3), one is simply fitting the scale of the function, whereas the functional form is fixed. In Fig. 2 we see the effect of removing constraints below . We see that with constrained through the prior, increases leading to larger values of . As increases, the curves visibly provide a better fit to high redshift constraints. This increase in is driven by the two high redshift data points and is expected, since it is visible in the raw data, i. e. no data analysis is required. Note, the eBOSS data point at is re-analysed in Brieden et al. (2022) with different methodology and the central point evolves little. There is nothing to suggest this data point is not robust.
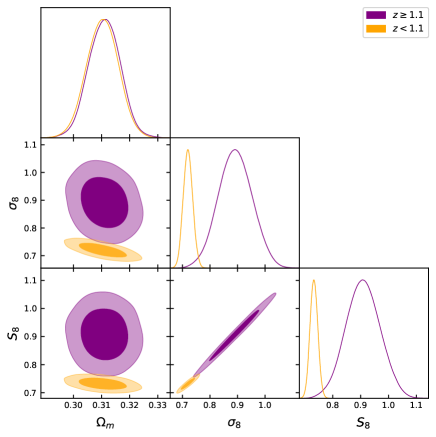
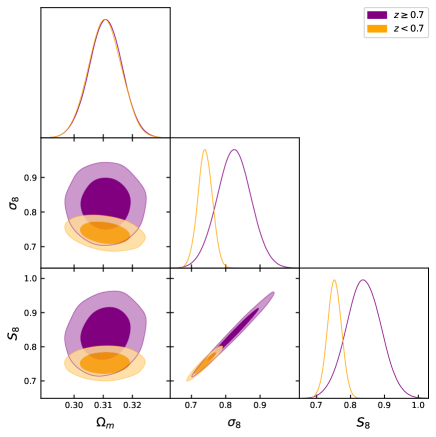
We next split the data at into a low redshift sample of 14 data points and a high redshift sample of 6 data points. This choice is arbitrary, but it is guided by Fig. 1 and the intuition that evolution in is expected once we see evolution in Wong et al. (2020); Millon et al. (2020); Krishnan et al. (2020); Dainotti et al. (2021); Dainotti et al. (2022); Ó Colgáin et al. (2022); Ó Colgáin et al. (2022); Malekjani et al. (2023) and Ó Colgáin et al. (2022); Ó Colgáin et al. (2022); Malekjani et al. (2023) elsewhere. We impose the Gaussian prior on to each sample and perform a Markov Chain Monte Carlo (MCMC) analysis. The result is shown in Fig. 3, where in line with expectations from Fig. 2, the contours separate in the or direction. The contours are Gaussian, allowing us to directly compare to and conclude that the discrepancy in is . Furthermore, the former value is discrepant with the Planck value Aghanim et al. (2020) at . Throughout, we quote confidence intervals. Note that the shift occurs within the 20 data point sample, which simply assumes that BAO and CMB can consistently constrain . Observe also that the effect of the shift is to remove a tension with Planck in the parameter.
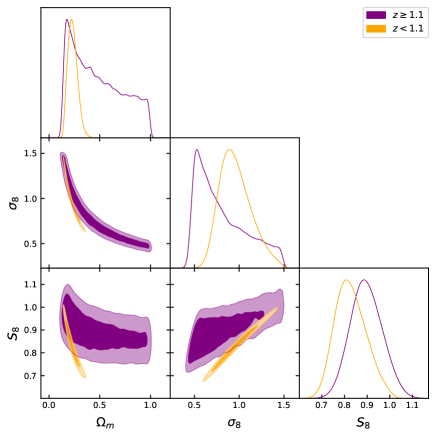
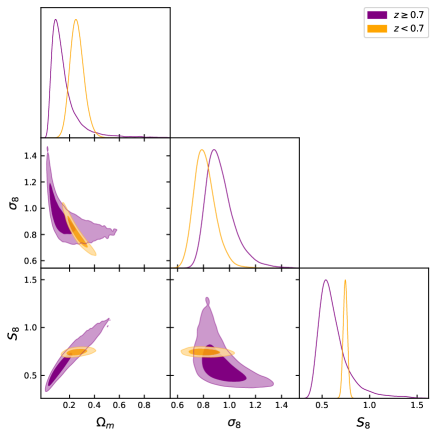
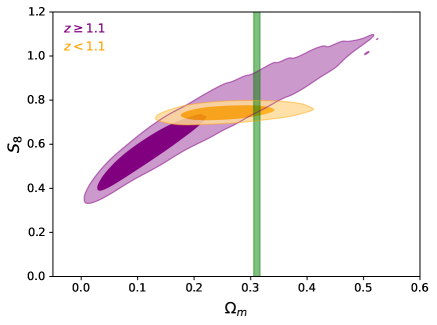
In Fig. 4, we investigate the effect of removing the prior. The low redshift sample leads to values consistent within with Planck, , however is discrepant at . We emphasise that we sample , but reconstruct as a derived parameter from the MCMC chains. The higher redshift contours are shifted away from their Planck values by more than throughout, , but remain consistent within . It is clear that lower values of are driven by lower than expected values of in both low and high redshift subsamples. Note that caution is required when interpreting these shifts in the absence of an informative prior, as the high redshift sample is small with only 6 data points. In Fig. 5, we demonstrate the consistency between the prior and the confidence intervals from low and high redshift samples in the -plane. The intersection of the prior confidence interval explains the preference for the higher value from the high redshift subsample. Since all constraints are within , no objection to combining the constraints is foreseen. While removing the prior makes a considerable difference, it is nevertheless true that we see less tension with Planck in the high redshift sample following shifts in cosmological parameters.
As an aside, with an prior, we note that the CDM model is still preferred over any theoretically poorly motivated model with a jump in at . The reduction in the minimum of the , is not enough to overcome the penalty of introducing two additional parameters, an additional and a redshift for the jump , even in the Akaike Information Criterion (AIC). Our observation here is essentially a microcosm of the CDM tensions debate; despite seeing symptoms of a problem, here evolution in when constraints are combined with CMB+BAO, it is a separate matter to produce a model that outperforms CDM.
Given the relatively small size of the data set considered in this work, in the appendix we work with a larger data set of historical data. The shortcomings of this data set are explicitly discussed, but we arrive at similar conclusions.
3 Conclusions
Either from the Friedmann equations directly, or the continuity equation and the assumption of pressure-less matter, both and arise mathematically as integration constants. Thus, consistency demands that both and are observationally constants. An important corollary is that CMB, BAO, Type Ia supernovae, etc, must provide consistent constraints in CDM cosmology. Similarly, the fitting parameter must be a constant, as it is related to the normalisation of the matter power spectrum. Here, working within the assumption that CMB and BAO consistently constrain , we have shown that the parameter increases with effective redshift in the late Universe, . This evolution is compelling because it corroborates the tendency of cosmic shear to give lower values of than Planck-CDM Aghanim et al. (2020); Heymans et al. (2013); Joudaki et al. (2017); Troxel et al. (2018); Hikage et al. (2019); Asgari et al. (2021); Abbott et al. (2022). Moreover, it is not an isolated observation; we note that i) constraints from low redshift clusters are biased lower than high redshift Lyman- spectra Esposito et al. (2022) and ii) weak lensing constraints, sensitive to lower redshifts, are biased lower than CMB lensing results Qu et al. (2023); Madhavacheril et al. (2023); Marques et al. (2023) that are sensitive to higher redshifts. In Esposito et al. (2022); Qu et al. (2023); Madhavacheril et al. (2023); Marques et al. (2023), systematics are a greater concern as one is comparing different observables, but here we are working with common constraints throughout, so systematics should be under greater control. The data largely comprises RSD but peculiar velocity constraints may be present at , e. g. Boruah et al. (2020); Said et al. (2020). However, these differences aside, we agree on the increasing trend, a trend that is evident from the raw data.
It is instructive to recall the assumptions being made:
-
1.
Equation (3) is a valid approximation for CDM behaviour.
-
2.
in CDM is approximately .
-
3.
Data sets and/or priors from independent data sets can be combined.
-
4.
The data are correct.
If this set of assumptions is correct, then the increasing trend follows. Assumption i) is standard Wang & Steinhardt (1998) and the theoretical uncertainty introduced is less than , more accurately in the redshift range . Assumption ii) is a widely recognised observation. Assumption iii) is standard practice. Assumption iv) is the weakest, but the removal of data points requires justification. In other words, removing data points with the sole motivation of recovering a null result is unscientific.
Concretely, we presented analysis in a sample of 20 and 66 (see appendix for the latter) constraints respectively. In both samples we find the same increasing trend, which is essentially a trend, because is subject to a strong prior. Since there is considerable survey overlap in Fig. 8, the tension between low and high redshift is admittedly overestimated at (Fig. 8). That being said, if the 20 data points in Fig. 1 are independent (Ref. Nguyen et al. (2023) assumes they are), then there is a shift in that warrants further study, especially since it seems to ameliorate tension with Planck. One could identify other redshift ranges where the discrepancy between low and high redshift inferences is less, but such an exercise is meaningless. To stress test any sample against evolution, one needs to focus on splits that exacerbate the feature. Moreover, Fig. 7 clearly demonstrates that evolution is present throughout the sample. Despite the presence of evolution, we find that the CDM model is still preferred over any theoretically ad hoc model with a jump in . Finally, when removing the prior, despite noticeable differences in cosmological parameters, we find that high redshift data is more consistent with Planck.
Forthcoming releases from the Dark Energy Spectroscopic Instrument (DESI) DESI Collaboration et al. (2016) will be in a position to confirm or refute our assumption iv). Thus, our result is preliminary. Our findings also provide a targeted prediction for tomographic studies of cosmic shear Hikage et al. (2019); Asgari et al. (2021); Abbott et al. (2022). These surveys, i. e. HSC, KiDS and DES, currently employ redshift bins with varying effective redshifts across the surveys and shifts in cosmological parameters up to are evident. Given our results here, it is plausible that redshift evolution will be detected as cosmic shear data quality improves through a better understanding of systematics. If redshift evolution is not detected, and assuming tension is physical, then there must be evolution with scale Marques et al. (2023). Finally, our results caution theoretically that physics that alters the radius of the sound horizon Knox & Millea (2020) cannot account for these expected hallmarks of model breakdown.
Acknowledgements
We thank Dragan Huterer, Gabriela Marques, Leandros Perivolaropoulos, Sunny Vagnozzi, and Matteo Viel for correspondence on related topics. SAA is funded by UGC non-NET Fellowship scheme of Govt. of India. ÖA acknowledges the support by the Turkish Academy of Sciences in the scheme of the Outstanding Young Scientist Award (TÜBA-GEBİP). ÖA is supported in part by TUBITAK grant 122F124. SP acknowledges hospitality of Bu-Ali Sina University while this work carried out. MMShJ and SP are supported in part by SarAmadan grant No ISEF/M/401332. AAS acknowledges the funding from SERB, Govt of India under the research grant no: CRG/2020/004347. This article/publication is based upon work from COST Action CA21136 – “Addressing observational tensions in cosmology with systematics and fundamental physics (CosmoVerse)”, supported by COST (European Cooperation in Science and Technology).
Data Availability
All the data analysed in this study are in the public domain and references are provided.
References
- Abbott et al. (2022) Abbott T. M. C., et al., 2022, Phys. Rev. D, 105, 023520
- Abdalla et al. (2022) Abdalla E., et al., 2022, JHEAp, 34, 49
- Adams et al. (2022) Adams N. J., et al., 2022, Monthly Notices of the Royal Astronomical Society, 518, 4755
- Addison et al. (2016) Addison G. E., Huang Y., Watts D. J., Bennett C. L., Halpern M., Hinshaw G., Weiland J. L., 2016, Astrophys. J., 818, 132
- Aghanim et al. (2020) Aghanim N., et al., 2020, Astron. Astrophys., 641, A6
- Alam et al. (2017) Alam S., et al., 2017, Mon. Not. Roy. Astron. Soc., 470, 2617
- Alam et al. (2021) Alam S., et al., 2021, Phys. Rev. D, 103, 083533
- Alonso et al. (2023) Alonso D., Fabbian G., Storey-Fisher K., Eilers A.-C., García-García C., Hogg D. W., Rix H.-W., 2023, arXiv e-prints, p. arXiv:2306.17748
- Asgari et al. (2021) Asgari M., et al., 2021, Astron. Astrophys., 645, A104
- Battye et al. (2015) Battye R. A., Charnock T., Moss A., 2015, Phys. Rev. D, 91, 103508
- Bautista et al. (2020) Bautista J. E., et al., 2020, Mon. Not. Roy. Astron. Soc., 500, 736
- Benisty (2021) Benisty D., 2021, Phys. Dark Univ., 31, 100766
- Beutler et al. (2012) Beutler F., et al., 2012, Mon. Not. Roy. Astron. Soc., 423, 3430
- Beutler et al. (2017) Beutler F., et al., 2017, Mon. Not. Roy. Astron. Soc., 466, 2242
- Blake et al. (2011) Blake C., et al., 2011, Mon. Not. Roy. Astron. Soc., 415, 2876
- Blake et al. (2012) Blake C., et al., 2012, Mon. Not. Roy. Astron. Soc., 425, 405
- Blake et al. (2013) Blake C., et al., 2013, Mon. Not. Roy. Astron. Soc., 436, 3089
- Blakeslee et al. (2021) Blakeslee J. P., Jensen J. B., Ma C.-P., Milne P. A., Greene J. E., 2021, Astrophys. J., 911, 65
- Boruah et al. (2020) Boruah S. S., Hudson M. J., Lavaux G., 2020, Mon. Not. Roy. Astron. Soc., 498, 2703
- Brieden et al. (2022) Brieden S., Gil-Marín H., Verde L., 2022, JCAP, 08, 024
- Castellano et al. (2022) Castellano M., et al., 2022, The Astrophysical Journal Letters, 938, L15
- Chuang & Wang (2013) Chuang C.-H., Wang Y., 2013, Mon. Not. Roy. Astron. Soc., 435, 255
- Chuang et al. (2016) Chuang C.-H., et al., 2016, Mon. Not. Roy. Astron. Soc., 461, 3781
- DESI Collaboration et al. (2016) DESI Collaboration et al., 2016, arXiv e-prints, p. arXiv:1611.00036
- Dainotti et al. (2021) Dainotti M. G., De Simone B., Schiavone T., Montani G., Rinaldi E., Lambiase G., 2021, Astrophys. J., 912, 150
- Dainotti et al. (2022) Dainotti M. G., De Simone B., Schiavone T., Montani G., Rinaldi E., Lambiase G., Bogdan M., Ugale S., 2022, Galaxies, 10, 24
- Davis et al. (2011) Davis M., Nusser A., Masters K., Springob C., Huchra J. P., Lemson G., 2011, Mon. Not. Roy. Astron. Soc., 413, 2906
- Di Valentino et al. (2019) Di Valentino E., Melchiorri A., Silk J., 2019, Nature Astron., 4, 196
- Di Valentino et al. (2021) Di Valentino E., et al., 2021, Class. Quant. Grav., 38, 153001
- Esposito et al. (2022) Esposito M., Iršič V., Costanzi M., Borgani S., Saro A., Viel M., 2022, Mon. Not. Roy. Astron. Soc., 515, 857
- Feix et al. (2015) Feix M., Nusser A., Branchini E., 2015, Phys. Rev. Lett., 115, 011301
- Feix et al. (2017) Feix M., Branchini E., Nusser A., 2017, Mon. Not. Roy. Astron. Soc., 468, 1420
- Freedman (2021) Freedman W. L., 2021, Astrophys. J., 919, 16
- Gil-Marín et al. (2017) Gil-Marín H., Percival W. J., Verde L., Brownstein J. R., Chuang C.-H., Kitaura F.-S., Rodríguez-Torres S. A., Olmstead M. D., 2017, Mon. Not. Roy. Astron. Soc., 465, 1757
- Gil-Marín et al. (2018) Gil-Marín H., et al., 2018, Mon. Not. Roy. Astron. Soc., 477, 1604
- Granett et al. (2008) Granett B. R., Neyrinck M. C., Szapudi I., 2008, Astrophys. J. Lett., 683, L99
- Handley (2021) Handley W., 2021, Phys. Rev. D, 103, L041301
- Hawken et al. (2017) Hawken A. J., et al., 2017, Astron. Astrophys., 607, A54
- Heymans et al. (2013) Heymans C., et al., 2013, Mon. Not. Roy. Astron. Soc., 432, 2433
- Hikage et al. (2019) Hikage C., et al., 2019, Publ. Astron. Soc. Jap., 71, 43
- Hou et al. (2018) Hou J., et al., 2018, Mon. Not. Roy. Astron. Soc., 480, 2521
- Hou et al. (2020) Hou J., et al., 2020, Mon. Not. Roy. Astron. Soc., 500, 1201
- Howlett et al. (2015) Howlett C., Ross A., Samushia L., Percival W., Manera M., 2015, Mon. Not. Roy. Astron. Soc., 449, 848
- Howlett et al. (2017) Howlett C., et al., 2017, Mon. Not. Roy. Astron. Soc., 471, 3135
- Hu & Wang (2022) Hu J.-P., Wang F. Y., 2022, Mon. Not. Roy. Astron. Soc., 517, 576
- Hudson & Turnbull (2013) Hudson M. J., Turnbull S. J., 2013, Astrophys. J. Lett., 751, L30
- Huterer et al. (2017) Huterer D., Shafer D., Scolnic D., Schmidt F., 2017, JCAP, 05, 015
- Jia et al. (2023) Jia X. D., Hu J. P., Wang F. Y., 2023, Astron. Astrophys., 674, A45
- Joudaki et al. (2017) Joudaki S., et al., 2017, Mon. Not. Roy. Astron. Soc., 465, 2033
- Kazantzidis & Perivolaropoulos (2018) Kazantzidis L., Perivolaropoulos L., 2018, Phys. Rev. D, 97, 103503
- Khadka & Ratra (2020) Khadka N., Ratra B., 2020, Mon. Not. Roy. Astron. Soc., 497, 263
- Khadka & Ratra (2021) Khadka N., Ratra B., 2021, Mon. Not. Roy. Astron. Soc., 502, 6140
- Khadka & Ratra (2022) Khadka N., Ratra B., 2022, Mon. Not. Roy. Astron. Soc., 510, 2753
- Knox & Millea (2020) Knox L., Millea M., 2020, Phys. Rev. D, 101, 043533
- Kourkchi et al. (2020) Kourkchi E., Tully R. B., Anand G. S., Courtois H. M., Dupuy A., Neill J. D., Rizzi L., Seibert M., 2020, Astrophys. J., 896, 3
- Kovács et al. (2017) Kovács A., et al., 2017, Mon. Not. Roy. Astron. Soc., 465, 4166
- Kovács et al. (2019) Kovács A., et al., 2019, Mon. Not. Roy. Astron. Soc., 484, 5267
- Kovács et al. (2022) Kovács A., Beck R., Smith A., Rácz G., Csabai I., Szapudi I., 2022, Mon. Not. Roy. Astron. Soc., 513, 15
- Krishnan & Mondol (2022) Krishnan C., Mondol R., 2022, arXiv e-prints, p. arXiv:2201.13384
- Krishnan et al. (2020) Krishnan C., Ó Colgáin E., Ruchika Sen A. A., Sheikh-Jabbari M. M., Yang T., 2020, Phys. Rev. D, 102, 103525
- Krishnan et al. (2021) Krishnan C., Ó Colgáin E., Sheikh-Jabbari M. M., Yang T., 2021, Phys. Rev. D, 103, 103509
- Labbé et al. (2023) Labbé I., et al., 2023, Nature, 616, 266
- Li et al. (2021) Li E.-K., Du M., Zhou Z.-H., Zhang H., Xu L., 2021, Mon. Not. Roy. Astron. Soc., 501, 4452
- Lusso et al. (2020) Lusso E., et al., 2020, Astron. Astrophys., 642, A150
- Macaulay et al. (2013) Macaulay E., Wehus I. K., Eriksen H. K., 2013, Phys. Rev. Lett., 111, 161301
- Madhavacheril et al. (2023) Madhavacheril M. S., et al., 2023, arXiv e-prints, p. arXiv:2304.05203
- Malekjani et al. (2023) Malekjani M., Mc Conville R., Ó Colgáin E., Pourojaghi S., Sheikh-Jabbari M. M., 2023, arXiv e-prints, p. arXiv:2301.12725
- Marques et al. (2023) Marques G. A., et al., 2023, arXiv e-prints, p. arXiv:2306.17268
- Millon et al. (2020) Millon M., et al., 2020, Astron. Astrophys., 639, A101
- Miyatake et al. (2022) Miyatake H., et al., 2022, Phys. Rev. Lett., 129, 061301
- Mohammad et al. (2018) Mohammad F. G., et al., 2018, Astron. Astrophys., 610, A59
- Naidu et al. (2022) Naidu R. P., et al., 2022, The Astrophysical Journal Letters, 940, L14
- Nesseris et al. (2017) Nesseris S., Pantazis G., Perivolaropoulos L., 2017, Phys. Rev. D, 96, 023542
- Neveux et al. (2020) Neveux R., et al., 2020, Mon. Not. Roy. Astron. Soc., 499, 210
- Nguyen et al. (2023) Nguyen N.-M., Huterer D., Wen Y., 2023, Phys. Rev. Lett., 131, 111001
- Nunes & Vagnozzi (2021) Nunes R. C., Vagnozzi S., 2021, Mon. Not. Roy. Astron. Soc., 505, 5427
- Ó Colgáin et al. (2022) Ó Colgáin E., Sheikh-Jabbari M. M., Solomon R., Bargiacchi G., Capozziello S., Dainotti M. G., Stojkovic D., 2022, Phys. Rev. D, 106, L041301
- Ó Colgáin et al. (2022) Ó Colgáin E., Sheikh-Jabbari M. M., Solomon R., Dainotti M. G., Stojkovic D., 2022, arXiv e-prints, p. arXiv:2206.11447
- Okumura et al. (2016) Okumura T., et al., 2016, Publ. Astron. Soc. Jap., 68, 38
- Pastén & Cárdenas (2023) Pastén E., Cárdenas V. H., 2023, Phys. Dark Univ., 40, 101224
- Perivolaropoulos & Skara (2022) Perivolaropoulos L., Skara F., 2022, New Astron. Rev., 95, 101659
- Perlmutter et al. (1999) Perlmutter S., et al., 1999, The Astrophysical Journal, 517, 565
- Pesce et al. (2020) Pesce D. W., et al., 2020, Astrophys. J. Lett., 891, L1
- Pezzotta et al. (2017) Pezzotta A., et al., 2017, Astron. Astrophys., 604, A33
- Pourojaghi et al. (2022) Pourojaghi S., Zabihi N. F., Malekjani M., 2022, Phys. Rev. D, 106, 123523
- Qu et al. (2023) Qu F. J., et al., 2023, arXiv e-prints, p. arXiv:2304.05202
- Quelle & Maroto (2020) Quelle A., Maroto A. L., 2020, Eur. Phys. J. C, 80, 369
- Riess et al. (1998) Riess A. G., et al., 1998, Astron. J., 116, 1009
- Riess et al. (2022) Riess A. G., et al., 2022, Astrophys. J. Lett., 934, L7
- Risaliti & Lusso (2019) Risaliti G., Lusso E., 2019, Nature Astron., 3, 272
- Said et al. (2020) Said K., Colless M., Magoulas C., Lucey J. R., Hudson M. J., 2020, Mon. Not. Roy. Astron. Soc., 497, 1275
- Samushia et al. (2012) Samushia L., Percival W. J., Raccanelli A., 2012, Mon. Not. Roy. Astron. Soc., 420, 2102
- Sanchez et al. (2014) Sanchez A. G., et al., 2014, Mon. Not. Roy. Astron. Soc., 440, 2692
- Shi et al. (2018) Shi F., et al., 2018, Astrophys. J., 861, 137
- Skara & Perivolaropoulos (2020) Skara F., Perivolaropoulos L., 2020, Phys. Rev. D, 101, 063521
- Song & Percival (2009) Song Y.-S., Percival W. J., 2009, JCAP, 10, 004
- Tojeiro et al. (2012) Tojeiro R., et al., 2012, Mon. Not. Roy. Astron. Soc., 424, 2339
- Troxel et al. (2018) Troxel M. A., et al., 2018, Phys. Rev. D, 98, 043528
- Turnbull et al. (2012) Turnbull S. J., Hudson M. J., Feldman H. A., Hicken M., Kirshner R. P., Watkins R., 2012, Mon. Not. Roy. Astron. Soc., 420, 447
- Turner et al. (2022) Turner R. J., Blake C., Ruggeri R., 2022, Mon. Not. Roy. Astron. Soc., 518, 2436
- Wang & Steinhardt (1998) Wang L.-M., Steinhardt P. J., 1998, Astrophys. J., 508, 483
- Wang et al. (2018) Wang Y., Zhao G.-B., Chuang C.-H., Pellejero-Ibanez M., Zhao C., Kitaura F.-S., Rodriguez-Torres S., 2018, Mon. Not. Roy. Astron. Soc., 481, 3160
- Wilson (2017) Wilson M. J., 2017, PhD thesis, Edinburgh U. (arXiv:1610.08362)
- Wong et al. (2020) Wong K. C., et al., 2020, Mon. Not. Roy. Astron. Soc., 498, 1420
- Yang et al. (2020) Yang T., Banerjee A., Ó Colgáin E., 2020, Phys. Rev. D, 102, 123532
- Zhao et al. (2019) Zhao G.-B., et al., 2019, Mon. Not. Roy. Astron. Soc., 482, 3497
- de Mattia et al. (2021) de Mattia A., et al., 2021, Mon. Not. Roy. Astron. Soc., 501, 5616
- de la Torre et al. (2013) de la Torre S., et al., 2013, Astron. Astrophys., 557, A54
- de la Torre et al. (2017) de la Torre S., et al., 2017, Astron. Astrophys., 608, A44
Appendix A Larger Archival Data Set
Given that the increase in in the text is driven exclusively by two high redshift data points, it is prudent to work with a larger data set. The role of the second data set is to provide a sanity check, since the larger data set comes with caveats that we discuss below. To that end, we focus on Table II of Kazantzidis & Perivolaropoulos (2018), where one finds 63 historical measurements of Beutler et al. (2012); Blake et al. (2013); Howlett et al. (2015); Okumura et al. (2016); Huterer et al. (2017); Song & Percival (2009); Blake et al. (2012); Davis et al. (2011); Hudson & Turnbull (2013); Turnbull et al. (2012); Samushia et al. (2012); Tojeiro et al. (2012); de la Torre et al. (2013); Chuang & Wang (2013); Sanchez et al. (2014); Wang et al. (2018); Feix et al. (2015); Chuang et al. (2016); Alam et al. (2017); Beutler et al. (2017); Wilson (2017); Gil-Marín et al. (2017); Hawken et al. (2017); de la Torre et al. (2017); Pezzotta et al. (2017); Feix et al. (2017); Howlett et al. (2017); Mohammad et al. (2018); Shi et al. (2018); Gil-Marín et al. (2018); Hou et al. (2018); Zhao et al. (2019). We add more recent data from Bautista et al. (2020); de Mattia et al. (2021); Neveux et al. (2020) to increase the sample to 66 data points. We observe that Refs. Beutler et al. (2012); Blake et al. (2013); Howlett et al. (2015); Okumura et al. (2016); Huterer et al. (2017) are common to both data sets in Fig. 1 and Fig. 6. The other data points are the work of independent groups, but as cautioned in Kazantzidis & Perivolaropoulos (2018), most analyses of growth rate data, e.g. Nguyen et al. (2023), tend to pick 20 odd data points to counteract any overcounting of data. However, this choice of independent data points is largely subjective. Moreover, different studies make use of different fiducial cosmologies. To address this latter concern, we follow equation (2.6) of Nesseris et al. (2017) (see also Macaulay et al. (2013)) and correct for this choice of fiducial model by performing a rescaling by the combination , where and denote the Hubble parameter and angular diameter distance at a given . This means that the data set is consistent with the prior by construction. Note, following Nguyen et al. (2023), we did not perform this correction in the body of the letter. In the literature, one finds groups who correct and do not correct for the fiducial cosmology.
In Fig. 7 we show the effect of removing constraints below . Where relevant, e.g. WiggleZ Blake et al. (2012), we crop covariance matrices accordingly as we remove data points. Our strong Gaussian prior on ensures that our a posteriori distributions from MCMC analysis remain Gaussian. As a result, the errors in Fig. 7 are representative. The reader will note that, in line with expectations, the size of the error bar increases as we remove data. Furthermore, the error bars in Fig. 7 are correlated, because all plotted constraints larger than a given share data points.
We can address criticism regarding the correlated constraints in Fig. 7 by simply splitting the sample into independent subsamples. Our results in Fig. 7 suggest that any split at may maximise the discrepancy between low redshift and high redshift subsamples. Once again, the trend is directly visible in the data in Fig. 6, since 7 from 8 data points above prefer larger values of than the full sample (). The choice of split is somewhat arbitrary, as it depends on the composition or makeup of the overall sample, notably redshift distribution and quality of the data. For this reason, the split here is conducted at , whereas it was in the body of the letter. Note that our sample here now has an extended range, so we can explore higher redshift splits of the sample. Concretely, we find that a split at leads to at lower redshifts and at higher redshifts, with a tension at as illustrated in Fig. 8. Once again, it is worth noting that from data below is in tension with Planck at , while the data above is consistent with Planck at .
Removing the prior, the corresponding results are and . Evidently, all inferences are now consistent with Planck within , however as can be seen from Fig. 9, there is degeneracy in the -plane that the data fails to break. Thus, care needs to be taken with these inferences as they will be prior dependent. Noting that is lower than expected in the lower redshift subsample, it is interesting to studying the full sample without the prior. Doing, so we find . Evidently there is some discrepancy with Planck, whereby and are respectively and away. In both data sets considered in this work, there is evidently tension with Planck in one of the parameters.
Bearing in mind that not all the data points are independent, and as a result the errors are underestimated, the main take away from our analysis here is that the trend with Planck+BAO prior is robust to changes in the data set. A secondary take away is confirmation that one expects to run into trouble in higher redshift bins without an prior in line with equations (2) and (3).