ST360IQ: No-Reference Omnidirectional Image Quality Assessment with Spherical Vision Transformers
Abstract
Omnidirectional images, aka 360∘ images, can deliver immersive and interactive visual experiences. As their popularity has increased dramatically in recent years, evaluating the quality of 360∘ images has become a problem of interest since it provides insights for capturing, transmitting, and consuming this new media. However, directly adapting quality assessment methods proposed for standard natural images for omnidirectional data poses certain challenges. These models need to deal with very high-resolution data and implicit distortions due to the spherical form of the images. In this study, we present a method for no-reference 360∘ image quality assessment. Our proposed ST360IQ model extracts tangent viewports from the salient parts of the input omnidirectional image and employs a vision-transformers based module processing saliency selective patches/tokens that estimates a quality score from each viewport. Then, it aggregates these scores to give a final quality score. Our experiments on two benchmark datasets, namely OIQA and CVIQ datasets, demonstrate that as compared to the state-of-the-art, our approach predicts the quality of an omnidirectional image correlated with the human-perceived image quality. The code has been available on https://github.com/Nafiseh-Tofighi/ST360IQ
Index Terms– Vision Transformers, 360° image quality assessment
1 Introduction
Virtual reality (VR) data has recently occupied an increasing share of multimedia data as the corresponding hardware, including Head Mounted Displays (HMD) and capture devices, has become more widely accessible to the end-users. Therefore, developing methods for evaluating the quality of omnidirectional images has also gained much attention from the researchers working in this area.
Image quality assessment (IQA) has been thoroughly studied in the past twenty years [1]. Generally speaking, IQA algorithms can be classified into full-reference IQA (FR IQA), reduced-reference IQA (RR IQA), and no-reference IQA (NR IQA) [2]. FR IQA and RR IQA models need full and part reference image information, respectively, while NR IQA takes only the distorted image as input. In that sense, NR IQA measures subjective, perceptual quality of images.
With the recent advances in deep learning, deep methods started to dominate the IQA literature. While the early examples employ convolutionals neural networks (CNNs) for predicting the image quality [1, 3], the more recent work considers self-attention and vision-transformers (ViT) [4] based architectures [5, 6]. In general, the quality assessment literature for 360∘ images follows the IQA literature as most of the existing work either suggest to directly use the same IQA methods proposed for natural images, or make small modification to those methods to deal with the spherical form [7]. Only very recently, CNN-based models specific to omnidirection images haves been proposed [8, 9, 10, 11, 12].
In our work, we propose a ViT-based framework for omnidirectional image quality assessment called ST360IQ. Up to our knowledge, there are no prior work that explores ViTs for evaluating the perceptual quality of 360∘ images. Our framework estimates the overall image quality through a number of tangent viewports focusing on different parts of the spherical image. In particular, motivated by the relation between visual salience and image quality [13], we sample these viewports from the salient parts of the omnidirectional data. We process each viewport independently through a spherical ViT-based module, and extract individual quality scores, which are then aggregated to obtain the final quality score. Using tangent viewports instead of the commonly used projections such as equirectangular projection (ERP) or cube-mapping allows us to deal with distorted visual data due to the spherical form more effectively. Moreover, our ViT-based formulation specifically designed for the omnidirectional data domain results in more accurate predictions than the state-of-the-art.
2 Proposed Method
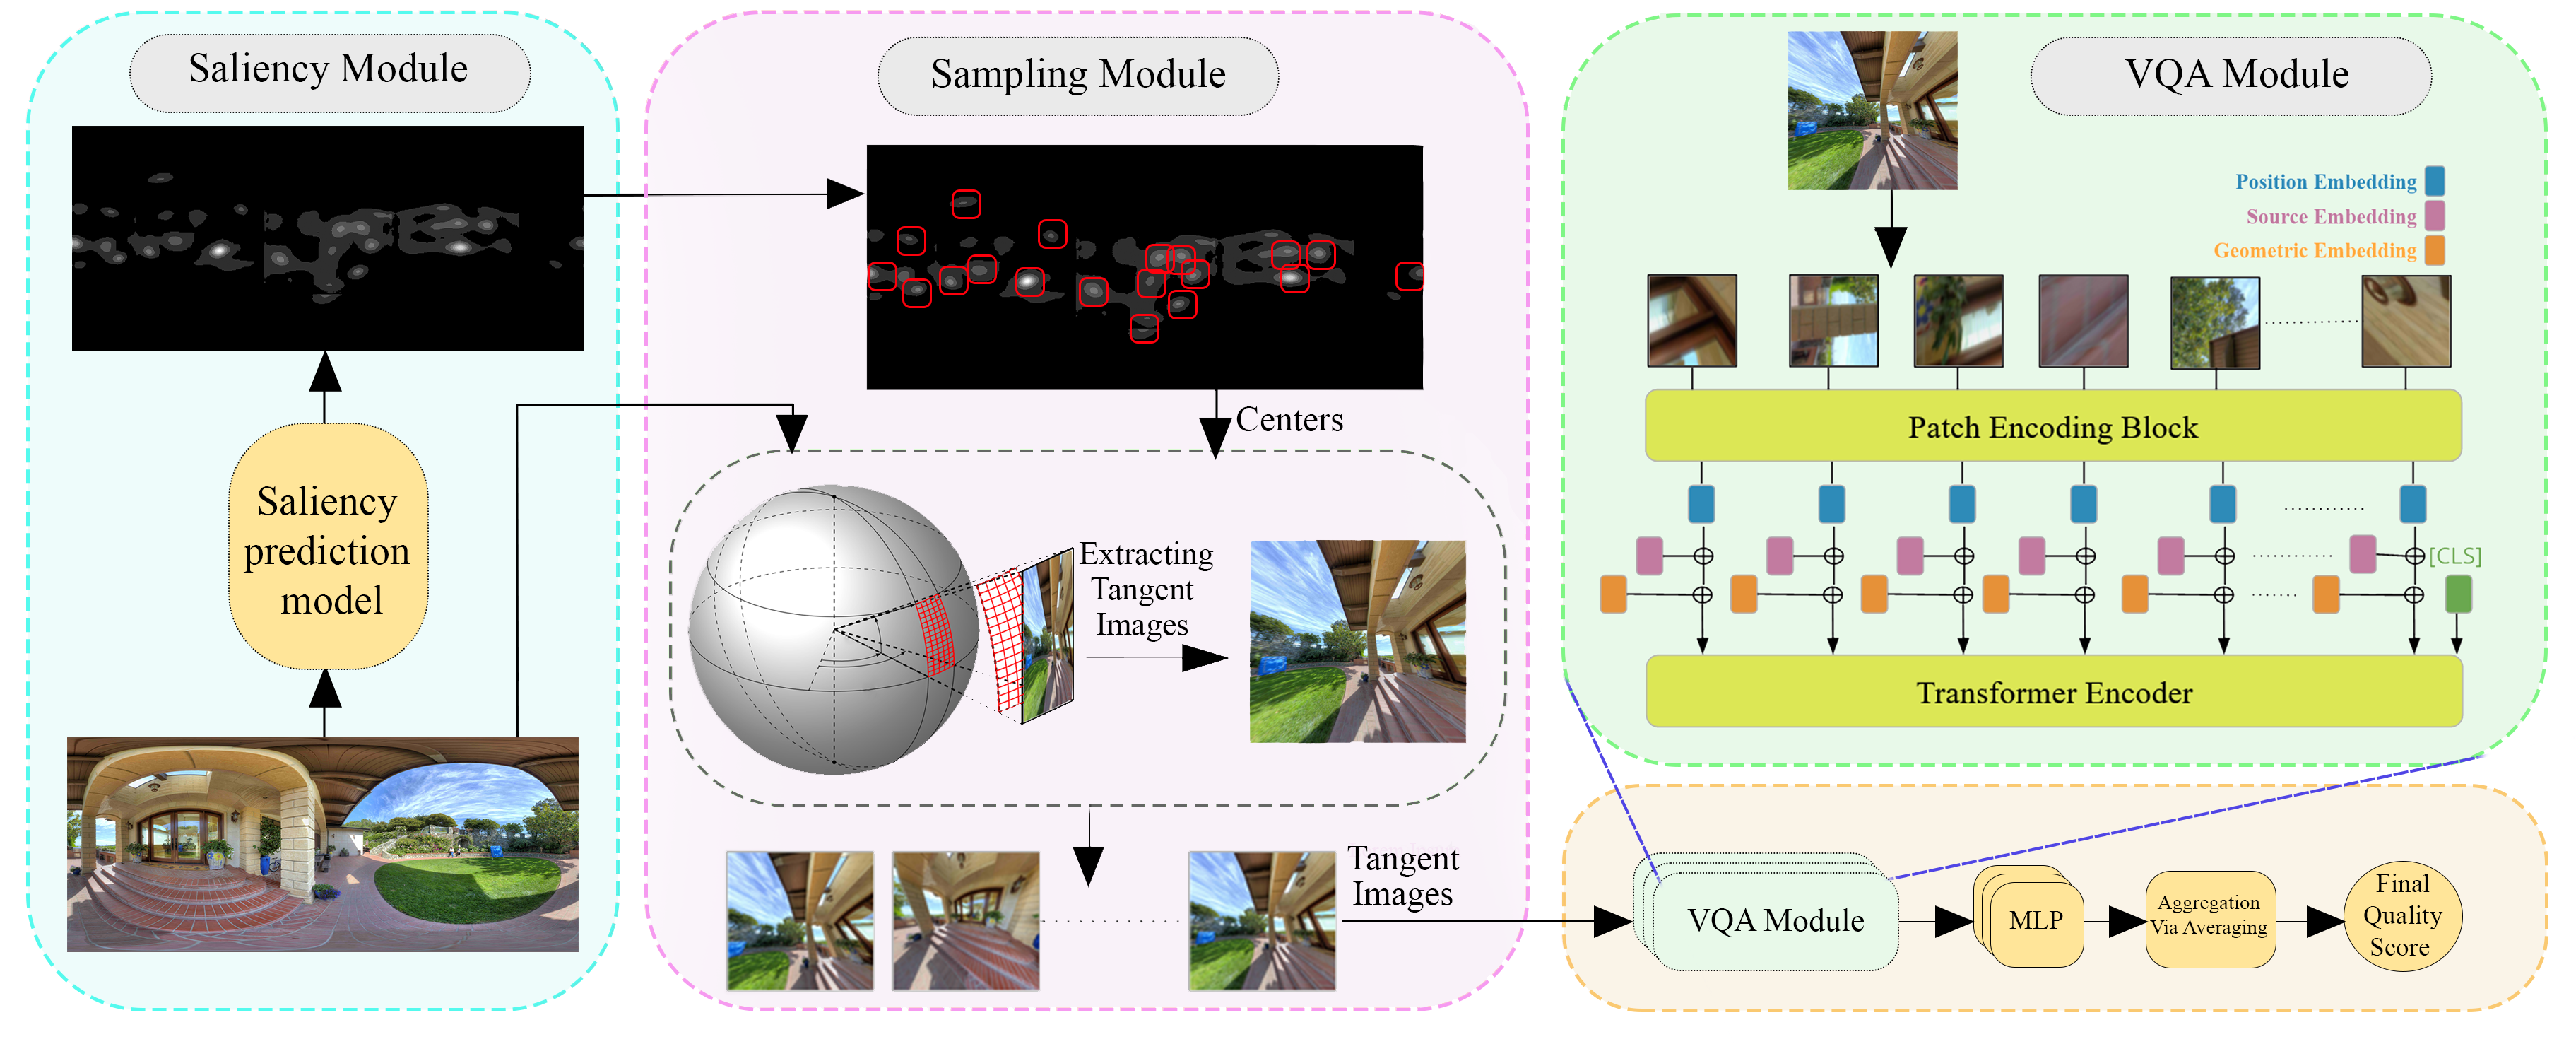
To address the challenge of learning to assess the quality of omnidirectional images, we propose a ViT-based method that utilizes a saliency-driven sampling technique to better capture important parts of panoramic content. Figure 1 shows a general overview of our model. In the saliency module, we first predict visually attractive parts of the panoramic image via an off-the-shelf visual saliency prediction model. Our sampling module then extracts tangent viewports from salient regions of the distorted image in ERP format. The main VQA module resembles the one used in [6], but the patch encoding block is re-modeled from the ground up to deal with the special structure of 360∘ images. To effectively encode input viewports into a sequence of tokens, we incorporate positional, geometric and source embeddings into the extracted sequence of tokens, and add a learnable classification token (CLS) to capture the global representation for the image. The corresponding 360° image quality score is predicted by the output of a fully connected layer on top of the final CLS token representation at the output of the Transformer encoder.
Sampling Module. Most 360∘ IQA datasets store images in the ERP format, which is the most popular spherical image representation, but is known to have significant distortions. To improve the model performance in 360∘ IQA task, we utilize tangent image representation [14] to reduce the distortion of the viewports extracted from the ERP image. Moreover, to distinguish visually important parts of a panoramic image, we designed a sampling strategy motivated by the human visual attention mechanism. In particular, we employ the 360∘ image saliency prediction model named ATSal [15] to predict salient regions of the panorama. In this way, one can assign a saliency score for each patch extracted from the omnidirectional image, which we utilize in our sampling module.
Our main motivation behind our saliency-guided sampling scheme is to combine neural attention (self-attention) mechanism with human visual attention in a simple and intuitive manner. At the first step of the sampling module, an input image in ERP format is fed to the ATSal saliency prediction model to predict a saliency map showing which regions are most likely to attract attention. The mean shift algorithm is then applied to the extracted saliency map to better highlight the salient regions. Finally, we randomly sample 10% of regions wrt the mean saliency scores computed within each overlapping region extracted with a stride value of S.
In this work, we utilize tangent image representation for 360∘ images, which divide the sphere into several nearly Euclidean zones. Using the center points of each sampled salient region (, ), we construct a tangent image, which is free from the distortions observed in ERP images. In addition, this enables the model to gain more effective information from the same viewport size thanks to its wider field of view. As our model processes each tangent image separately during training, the quality scores of these tangent images are set to the ground truth quality score assigned to the whole image.
| JPEG | H.264/AVC | H.265/HEVC | Overall | ||||||||||
| Method | PLCC | SRCC | RMSE | PLCC | SRCC | RMSE | PLCC | SRCC | RMSE | PLCC | SRCC | RMSE | |
| Full Reference | PSNR | 0.75 | 0.76 | 10.66 | 0.66 | 0.66 | 10.06 | 0.60 | 0.57 | 9.47 | 0.65 | 0.68 | 10.65 |
| SSIM [16] | 0.98 | 0.95 | 3.41 | 0.88 | 0.86 | 6.39 | 0.85 | 0.82 | 6.28 | 0.90 | 0.87 | 5.95 | |
| FSIM [17] | 0.98 | 0.96 | 3.37 | 0.95 | 0.94 | 4.34 | 0.95 | 0.95 | 3.67 | 0.95 | 0.94 | 4.50 | |
| MS_SSIM [18] | 0.95 | 0.89 | 5.06 | 0.75 | 0.73 | 8.78 | 0.73 | 0.72 | 8.02 | 0.83 | 0.78 | 7.88 | |
| IW_SSIM [19] | 0.98 | 0.96 | 3.03 | 0.94 | 0.94 | 4.37 | 0.95 | 0.95 | 3.63 | 0.91 | 0.90 | 5.71 | |
| SR-SIM [20] | 0.97 | 0.94 | 3.92 | 0.89 | 0.86 | 6.19 | 0.91 | 0.89 | 4.99 | 0.88 | 0.86 | 6.52 | |
| GMSD [21] | 0.96 | 0.91 | 4.28 | 0.73 | 0.72 | 9.07 | 0.81 | 0.81 | 6.96 | 0.82 | 0.79 | 8.03 | |
| VSI [13] | 0.96 | 0.91 | 4.59 | 0.87 | 0.85 | 6.67 | 0.86 | 0.84 | 5.97 | 0.89 | 0.85 | 6.41 | |
| HaarPSI [22] | 0.97 | 0.95 | 3.63 | 0.87 | 0.85 | 6.55 | 0.89 | 0.88 | 5.27 | 0.90 | 0.87 | 5.98 | |
| LPIPS [3] | 0.93 | 0.85 | 6.07 | 0.96 | 0.96 | 3.77 | 0.95 | 0.95 | 3.85 | 0.92 | 0.91 | 5.53 | |
| DISTS [1] | 0.96 | 0.91 | 4.74 | 0.97 | 0.97 | 3.34 | 0.96 | 0.96 | 3.34 | 0.94 | 0.93 | 4.90 | |
| MDSI [23] | 0.98 | 0.95 | 3.41 | 0.91 | 0.89 | 5.44 | 0.93 | 0.92 | 4.30 | 0.92 | 0.90 | 5.46 | |
| No Ref. | BRISQUE [24] | 0.86 | 0.83 | 8.31 | 0.81 | 0.90 | 13.37 | 0.62 | 0.79 | 9.27 | 0.75 | 0.78 | 9.21 |
| MUSIQ [6] | 0.94 | 0.84 | 5.55 | 0.90 | 0.84 | 5.85 | 0.85 | 0.81 | 6.24 | 0.89 | 0.81 | 6.43 | |
| MC360IQA [8] | 0.96 | 0.96 | 4.30 | 0.96 | 0.96 | 3.65 | 0.90 | 0.91 | 5.00 | 0.95 | 0.95 | 4.65 | |
| VGCN [9] | 0.99 | 0.98 | 2.50 | 0.97 | 0.97 | 3.15 | 0.94 | 0.95 | 3.99 | 0.96 | 0.96 | 3.67 | |
| ST360IQ (Ours) | 0.99 | 0.97 | 2.67 | 0.99 | 0.98 | 2.06 | 0.96 | 0.96 | 3.25 | 0.98 | 0.98 | 2.98 | |
Patch Encoder and Model Embeddings. After the sampling module, it is necessary to generate transformer input patches from selected viewports. Instead of the linear projection as used in the original ViT model [4], we utilize ResNet-50 convolutional layers, [25] is used for encoding the patches. The embedding information is added at the top of the output of the patch encoder part. Position embeddings are added to the patches to retain positional information, such as standard vision transformer architecture, through each image patch. The model keeps the information about each viewport extracted from which region of the original input image with ERP as a consequence of Geometric embedding. This enables the model to learn better with the help of neighbor viewports correlation information. To this aim, the central data of each tangent viewport (, ) after normalizing are added to the patches as geometric embedding. Last but not least, source embedding is employed since each viewport is fed into the transformer encoder independently, and with this feature, the network has the opportunity of predicting even with a single or limited number of viewports. To achieve this, all tangent viewports extracted from a single ERP input image gain the same source embedding corresponding to their ERP index. This helps the model mark each tangent image comes from which input source. As a result of this architecture, the average score of all tangent images extracted from a single ERP input is reported as the final prediction score for each image.
Model Training and Implementation Details. Input tokens of the vanilla Transformer used in this work have dimensions of , and we employ a patch size of . To make the model size equivalent to ResNet-50, we utilize a classic Transformer with six heads, 14 layers, 384 hidden sizes, and 1152 MLP size. For sampling, each input image is divided into regions by stride 16, and then 10% of those salient regions are selected, which gives empirically the best results. The training pipeline uses the mean absolute error (MAE) as the loss function.
3 Experimental Results
Datasets. We evaluate the performance of our method using the commonly used CVIQ [26] and OIQA [27] datasets. CVIQ dataset contains 528 compressed images that are obtained by applying three widely used coding standards (JPEG, H.264/AVC, and H.265/HEVC) on 16 lossless images. OIQA dataset respectively consists of 16 raw, and 320 distorted 360∘ images that are obtained from the raw images by applying four common distortion types (Gaussian blur, Gaussian noise, JPEG compression, and JPEG2000 compression) from five different levels. Following [28, 9], for our analysis, we randomly decompose the aforementioned datasets into train (80%) and (20%) test splits along the lossless/distortion-free image dimension. This results in 13 training and 3 test images for both datasets. By this way, we guarantee that the test images, apart from whether they are distorted or distortion-free, have not been seen during training.
| JPEG | JPEG2000 | Gaussian Blur | Gaussian Noise | Overall | ||||||||||||
| Method | PLCC | SRCC | RMSE | PLCC | SRCC | RMSE | PLCC | SRCC | RMSE | PLCC | SRCC | RMSE | PLCC | SRCC | RMSE | |
| Full Reference | PSNR | 0.75 | 0.72 | 1.43 | 0.88 | 0.89 | 1.01 | 0.97 | 0.96 | 1.73 | 0.77 | 0.82 | 1.17 | 0.64 | 0.60 | 1.54 |
| SSIM [16] | 0.94 | 0.96 | 0.73 | 0.96 | 0.97 | 0.54 | 0.97 | 0.95 | 0.41 | 0.96 | 0.96 | 0.51 | 0.92 | 0.92 | 0.77 | |
| FSIM [17] | 0.95 | 0.96 | 0.65 | 0.95 | 0.95 | 0.63 | 0.97 | 0.96 | 0.40 | 0.96 | 0.96 | 0.48 | 0.93 | 0.93 | 0.72 | |
| MS_SSIM [18] | 0.97 | 0.94 | 0.49 | 0.94 | 0.92 | 0.74 | 0.88 | 0.87 | 0.79 | 0.82 | 0.84 | 1.04 | 0.70 | 0.68 | 1.42 | |
| IW_SSIM [19] | 0.95 | 0.96 | 0.67 | 0.97 | 0.97 | 0.44 | 0.87 | 0.84 | 0.84 | 0.91 | 0.92 | 0.73 | 0.76 | 0.75 | 1.31 | |
| SR-SIM [20] | 0.94 | 0.96 | 0.73 | 0.95 | 0.96 | 0.62 | 0.96 | 0.95 | 0.42 | 0.96 | 0.96 | 0.51 | 0.92 | 0.93 | 0.75 | |
| GMSD [21] | 0.95 | 0.94 | 0.93 | 0.95 | 0.93 | 0.65 | 0.90 | 0.85 | 0.74 | 0.85 | 0.88 | 0.96 | 0.77 | 0.76 | 1.27 | |
| VSI [13] | 0.95 | 0.97 | 0.65 | 0.96 | 0.96 | 0.56 | 0.97 | 0.96 | 0.38 | 0.96 | 0.96 | 0.94 | 0.93 | 0.93 | 0.72 | |
| HaarPSI [22] | 0.95 | 0.96 | 0.65 | 0.98 | 0.97 | 0.36 | 0.91 | 0.91 | 0.70 | 0.92 | 0.91 | 0.70 | 0.84 | 0.83 | 1.077 | |
| LPIPS [3] | 0.98 | 0.97 | 0.41 | 0.91 | 0.91 | 0.86 | 0.96 | 0.95 | 0.48 | 0.94 | 0.96 | 0.49 | 0.93 | 0.94 | 0.68 | |
| DISTS [1] | 0.98 | 0.99 | 0.37 | 0.96 | 0.95 | 0.56 | 0.98 | 0.95 | 0.33 | 0.95 | 0.95 | 0.56 | 0.94 | 0.94 | 0.64 | |
| MDSI [23] | 0.93 | 0.92 | 0.75 | 0.97 | 0.96 | 0.53 | 0.97 | 0.96 | 0.38 | 0.97 | 0.96 | 0.42 | 0.94 | 0.94 | 0.63 | |
| No Ref. | BRISQUE [24] | 0.86 | 0.97 | 1.08 | 0.71 | 0.71 | 1.54 | 0.82 | 0.94 | 0.97 | 0.88 | 0.83 | 0.85 | 0.75 | 0.76 | 1.33 |
| MUSIQ [6] | 0.97 | 0.98 | 0.46 | 0.91 | 0.90 | 0.82 | 0.84 | 0.85 | 0.61 | 0.89 | 0.90 | 0.90 | 0.92 | 0.92 | 0.79 | |
| MC360IQA [8] | 0.97 | 0.97 | 0.53 | 0.91 | 0.91 | 0.88 | 0.97 | 0.97 | 0.40 | 0.96 | 0.98 | 0.37 | 0.94 | 0.94 | 0.66 | |
| VGCN* [9] | 0.95 | 0.93 | 0.67 | 0.98 | 0.95 | 0.48 | 0.98 | 0.96 | 0.33 | 0.98 | 0.98 | 0.35 | 0.95 | 0.96 | 0.63 | |
| VGCN+ [9] | 0.89 | 0.88 | 0.98 | 0.92 | 0.89 | 0.90 | 0.90 | 0.85 | 0.78 | 0.96 | 0.94 | 0.47 | 0.88 | 0.89 | 0.92 | |
| ST360IQ (Ours) | 0.99 | 0.99 | 0.39 | 0.97 | 0.97 | 0.47 | 0.89 | 0.83 | 0.49 | 0.97 | 0.99 | 0.47 | 0.96 | 0.97 | 0.57 | |
| VGCN+ stands for the model trained with the same settings as our proposed method | VGCN* stands for the results given in the original VGCN paper [9] | |||||||||||||||
| CVIQ | OIQA | |||
|---|---|---|---|---|
| Method | PLCC | SRCC | PLCC | SRCC |
| Proposed model | 0.98 | 0.98 | 0.96 | 0.97 |
| w/o saliency-guided sampling | 0.96 | 0.95 | 0.93 | 0.93 |
| w/o tangent viewports | 0.94 | 0.92 | 0.93 | 0.93 |
Performance Comparison. We evaluate the performance of our model with three widely used metrics, namely Spearman’s Rank Correlation Coefficient (SRCC), Pearson Correlation Coefficient (PLCC), and Root Mean Squared Error (RMSE). As commonly done, before computing PLCC and RMSE, we apply a five-parameter logistic function to the model’s prediction. In Table 1-2, we present the results of our model along with some traditional and learning-based metrics on the OIQA and CVIQ datasets. Most of these metrics are FR metrics and require an additional reference image. The remaining ones are NR metrics, within which MUSIQ [6] is the ViT-based model that we build our model on top of, and MC360IQA [8] and VGCN [9] are the NR models specifically designed for omnidirectional images.
Our proposed ST360IQ model, in general, outperforms the state of the art models in predicting image quality on all tested images. Training and applying MUSIQ on the ERP images give worse results than most of the NR metrics including ours as ERP images suffers from additional spherical distortions, showing processing omnidirectional images needs special care, as we did in our proposed framework. Moreover, it is important to emphasize that for achieving these performances, our model does not require any pre-training involving IQA datasets that contain natural images. On the other hand, the highly competitive VGCN [9] does, which can be also partly seen in Table 2 in that its performance decreases without proper pretraining (cf. VGCN* and VGCN+).
Effect of Sampling Module. The performance of ST360IQ strongly relies on the utilized sampling strategies. We sample tangent viewports from a given spherical 360∘ image, and estimate its quality score from these viewports, instead of processing the whole image. Moreover, motivated by the human attention mechanism, we consider a saliency-guided sampling scheme to select the tangent viewports. We evaluate the contribution of these strategies in Table 3. First, we replace the tangent images with the image regions directly cropped from the salient parts of the corresponding ERP images. This leads to a significant performance loss, validating our claim that inherent distortions in ERP images have a negative influence on the quality predictions. Second, instead of selecting salient viewports, we perform random sampling over the spherical image and extract viewports accordingly regardless of their salience. Again, we observe that such kind of strategy gives poor performance as compared to our full model.
| CVIQ | OIQA | |||
|---|---|---|---|---|
| Method | PLCC | SRCC | PLCC | SRCC |
| Proposed model | 0.98 | 0.98 | 0.96 | 0.97 |
| w/o source embed. | 0.96 | 0.96 | 0.95 | 0.96 |
| w/o geometric+source embed. | 0.94 | 0.95 | 0.93 | 0.94 |
Effect of geometric and source embeddings. We assess the effect of using source and geometric embeddings on ST360IQ’s performance by excluding them from the patch encodings. The results given in Table 4 shows that adding geometric embeddings introduces significant performance gains. We conjecture that it allows the network to learn viewport-specific biases. Similarly, including source embeddings, in a way, let the model be aware of image-specific characteristics during training over the extracted salient viewports, further improving the prediction accuracies.
4 Conclusion
We propose a spherical-ViT based no-reference omnidirectional IQA method called ST360IQ, which predicts the quality score of a 360∘ image by processing the image by extracting the most salient viewports, and aggregating the local quality scores estimated from them. Using the ViT-architecture allows us to better model the geometry of the spherical structure and the viewport biases. The effectiveness of the suggested approach is demonstrated by the experiments on two common 360∘ IQA datasets, which reveal that our model consistently attains the state-of-the-art performance.
5 Acknowledgments
This work was supported in part by KUIS AI Center Research Award, TUBITAK-1001 Program Award No. 120E501, GEBIP 2018 Award of the Turkish Academy of Sciences to E. Erdem, and BAGEP 2021 Award of the Science Academy to A. Erdem.
References
- [1] Keyan Ding, Kede Ma, Shiqi Wang, and Eero P. Simoncelli, “Image quality assessment: Unifying structure and texture similarity,” IEEE Trans. Pattern Anal. Mach. Intell., vol. 44, no. 5, pp. 2567–2581, 2022.
- [2] Zahid Akhtar and Tiago H. Falk, “Audio-visual multimedia quality assessment: A comprehensive survey,” IEEE Access, vol. 5, pp. 21090–21117, 2017.
- [3] Richard Zhang, Phillip Isola, Alexei A. Efros, Eli Shechtman, and Oliver Wang, “The unreasonable effectiveness of deep features as a perceptual metric,” CoRR, vol. abs/1801.03924, 2018.
- [4] Alexey Dosovitskiy, Lucas Beyer, Alexander Kolesnikov, Dirk Weissenborn, Xiaohua Zhai, Thomas Unterthiner, Mostafa Dehghani, Matthias Minderer, Georg Heigold, Sylvain Gelly, et al., “An image is worth 16x16 words: Transformers for image recognition at scale,” arXiv preprint arXiv:2010.11929, 2020.
- [5] Junyong You and Jari Korhonen, “Transformer for image quality assessment,” in ICIP, 2021, pp. 1389–1393.
- [6] Junjie Ke, Qifei Wang, Yilin Wang, Peyman Milanfar, and Feng Yang, “MUSIQ: Multi-scale image quality transformer,” in ICCV, 2021, pp. 5148–5157.
- [7] Mai Xu, Chen Li, Shanyi Zhang, and Patrick Le Callet, “State-of-the-art in 360 video/image processing: Perception, assessment and compression,” IEEE J. Sel. Top. Signal Process., vol. 14, no. 1, pp. 5–26, 2020.
- [8] Wei Sun, Xiongkuo Min, Guangtao Zhai, Ke Gu, Huiyu Duan, and Siwei Ma, “Mc360iqa: A multi-channel cnn for blind 360-degree image quality assessment,” IEEE J. Sel. Top. Signal Process., vol. 14, no. 1, pp. 64–77, 2020.
- [9] Jiahua Xu, Wei Zhou, and Zhibo Chen, “Blind omnidirectional image quality assessment with viewport oriented graph convolutional networks,” IEEE Trans. Circuits Syst. Video Technol., 2020.
- [10] Abderrezzaq Sendjasni, Mohamed-Chaker Larabi, and Faouzi Alaya Cheikh, “Perceptually-weighted CNN for 360-degree image quality assessment using visual scan-path and jnd,” in ICIP, 2021, pp. 1439–1443.
- [11] Chongzhen Tian, Xiongli Chai, Gang Chen, Feng Shao, Qiuping Jiang, Xiangchao Meng, Long Xu, and Yo-Sung Ho, “VSOIQE: A novel viewport-based stitched 360° omnidirectional image quality evaluator,” IEEE Trans. Circuits Syst. Video Technol., vol. 32, no. 10, pp. 6557–6572, 2022.
- [12] Abderrezzaq Sendjasni and Mohamed-Chaker Larabi, “SAL-360IQA: A saliency weighted patch-based cnn model for 360-degree images quality assessment,” in ICMEW, 2022, pp. 1–6.
- [13] Lin Zhang, Ying Shen, and Hongyu Li, “VSI: A visual saliency-induced index for perceptual image quality assessment,” IEEE Trans. Image Process., vol. 23, no. 10, pp. 4270–4281, 2014.
- [14] Marc Eder and Jan-Michael Frahm, “Convolutions on spherical images,” in CVPRW, 2019, pp. 1–5.
- [15] Yasser Dahou, Marouane Tliba, Kevin McGuinness, and Noel O’Connor, “ATSal: An attention based architecture for saliency prediction in 360 videos,” in ICPR, 2021.
- [16] Zhou Wang, Alan C. Bovik, Hamid R. Sheikh, and Eero P. Simoncelli, “Image quality assessment: from error visibility to structural similarity,” IEEE Trans. Image Process., vol. 13, pp. 600 – 612, 2004.
- [17] Lin Zhang, Lei Zhang, Xuanqin Mou, and David Zhang, “FSIM: A feature similarity index for image quality assessment,” IEEE Trans. Image Process., vol. 20, no. 8, pp. 2378–2386, 2011.
- [18] Zhou Wang, Eero P. Simoncelli, and Alan C. Bovik, “Multiscale structural similarity for image quality assessment,” in ACSSC, 2003, vol. 2, pp. 1398–1402 Vol.2.
- [19] Zhou Wang and Qiang Li, “Information content weighting for perceptual image quality assessment,” IEEE Trans. Image Process., vol. 20, no. 5, pp. 1185–1198, 2010.
- [20] Lin Zhang and Hongyu Li, “SR-SIM: A fast and high performance iqa index based on spectral residual,” in ICIP, 2012, pp. 1473–1476.
- [21] Wufeng Xue, Lei Zhang, Xuanqin Mou, and Alan C. Bovik, “Gradient magnitude similarity deviation: A highly efficient perceptual image quality index,” IEEE Trans. Image Process., vol. 23, no. 2, pp. 684–695, 2014.
- [22] Rafael Reisenhofer, Sebastian Bosse, Gitta Kutyniok, and Thomas Wiegand, “A haar wavelet-based perceptual similarity index for image quality assessment,” CoRR, vol. abs/1607.06140, 2016.
- [23] Hossein Ziaei Nafchi, Atena Shahkolaei, Rachid Hedjam, and Mohamed Cheriet, “Mean deviation similarity index: Efficient and reliable full-reference image quality evaluator,” IEEE Access, vol. 4, pp. 5579–5590, 2016.
- [24] Anish Mittal, Anush Krishna Moorthy, and Alan Conrad Bovik, “No-reference image quality assessment in the spatial domain,” IEEE Trans. Image Process., vol. 21, no. 12, pp. 4695–4708, 2012.
- [25] Kaiming He, Xiangyu Zhang, Shaoqing Ren, and Jian Sun, “Deep residual learning for image recognition,” in CVPR, 2016, pp. 770–778.
- [26] Wei Sun, Ke Gu, Siwei Ma, Wenhan Zhu, Ning Liu, and Guangtao Zhai, “A large-scale compressed 360-degree spherical image database: From subjective quality evaluation to objective model comparison,” in MMSP, 2018, pp. 1–6.
- [27] Huiyu Duan, Guangtao Zhai, Xiongkuo Min, Yucheng Zhu, Yi Fang, and Xiaokang Yang, “Perceptual quality assessment of omnidirectional images,” in ISCAS, 2018, pp. 1–5.
- [28] Chen Li, Mai Xu, Lai Jiang, Shanyi Zhang, and Xiaoming Tao, “Viewport proposal cnn for 360 video quality assessment,” in 2019 IEEE/CVF Conference on Computer Vision and Pattern Recognition (CVPR). IEEE, 2019, pp. 10169–10178.