MigraR: an open-source, R-based application for analysis and quantification of cell migration parameters
Abstract
Background and objective: Cell migration is essential for many biological phenomena with direct impact on human health and disease. One conventional approach to study cell migration involves the quantitative analysis of individual cell trajectories recorded by time-lapse video microscopy. Dedicated software tools exist to assist the automated or semi-automated tracking of cells and translate these into coordinate positions along time. However, cell biologists usually bump into the difficulty of plotting and computing these data sets into biologically meaningful figures and metrics.
Methods: This report describes MigraR, an intuitive graphical user interface executed from the RStudioTM (via the R package Shiny), which greatly simplifies the task of translating coordinate positions of moving cells into measurable parameters of cell migration (velocity, straightness, and direction of movement), as well as of plotting cell trajectories and migration metrics. One innovative function of this interface is that it allows users to refine their data sets by setting limits based on time, velocity and straightness.
Results: MigraR was tested on different data to assess its applicability. Intended users of MigraR are cell biologists with no prior knowledge of data analysis, seeking to accelerate the quantification and visualization of cell migration data sets delivered in the format of Excel files by available cell-tracking software.
Conclusions: Through the graphics it provides, MigraR is an useful tool for the analysis of migration parameters and cellular trajectories. Since its source code is open, it can be subject of refinement by expert users to best suit the needs of other researchers. It is available at GitHub and can be easily reproduced.
keywords:
Shiny application \sepCell-tracking software \sepVisualization \sepR language1 Introduction
Cell migration is an increasingly eminent area of research in biomedical sciences, with implications in fields as diverse as infection, immune response, embryo-genesis, and cancer [8, 7, 11, 15]. The in-depth study of cells’ migratory behavior holds promise to shed new light into these processes and ultimately translate into the development of innovative therapeutic strategies to ameliorate pathological conditions stemming from abnormal cell mobility. One powerful tool to study cell migration is time-lapse video microscopy. By imaging moving cells over several hours, this method captures both the temporal and the spatial dynamics of cell migration. Downstream image processing and cell tracking analyses by dedicated software (reviewed in [13]) then translate image sequences into numerical values. In their simplest version, cell trajectories are displayed as lists of , pixel coordinates along time. These coordinates, transformed into standard length measurements (m), set the basis to compute biological meaningful quantitative metrics of single-cell migration, namely velocity, straightness and direction of movement, which can be ultimately used to draw informed conclusions about the mobile behavior of a population of cells.
Transforming complex data sets into quantitative and insightful results is not an easy task for most biomedical researchers though. To perform basic tasks, such as graphical display of cell trajectories, plotting of Rose cell-tracking wind diagrams, and data refinement (based, for instances on the time window of data acquisition), cell biologists resort to dedicated ®MATLAB and RStudioTM software. However, the use of these tools requires an expert knowledge in computer science and mathematics rarely met by health scientists. In the last decade, some more accessible tools have been proposed by the community. A few are free and only some of those are open source (e.g. MotilityLab111http://2ptrack.net/index.html/CelltrackR [26, 27], CellMissy [14] or Ibidi [9]).
The software tool presented in this manuscript was developed to meet the need of a group of biomedical researchers to have access to a free, user-friendly application to make analysis of cell motion. From their collaboration with computer scientists, emerged MigraR.
MigraR is cross-platform, with an intuitive graphical user interface, running from open-source RTM and RStudioTM. With no need for expert knowledge in mathematical data analysis software, MigraR drastically simplifies the plotting and analysis of migration parameters and cell trajectories. Besides quantifying speed and straightness, MigraR also provides specific plots of directions and angles, and, importantly, enables users to filter datasets to improve the quality of their output results. Importantly, MigraR is publicly and freely available on a GitHub account to all interested parties to download and use. Since its source code is also open, it can be subject of refinement by expert users to best suit the needs of other researchers.
2 Material and Methods
2.1 Related applications
MigraR was developed to assist biomedical researchers in the analysis of cell trajectories and migration parameters. MigraR does not perform tracking of cells from time-lapse videos; rather, it processes data sheets of , coordinates along time that are delivered by upstream image processing and cell tracking software (reviewed in [8]). Launched from RStudioTM using the Shinny extension, MigraR is a fully open source, and user-friendly and interactive platform for uncomplicated analysis of cell migration parameters. Compared with analogous free and open source applications MigraR stands out for (Table 1):
-
[i.]
-
1.
enabling users to filter their datasets by re-scaling parameters such as time, velocity or straightness;
-
2.
displaying the direction and angle of cell trajectories;
- 3.
| Functionalities |
|
|
|
|
|
|
|
|
|
|
||||||||||||||||||||||
|
||||||||||||||||||||||||||||||||
|
||||||||||||||||||||||||||||||||
|
1 | 2 | 1 | 3 | 1 |
-
1
ImageJ plugins;
-
2
Runs on MATLAB;
-
3
Runs on Java and mySQL.
2.2 Software description, download and execution
MigraR is a graphical user interface (GUI) software implemented in R using the Shiny framework. MigraR can be accessible online via the Shinyapps.io server 222https://nirbhaya-shaji.shinyapps.io/migrar/. It runs in MS WindowsTM, Linux and macOS and requires prior installation of RTM and RStudioTM from website [19]. MigraR time complexity is (), where is the data set length (all time steps of all the tracks).
MigraR sources can be downloaded from GitHub account333https://github.com/nirbhayashaji/MigraR.git. To execute MigraR, users must download the files server.R and ui.R to the working directory of RStudioTM and double click on the server.R file or open it using the file browser form RStudioTM. The file will open in RStudioTM, wherefrom it can be executed by clicking Run App [18]. MigraR will open in your default browser. To upload the cell tracking data, users simply have to click on the Browse button as seen in (Fig.1, top left) listed first on the left panel. Users must be connected to the internet for the initial run so that the required packages can be installed. From there, no active internet connection is necessary for executing the application. The images in the manuscript that corresponds to the MigraR screens are also available in the GitHub for viewing in better clarity. The data used for those images are also available at GitHub.
2.3 Data sets
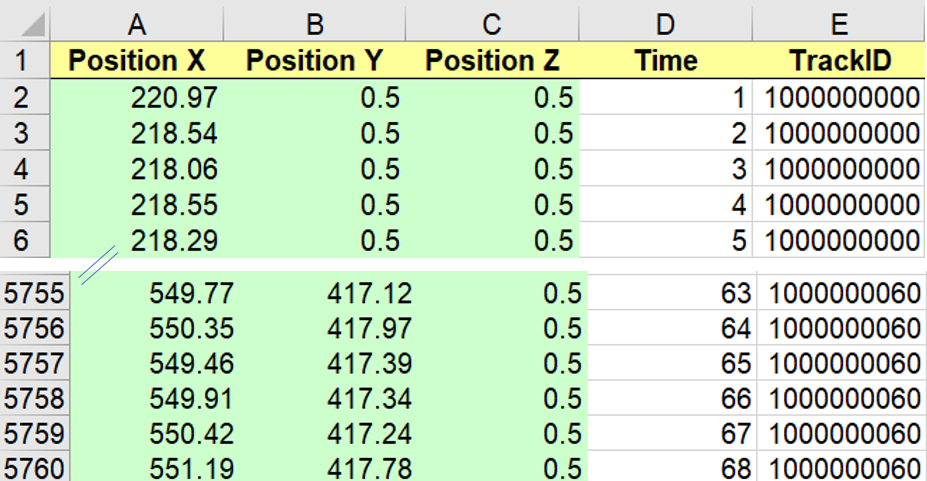
The data sources of MigraR are files (txt, csv or xlsx format) generated by dedicated cell-tracking software – an example (provided from ImarisTM) is shown in Fig.1. In these files, data must be organized in four columns , with the fixed titles (as shown in Fig.1) and in case of CSV files ’,’ separated as follows: column A) coordinates; column B) coordinates; column D) time; column E) TrackID (i.e., the cell track identifier, attributed by the cell tracking software). Note that decimal separator has to be ’.’. The value of TrackID cannot be 0. If it happens MigraR shows a warning message and will ask the user to change the TrackIDs to non zero values. Some cell tracking software might also deliver coordinates listed in one additional column – column C in the example of Fig.1. If the data file does not display coordinates, users must introduce one dummy (empty or randomly filled) column C. The upload of input files to MigraR is performed by clicking the Browse button below the Choose input file text as shown in Fig.2.

2.4 Computing temporal and spatial coordinates into migration metrics
MigraR is a digital platform that performs the visual and quantitative inspection of cells’ dynamic behavior. It is used after cells trajectories have been recorded by time-lapse microscopy and traced by dedicated cell tracking software. MigraR computes the resulting cells’ coordinates along in time, providing users a set of insightful graphical and quantitative outputs. MigraR performs a ’cell-based’ quantification of cell migration parameters, i.e., it carries out a calculation for each cell separately and, based on each individual result, determines the mean or median for the entire population of cells. This method is in contrast with ’step-based’ metrics, for which the mean or median of all separate movement steps are calculated independent of which track it belongs to. Detailed information about advantages and disadvantages of each quantification methods can be found in dedicated literature [5, 17]. We should stress that some relevant track analysis metrics, like mean squared displacement (MSD) or autocorrelation plots are not yet supported by MigraR [13]. One of MigraR functionalities is the graphical display of Rose plots. To draw these graphs, MigraR makes all tracks initiate from the (0,0) coordinate. To do so, the , coordinates at time zero (the first movie frame) of a given cell track are subtracted to all its , coordinates along time. MigraR also calculates the velocity and straightness of cell trajectories, employing the formulas provided in Table 2, and always taking into account the start and ending points of each cell trajectory. Straightness divides the displacement by the track Length. This gives a number between 0 and 1 (1 means a perfectly straight track). As we can see in Table2, we compute a step-based speed (with one number for each coordinate in the track) and a cell-based approach for the straightness where the total track displacement is divided by the distance travelled in time by the cell (just one number for each track) [13].
| Parameter | Equation | |||
| Velocity |
|
|||
|
|
||||
|
|
||||
|
|
||||
| Turning angle |
|
|||
|
|
||||
| Straightness |
|
|||
|
|
||||
|
|
||||
|
|
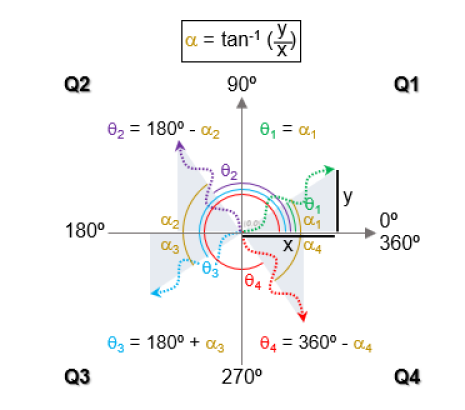
For calculation of the angle of trajectories (), MigraR takes into account , standard coordinates at the end point of the analysis and uses on the trigonometry equation presented in Fig.3. This calculation delivers the value of an angle (angle in Fig.3). Afterwards, MigraR makes the necessary adjustments according to the quadrant (Q1-Q4) of the , chart in which cells finalize their trajectories, as follows:
Q1 (x>0, y>0), 1 = 1;
Q2 (x<0, y>0), 2 = 180 - 2;
Q3 (x<0, y<0), 3 = 180 + 3;
Q4 (x>0, y<0), 4 = 360 - 4.
Angles of trajectories are displayed by MigraR in the form of histograms. In its current version, MigraR accommodate a band width adjustment tool for data refinement based on the number of data points and their distribution - this will avoid biased interpretations, which are particularly tricky in the case of datasets consisting of few cell tracks. For users looking for more refined methods to detect directionality, we suggest alternative tools [2, 24].
Finally, to have a visual representation of the direction of movement (left or right), MigraR calculates the cosine of , and attributes a color code to the resulting values. The cosine value of 1 (yellow color) indicates that cells move to the right, parallel to the axis; the cosine value of -1 (red color) indicates that cells move to the left, parallel to the axis; the cosine value of zero (orange color) indicates that cells move up or down. Similarly using the sin value, the vertical movement is represented using colors blue and green for up and down movements respectively.
2.5 Experimental details for the illustrative data sets used for this report
The illustrative data set used in this manuscript was obtained by time-lapse microscopy recording of migrating cells, following previously described methodology [21]. Briefly, murine bone marrow-derived dendritic cells (BMDCs) [1], pulsed for 3 hours with LPS were embedded in bovine type I collagen and loaded into a silicon chip mounted on a glass-bottom microscopy chamber slide. Upon polymerization of the collagen/cells mix, medium containing the chemokine CCL21 was added to the microscopy chamber slide. Videos were captured at 10 x magnification in an inverted Leica DMI 6000 FFW (LEICA Microsystems) microscope, equipped with an automated stage, and control of atmosphere (5% CO2, 37). The same points in multiple wells were imaged every 4 min for approximately 16 hrs. Movies were subsequently processed in Fiji/ImageJ software [22], prior to automated cell tracking in proprietary software ImarisTM (Bitplane).
3 Results and Discussion
3.1 The four (main) windows of MigraR
MigraR offers an intuitive graphical user interface for plotting and calculating cell migration parameters. MigraR automatically calculates velocity, straightness and direction of movement based on the spatial and temporal coordinates listed on the uploaded data file. The workflow of MigraR is organized in four windows (Trajectories, Velocity, Straightness, and Direction), which can be selected from the respective tabs at the top of the large right side panel (Fig.2). MigraR also have a window named DataTable that lets the user see the raw and calculated data that they are using.
The Trajectories window (accessible from the Trajectories tab). The Trajectories window depicts the visual projection of single-cell trajectories (Fig.2). These can be visualized according to three View Mode options, available on the left panel:
-
[i.]
-
1.
the Normal view mode is the default option, which provides a close-to-real projection of cell trajectories along the , axes;
-
2.
in the Track ID mode, individual cell trajectories are distinguished based on color;
-
3.
in the Rose Plot option, the starting positions of each cell trajectory are normalized to , origin (0,0). Scales of , axes can be adjusted using scroll bars on the bottom-right.
By clicking on the Download plot button at the bottom of the charts, users can download the plot as an image file of .png type.
The Velocity and Straightness windows (Fig.4) display box and whisker charters, plotted from the velocity and straightness values that MigraR computes for set of cell trajectories under analysis. Velocity values refer to the average velocity that each cell assumes along its trajectory. Straightness values refer to the behavior of each cell between the first and the last time point of its trajectory. By pressing the Download plot buttons, users can generate and save the plot as .png files. However, the analysis of tracking data is sensitive to biases and artefacts. The user must be careful when using measures like straightness, specially between different datasets [5], [17]. In particular, there is a warning message in the straightness analysis window that this analysis is meaningful for tracks of equal length.

Download the Velocity data and Download the Straightness data buttons generate .csv files listing the values of velocity and straightness displayed on the corresponding plots. These .csv files can be used for subsequent comparative and statistical analyses between different data sets using dedicated software.
The Direction window (Fig.5) is presented with two options, which can be chosen from the radio buttons on the left panel. On the first, Direction of Trajectories, users can visualize and download plots where cell trajectories appear in different colors based on the direction of the movement. These cell trajectories plots are available in both their Normal View and Rose Plot modes.
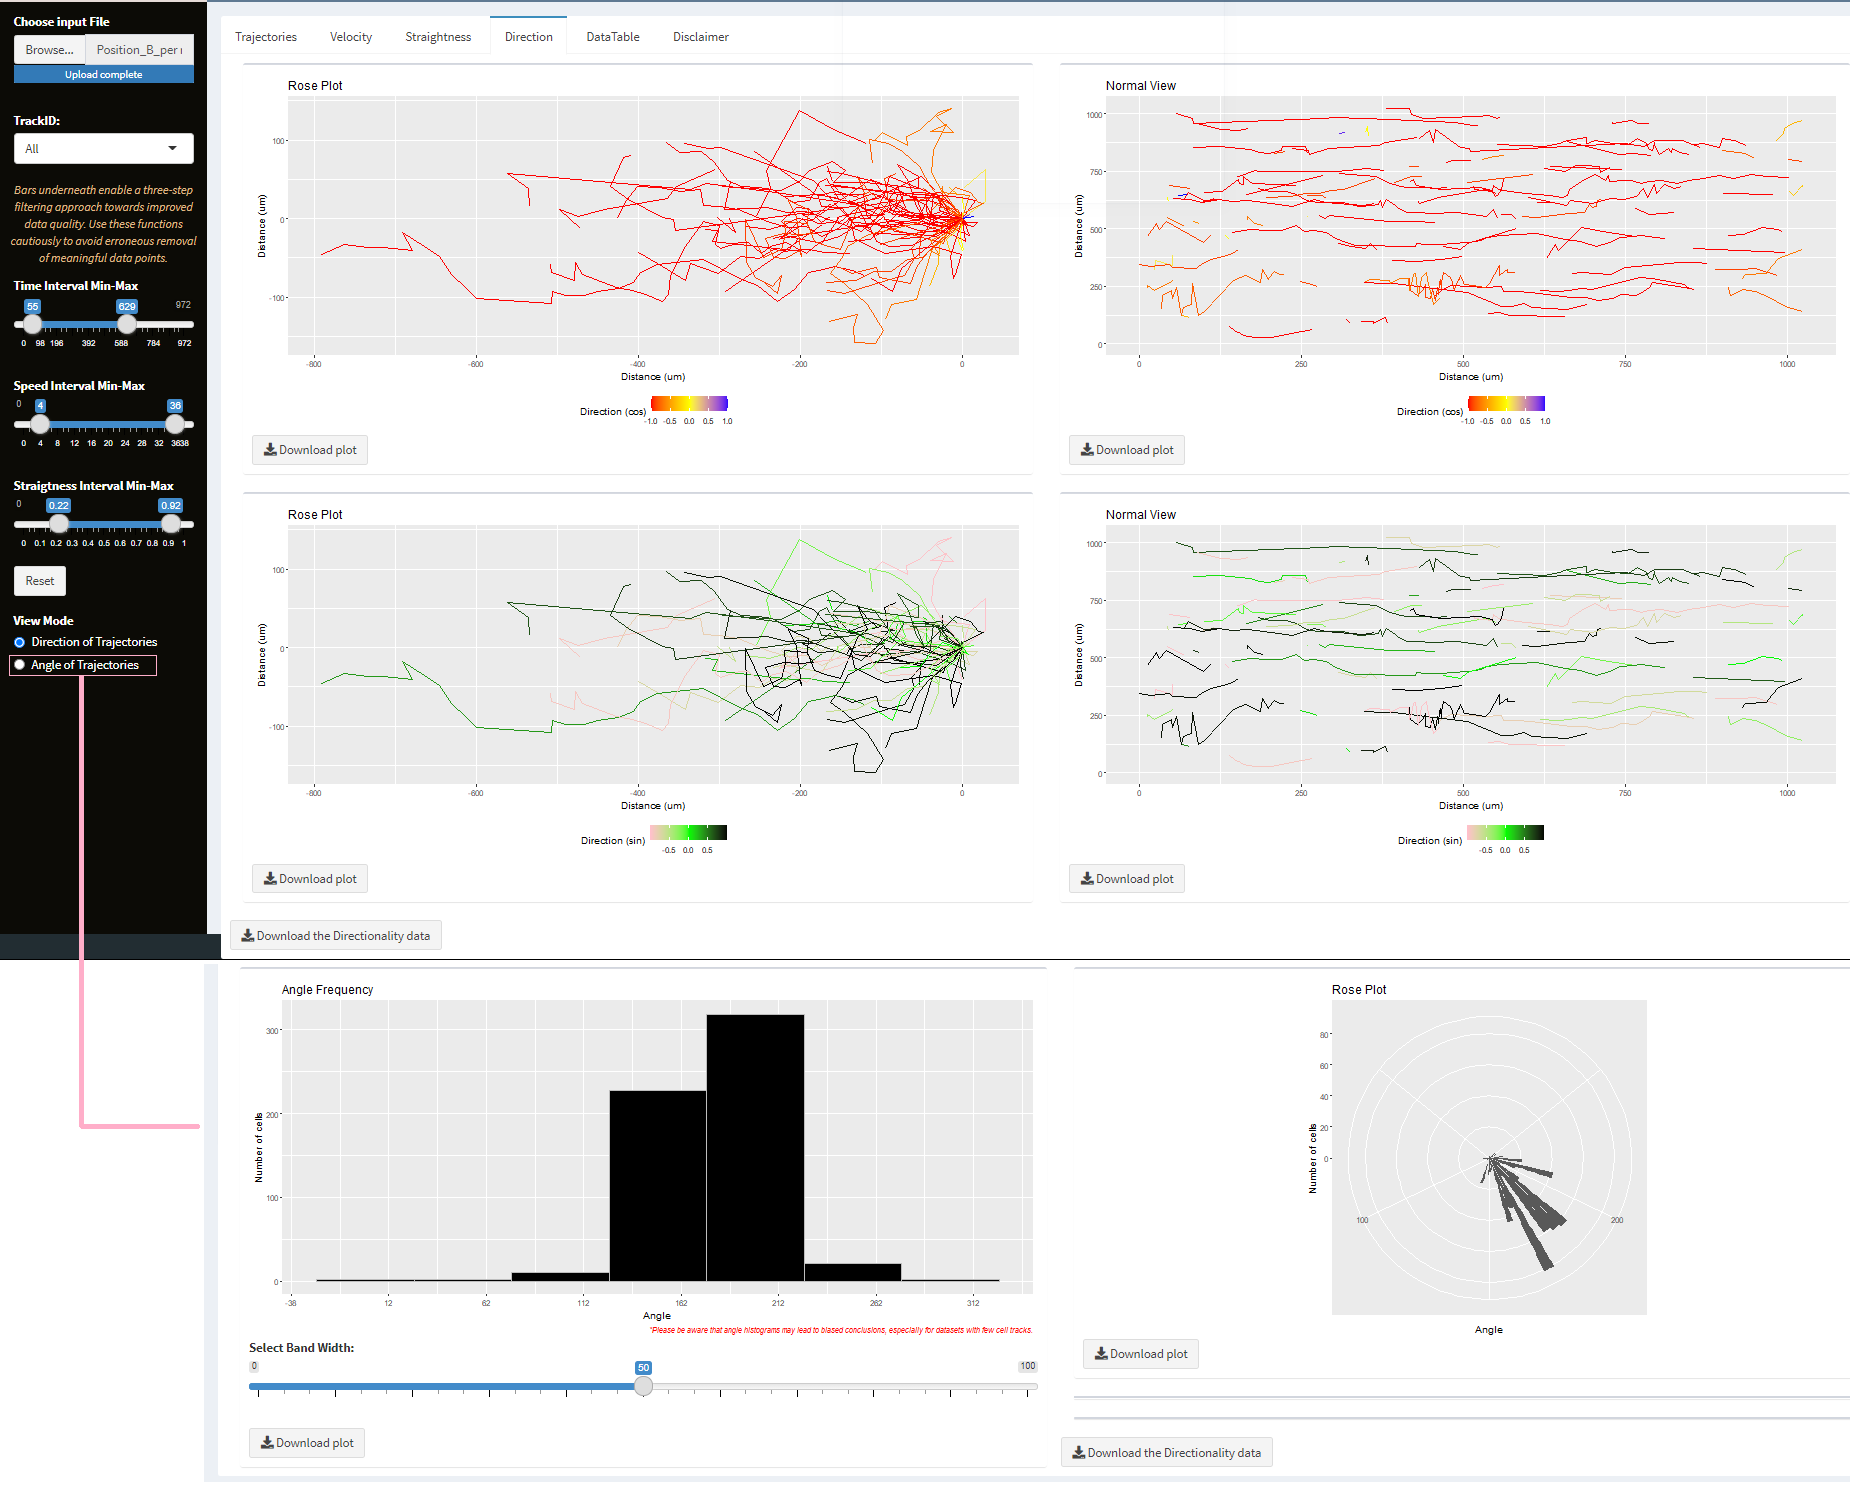
In the first pair of plots, cells are colored with a red-to-yellow gradient according to their horizontal directional choices: cells moving to the left are colored red; cells moving to the right are colored yellow. In the second pair of plots, cells are colored with a blue-to-green gradient according to their vertical directional choices: cells moving to the up are colored blue; cells moving to the down are colored green.
The second option, Angle of Trajectories, shows the frequency of cell trajectories moving within the range of angles, over intervals of 4 degrees. Data are plotted both as column chart (Angle Frequency) and Rose Plot. These plots, as well as the corresponding data sets are available for download using buttons similar to the ones in the previous windows. It will be useful if these features were complemented with common track analysis methods not yet included in the tool, displacement analysis, such as mean square displacement (MSD), and angle analysis, direction autocorrelation [13].
3.2 Visualizing Directional and Random movements
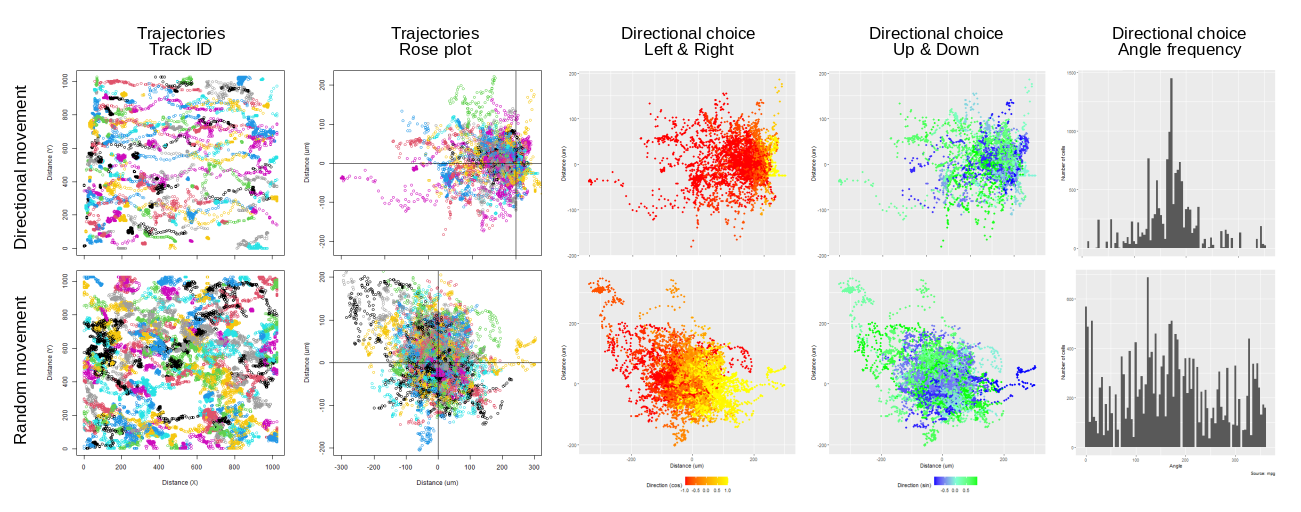
In Fig.6, we show representative graphical outputs generated by MigraR, starting from two distinct sets of data: one of the datasets (upper panels, ‘Directional movement’) compiles the trajectories of cells exposed to a chemoattractant placed on their left; the other dataset (lower panels, ‘Random movement’) refers to cells that, in the absence of a specific migratory stimulus, moved randomly. Notably, all five graphical displays produced by MigraR translate the different directional choices of cells in each of the experimental conditions under analysis.
3.3 The adjustments function of MigraR
All MigraR windows run in parallel with adjustment functions, which can be operated from the left side panel of the graphical interface. Here, users can find three sliders to filter the data sets based on the following parameters: Time, Velocity (Speed), and Straightness as shown in Fig.5. Artifacts are unavoidable in data sets generated by high throughput analysis [12]. Applying limits or thresholds on these variables is thus desired when cell tracking has been performed fully automatically, albeit it needs to be performed cautiously to avoid elimination of relevant data points. With MigraR adjustment functions, users can refine their data sets to exclude outliers resulting from inaccurate tracking [e.g. cells that do not move (most likely dead cells), or to cells that move too fast and/or move with straightness values equal to 1 (corresponding to straight lines, unlikely to occur in nature)]
Particularly useful is the possibility to filter data sets based on time intervals – with this option, users can look into the dynamics of cell migration at different instants of movie acquisition and chose the most appropriate interval for their analysis. A Reset button, at the bottom of this panel, allows users to go back to the original data set. Importantly, these scroll bars work inter-connectedly between windows, i.e. scrolling one of these bars in one window automatically adjusts the same scroll bar in the remaining windows.
4 Conclusion
Cell migration is an increasingly trendy area of research - related publications grew from 1 per year in the early 1970’s to >21’000 last year - with potential applications in several branches of health and biological sciences. Powerful commercial tools are available to assist researchers in the complex analysis, visualization and quantification of cell migration. These are nonetheless commercialized at prohibitive prices to groups with poor financial resources. As alternative, researchers can resort to open-source solutions, some of which not requiring computational experience (MotilityLab/CelltrackR [26, 27], CellMissy [14] or Ibidi [9]). We expect to democratize the use of cell migration solution with MigraR, a user-friendly, free solution and open-source to all end-users, which has been developed to meet the needs of a group of biomedical researchers.
As future work, we intend to include some other usual features not yet supported by MigraR.
Acknowledgements.This work is financed by National Funds through the Portuguese funding agency, FCT- Fundação para a Ciência e a Tecnologia, within project UIDB / 50014 / 2020.
References
- Aman and Piotrowski [2010] Aman, A., Piotrowski, T., 2010. Cell migration during morphogenesis. Developmental Biology 341, 20–33. doi:https://doi.org/10.1016/j.ydbio.2009.11.014. special Section: Morphogenesis.
- Ariotti et al. [2015] Ariotti, S., Beltman, J.B., Borsje, R., Hoekstra, M.E., Halford, W.P., Haanen, J.B.A.G., de Boer, R.J., Schumacher, T.N.M., 2015. Subtle cxcr3-dependent chemotaxis of ctls within infected tissue allows efficient target localization. The Journal of Immunology 195, 5285–5295. URL: https://www.jimmunol.org/content/195/11/5285, doi:10.4049/jimmunol.1500853.
- Barry DJ [2015] Barry DJ, Durkin CH, A.J.W.M., 2015. Open source software for quantification of cell migration, protrusions, and fluorescence intensities. J Cell Biol. 1, 163–80. URL: https://bitbucket.org/djpbarry/, doi:10.1083/jcb.201501081.
- Becker [2019] Becker, T., 2019. migrationminer. URL: https://github.com/cells2numbers/migrationminer.
- Beltman JB [2009] Beltman JB, Marée AF, d.B.R., 2009. Analysing immune cell migration. Nat Rev Immunol. 9, 789–98. doi:10.1038/nri2638.
- Botelho [2019] Botelho, H., 2019. shinyhtm. URL: https://github.com/hmbotelho/shinyHTM.
- Bros et al. [2019] Bros, Haas, Moll, Grabbe, 2019. Rhoa as a key regulator of innate and adaptive immunity. Cells 8, 733. URL: http://dx.doi.org/10.3390/cells8070733, doi:10.3390/cells8070733.
- Chen et al. [2020] Chen, Y., Jiang, W., Yong, H., He, M., Yang, Y., Deng, Z., Li, Y., 2020. Macrophages in osteoarthritis: pathophysiology and therapeutics. Am J Transl Res 12, 261–268.
-
[9]
Ibidi, .
Chemotaxis analysis, manual tracking.
http://rsb.info.nih.gov/ij/plugins/track/track.html/. - Jaqaman et al. [2008] Jaqaman, K., Loerke, D., Mettlen, M., Kuwata, H., Grinstein, S., Schmid, S.L., Danuser, G., 2008. Robust single-particle tracking in live-cell time-lapse sequences - nature methods. Nat Meth 5, 695–702. URL: http://dx.doi.org/10.1038/nmeth.1237.
- L. [2019] L., S., 2019. Collective cell migration in development. Adv Exp Med Biol. 1146, 105–116.
- Masuzzo et al. [2017] Masuzzo, P., Huyck, L., Simiczyjew, A., Ampe, C., Van Troys, M., Martens, L., 2017. An end-to-end software solution for the analysis of high-throughput single-cell migration data. Scientific Reports 7. doi:10.1038/srep42383.
- Masuzzo et al. [2015] Masuzzo, P., Van Troys, M., Ampe, C., Martens, L., 2015. Taking aim at moving targets in computational cell migration. Trends in cell biology 26. doi:10.1016/j.tcb.2015.09.003.
- Masuzzo P. [2013] Masuzzo P., Hulstaert N., H.L.A.C.V.T.M.M.L., 2013. Cellmissy: A tool for management, storage and analysis of cell migration data produced in wound healing-like assays bioinformatics. Bioinformatics doi:10.1093/bioinformatics/btt437.
- McDonald et al. [2009] McDonald, B., Spicer, J., Giannais, B., Fallavollita, L., Brodt, P., Ferri, L.E., 2009. Systemic inflammation increases cancer cell adhesion to hepatic sinusoids by neutrophil mediated mechanisms. International Journal of Cancer 125, 1298–1305. doi:https://doi.org/10.1002/ijc.24409.
- McQuin C [2018] McQuin C, Goodman A, C.V.K.L.C.B.K.K., 2018. Cellprofiler 3.0: Next-generation image processing for biology. Nature Methods 16, 7. doi:10.1371/journal.pbio.2005970.
- Mokhtari et al. [2013] Mokhtari, Z., Mech, F., Zitzmann, C., Hasenberg, M., Gunzer, M., Figge, M.T., 2013. Automated characterization and parameter-free classification of cell tracks based on local migration behavior. PLOS ONE 8, 1–20. URL: https://doi.org/10.1371/journal.pone.0080808, doi:10.1371/journal.pone.0080808.
- [18] RStudio, . Relaunching apps. URL: https://shiny.rstudio.com/tutorial/written-tutorial/lesson1/#relaunching-apps.
- RStudio Team [2020] RStudio Team, 2020. RStudio, PBC. URL: http://www.rstudio.com/.
- Sacan et al. [2008] Sacan, A., Ferhatosmanoglu, H., Coskun, H., 2008. Celltrack: An open-source software for cell tracking and motility analysis. Bioinformatics (Oxford, England) 24, 1647–9. doi:10.1093/bioinformatics/btn247.
- Saez et al. [2018] Saez, P., Barbier, L., Attia, R., Thiam, H.R., Piel, M., Vargas, P., 2018. Leukocyte migration and deformation in collagen gels and microfabricated constrictions. Methods in molecular biology (Clifton, N.J.) 1749, 361–373. doi:10.1007/978-1-4939-7701-7_26.
- Schneider et al. [2012] Schneider, C., Rasband, W., Eliceiri, K., 2012. Nih image to imagej: 25 years of image analysis. Nature Methods 9. doi:10.1038/nmeth.2089.
- Schneider C. A. [2019] Schneider C. A., Rasband W. S., E.K.W., 2019. Nih image to imagej: 25 years of image analysis. Nature methods 7, 671–675. doi:10.1038/nmeth.2019.
- Textor et al. [2011] Textor, J., Peixoto, A., Henrickson, S.E., Sinn, M., von Andrian, U.H., Westermann, J., 2011. Defining the quantitative limits of intravital two-photon lymphocyte tracking. Proc Natl Acad Sci U S A 30. doi:0.1073/pnas.1102288108.
- Tinevez et al. [2017] Tinevez, J.Y., Perry, N., Schindelin, J., Hoopes, G.M., Reynolds, G.D., Laplantine, E., Bednarek, S.Y., Shorte, S.L., Eliceiri, K.W., 2017. Trackmate: An open and extensible platform for single-particle tracking. Methods 115, 80–90. doi:https://doi.org/10.1016/j.ymeth.2016.09.016. image Processing for Biologists.
- Wortel et al. [2021] Wortel, I.M., Liu, A.Y., Dannenberg, K., Berry, J.C., Miller, M.J., Textor, J., 2021. Celltrackr: an r package for fast and flexible analysis of immune cell migration data. ImmunoInformatics , 100003URL: https://www.sciencedirect.com/science/article/pii/S2667119021000033, doi:https://doi.org/10.1016/j.immuno.2021.100003.
- Wortel et al. [2019] Wortel, I.M.N., Dannenberg, K., Berry, J.C., Miller, M.J., Textor, J., 2019. Celltrackr: an r package for fast and flexible analysis of immune cell migration data. bioRxiv URL: https://www.biorxiv.org/content/early/2019/06/15/670505, doi:10.1101/670505.