An unlikely survivor: a low-density hot Neptune orbiting a red giant star
Hot Neptunes, gaseous planets smaller than Saturn ( 3-8 R⊕) with orbital periods less than 10 days, are rare. Models predict this is due to high-energy stellar irradiation stripping planetary atmospheres over time, often leaving behind only rocky planetary cores. We present the discovery of a 6.2 R⊕(0.55 RJ), 19.2 M⊕(0.060 MJ) planet transiting a red giant star every 4.21285 days. The old age and high equilibrium temperature yet remarkably low density of this planet suggests that its gaseous envelope should have been stripped by high-energy stellar irradiation billions of years ago. The present day planet mass and radius suggest atmospheric stripping was slower than predicted. Unexpectedly low stellar activity and/or late-stage planet inflation could be responsible for the observed properties of this system.
One Sentence Summary:
An outlier among outliers, this discovery suggests hot Neptunes can retain atmospheres much longer than previously thought.
Main Manuscript
Over the last 30 years, the discovery of over 5,000 exoplanets has revealed that planetary system architectures are incredibly diverse (?, ?). One of the most striking demographic features of this sample is the dearth of planets with masses and radii similar to Neptune on short periods (?). Star-planet interactions, including atmospheric effects like inflation (?) and photoevaporation (?) and orbital processes like high-eccentricity migration (?, ?), have been proposed to be responsible for this feature of planet demographics.
The Transiting Exoplanet Survey Satellite (TESS) has successfully confirmed more than 100 planets with orbital periods less than 10 days since 2018 (?). Several of these planets have shown clear evidence for radius inflation (?, ?, ?). Others are expected to have undergone significant atmospheric mass loss in their lifetimes (?, ?). As inflated planets are more susceptible to mass loss, a process that continues over the lifetime of the planet, the characterization of inflated planets around post-main sequence, evolved (T 6000 K, R 2 R⊙) stars nearing the end of their lives can constrain timescales for planetary mass loss and inflation mechanisms. Evidence for extended atmospheres of inflated planets transiting evolved stars has already been identified (?).
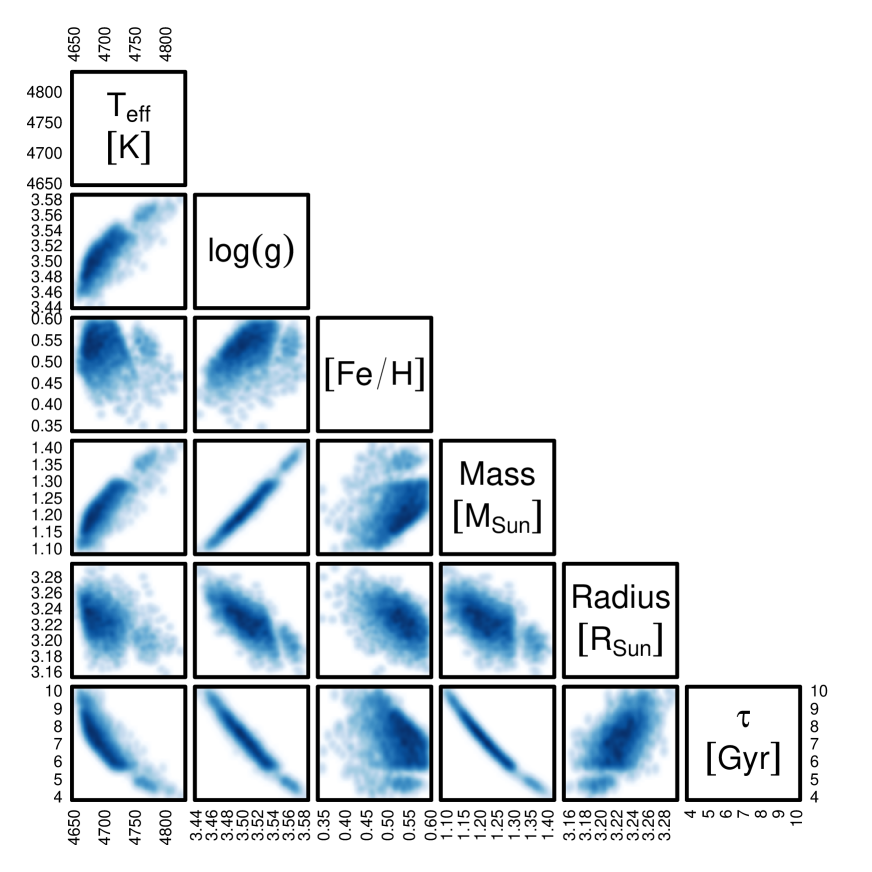
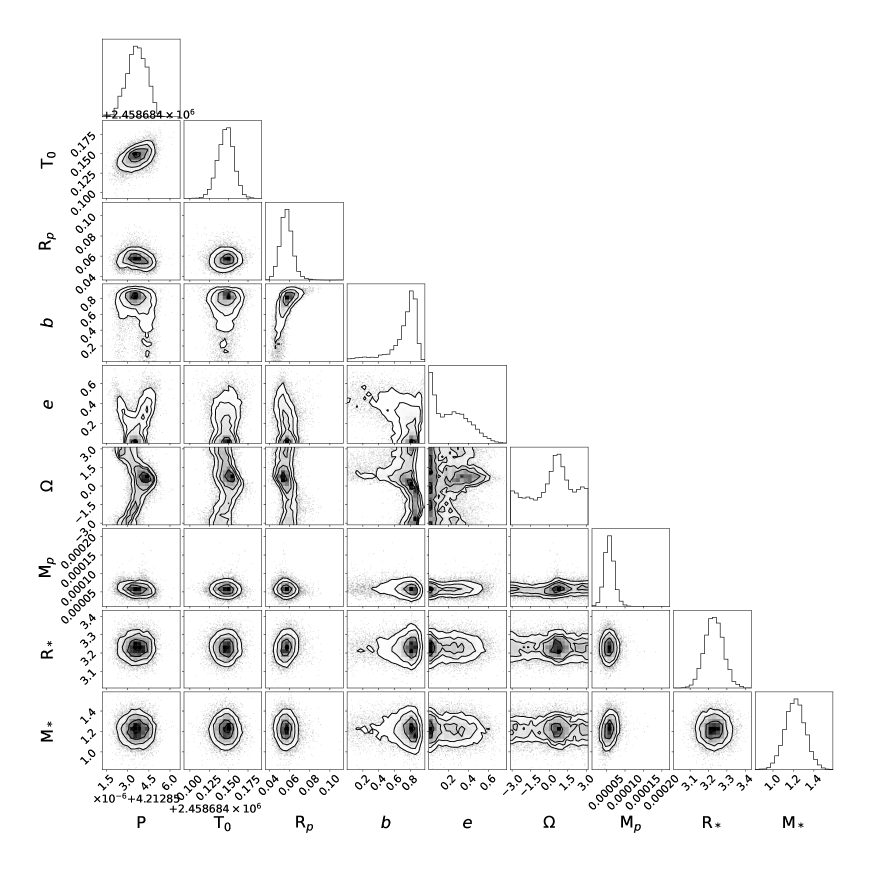
TIC 365102760 is an evolved star at the base of the red giant branch that was observed by TESS between 2019-Jul-18 and 2022-Sep-30. An initial box least squares (BLS) analysis (?) of the giants light curve revealed a planet candidate with orbital period 4.2 days and radius of 6.5 R⊕. We then flagged this planet candidate as a Community TESS Object of Interest (CTOI) on 2021-05-13. We determined a stellar mass of , a stellar radius of , and an age of 7.2 1.4 Gyr for this system using a combination of photometric, astrometric, and spectroscopic data sets (see Supplementary Materials for details). A subsequent joint analysis of the radial velocity and giants light curve data using the exoplanet software package (?) and our determinations of stellar parameters reveals a mass of and radius of for TIC 365102760 b, confirming the planetary nature of these signals (Figure 1, Table S3).
We find that based on its mass, radius and orbital period, TIC 365102760 b is a member of the relatively rare hot Neptune planet population (?, ?, ?). Using the fitted values of and as the mass and radius for this planet, we determine a planet density of 0.437 g cm-3, among the lowest densities yet measured for a hot Neptune. We also use our constraints on stellar mass, metallicity, and luminosity, and use MIST evolutionary tracks (?) to determine the current incident flux and incident flux history of this planet, assuming the planet has not migrated since the star reached an age of 20 Myr. We find that this planet is one of fewer than five currently known Neptunian (3-8 R⊕) planets orbiting post-main sequence, or evolved (T 6000 K, R 2 R⊙) stars, and is the only hot Neptune (3-8 R⊕, 10 d) known in an evolved system (see Figure 2).
We then use previously established relations between stellar bolometric flux and XUV flux as a function of stellar age (?) to estimate the current XUV flux as well as the XUV flux history of TIC 365102760 b (for more details, see Supplementary Materials). We use these XUV flux estimates to determine the instantaneous rates of mass loss from this planet over its lifetime using a modified version of the “energy-limited mass loss” equation (?, ?):
| (1) |
where represents the planetary mass loss rate, is the efficiency of XUV evaporation from the planet, is the stellar flux in high-energy, X-ray and ultraviolet wavelengths, is the gravitational constant, and is the mean planetary mass density. The correction factor which accounts for the fact that atmospheric compounds only need to reach the planet’s Roche lobe radius to escape the planetary atmosphere (?):
| (2) |
where, following the small planet-to-star mass ratio approximation,
| (3) |
We estimated as a function of at each time step following the analytical approximation of (?), allowing us to determine instantaneous mass loss rates for all of the planets in our sample. We then integrate these instantaneous mass loss rates over the lifetime of these planets using MIST stellar evolutionary tracks to determine the total fraction of mass lost by TIC 365102760 b over its lifetime relative to other known planetary systems, assuming planet formation and migration is complete after 20 Myr of stellar evolution. We compare the expected cumulative fraction of mass lost as a function of planet radius for systems with ages and well-characterized planet masses and radii in Figure 3.
Using this formulation for atmospheric mass loss, we find that approximately 65% of the current planet mass should have been lost over its lifetime (assuming that the planet radius has not changed over time), in good agreement with the fraction of mass loss inferred through an analytic approximation (?).
In order to confirm this cumulative atmospheric loss, we also determine the energy-limited mass loss rate using a more simplified equation taken from (?):
| (4) |
where represents an XUV heating efficiency (we conservatively assume 0.1 (?, ?)), is the effective absorption radius of the planet in XUV, and the other variables are the same as defined above. We assume an effective XUV absorption radius RXUV = 1.1 Rp based on previous estimates (?), which is likely an underestimate for this planet given its relatively low density and gravitational potential (?, ?). Using this conservative approach, we determine a cumulative mass loss fraction of 24% for this planet.
Though the actual fraction of mass loss is difficult to estimate accurately (?), our predictions suggest that no currently known Neptune-sized or larger planets are expected to have experienced higher fractional amounts of mass loss than TIC 365102760 b. Overall, only three well-characterized planets with measured ages are expected to have experienced more fractional mass loss than TIC 365102760 b (?, ?, ?). All of these planets are rocky, and thus any primordial atmosphere that might have existed has likely been stripped from them. Interestingly, although Jupiter-sized planets are predicted to be more resilient to mass loss than Neptune-sized planets (?, ?), no well-characterized Jupiter-sized exoplanets with measured ages listed on the NASA Exoplanet Archive are expected to have undergone such a high fraction of atmospheric mass loss as TIC 365102760 b.
Models predict that 20-30% of TIC365102760 b’s mass should be contained in its gaseous envelope based on its incident flux, mass and radius (?, ?). Thus, assuming that the planet did not experience migration or inflation after a system age of 20 Myr, most or all of the planet’s atmosphere should have been stripped over its lifetime (?). However, as the planet’s mass and radius imply it must have a gaseous envelope today, the planet may have had a much larger atmospheric mass in the past (and thus a much larger atmospheric mass fraction, implying higher fractional mass loss). Such a large atmospheric mass would also imply a planetary metallicity and core mass much lower than expected for a planet in this mass range (?, ?).
Alternatively, TIC 365102760 b may have avoided such a high fraction of atmospheric mass loss through a number of scenarios, the simplest of which we consider here. First, the stellar flux in XUV may be significantly lower or absorbed less efficiently than existing models predict (?, ?), preventing severe atmospheric erosion even if the planet has not changed its orbit or radius since formation. We note that we find a stellar spectral activity measure log (R’HK) = -5.4 for our high-resolution spectroscopic observations of TIC 365102760, marginally lower than similar intermediate-mass, evolved planet host stars. XUV irradiation from an intermediate-mass star such as TIC 365102760 is expected to be over an order of magnitude stronger than the Sun, larger than the difference in XUV flux on the main sequence for the models used here, but the range in measured activity level for intermediate-mass main sequence planet hosts spans more than an order of magnitude (?, ?). Correlations between stellar activity levels and expected atmospheric erosion of other planets could help to validate this hypothesis. Mass loss could also be less efficient than models predict in this planet due to metal line cooling (?), magnetic suppression (?), or suppression via stellar winds (?), although these effects are not expected to dominate the mass loss rate for the stellar mass and planet mass present in this system.
Second, the planet may have migrated to its current orbit during the main sequence lifetime of its host star from a previous larger orbit, avoiding the highest intensity of XUV irradiation from its host star. Both star-planet and planet-planet interactions could result in orbit reconfiguration. However, the absence of any transit timing variations, astrometric noise (?) or additional radial velocity signal or trend suggests that there are no other planets relatively near to TIC 365102760 b in this system, suggesting that recent planet-planet interactions are not likely. Furthermore, TIC 365102760 b does not appear to have a high-eccentricity orbit, suggesting that migration due to star-planet interaction is also unlikely or not very recent in the system’s history (?). Better constraints on the eccentricity via additional radial velocity followup, or constraint of the obliquity of the planetary orbit relative to the stellar spin axis could also support or refute evidence for orbital migration (?).
Finally, the planet may have been significantly smaller in the past, limiting the instantaneous rate of mass loss on the main sequence. Our estimates of cumulative mass loss assume no change in planet radius as a function of time, which is not expected for planets in this mass and temperature regime experiencing significant mass loss (?). Atmospheric mass loss tends to shrink planets over time in this mass and temperature regime, resulting in more mass loss than what we assume in Figure 3. However, if we assume the recent increase in irradiation received by this planet due to post-main sequence evolution could have resulted in rapid re-inflation of this planet (?), this implies a smaller radius for the planet when TIC 365102760 was on the main sequence.
Following the formulation of (?) and assuming a late-stage inflation efficiency comparable to what has been observed in other systems (?), we can model changes in the radius of TIC 365102760 b over the lifetime of the system. We compare this to an atmospheric mass loss model of the planet radius following (?) assuming an initial planet mass of 29.2 M⊕ and planet metallicity fraction of 0.8. We show the expected radius evolution as a function of time for both of these scenarios using the observed planet mass, radius and age in Figure 4. We note that at 1 Gyr, the inflated planet model radius is 16% smaller than the current radius, while the atmospheric mass loss model radius is 5% larger. As the atmospheric mass loss rate depends on the density of the planet, this implies a 50% reduction in instantaneous mass loss at that time for the late-stage inflation model relative to the atmospheric mass loss model. Since stellar XUV irradiation is maximized at ages of 1 Gyr or less, this implies a similar 50% reduction of total atmospheric mass loss of the planet if it has inflated during post-main sequence evolution.
Current observational evidence for both late-stage inflation and/or weak photoevaporation is stronger than evidence for late-stage migration in this system. As our toy model of planet radius inflation would still result in more atmospheric mass loss than the total atmospheric mass expected for a planet of this temperature and radius, and the XUV flux of intermediate-mass stars is predicted to be stronger than what was inferred here, this implies both a lower-than-expected level of XUV irradiation and late-stage inflation contribute to the continued existence of this planet’s atmosphere. It is also possible that the planet both lost a significant amount of mass during the main sequence via photoevaporation and subsequently became inflated during post-main sequence evolution.
The discovery of a low-density hot Neptune orbiting an evolved star demonstrates that the atmospheres of these planets are more resilient than previously thought. Furthermore, it demonstrates that planets that are smaller than Jupiter in size may be inflated directly by irradiation from their host stars. This has important implications for understanding the structure and evolution of Neptune-sized planets, and interpreting the demographics of the known planet population. Finding more evolved, hot, Neptune-sized planets at different masses and densities may reveal additional trends with planet composition or stellar activity. Focused searches for these evolved systems are necessary as these planets are missed by general searches for transiting planets (e.g., (?)). Additional observations of TIC 365102760 b using ground-based and space-based spectroscopic approaches may reveal atmospheric outflows from this planet, better constraining the lifetime of its atmosphere as well as its atmospheric composition. An extended atmosphere potentially indicative of outflow has already been detected via sodium D line transmission in another evolved, inflated planet, KELT-11 b (?), though at levels lower than initially expected. This may be due to high-altitude clouds, which may be related to silicate cloud production resulting from rapid planet re-inflation (?, ?). Constraining the balance between planet atmospheric inflation and mass loss will help reveal the evolution of planetary atmospheres over time, clarifying planet demographic features such as the hot Neptune desert.
References
- 1. T. A. Berger, D. Huber, E. Gaidos, J. L. van Saders, L. M. Weiss, AJ 160, 108 (2020).
- 2. L. J. Rosenthal, et al., ApJS 255, 8 (2021).
- 3. T. Mazeh, T. Holczer, S. Faigler, A&A 589, A75 (2016).
- 4. T. Guillot, A. Burrows, W. B. Hubbard, J. I. Lunine, D. Saumon, ApJ 459, L35 (1996).
- 5. A. Vidal-Madjar, et al., ApJ 604, L69 (2004).
- 6. T. Matsakos, A. Königl, ApJ 820, L8 (2016).
- 7. J. E. Owen, D. Lai, MNRAS 479, 5012 (2018).
- 8. N. M. Guerrero, et al., ApJS 254, 39 (2021).
- 9. J. E. Rodriguez, et al., AJ 161, 194 (2021).
- 10. S. W. Yee, et al., AJ 164, 70 (2022).
- 11. S. K. Grunblatt, et al., AJ 163, 120 (2022).
- 12. J. S. Jenkins, et al., Nature Astronomy 4, 1148 (2020).
- 13. C. M. Persson, et al., A&A 666, A184 (2022).
- 14. D. Mounzer, et al., A&A 668, A1 (2022).
- 15. G. Kovács, S. Zucker, T. Mazeh, A&A 391, 369 (2002).
- 16. D. Foreman-Mackey, et al., Journal of Open Source Software 6, 3285 (2021).
- 17. D. J. Armstrong, et al., Nature 583, 39 (2020).
- 18. J. Choi, et al., ArXiv e-prints (2016).
- 19. G. W. King, P. J. Wheatley, MNRAS 501, L28 (2021).
- 20. A. J. Watson, T. M. Donahue, J. C. G. Walker, Icarus 48, 150 (1981).
- 21. A. Caldiroli, et al., A&A 663, A122 (2022).
- 22. N. V. Erkaev, et al., A&A 472, 329 (2007).
- 23. S. Vissapragada, et al., AJ 164, 234 (2022).
- 24. V. I. Shematovich, D. E. Ionov, H. Lammer, A&A 571, A94 (2014).
- 25. M. Salz, S. Czesla, P. C. Schneider, J. H. M. M. Schmitt, A&A 586, A75 (2016).
- 26. R. A. Murray-Clay, E. I. Chiang, N. Murray, ApJ 693, 23 (2009).
- 27. A. F. Krenn, L. Fossati, D. Kubyshkina, H. Lammer, A&A 650, A94 (2021).
- 28. A. Pai Asnodkar, et al., AJ 163, 40 (2022).
- 29. G. Frustagli, et al., A&A 633, A133 (2020).
- 30. L. M. Weiss, et al., AJ 161, 56 (2021).
- 31. L. M. Serrano, et al., Nature Astronomy 6, 736 (2022).
- 32. J. E. Owen, Y. Wu, ApJ 847, 29 (2017).
- 33. E. D. Lopez, J. J. Fortney, ApJ 792, 1 (2014).
- 34. H. Chen, L. A. Rogers, ApJ 831, 180 (2016).
- 35. D. P. Thorngren, J. J. Fortney, R. A. Murray-Clay, E. D. Lopez, ApJ 831, 64 (2016).
- 36. E. J. Lee, ApJ 878, 36 (2019).
- 37. J. E. Owen, Annual Review of Earth and Planetary Sciences 47, 67 (2019).
- 38. L. Fossati, et al., ApJ 868, L30 (2018).
- 39. K. France, et al., ApJS 239, 16 (2018).
- 40. J. E. Owen, A. P. Jackson, MNRAS 425, 2931 (2012).
- 41. J. E. Owen, F. C. Adams, MNRAS 444, 3761 (2014).
- 42. L. Wang, F. Dai, ApJ 914, 99 (2021).
- 43. Gaia Collaboration, et al., ArXiv e-prints (2018).
- 44. E. Villaver, M. Livio, A. J. Mustill, L. Siess, ApJ 794, 3 (2014).
- 45. V. Bourrier, et al., A&A 669, A63 (2023).
- 46. D. P. Thorngren, E. J. Lee, E. D. Lopez, arXiv e-prints p. arXiv:2211.11770 (2022).
- 47. D. P. Thorngren, J. J. Fortney, E. D. Lopez, T. A. Berger, D. Huber, ApJ 909, L16 (2021).
- 48. S. K. Grunblatt, et al., AJ 154, 254 (2017).
- 49. S. K. Grunblatt, et al., AJ 165, 44 (2023).
- 50. P. Gao, et al., Nature Astronomy 4, 951 (2020).
- 51. K. G. Stassun, et al., AJ 158, 138 (2019).
- 52. S. K. Grunblatt, et al., AJ 158, 227 (2019).
- 53. N. Saunders, et al., AJ 163, 53 (2022).
- 54. A. D. Feinstein, et al., PASP 131, 094502 (2019).
- 55. J. M. Jenkins, et al., ApJ 713, L87 (2010).
- 56. J. M. Jenkins, et al., Software and Cyberinfrastructure for Astronomy IV (2016), vol. 9913 of Proc. SPIE, p. 99133E.
- 57. S. S. Vogt, et al., Instrumentation in Astronomy VIII, D. L. Crawford, E. R. Craine, eds. (1994), vol. 2198 of Proc. SPIE, p. 362.
- 58. K. El-Badry, H.-W. Rix, T. M. Heintz, MNRAS 506, 2269 (2021).
- 59. E. A. Petigura, Prevalence of Earth-size Planets Orbiting Sun-like Stars, Ph.D. thesis, University of California, Berkeley (2015).
- 60. D. Huber, et al., ApJ 844, 102 (2017).
- 61. B. Paxton, et al., ApJS 192, 3 (2011).
- 62. A. Dotter, ApJS 222, 8 (2016).
- 63. J. A. Johnson, et al., ApJ 665, 785 (2007).
- 64. J. A. Johnson, K. M. Aller, A. W. Howard, J. R. Crepp, PASP 122, 905 (2010).
- 65. J. Tayar, Z. R. Claytor, D. Huber, J. van Saders, ApJ 927, 31 (2022).
- 66. D. Foreman-Mackey, et al., exoplanet-dev/exoplanet v0.3.2 (2020).
- 67. D. M. Kipping, MNRAS 435, 2152 (2013).
- 68. V. Van Eylen, et al., The Astronomical Journal 157, 61 (2019).
- 69. S. K. Grunblatt, et al., AJ 152, 185 (2016).
- 70. D. Huber, et al., AJ 157, 245 (2019).
- 71. A. Khandelwal, et al., MNRAS 509, 3339 (2022).
- 72. R. A. Wittenmyer, et al., AJ 163, 82 (2022).
- 73. J. H. Hamer, K. C. Schlaufman, AJ 158, 190 (2019).
- 74. O. Attia, et al., A&A 647, A40 (2021).
- 75. A. Chontos, et al., AJ 157, 192 (2019).
- 76. T. D. Komacek, D. P. Thorngren, E. D. Lopez, S. Ginzburg, ApJ 893, 36 (2020).
- 77. C. L. Brinkman, et al., AJ 165, 88 (2023).
- 78. B.-O. Demory, S. Seager, ApJS 197, 12 (2011).
- 79. S. Millholland, ApJ 886, 72 (2019).
- 80. S. Millholland, E. Petigura, K. Batygin, ApJ 897, 7 (2020).
- 81. D. P. Thorngren, J. J. Fortney, AJ 155, 214 (2018).
- 82. E. Villaver, M. Livio, ApJ 705, L81 (2009).
- 83. K. C. Schlaufman, N. D. Halpern, ApJ 921, 24 (2021).
- 84. C. P. Johnstone, H. Lammer, K. G. Kislyakova, M. Scherf, M. Güdel, Earth and Planetary Science Letters 576, 117197 (2021).
- 85. B. Jackson, P. Arras, K. Penev, S. Peacock, P. Marchant, ApJ 835, 145 (2017).
- 86. T. T. Koskinen, et al., ApJ 929, 52 (2022).
- 87. B. M. Kilpatrick, et al., AJ 156, 103 (2018).
- 88. K. D. Colón, et al., AJ 160, 280 (2020).
- 89. G. Stefansson, et al., ApJ 848, 9 (2017).
- 90. J. P. Gardner, et al., Space Sci. Rev. 123, 485 (2006).
- 91. E. M. R. Kempton, et al., PASP 130, 114401 (2018).
- 92. Z. Rustamkulov, et al., arXiv e-prints p. arXiv:2211.10487 (2022).
- 93. C. Baxter, et al., arXiv e-prints p. arXiv:2103.07185 (2021).
- 94. K. I. Öberg, R. Murray-Clay, E. A. Bergin, ApJ 743, L16 (2011).
- 95. R. I. Dawson, J. A. Johnson, ARA&A 56, 175 (2018).
- 96. S. K. Grunblatt, et al., ApJ 861, L5 (2018).
- 97. N. N. Weinberg, M. Sun, P. Arras, R. Essick, ApJ 849, L11 (2017).
- 98. M. Sun, P. Arras, N. N. Weinberg, N. W. Troup, S. R. Majewski, MNRAS 481, 4077 (2018).
- 99. M. Soares-Furtado, M. Cantiello, M. MacLeod, M. K. Ness, AJ 162, 273 (2021).
- 100. S. R. Gibson, et al., Ground-based and Airborne Instrumentation for Astronomy VI, C. J. Evans, L. Simard, H. Takami, eds. (2016), vol. 9908 of Society of Photo-Optical Instrumentation Engineers (SPIE) Conference Series, p. 990870.
- 101. C. Schwab, et al., Ground-based and Airborne Instrumentation for Astronomy VI, C. J. Evans, L. Simard, H. Takami, eds. (2016), vol. 9908 of Society of Photo-Optical Instrumentation Engineers (SPIE) Conference Series, p. 99087H.
- 102. J. Tayar, K. G. Stassun, E. Corsaro, ApJ 883, 195 (2019).
- 103. J. M. Chadney, M. Galand, Y. C. Unruh, T. T. Koskinen, J. Sanz-Forcada, Icarus 250, 357 (2015).
- 104. S. W. Yee, et al., ApJ 888, L5 (2020).
- 105. K. C. Patra, et al., AJ 159, 150 (2020).
- 106. J. D. Turner, A. Ridden-Harper, R. Jayawardhana, AJ 161, 72 (2021).
- 107. S. Vissapragada, et al., ApJ 941, L31 (2022).
- 108. P. Goldreich, S. Soter, Icarus 5, 375 (1966).
- 109. J. P. Zahn, A&A 57, 383 (1977).
- 110. D. M. Kipping, Monthly Notices of the Royal Astronomical Society: Letters 434, L51–L55 (2013).
- 111. D. M. Kipping, mnras 435, 2152 (2013).
Acknowledgements
We acknowledge Kaz Gary, Zafar Rustamkulov, Eric Lopez, Nestor Espinoza and Ji Wang for helpful conversations that helped to improve this manuscript. We acknowledge the use of public TESS data from pipelines at the TESS Science Office and at the TESS Science Processing Operations Center. Resources supporting this work were provided by the NASA High-End Computing (HEC) Program through the NASA Advanced Supercomputing (NAS) Division at Ames Research Center for the production of the SPOC data products. This work was supported by a NASA Keck PI Data Award, administered by the NASA Exoplanet Science Institute. Data presented herein were obtained at the W. M. Keck Observatory from telescope time allocated to the National Aeronautics and Space Administration through the agency’s scientific partnership with the California Institute of Technology and the University of California. The Observatory was made possible by the generous financial support of the W. M. Keck Foundation. The authors wish to recognize and acknowledge the very significant cultural role and reverence that the summit of Maunakea has always had within the indigenous Hawaiian community. We are most fortunate to have the opportunity to conduct observations from this mountain. This research has made use of the Exoplanet Follow-up Observation Program website, which is operated by the California Institute of Technology, under contract with the National Aeronautics and Space Administration under the Exoplanet Exploration Program.
Funding
S.G., N.S., and D.H. acknowledge support by the National Aeronautics and Space Administration under Grant 80NSSC19K0593 issued through the TESS Guest Investigator Program. D.H. acknowledges support from the Alfred P. Sloan Foundation, the National Aeronautics and Space Administration (80NSSC21K0652), and the Australian Research Council (FT200100871). N.S. acknowledges support from the National Science Foundation through the Graduate Research Fellowship Program under Grants 1842402 and DGE-1752134. S.V. acknowledges support from the Heising-Simons Foundation under Grant 2022-3578. M.R. acknowledges support from the Heising-Simons Foundation under Grant #2022-3538. J.M.A.M. is supported by the National Science Foundation Graduate Research Fellowship Program under Grant No. DGE-1842400. Any opinions, findings, and conclusions or recommendations expressed in this material are those of the authors and do not necessarily reflect the views of the National Science Foundation. Funding for the TESS mission is provided by NASA’s Science Mission Directorate.
Author contributions
S.K.G. wrote all text and generated all figures in the manuscript. S.K.G. and D.H. jointly designed the overall target selection for this planet search, and S.K.G. and N.S. jointly designed the giants pipeline in order to identify candidates. S.K.G. identified TIC 365102760 as a potential planet candidate. S.G., M.M., A.C., E.T., C.B., J.M.A.M., M.R., H.I., and A.H. acquired the radial velocity observations. D.H. and R.A. helped oversee the initial planet search. K.S. performed the stellar analysis used to characterize the fundamental properties of TIC 365102760 and KELT-11. S.Y., S.V., and D.T. assisted with the interpretation of the planet discovery and its implications for the history of this planetary system.
Competing interests
We declare no competing interests.
Data and materials availability
The giants pipeline is available at www.github.com/nksaunders/giants, from which the giants light curve can be reproduced. TESS Full Frame Image data and QLP and SPOC lightcurves can be downloaded from the publicly available MAST Archive. Keck/HIRES measurements will be made public via the Keck Observatory Archive 18 months after observations were taken.
![[Uncaptioned image]](/html/2303.06728/assets/x1.png)
Fig. 1. Top: The giants light curve of TIC 365102760 folded at a period of d. The de-trended photometry is shown in black with the binned photometry plotted in green and best fit exoplanet model overplotted in orange, with 90% confidence intervals shaded. Bottom: All radial velocity observations of TIC 365102760 (black) along with the best fit exoplanet model and 90% confidence interval (orange) folded at the orbital period of the planet. Observations come from the Keck-I/HIRES spectrograph on Maunakea.
![[Uncaptioned image]](/html/2303.06728/assets/x2.png)
Fig. 2. Surface gravity versus effective temperature displayed logarithmically for TIC 365102760 along with the other planets discovered by the TESS Giants Transiting Giants (GTG) program (stars) compared to all known planets with well-characterized radii and masses (points). GTG discoveries have almost doubled the number of known systems on the subgiant and red giant branch. Hot Neptunes (3 R⊕ Rp 8 R⊕, Porb 10 d) have been highlighted in orange. We also illustrate MIST evolutionary tracks of 1-2 M⊙, +0.25 [Fe/H] dex stars in 0.1 M⊙ increments for reference. We have highlighted a MIST evolutionary track for a 1.4 M⊙, [Fe/H] = 0.25 dex star in red, illustrating the rough evolutionary sequence probed by the GTG survey.
![[Uncaptioned image]](/html/2303.06728/assets/x3.png)
Fig. 3. Planet radius versus the fraction of estimated total atmospheric mass loss divided by the current planet mass for all planets with masses and radii reported with 50% accuracy, and ages on the NASA Exoplanet Archive accessed on 31-Jan-2023. Color indicates atmospheric mass loss rate in grams/second. Evolved planets have been highlighted with stars, where TIC 365102760 b is indicated by the largest star. Average errors are illustrated in the upper right hand corner of the figure. TIC 365102760 b both has a higher current mass loss rate and is predicted to have experienced more atmospheric mass loss than all other gaseous planets, with only a few rocky planets experiencing higher rates of mass loss. As the atmospheric mass for this planet is predicted to be smaller than the total mass expected to have been lost, it is unclear how TIC 365102760 b has retained an atmosphere given its current radius and orbit around its host star.
![[Uncaptioned image]](/html/2303.06728/assets/x4.png)
Fig. 4. Planet radius versus age for two toy models of TIC 365102760 b that match the median mass, radius, age and flux measured here (green point). A planet model following the rapid re-inflation formulation of (?) is shown in blue, while an atmospheric mass loss model following the formulation of (?) assuming an initial planet mass of 29.2 M⊕ and planet metal composition fraction of 0.79 is shown in orange. This rapid re-inflation model implies the planet was smaller during the main sequence phase, resulting in a 50% reduction in total atmospheric mass loss from TIC 365102760 b relative to models that do not allow late-stage inflation.
List of Supplementary Materials
Contents:
Materials and Methods
Supplementary Text
Figures S1-S10
Tables S1-S3
Materials and Methods
Observations
TESS Photometry
TIC 365102760 b was discovered as part of the TESS Giants Transiting Giants survey identifying new planets around evolved host stars. Using version 8 of the TESS Input Catalog (?), we followed the cuts of (?) based on color, magnitude, and Gaia parallax in order to limit our sample to evolved stars. We developed the giants 111https://github.com/nksaunders/giants Python package for accessing, de-trending, and searching TESS observations for periodic transit signals. The details of how this pipeline processes TESS full frame image data are described in (?).
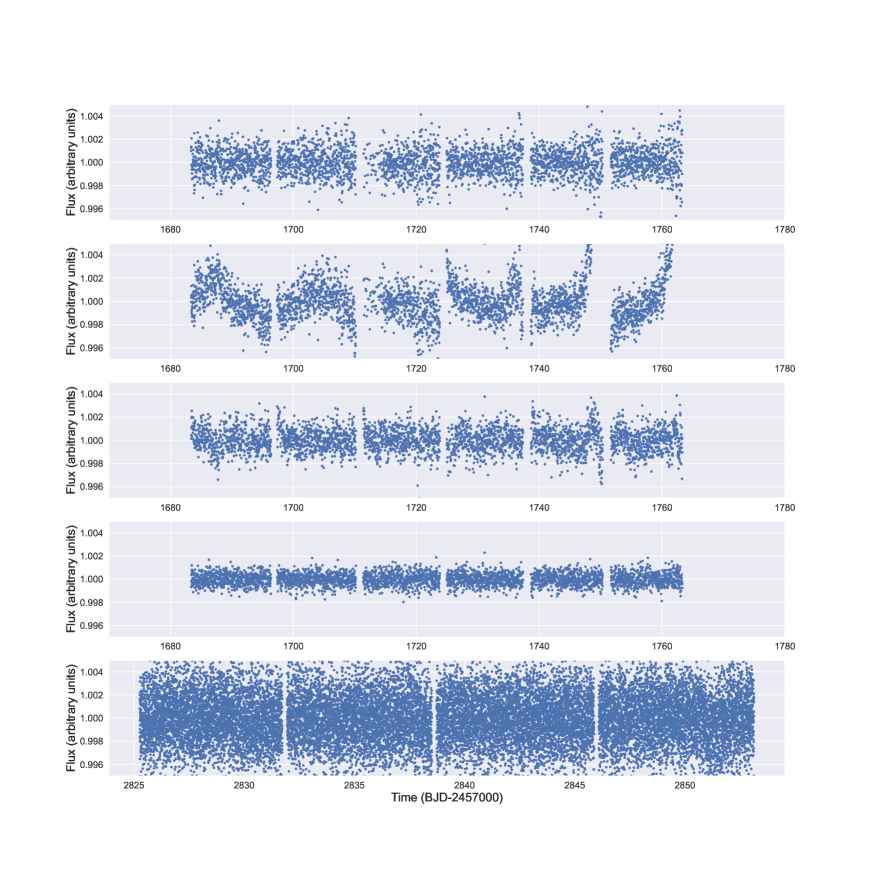
TIC 365102760 was observed in TESS Sectors 14, 15, 16, 41, 55, and 56 between 2019-Jul-18 and 2019-Oct-07, 2021-Jul-23 to 2021-Aug-20, and 2022-Aug-05 to 2022-Sep-30. Optical photometry was first acquired at 30-minute cadence in 2019, 10-minute cadence in 2021, and 200-second and 2-minute cadence in 2022. We produced a light curve with both 30-minute and 10-minute cadence using the giants package. We also produced a light curve for this target using the eleanor package (?). In addition, light curves for this target were produced by the TESS Science Team using both simple aperture photometry (SAP) as well as a Kepler-like signal processing algorithm (KSPSAP). Subsequently, the SPOC pipeline (?, ?), which has been tested on a significantly larger number of planetary transit datasets than the other pipelines mentioned here, produced a light curve for the 120-second, high-cadence data, which we also use in our analysis. We present these five light curves for TIC 365102760 in Figure S1.
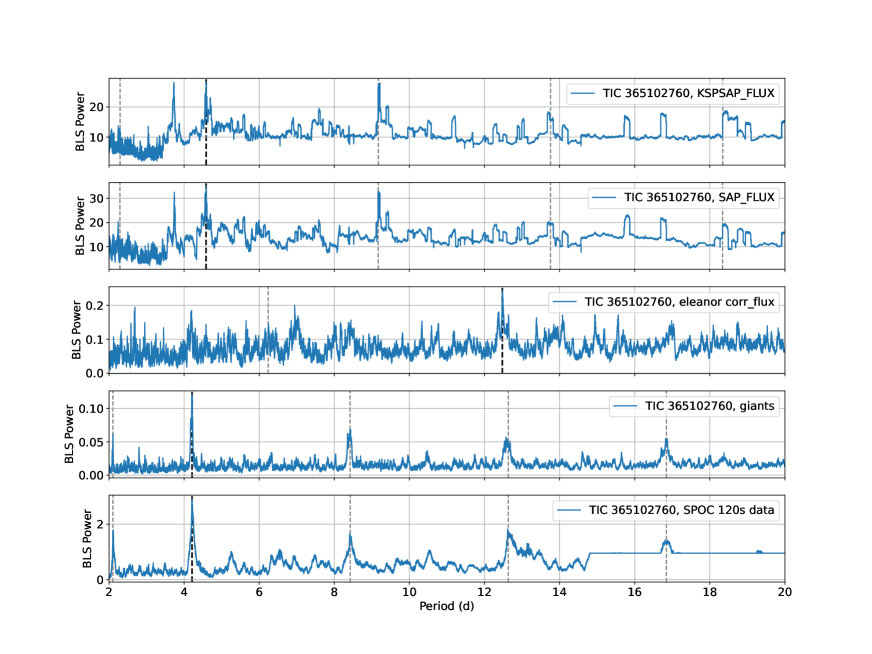
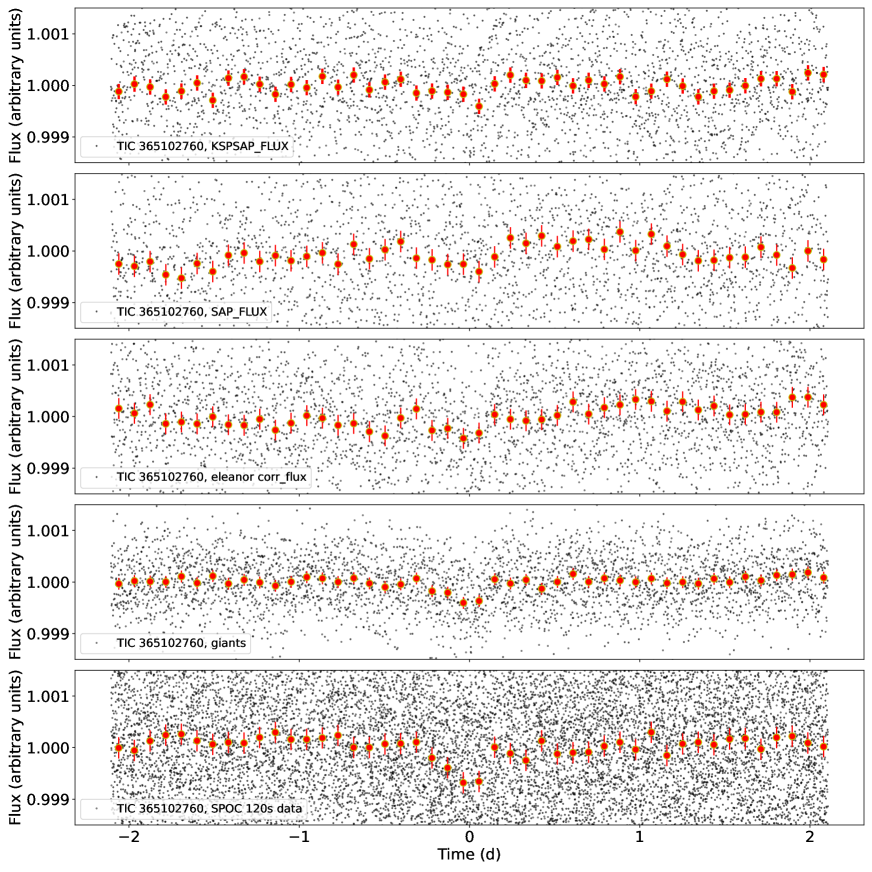
In addition to TIC 365102760, we used our giants pipeline to produce TESS light curves for as many red giant branch stars with TESS magnitude 13 as possible. We produced light curves for approximately 540,000 stars from the first 2 years of data from the TESS Mission. We performed an automated box least squared (BLS) (?) search on all targets, and produced summary plots displaying the BLS output as well as TIC information and the TESS full frame image pixel cut out. These summary plots were then visually inspected, during which this candidate was flagged for potential rapid ground-based follow-up. We illustrate the BLS results for all light curves of TIC 365102760 considered in this work in Figure S2 and corresponding phase-folded light curves of TIC 365102760 in Figure S3.
The 4.2-day transit signal from the planet is detected clearly above the noise floor in the BLS searches of the giants and 2-minute cadence SPOC light curves ( ), but is not recovered in the other light curves. This is likely related to the principal component detrending as well as the median smoothing filter of the giants light curves, which is broader than that of the KSPSAP light curve but still results in a much smoother light curve than pure simple aperture photometry (as can be seen in Figure S1). We note that in Figure S3, the transit can just barely be perceived by eye at a phase of 0.0 days in the giants and SPOC light curves, but is not visually detectable in the other light curves presented here.
Given the relatively weak planet transit signal, this planet did not reach the TESS team criteria to be flagged as a TESS Object of Interest, and thus was not prioritized for ground-based follow-up by the larger TESS Follow-up Program. Thus, it was important for our team to independently verify the existence of a planetary signal around this star.
Radial Velocity Measurements
Our team acquired RV observations of TIC 365102760 with the HIRES spectrograph on the Keck-I telescope on Maunakea, Hawaii (?). HIRES has a resolving power of and wavelength coverage between nm and nm. 20 RV measurements of TIC 365102760 were taken between June 13, 2021 and July 11, 2022. We list our RV measurements of TIC 365102760 in Table S1.
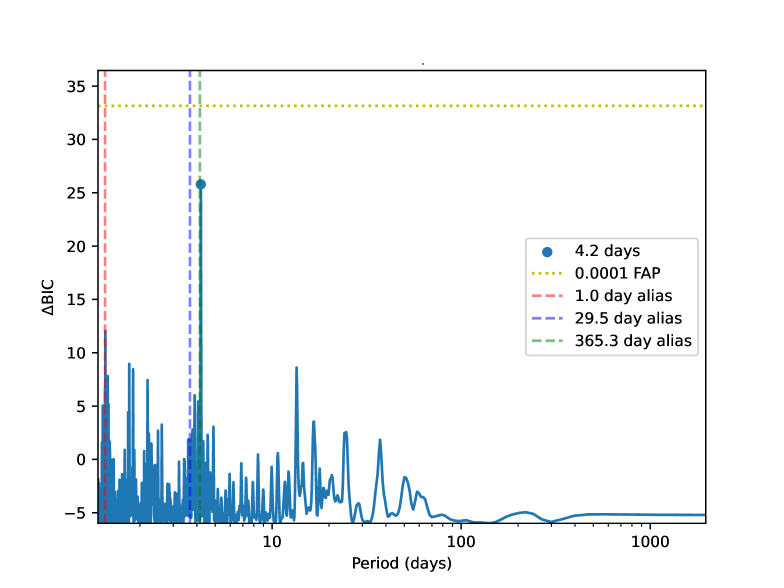
Using these RV measurements alone, we also search for an independent signal in the data. Using the software package RVsearch (?) we convert the radial velocity measurements to a periodogram, which accounts for the systematic signals of the Earth and Moon orbital and rotational periods. We find that a signal at 4.20 days is recovered with high significance, matching the planet transit seen in the giants light curve. This signal falls just short of the false alarm probability cutoff used for RV-only planet confirmation. We illustrate detection of this signal in our RV data in Figure S4. This independent confirmation of a planetary signal, observed with the same period and phase as seen in the giants light curve, makes the planet scenario significantly more likely than either dataset would on its own, and thus allows us to confirm this planet as real.
Visual Companions to TIC 365102760
While TIC 365102760 does not have high resolution imaging results, the Gaia astrometric noise metric RUWE is low (0.822), and the system is not included in the Gaia eDR3 catalog of binary systems (?). This indicates that the star is not in a binary system which could be resolved by Gaia photometry, and implies no significant dilution in the TESS FFI-generated light curves. This is supported by the consistent transit depth seen in both the SPOC and giants light curves, where a dilution correction factor has been applied to the SPOC light curves only. Additionally, no evidence of a spectroscopic binary can be seen in the spectra of this star, placing limits on close stellar binarity. The radial velocity measurements of this system also do not show any significant linear or quadratic trends with time, suggesting TIC 365102760 is a single star and not part of a binary system.
Host Star Characterization
Spectroscopic and Photometric Analyses
We used SpecMatch to measure the metallicity, surface gravity and effective temperature of the host star from our HIRES template spectrum (?). We then used isoclassify (?) to combine TICv8 and spectroscopic information to determine stellar properties for the Giants Transiting Giants sample. Figure 2 shows an H-R diagram with evolutionary tracks downloaded from the MESA Isochrones & Stellar Tracks (MIST; (?, ?, ?)). All Giants Transiting Giants systems were fit using isoclassify to highlight relative similarities between them. As all host stars have roughly the same mass and metallicity (M∗ 1.4 M⊙, [Fe/H] 0.25 dex), we highlight this evolutionary track in red, and suggest that these systems may extend earlier analyses of “retired A stars” to reveal evolutionary sequences for planetary systems orbiting post-main sequence, intermediate-mass stars (?, ?). We find that TIC 365102760 is near the base of the red giant branch stage of evolution.
In addition to the isoclassify determination of stellar parameters using SpecMatch derived effective temperature, stellar effective temperature, surface gravity, and metallicity were measured by combining multiwavelength photometry and parallax of TIC 365102760 from the Gaia, 2MASS, and WISE surveys. These values are then fit to MIST isochrones (?, ?, ?) to determine stellar mass, radius, and age. We find that our fundamental stellar parameter estimates from both approaches agree within uncertainties, and find that our statistical uncertainties on stellar parameters are smaller for our photometric analysis. We report the photometrically determined parameters in Table S2 with model-dependent statistical uncertainties inflated to realistic values that better reflect the combination of statistical and systematic uncertainty (?), which we use for our subsequent system analysis. We list the derived stellar parameters and uncertainties in Table S2.
Planet Characterization
Model Fit
We used the exoplanet Python package to simultaneously fit a model to the photometry and radial velocity observations (?). The data input to our model were all Keck/HIRES radial velocity observations reported in this work and a giants light curve made from all sectors of TESS FFI photometry available from the first four years of the TESS Mission. Our model used stellar parameters derived from our multiwavelength photometric analysis following the procedure described above. We confirmed that this model was in strong agreement with an equivalent model fit using stellar parameters from isoclassify (?) with Gaia parallax, and input effective temperature () and metallicity estimated using SpecMatch (?) from spectral observations taken by the Keck-I/HIRES instrument. The photometric model input parameters used for our best-fit model can be found in Table S2.
Our initial choices of planet period and depth were taken from the BLS search determined values produced during the transit search described in the TESS photometry section above. For limb darkening, we use the quadratic model prescribed by (?) to provide a two-parameter model with uninformative sampling. We parameterized eccentricity using the single planet eccentricity distribution of (?).
We present our best fit models to the light curve and radial velocity data for TIC 365102760 in Figure 1 and Table S3. We present a more complete sample of the posteriors of our model in Figure S6.
Given that the transit signal detected in the ‘KSP SAP’ and ‘SAP FLUX’ light curves is less than twice the strength of the noise floor, and is not detected in the eleanor light curve, we only fit for planet parameters of TIC 365102760 b using the giants and SPOC light curves. We note that the best exoplanet model fit using the SPOC light curve gives a radius of 7.2 0.8 R⊕, in good agreement with the value determined using the giants light curve. We find that the radial velocity signal for this planet is smaller than any other signal measured for a single transiting planet around an evolved star, but still constrains the planet mass to .
No significant out-of-transit variability can be resolved for TIC 365102760 b. Additional longer-baseline, higher-cadence data available for TIC 365102760 b from the extended TESS Mission may provide evidence for variability in the stellar light curve which is currently not detectable. A long (90 d) baseline of Kepler-like precision photometry should easily allow detection of the asteroseismic signal of TIC 365102760 (?, ?). However, TIC 365102760 is expected to be too faint to allow asteroseismic detection with TESS (?). We have produced a power spectrum of our giants light curve but cannot identify any asteroseismic power excess in the data.
Supplementary Text
Planet Irradiation, Potential Mass Loss and Radius Inflation
Previous to our TESS survey, only seven planets had been confirmed to be transiting evolved (T 6000 K, R 2 R⊙) stars. These systems showed promise for solving mysteries of late-stage planet inflation and orbital evolution, but small numbers and undersampled parameter space has made determining population-wide characteristics difficult. With recent additional discoveries (?, ?, ?, ?, ?, ?, ?), TESS has now increased the number of confirmed planets in this population by over 100% and has revealed a new regime of short-period hot Jupiters that have not yet inspiraled into their evolved host stars, constraining star-planet interaction rates (?, ?, ?). In addition, our survey has revealed a number of other similar planet candidates which will be suitable for confirmation through ground-based follow-up observations in the near future. Measurements of the masses and eccentricities of these and similar systems will provide new constraints on planetary inflation, and atmospheric evolution that were not possible earlier (?, ?, ?, ?, ?).
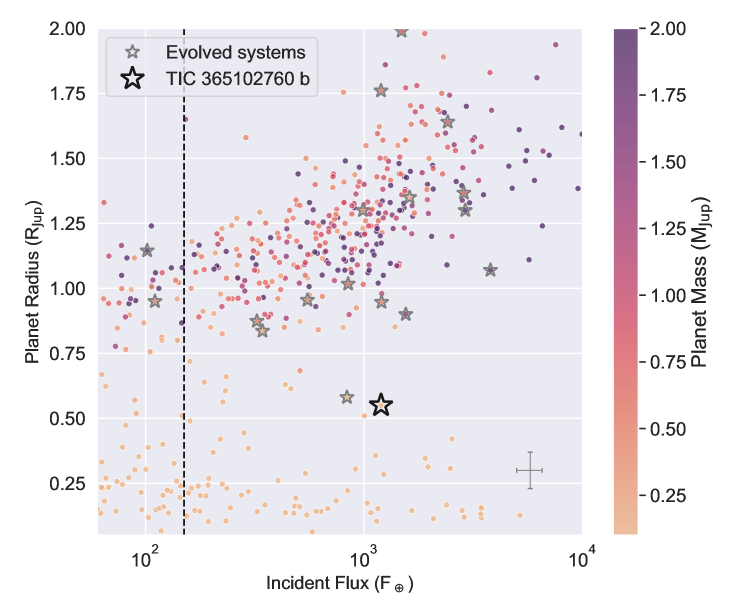
Relative to other known evolved systems, the incident flux on TIC 365102760 b is quite high. Assuming a direct correlation between planet radius and incident flux, it would be expected that this planet is among the most inflated Neptune-mass planets. As seen in Fig. S7, the incident flux received by TIC 365102760 b is greater than that typically received by similarly-sized hot Neptunes—clustered to the left of TIC 365102760 b—by roughly a factor of 2. There are a few examples of similar planets that are more irradiated or more inflated that TIC 365102760 b, but this planet appears to fall deeper into the hot-Neptune desert as shown in incident flux and planet radius than any other planet currently known. Planets orbiting evolved stars appear to be somewhat overrepresented in the hot Neptune desert, featuring planets near both the upper and lower boundaries of the desert, but this may also be affected by observational and detection biases among this population.
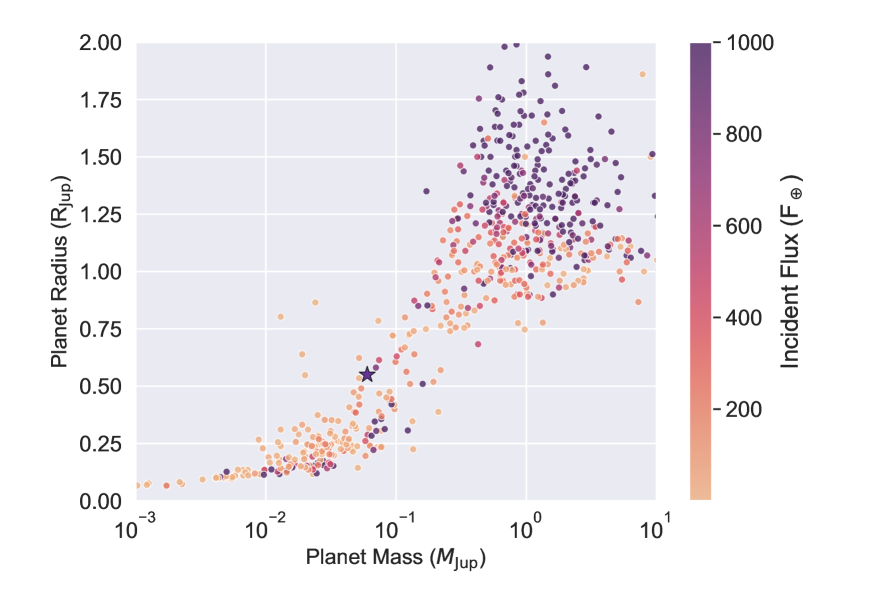
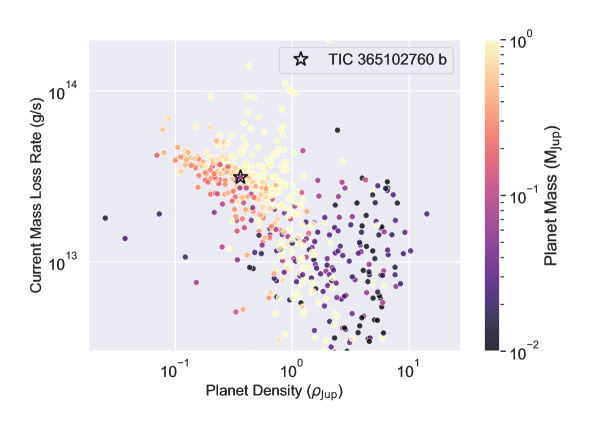
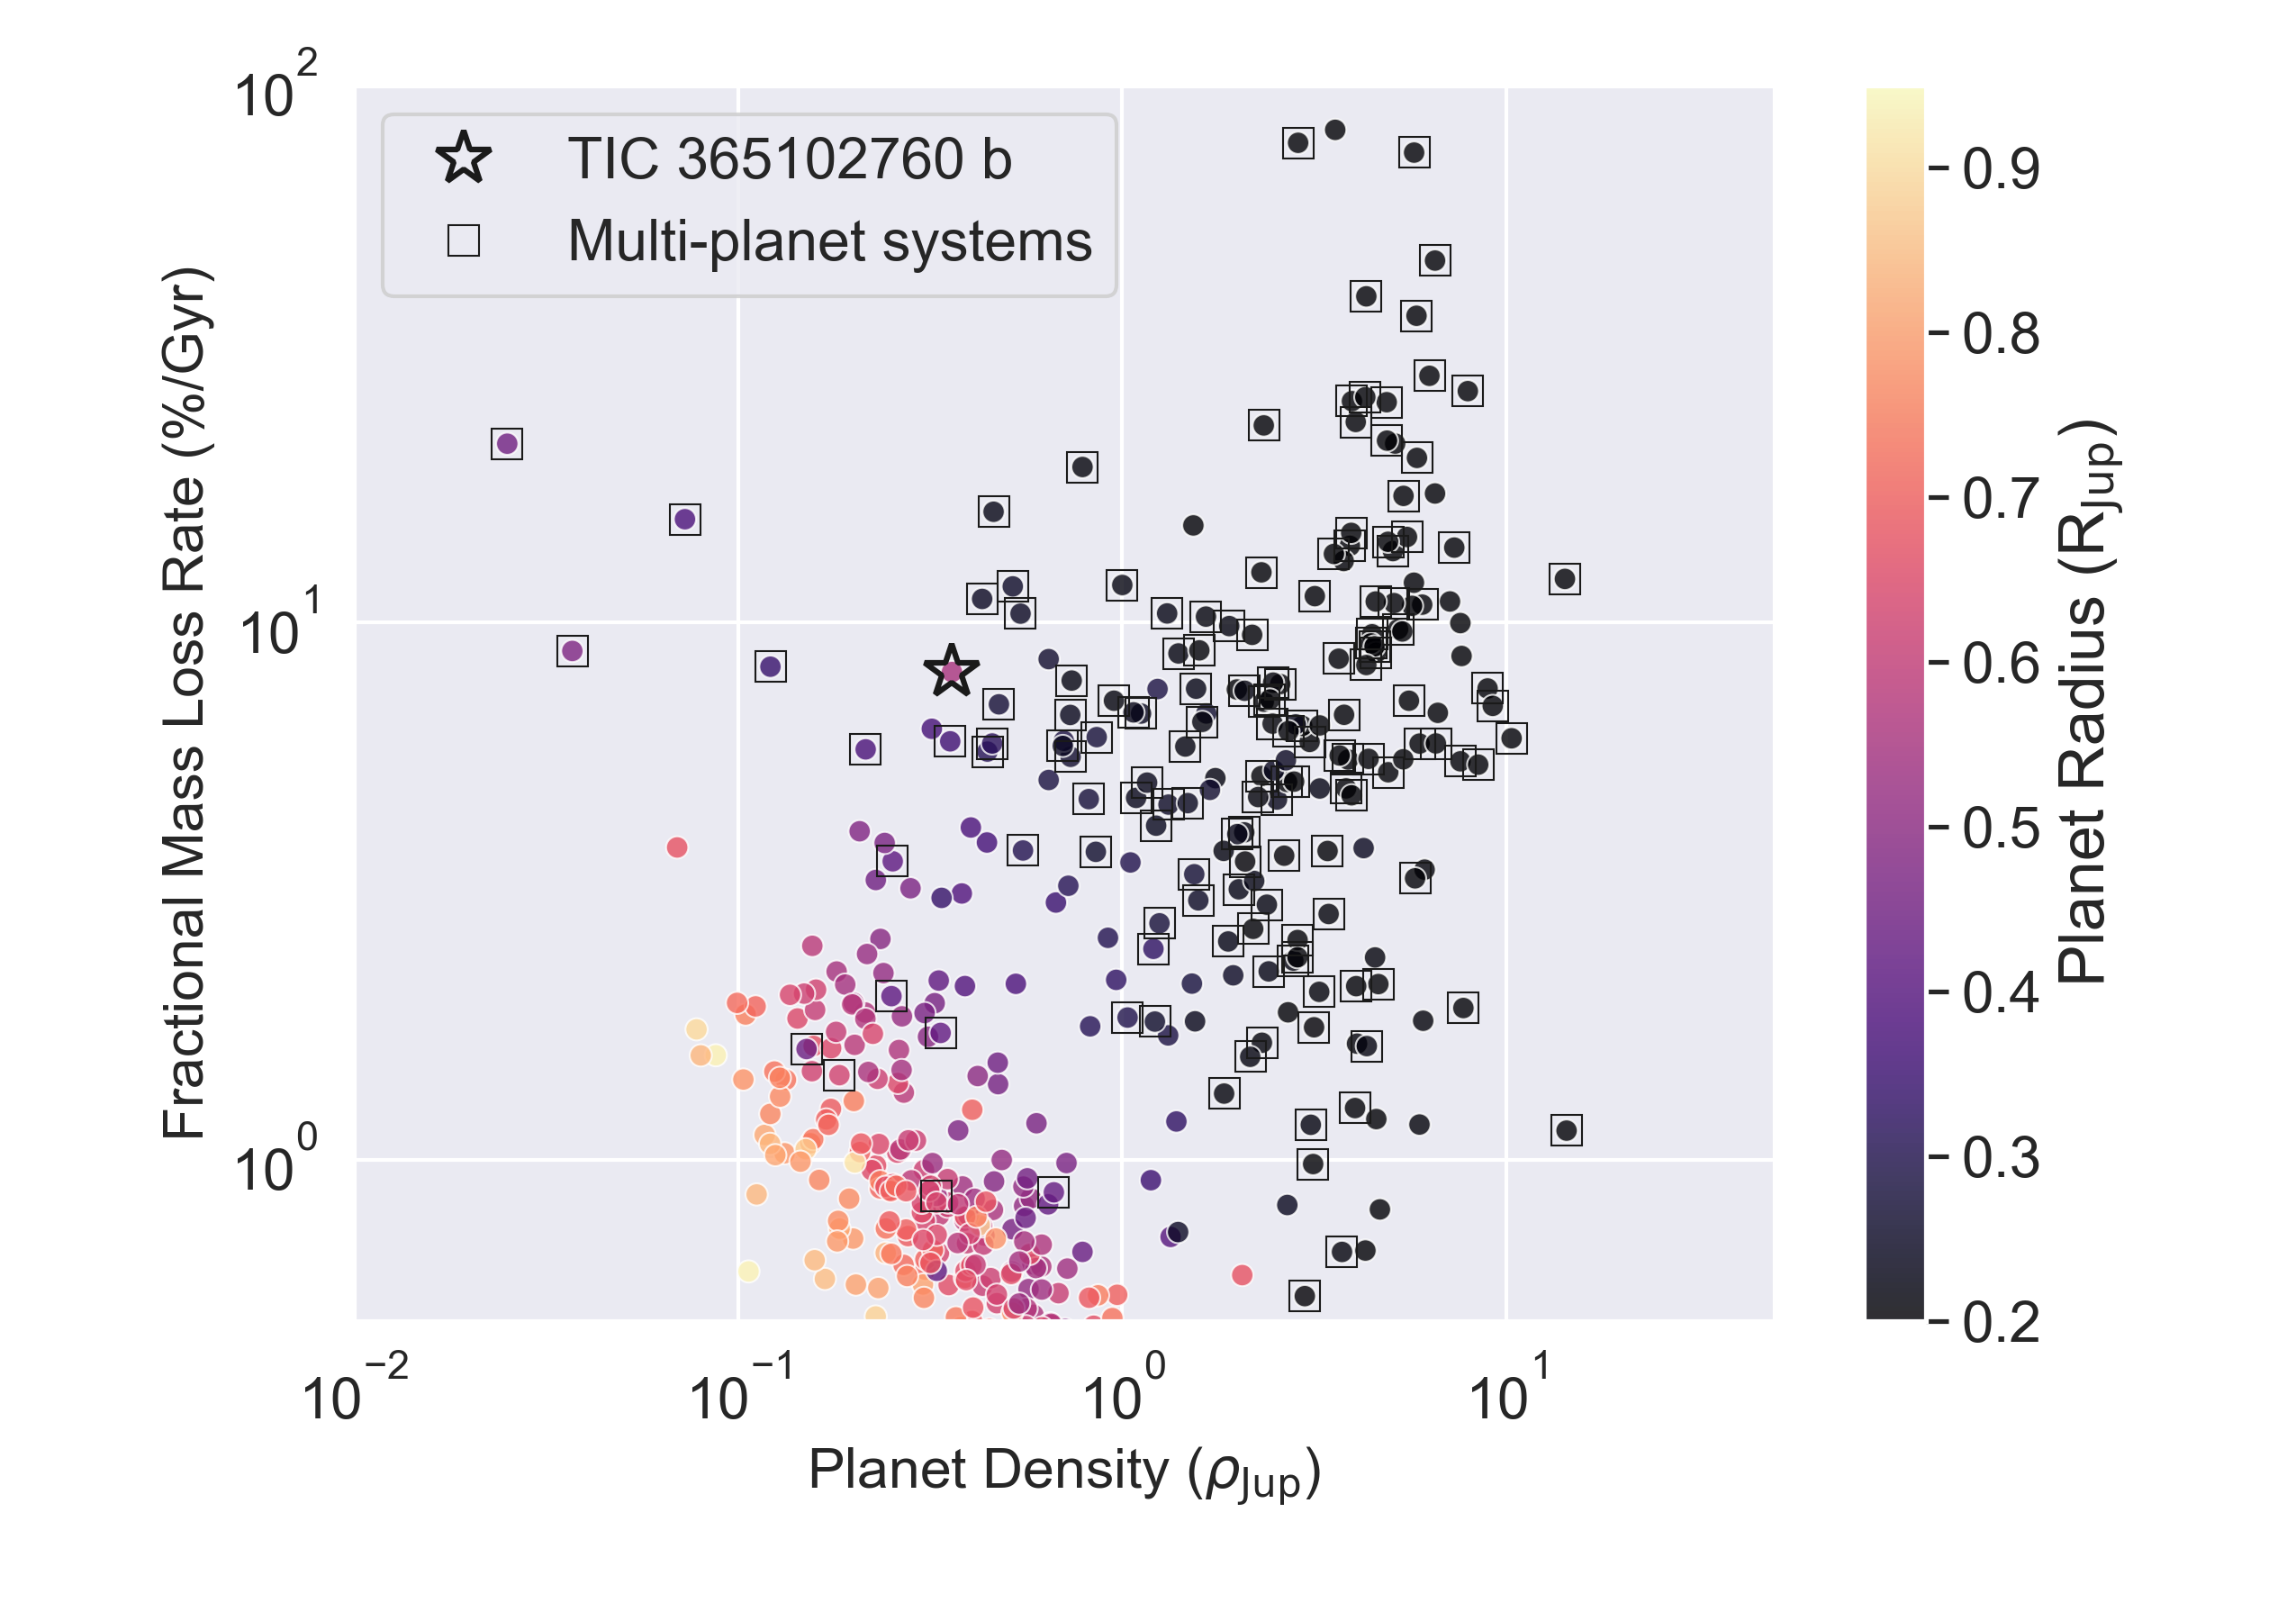
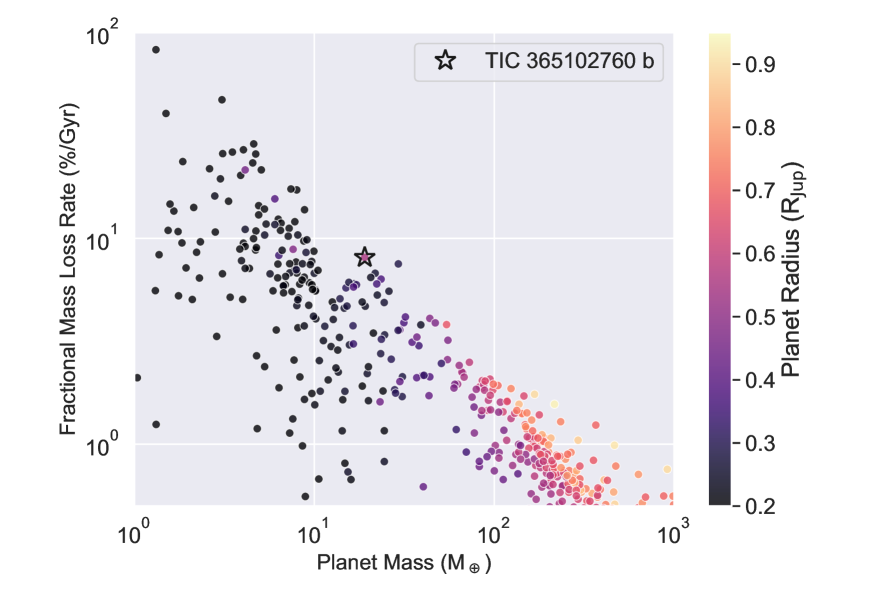
Figures S7, S8, S9, and S10 aim to place TIC 365102760 b in context of other, similar known planetary systems. Figure S7 shows planet radius as a function of incident flux for all planets with masses and radii reported with 50% uncertainties on the NASA Exoplanet Archive. Color corresponds to planet mass, and the nominal threshold for inflation of 150 F⊕ (?) has been shown with a black dotted line. TIC 365102760 b receives a higher incident flux than any other planet with a radius between 0.5 and 0.8 Jupiter radii. Figure S8 shows radius versus mass for all planets with masses and radii reported with 50% uncertainty on the NASA Exoplanet Archive. While not particularly extreme in either mass or radius, TIC 365102760 b is significantly more irradiated than most known Neptunes. In Figure S9, we show the same population of planets in the planet density/atmospheric mass loss rate plane in the top panel, and the planet density/fractional atmospheric mass loss rate in the bottom panel. We find that in the density/mass loss rate plane, TIC 365102760 b is more similar to hot Jupiter systems than hot Neptunes, experiencing a very high current mass loss rate given its low mass and density. In the density/fractional mass loss plane, we have also labeled multiplanet systems with squares. TIC 365102760 b stands out as experiencing one of the highest fractional mass loss rates of planets with densities less than that of Jupiter. Interestingly, almost all planets expected to experience comparable amounts of mass loss are in multiplanet systems, where planet-planet interactions may have resulted in inflated planet radii (?, ?). Figure S10 shows the same planet population in the fractional mass loss-planet mass plane. As in the previous Figure, we see that TIC 365102760 b is experiencing a higher fractional rate of mass loss than any other planet more massive than 10 Earth masses, with only rocky planets and super-puffs experiencing higher fractions of mass loss.
Given the large radii, relatively low densities and recent increases in irradiation due to host star evolution, these planetary systems can be interpreted as evidence for rapid re-inflation (?), which could cause the large difference in planet radii among these particularly high equilibrium temperature planets. The vastly different planet radii could be due to different strengths and depths of various heat dissipation processes which could be at play for the planets studied here (?, ?). Differences in the bulk metallicity and the migration history of these planets will also increase scatter in planet radii as a function of mass and irradiation. The orbits currently observed for these planets may have been reached through tidal circularization induced by stellar evolution (?, ?), which could also result in time-dependent internal heating and radius inflation due to the changing planetary orbit.
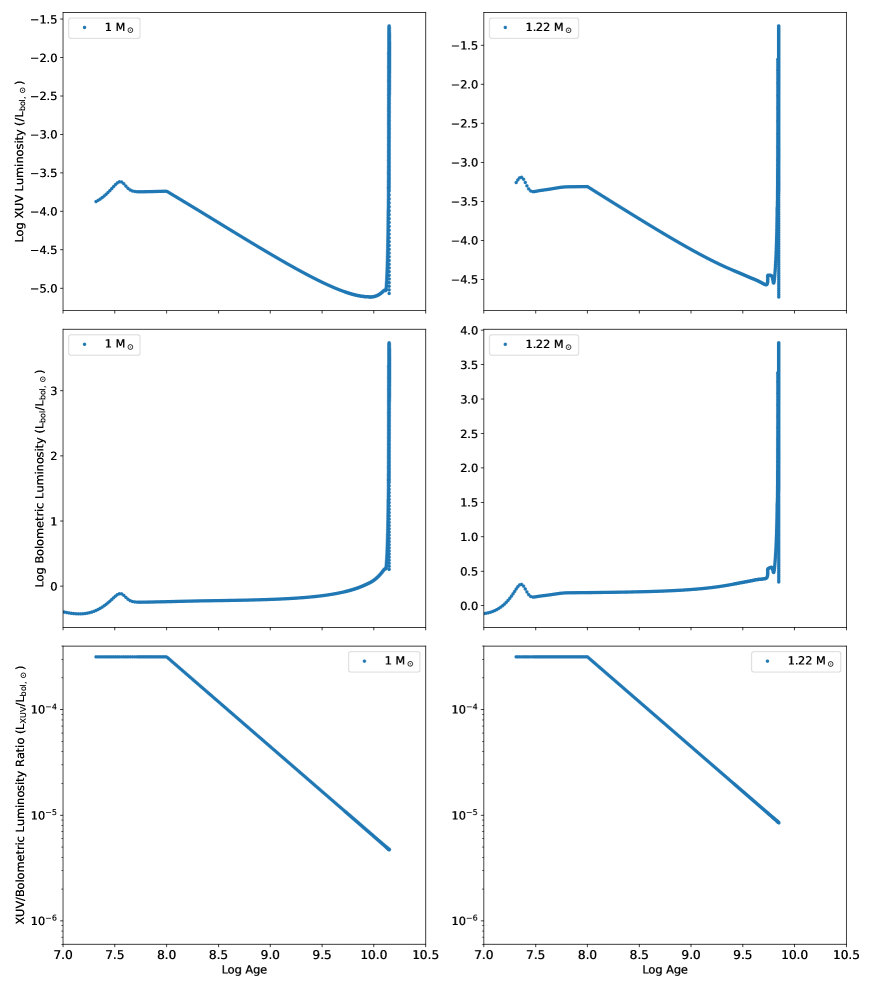
Atmospheric mass loss is also predicted to play a role in the sculpting of close-in planetary systems. High-energy EUV and X-ray photons can strip planetary atmospheres via photoevaporation (?, ?). We use previously published relations (?) between XUV and bolometric flux over the lifetimes of Sun-like stars to determine the expected cumulative atmospheric mass loss of all well-characterized planets with masses and radii measured to better than 50% fractional uncertainty and an age reported on the NASA Exoplanet Archive. In Figure S12, we illustrate the expected bolometric flux, XUV flux, and XUV to bolometric flux ratios over the course of a stellar evolutionary track for the Sun, as well as for TIC 365102760. We recreate the XUV to bolometric flux ratio law of Figure 1 in (?) through a visual comparison, and use 100 Myr as the boundary between the saturated regime (where the flux ratio is constant, at early times) and the unsaturated regime (where the XUV flux declines steadily relative to the bolometric flux, at later times) (?). We combine this with the reported semimajor axis to determine an XUV flux on any given planet, and then calculate an instantaneous mass loss rate using Equation 1 in the Main Text. We then integrate this mass loss rate over the expected age of the system to determine a cumulative mass loss rate, which we then compare to the current planet mass to create Figure 3 in the Main Text.
Through this calculation, we find that TIC 365102760 b likely experienced the highest fractional mass loss rate of any well-characterized planet between 1.6 and 9.5 R⊕. For a planet of this mass and temperature, these mass loss rates are expected to result in total loss of the planet’s gaseous envelope (?). Furthermore, we find that another evolved system may also have experienced comparably high (or even higher) amounts of cumulative mass loss. KELT-11 b, a planet with a mass 0.2 MJ but a radius of 1.35 RJ, does not have an age listed in the NASA Exoplanet Archive. However, we can infer an accurate and precise age based on the mass and late evolutionary stage of its host star following the same procedure as used for TIC 365102760. We find an age of 3.2 0.1 Gyr, and use this age estimate to predict that KELT-11 b may also have lost over 65% of its atmospheric mass, potentially the highest rate of mass loss for any gaseous planet. The fact that both of these cumulative mass loss outliers orbit evolved stars indicates that the evolutionary state of the systems may be related to their high cumulative expected mass loss. This suggests that late-stage evolutionary processes, such as rapid re-inflation, may have occurred, resulting in particularly high estimates of atmospheric mass loss for evolved systems due to the late-stage increase in planet radius.
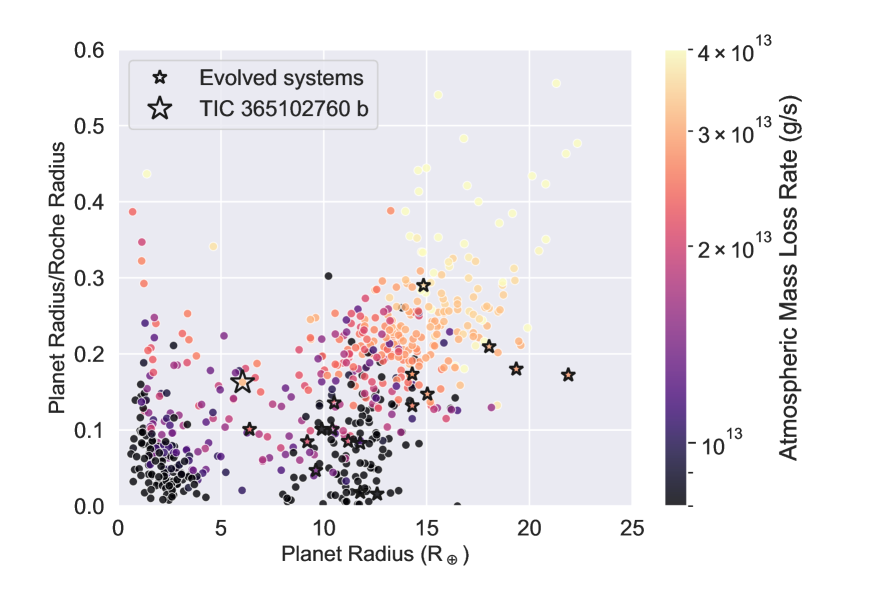
In order to ensure that photoevaporation is the dominant mass loss process occurring in this system, we also calculate the Roche lobe size for all planets in this sample, and compare the Roche lobe radius to the planet radius in Figure S11. We find that very few well-characterized planets have radii that reach more than half their Roche lobe, and no planets that fill more than 60% of their Roche lobe in our analysis. TIC 365102760 b appears to fill only 20% of its Roche lobe, and thus is unlikely to be experiencing Roche lobe overflow. This is in line with (?) and (?) indicating that Roche lobe overflow tends only to be important for hot Neptunes with 2 day orbital periods.
Potential follow-up Observations
Transit Spectroscopy
Little is understood about the evolution of planetary atmospheres over time, and few observations of planetary atmospheres have been conducted for planets orbiting evolved stars (?, ?, ?). Due to their particularly short orbits, the system introduced here is more well-suited for atmospheric characterization than other planets orbiting evolved stars.
Future observations with facilities capable of higher-precision photometry will confirm the true transit depth of this system, more precisely constraining the radius of TIC 365102760 b. Observations of the planet transit using a ground-based telescope with diffuser-assisted photometry (?) may also provide the requisite signal-to-noise ratio to obtain a more precise transit depth of TIC 365102760 b. Given the high scatter and low signal-to-noise ratio of this transit, planet parameters could also be significantly improved with transit observations taken by JWST (?). The higher photometric precision of JWST relative to TESS will allow better constraints on the planet radius, as well as transit shape and duration, which will help to constrain planetary orbit properties. Furthermore, the wavelength sensitivity of JWST may allow transmission spectroscopy. We find that TIC 365102760 b has a transmission spectroscopy metric (TSM; (?)) value of 25, making it a challenging but accessible target for JWST transit spectroscopy observation. Preliminary predictions and comparisons to similar targets suggest that molecular signatures, clouds and/or hazes should be detectable in the planet’s atmosphere (?, ?). Recent observations have suggested a distinction in the atmospheric profiles of hot and ultra-hot Jupiters (?), which may also be seen between this planet and slightly cooler hot Neptunes. Additionally, atomic and molecular abundances measured from transmission spectroscopy may also probe where the planet originally formed and at what point in its lifetime it moved to its current orbit (?, ?).
Radial Velocity
Additional radial velocity observations of this system will also test dynamical evolution models. (?) showed that giant planets orbiting giant stars at periods 30 days have average eccentricities . However, at the shortest orbital periods (5 days), even planets around evolved stars appear to have largely circular orbits. Constraints on orbital eccentricities will constrain both planet engulfment and stellar structure models (?, ?, ?, ?). We find no evidence for significant eccentricity in the orbit of TIC 365102760 b based on our current set of observations. Using our best-fit exoplanet model of this system, we find that TIC 365102760 b has an eccentricity significantly smaller than . A more finely sampled set of radial velocity measurements for this target with next generation instrumentation, such as Keck/KPF (?) or WIYN/NEID (?), will place tighter constraints on the planet’s eccentricity, and thus inform models of tidal evolution for the lowest mass ratio planetary systems, and determine whether this planet has completed any potential high-eccentricity migration (?). High-precision photometry detecting the secondary eclipse of the planet could provide a much more precise constraint on eccentricity.
The radial velocity jitter of TIC 365102760 is measured to be 4.20 0.90 m s-1, in agreement with the 5 m s-1 jitter typically expected for stars at this evolutionary state (?). Low radial velocity jitter may be related to lower stellar activity, which is likely also correlated with lower XUV flux for a star (?). Further radial velocity follow-up of this system with next generation extreme precision radial velocity instruments such as NEID and KPF may help to distinguish between stellar jitter and planetary signal in this system, improving our ability to characterize this planet as well as its host star.
Is TIC 365102760 b experiencing runaway inspiral?
The expected tidal interaction between hot gas giant planets and evolved host stars is expected to result in rapid orbital decay and eventual engulfment of the planet. However, orbital decay has only been measured in two systems to date, WASP-12 b and Kepler-1658 b (?, ?, ?, ?), both of which were less evolved than the system studied here. By constraining the rate of orbital decay in evolved systems, we can better characterize the strength of star-planet tidal interactions and their dependence on star and planet properties.
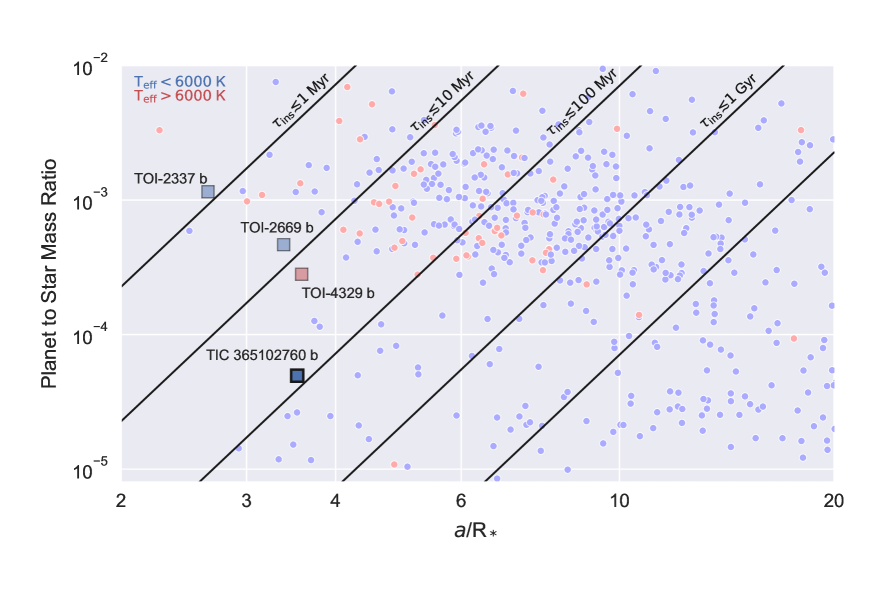
Figure S13 illustrates the population of known planets, highlighting those planets which are most likely to be experiencing strong orbital decay, as well as decay rates predicted using the prescription from (?), assuming a modified stellar tidal quality factor = 106. The planets with the smallest relative orbital separations and highest masses relative to their stars decay most quickly, and can be found in the upper left hand corner of this plot. We have illustrated the new planets found by this survey as squares on this plot. These planets are among the best candidates for detecting orbital decay. In particular, TIC 365102760 b is predicted to have the most rapidly decaying orbit for a known planetary system with a mass ratio below 10-4 to date. In addition, TIC 365102760 b also orbits a relatively cool star, which is expected to increase the speed of its orbital decay due to more rapid tidal dissipation in TIC 365102760’s thick outer convective envelope (?). However, the relatively noisy TESS coverage for this system and relatively slow predicted orbital decay rate of this planet make it unlikely that orbital decay will be detectable for this system in the next decade.
To predict the orbital stability of this system at the current time, we use the formulation of (?) to determine the critical semimajor axis, , at which the dynamical tides are expected to overcome equilibrium tides and begin the process of runaway inspiral begins. We compare to the current semimajor axis of the system, which we have determined to be 0.0622 0.0049 au. Following the analytical approximations for assuming various rates of tidal dissipation which allow for different eddy sizes and turnover times within the convective envelope of the star, we determine a maximum = 0.055 au for this system assuming a non-reduced kinematic viscosity for this star (?). Thus, this planet is not predicted to be experiencing runaway inspiral and orbital decay at this time, and suggests that the host star must grow significantly in radius before this process begins.
| Time (JD - 2457000) | Relative RV (m/s) |
|---|---|
| 2379.061 | 0.3 1.5 |
| 2386.098 | -7.7 1.4 |
| 2396.065 | 1.1 1.5 |
| 2413.082 | 8.0 1.7 |
| 2421.011 | -2.8 1.9 |
| 2423.062 | -2.8 1.4 |
| 2435.909 | -2.0 1.3 |
| 2442.078 | 5.1 1.5 |
| 2446.082 | 1.4 1.6 |
| 2449.040 | -0.7 1.5 |
| 2503.884 | -14.9 1.5 |
| 2509.902 | 10.8 1.7 |
| 2513.860 | 8.0 1.5 |
| 2545.776 | -6.4 1.8 |
| Target ID | |||
|---|---|---|---|
| TIC | 365102760 | ||
| 2MASS | J20232153+5423395 | ||
| Gaia DR2 | 2185044477033336064 | ||
| Observables | |||
| RA(J2015.5) | 20:23:21.56 | ||
| Dec(J2015.5) | 54:23:39.55 | ||
| B mag | 13.034 0.526 | ||
| V mag | 12.154 0.034 | ||
| Gaia mag | 11.9772 0.0002 | ||
| TESS mag | 11.33 0.01 | ||
| 2MASS J mag | 10.406 0.026 | ||
| 2MASS H mag | 9.894 0.032 | ||
| 2MASS K mag | 9.788 0.020 | ||
| WISE W1 mag | 9.721 0.023 | ||
| WISE W2 mag | 9.813 0.020 | ||
| WISE W3 mag | 9.700 0.034 | ||
| Proper Motion, right ascension | 10.8797 0.0418 mas yr-1 | ||
| Proper Motion, declination | 5.1928 0.0422 mas yr-1 | ||
| Radial Velocity | -1.59 0.25 km s-1 | ||
| Distance | 555.5 7.6 pc | ||
| Inferred Characteristics | |||
| Radius | |||
| Mass | |||
| K | |||
| dex | |||
| [Fe/H] | dex | ||
| Age | Gyr | ||
| Density |
| Parameter | Prior | Value |
| Transit Fit Parameters | ||
| Orbital period [days] | d | |
| Semimajor axis [AU] | 0.0622 0.0049 | |
| Transit epoch [BJD - 2457000] | ||
| Transit duration [hr] | 5.52 | |
| Planet-to-star radius ratio Rp/R∗ | 0.0176 0.0019 | |
| Impact parameter | ||
| Eccentricity | single-planet dist. from (?) | 0.406 |
| Argument of periastron | 0.216 1.698 | |
| Limb-darkening coefficient | [0,2] | |
| Limb-darkening coefficient | [-1,1] | |
| Radial Velocity Fit Parameters | ||
| Semi-amplitude [m/s] | ||
| RV jitter [m/s] | ||
| Offset [m/s] | 0.81 2.54 | |
| Derived Physical Parameters | ||
| Planet radius | ||
| Planet mass | ||
| Planet density | 0.437 g cm-3 | |
| 4.14 0.35 |