Automatic Detection of Signalling Behaviour from Assistance Dogs as they Forecast the Onset of Epileptic Seizures in Humans
Abstract.
Epilepsy or the occurrence of epileptic seizures, is one of the world’s most well-known neurological disorders affecting millions of people. Seizures mostly occur due to non-coordinated electrical discharges in the human brain and may cause damage, including collapse and loss of consciousness. If the onset of a seizure can be forecast then the subject can be placed into a safe environment or position so that self-injury as a result of a collapse can be minimised. However there are no definitive methods to predict seizures in an everyday, uncontrolled environment. Previous studies have shown that pet dogs have the ability to detect the onset of an epileptic seizure by scenting the characteristic volatile organic compounds exuded through the skin by a subject prior a seizure occurring and there are cases where assistance dogs, trained to scent the onset of a seizure, can signal this to their owner/trainer. In this work we identify how we can automatically detect the signalling behaviours of trained assistance dogs and use this to alert their owner. Using data from an accelerometer worn on the collar of a dog we describe how we gathered movement data from 11 trained dogs for a total of 107 days as they exhibited signalling behaviour on command. We present the machine learning techniques used to accurately detect signalling from routine dog behaviour. This work is a step towards automatic alerting of the likely onset of an epileptic seizure from the signalling behaviour of a trained assistance dog.
1. Introduction
Epilepsy, the occurrence of epileptic seizures, is one of the world’s most common neurological disorders affecting millions of people daily. Seizures occur due to non-coordinated electrical discharge in the brain and may cause damage including collapse and loss of consciousness or worse. If a the onset of a seizure can be detected then the subject can be placed into a safe environment or positioned so the risk of self-injury as a result of a collapse can be minimised. However there are no reliable and practical methods to predict the onset of seizures in an everyday, uncontrolled and routine environment.
Previous studies have shown that dogs, either household pets or trained assistance dogs, have the ability to forecast the onset of an epileptic seizure by detecting the scent of a particular kind of volatile organic compound associated with seizure onset (Maa et al., 2021). Researchers have also demonstrated the presence of seizure-associated odours secreted from the skin and then recording the reactions and signalling behaviour of a pet dog when it senses such odours.
In the present study we investigate how to automatically detect the signalling behaviour of trained assistance dogs who detect a seizure onset and who showcase this through their signalling. For this we use a wearable sensor including an accelerometer on the collar of the dog. We develop a data processing pipeline to pre-process the sensor data and use this as input to a machine learning algorithm that recognises the assistance dog’s signalling behaviour. The accuracy of the detection of the signalling behaviour is such that this one step in the overall goal of using assistance dogs in practice, is demonstrated as being feasible.
The rest of this paper is organised as follows. In the next section we present some background and literature including the challenges in this work in Section 2.6. We then give an overview of our data processing pipeline followed by a description of the sensor data we gathered from trained dogs, including the annotation of this as data for training a machine learning algorithm. In Section 4 we describe our data pre-processing including feature extraction, data analysis and the algorithms we used for classification and prediction. In Section 5 we present our results including a discussion before our final conclusions.
2. Background and Literature Review
2.1. Epilepsy
Epilepsy is a neurological brain disorder affecting millions of people daily. It is characterised by the occurrence of spontaneous and seizures where the subject loses control of motion and may jerk and thrash around uncontrollably. In simple terms a seizure can be defined as an internal electrical storm in the brain. It is the consequence of abnormal, excessive discharges by nerve cells. The seizures in epilepsy are mostly related to a brain injury or are hereditary, but more often the cause is completely unknown (Powell et al., 2021). Seizures result from a non-coordinated neuronal electrical discharge and recurring seizures occur in the cerebral cortex (Rohan et al., 2020) and may cause serious damage, including loss of consciousness and collapses and self-inflicted injury where the subject can bang their head on the ground (Litt and Echauz, 2002), for example.
Some of the common causes of epilepsy are inborn or developmental including genetic abnormalities or structural problems in the brain like malformed veins or areas which have not developed normally. One in three people will be diagnosed with epilepsy by the age of 60. The unexpected and uncontrolled seizures not only make subjects feel vulnerable but also impact their quality of life. While there are medical interventions which can reduce the seriousness or the number of seizures, many of these pharmacological interventions have undesired side-effects and getting the dosage as well as the combination of medicines correct, is difficult.
2.2. Seizure Onset Prediction
The quality of life of those who experience epileptic seizures would be significantly improved if the onset of seizures could be predicted in advance. In such a case, a warning mechanism for the onset of a seizure would allow subjects time to remove themselves from a potentially dangerous situation, e.g. from a staircase, to somewhere safer like lying on a bed, a sofa or even lying on the floor. Furthermore, seizure prediction offers the possibility of intervening in the dynamics of the brain before or at the start of a seizure and ultimately aborting seizures before they occur (Yu et al., 2016).
Although research has been carried out on predicting epileptic seizures since the 1970s, there are still no reliable or practical methods available to predict seizure onset in subjects with epilepsy. Therefore there is a pressing need to develop approaches to seizure onset detection. The introduction of any technique to detect and accurately predict the onset of a seizure, giving sufficient time for a person to take control of the situation would also encourage a healthier and more normal lifestyle as the risk of self-industry during a seizure would be reduced. Since seizures are unpredictable, those who are susceptible to seizures must live a lifestyle which avoids activities which contain any serious kind of risk, certainly when they are operating without a carer or assistant (Bhuvaneswari et al., 2020).
2.3. Assistance Dogs for Predicting Seizure Onset
Humans have studied animal behaviour for hundreds of years including during domestication (Naik et al., 2020). While most dogs in domestic settings are pets and have evolved to naturally live with human families offering companionship, assistance dogs are trained to undertake a variety of tasks to help individuals. Sometimes these individuals have physical or even cognitive disabilities that impair their quality of life.
One form of assistance that assistance dogs can offer is anticipating the onset of seizures. Early work in this area was reported more than 2 decades ago, work which analyse the reaction of dogs to odours and that work found that the dogs could predict when a seizure was imminent based on smell alone (Litt and Echauz, 2002). This early work was followed by work which proved that epileptic seizures are associated with a specific kind of odour which comes from a naturally occurring volatile organic compound that we secrete through our skin, and which is detectable by pet dogs (Brown and Goldstein, 2011). More recent work by Powell et al. found that this scent which is an indicator of seizure onset can be detected even by untrained pet dogs (Powell et al., 2021) while work in (Maa et al., 2021) isolated a unique seizure scent which acts as a biomarker for seizure onset indication.
In addition to the potential for scent-based detection of seizure onset, visual cues from a subject’s behaviour or postural changes (e.g. changes in motor activity and or mood, or experiencing of auras) prior to an impending seizure can also be a form of signalling from a subject which could be detected by an assistance dog (Catala et al., 2018). Whether scent-based or behaviourally based, this past work indicates that assistance dogs could effectively be trained to recognise a seizure onset and then give an overt signal by their behaviour, to warn his/her owner or caregiver.
2.4. Wearable Accelerometers on Animals
The use of wearable accelerometers by people to measure physical activity, sedentary time, energy expenditure and sleep-related behaviours, is a well-established market and the billion-dollar pet industry is now getting involved in this wearables market. The global pet wearable market is expected to grow at a compound annual growth rate of 13.5% before 2025, with enormous growth in demand from Asia after initial popularity in the West. The typical pet wearables on the market are dog activity and fitness trackers, like FitBark, PetPace, and Whistle. These devices employ accelerometers, GPS, and vitality sensors to measure the activity and sleep patterns of pets (Zamansky et al., 2019).
Accelerometers are used in animal science in various contexts such as estimation of energy expenditure and assessment of behaviours in wildlife (Kumpulainen et al., 2021). Existing activity trackers are useful for evaluating simple canine behaviours according to past research. Depending on the sensitivity of the measurement unit, the spontaneous activities of a dog, such as locomotion, postural change and movement of body in each posture, can be differentiated by analysis of accelerometer data (Yam et al., 2011). Accelerometer data can be used to extract more detailed behaviours to assess an animal’s health and wellbeing. Previously these devices were used to detect musculoskeletal problems, ear infections and mental health conditions such as separation distress (den Uijl et al., 2017). A number of systematic reviews of how to process data from wearables showcases that various attributes must be considered for accurate data collection and processing. These include placement of the sensor, sampling frequency, filters used on the gathered data, epoch length and non-wear-time (Migueles et al., 2017; Riaboff et al., 2022).
2.5. Machine Learning on Accelerometer Data
The accelerometer data from collar-mounted canine activity monitors can be used to measure a dog’s activity levels including step count and distance travelled. Recent advances in machine learning and embedded computing have made it possible to classify animal behaviour in a more nuanced and accurate manner. Through a collar-mounted accelerometer, one study confirmed that activity monitors using validated algorithms can accurately detect important canine behaviours (Chambers et al., 2021). Validated algorithms have wide practical applications when used in commercially available canine activity monitors. Based on the accelerometer data, algorithms accurately detected eating and drinking behaviour, other behaviours such as licking, petting, rubbing, scratching, and sniffing were also accurately detected (Chambers et al., 2021).
In this work we set out to collect information from a number of volunteers participants and their dogs on signalling behaviours or “tricks” that their dogs can perform while wearing an accelerometer to collect data on their movement. We also gather information on the various characteristics of the dogs including age, size, breed and the range of signalling behaviours it can perform. Video footage of the dogs performing those behaviours will also be recorded for short instances several times during the data logging period. When we manually annotate this video footage for the occurrence of such behaviours it gives us a ground truth of positive instances. We can then combine the behaviour detection results across a variety of dog breeds and determine the level of accuracy for automatic detection of seizure onset based on the analysis of accelerometer data from accelerometers worn on the collars of trained assistance dogs.
2.6. Challenges
In order to investigate how to detect canine signalling behaviour we collect data from an always-on accelerometer combined with videographic recordings of dogs while performing their signalling behaviour. We use this as training data for a machine learning algorithm.
Using a triaxial accelerometer comes with hidden challenges. One problem is that accelerometer data may not be directly comparable across dogs. The shape and size of the dog that the device is attached to raises issues such as its relative height with respect to the ground which can alter its relative position and result in data being dissimilar across different dogs. Thus the dogs’ physical characteristics which include size, age, weight and breed are important. Dogs which are physically strong and well-built may not be as agile as lighter breeds of the same size who might perform certain signalling activities more rapidly.
Previous studies have indicated that orientation inconsistency of a wearable sensor is important (Majumder and Deen, 2020). For placement on a dog, the best placement for an activity sensor has been determined to be ventral attachment to the neck collar because this placement also makes it possible to detect behaviours that do not involve movement of the whole body, such as scratching or eating (Hussain et al., 2022). However, when worn by participant dogs on their collars, the collar and thus the sensor can rotate around the neck, or be attached initially in different orientations. In some scenarios accelerometers may be mounted on a rigid structure such as a fixed harness worn by the dog in order to maintain a standard sensor orientation. While this addresses the issue of sensor orientation, wearing a harness 24/7 is uncomfortable for an assistance dog and this is not an option for our eventual use case so in this work we fix the sensor on the dog collar even if the collar may rotate around the dog’s neck.
To isolate any bias from inconsistency of the sensor orientation we compute the average sum of the three axial values. Thus, for the purpose of our work we treat rotation of the sensor and the collar as systematic biases that are associated with the devices. A more in-depth and principled analysis of this assumption is beyond the scope of the current study and the reader is referred to (Riaboff et al., 2022) for further discussion on this topic.
3. Data Gathering and Annotation
Data for this work was gathered from a group of 11 volunteer dogs with an age ranging from 1 to 9 years. All dogs were deemed to be agile and healthy by their owners and this study was approved by the Research Ethics committee of Dublin City University School of Computing. All volunteer dog owners read a plain language statement and signed and returned an informed consent form. Volunteers were recruited by information leaflets circulated among dog training social media groups and almost all volunteer owners were themselves dog trainers. Information on each volunteer dog was documented including name, the tricks or signalling behaviours that it could perform on command and we purposely included a range of breeds, and ages among the volunteer dogs as shown in Table 1. The unprocessed sensor data is publicly available at (Smeaton et al., 2022). In screening volunteer dogs for participation, the ability to perform certain agile activities such as spins and jumps were mandatory and dog owners were informed of this prior to recruitment.
| Number | Breed | Size | Age | Data logging | Behaviours | No of videos |
|---|---|---|---|---|---|---|
| 1 | Collie Mix | Medium | 3 Yrs | 9 days | Spins, Jumps and Rollovers | 20 |
| 2 | Springer/Terrier MIX | Medium-Small | 8 Yrs | 4 days | Spins, Jumps | 16 |
| 3 | Spaniel Mix | Medium | 4 Yrs | 9 days | Spins, Jumps | 27 |
| 4 | Poodle | Medium-Small | 2 Yrs | 9 days | Spins, Jumps | 9 |
| 5 | Lurcher | Medium | 5 Yrs | 3 days | Spins, Jumps | 14 |
| 6 | Lurcher | Medium | 2 Yrs | 9 days | Spins, Jumps | 9 |
| 7 | Collie Mix | Medium | 3 Yrs | 8 days | Spins, Jumps | 8 |
| 8 | Hungarian Vizla | Medium | 3 Yrs | 12 days | Spins, Jumps | 6 |
| 9 | Border Collie | Medium | 2 Yrs 4 Months | 19 days | Spins, Jumps | 11 |
| 10 | Australian Retriever | Medium | 1 Yr | 14 days | Spins, Jumps | 9 |
| 11 | Golden Retriever | Medium | 7 Months | 11 days | Spins, Jumps | 3 |
| Average age 3.5 Yrs | Total 107 days | Total 132 |
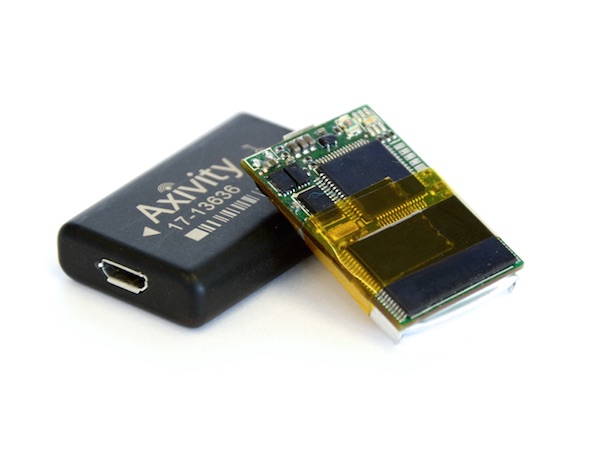
The AX3 accelerometer (Axivity, York, UK https://axivity.com/) is a popular device for wearable sensing research. A pre-configured and full-charged device with parameters preset for data gathering as described below, was sent to each volunteer and placed securely on the dog’s collar and left in place to gather data in the dog’s natural environment and routine behaviour. The AX3 data logger, shown in Figure 1, is a wearable sensor which includes a microelectro-mechanical systems (MEMS) accelerometer and flash memory. Multidimensional data collection and configurable resolution/frequency are two of the reasons why the AX3 sensor was chosen. This allowed the sensor to be set at a sampling rate up to 100Hz if needed.
Based on literature describing the use of the AX3 in other animal studies, a sampling rate of 12.5Hz and 12 bits for data resolution was considered optimal for our experiment (Riaboff et al., 2022), trading battery live vs. sensing frequency. It is possible to represent sensor data captured as either single-dimensional data or multi-dimensional data which constitutes the x, y, and z directional dimensions. The energy consumption for the wearable device is an important parameter due to the fact that dog activity should be tracked over a prolonged period of time. Reducing sample rates, logging fewer accelerometer axes, or reducing features to record can increase battery life and for our configuration, battery life for full charges is between 6 and 8 weeks. A recent study examined dairy cows’ laying, standing, and feeding behaviour and found that fewer logging axes did not affect the accuracy of the categorisation (Vázquez Diosdado et al., 2015). By choosing optimal sensor measurement settings such as sampling rate, logging axis, and feature selection, the energy consumption in a wearable device can be reduced significantly. A number of studies have examined these features of accelerometer data for human activity classification, but none have examined how they affect behaviour recognition accuracy in dog tracking.
Each dog performs a range of different activities as part of their natural behaviour during the data logging period including standing, sitting, sleeping, lying, jumping and running, and all the this while wearing an accelerometer on their collar. Occasionally during the data logging period and at a time of her/his choice, the owner would record a video on a smartphone of their dog performing a range of signalling behaviours on command. A total of 132 such videos were shared with us through an online platform as soon as the video recordings were made. This allowed us to retrospectively identify and synchronise the video recordings with the accelerometer data. When the logging period was completed and the sensor returned to us, data was downloaded and the device was cleaned and shared with the next participant to repeat the process. Figure 2 outlines the data flow of the data gathering process.
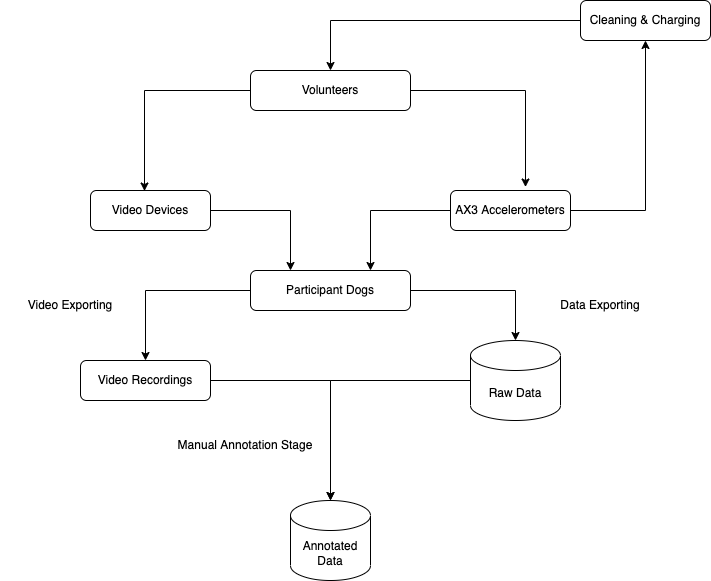
Table 2 shows the most common of the video-recorded dog behaviours in our investigation across all dogs indicating the activity performed and the time to complete it as averaged across all participant dogs. Not all dogs were able to complete all behaviours which meant we had to decide on a single signalling behaviour which was
-
(1)
common across many/most/all assistance dogs or that an assistance dog could be trained to do;
-
(2)
rarely occurring in a dog’s natural behaviour, so not sitting for example as that is a fairly commonplace activity;
-
(3)
distinct enough in terms of motion characteristics to make it more easily distinguishable from other dog movements.
| Number | Activity type | Average completion time (all dogs) |
|---|---|---|
| 1 | Spin clockwise | 1.5 sec |
| 2 | Spin anti-clockwise | 1.2 sec |
| 3 | Stand | 2.2 sec |
| 4 | Jump | 1 sec |
| 5 | Sit | 1 sec |
| 6 | Rollover | 2 sec |
| 7 | Idle | N/A |
| 8 | Other Movements | N/A |
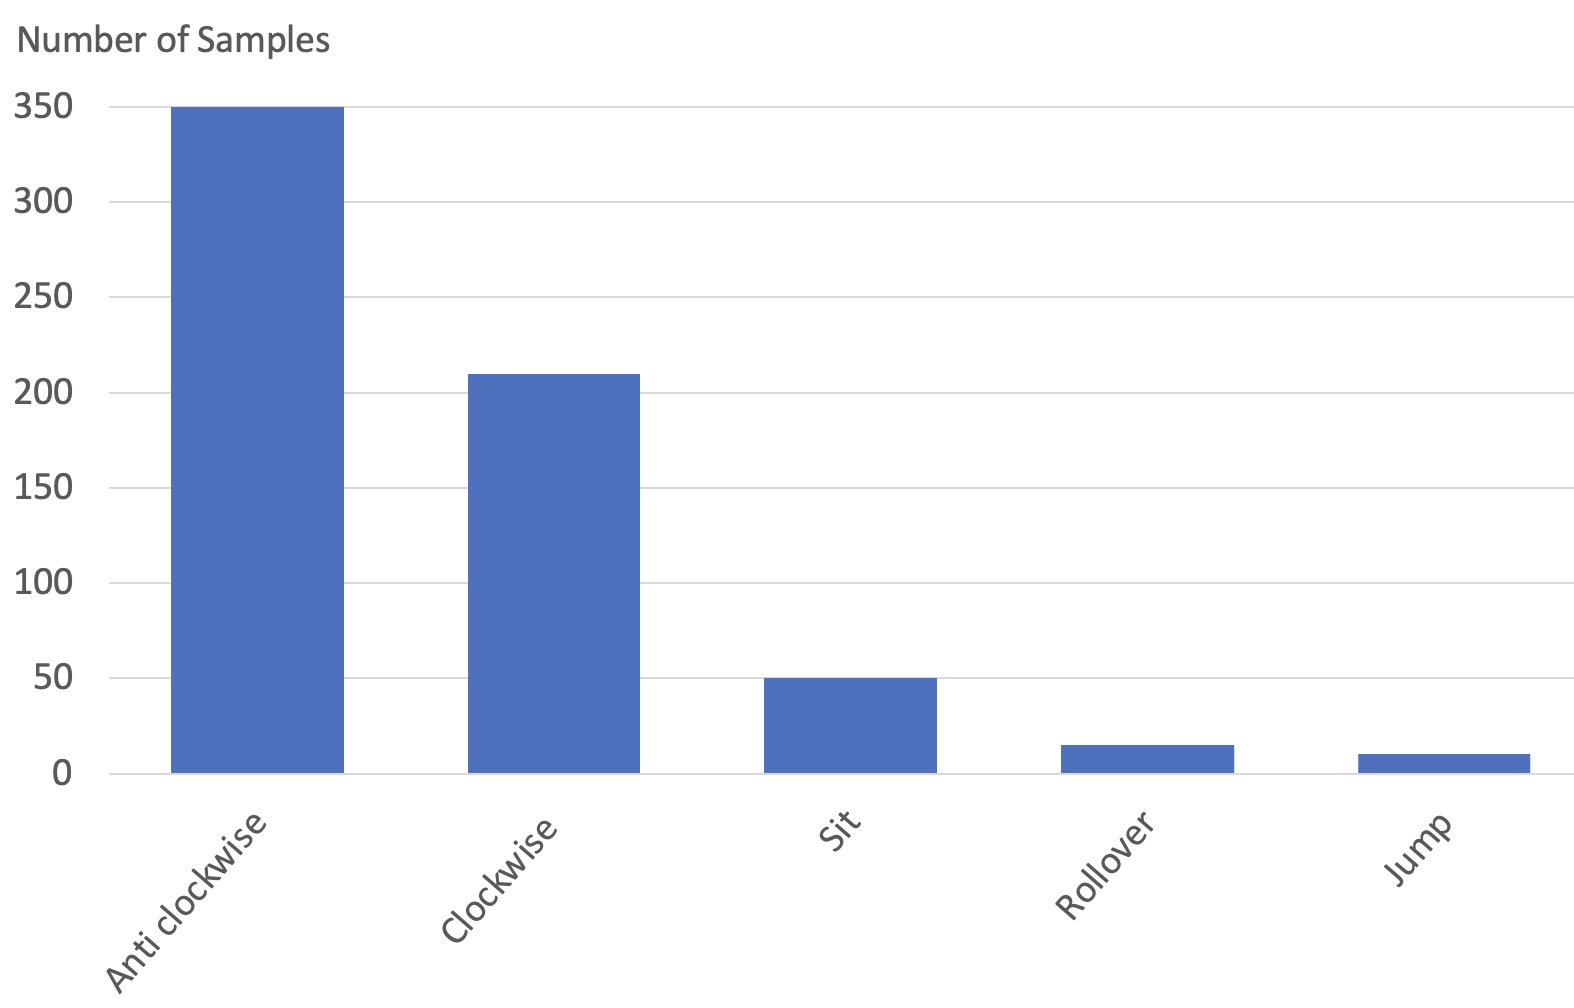
Behaviours observed during the recorded sessions across all dogs included clockwise spins, anti-clockwise spins, sitting, standing, jumping and rollovers as indicated in Figure 3. From this we can see that spins, where a dog spins in a circle with all four legs on the ground, is a signalling behaviour that meets our requirements of being easy to train, occurs rarely in day-to-day activities and is distinct enough from other dog movements to be automatically detected. There is also a sufficient number of example recordings in the videos to provide enough data on which to train a machine learning algorithm to recognise this behaviour automatically.
The data recorded on the AX3 accelerometers was downloaded at the end of each particiant’s logging period when the sensor was returned to us and the raw CWA-file was exported for further processing. Data was validated to confirm that the actual sample rate of the accelerometers matched the sample rate predefined in the OMGUI software (https://github.com/digitalinteraction/openmovement/wiki/AX3-GUI) used to configure and manage the AX3. The recorded data was then trimmed to remove data logging while the AX3 was in transit from us to the dog (by post) and from the participant back to us (by post) and cases where it was idle for prolonged periods. The volunteers had been briefed prior to sensor placement about the range of behaviours that should be performed and recorded, and the raw sensor data was manually inspected in order to annotate it with a corresponding activity label by viewing the synchronously recorded videos. This was also the method used to annotate sensor data.
As part of the process of annotating video data, activity definitions were set before analysing the videos. The accelerometer signal was not visible to the annotators while annotating. Video recordings were viewed locally and manually annotated frame-by-frame by two observers blinded to the sensor data and using a controlled vocabulary. To calculate the annotation format, the initial and final times of each activity were recorded. All the annotated information was saved which included the number and labels of movements and their time intervals, each label corresponding to a single dog behaviour. Sensor data was imported into CSV format and synchronised with the videos for each dog. Once annotated, data from each dog’s recording session was exported into a separate data file containing features for time, sensor data, and the annotated signalling behaviour.
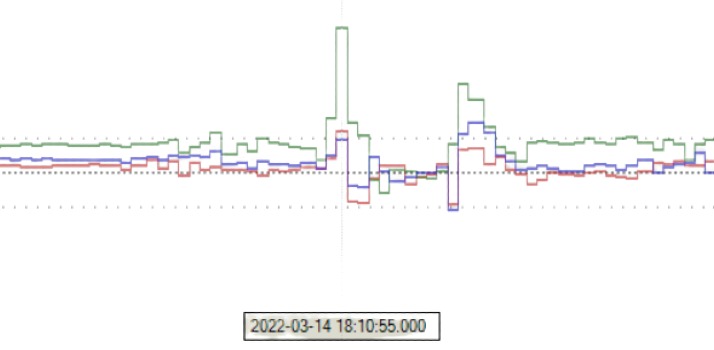
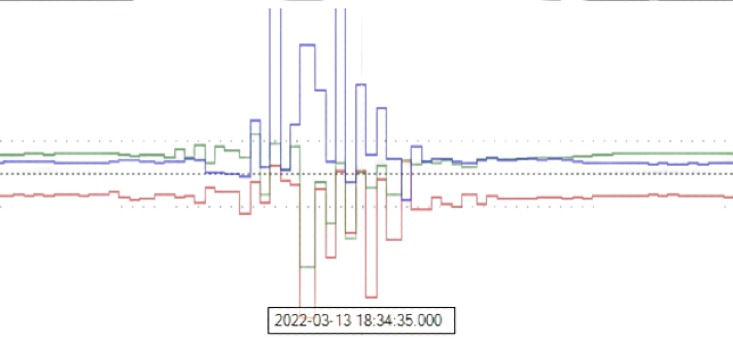
Several important points were identified during the annotation stage where sensor orientation inconsistency was observed and noted. Several examples of orientation inconsistencies were identified. In Figure 4 for example we see spikes in the intensity of motion in the y-axis and to a much lesser extent in the x- and z-axes of the accelerometer (blue and red lines respectively in Figure 4) while the jump indications were observed to a much higher extent in the accelerometer’s y-axis (green line in Figure 4. Yet for the same dog but recorded a day earlier, the recordings for the same jumping behaviour is shown in Figure 5 indicating the detection of the jumping motion by the x-axis (blue line in Figure 5) and inversely by the z-axis (red line in Figure 5) as well as by the y-axis (green line in Figure 5). This indicates that for the same jumping behaviour by the same dog and of approximately the same intensity (through the graphs in Figures 4 and 5 are not to the same scale), the dog’s collar must have rotated around her neck and hence the sensor’s orientation had changed. This demonstrates the challenge of managing the inconsistency of sensor orientation.
Finally the common annotations from the two observers were merged and exported to a single file. This method was followed by annotating for behaviour for each dog individually, by each annotator independently. Where annotators disagreed, i.e. where one annotator indicated a signalling behaviour and the other did not, then that annotation was discarded and it was only the commonly-agreed annotations that were retained. Once the annotation process was completed, the frame-by-frame output and time labels were exported to another CSV file. Finally this data could be used in various combinations to carry out the investigations. The number of annotations for each of the major dog activities is shown in Figure 3.
4. Data Preprocessing
Before developing algorithms for the classification of dog signalling behaviour, it is important to understand the nature of the signals produced by the triaxial accelerometer. These consist of three separate data streams that represent time series for acceleration on each axis x, y and z. Complementary to the three axes, an additional time series, the named sum can been obtained by computing the magnitude of the acceleration described into signal vector magnitude (SVM), a time-series independent of sensor orientation and invariant to any movement of the collar around the dog’s neck. SVM is also known as Amag and shown below, is a useful metric for calculating movements which are not axis-specific and is used extensively in pre-processing raw accelerometer data (Riaboff et al., 2022).
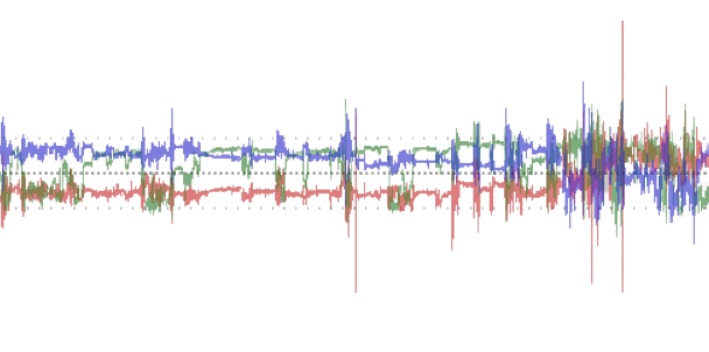
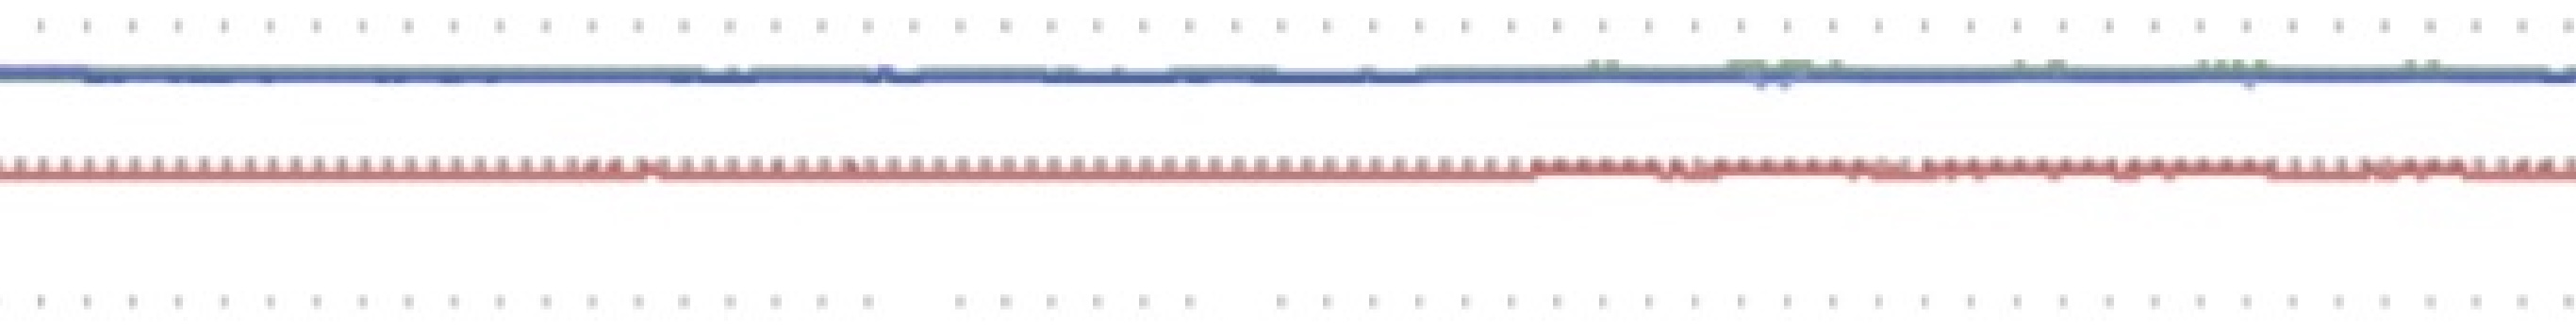
Some examples of raw accelerometer recordings are in Figure 6 indicating indicates a variety of movements in all directions being captured on the sensor in the top graph and an idle stage without any movements on the sensor indicating the dog is still in the bottom graph. Raw accelerometer data was recorded for all the participant dogs at 12Hz, giving 12 values of raw accelerometer data for each second. In order to obtain the most important and discriminative statistical features of the data we applied feature engineering where the sensor data was used to derive several features. An important advantage of feature engineering is that it allows the most relevant and important features to be extracted from a collection of data. Our feature extraction process is outlined below.
4.1. Feature Extraction
Feature sets are reduced sets of original data that represent main characteristics and behaviours and are thus abstractions of raw data. A feature vector is a subset of larger input data that contains important clues for activity recognition and is used as an input into clustering or classification algorithms. In our work we used the Time Series Feature Extraction Library (TSFEL) written in Python which automatically extracts over 500 features from a time series (Barandas et al., 2020). These include Fast Fourier Transform (FFT), Wavelet Transform (WT), Autocorrelation, Mean, Median, Sum of Absolute Differences, Entropy, Peak to Peak Distance, Slope, Zero crossing rate, Interquartile range, ECDF percentile count and ECDF slope, Spectral maximum peaks, Maximum power spectrum, etc. TSFEL can handle multidimensional time series, as is the case here.
In feature selection it is advantageous to use smaller feature sets that are fast to compute when there is a shortage of computational resources in the applications. While working with larger sets of complex time-series features can be slower to compute, it can result in higher performance in downstream applications where accuracy is more important. Feature extraction is usually applied to windows taken from a time series and testing is required to determine how the signal window size affects subsequent classification performance.
4.2. Relevant Features
The characteristics of a given classification task may require different features to be extracted from data, and some variables in the original data may be irrelevant or redundant. A feature selection technique is used to identify the most informative features and to limit the computational demands when applying the recognition system to new observations. The feature selection stage selects a smaller subset of the original features to identify those most useful features. The choice of features acquired from a data set and the window length over which they are computed are key factors.
In the work addressed here, recognising dog signalling behaviour depends directly on features extracted for motion analysis. The same signalling behaviour movement can be performed by different dogs in different ways depending on their size, speed, and age, resulting in considerable variability in the features derived from the data collected by collar-worn sensors. It is therefore important to identify features with high discriminative ability in order to achieve effective classification. An effective feature set should show little variation between repetitions of the same movements performed by the same individual dog, but should differ between different dogs performing the same task. To achieve this we extract only features related to motion and energy. This will enhance the accuracy of predicting a movement across a variety of sensor readings.
A dictionary of features is developed which categorises them into three types: statistical, temporal, and spectral as indicated in Table 3. Some of these have been extensively investigated in previous studies and have proven useful in recognising activity and motion (Vázquez Diosdado et al., 2015). A window size of 12 data values was pre-selected to correspond to approximately 1 second duration since the frequency in the AX3 is 12.5Hz, and a window overlap of 50% was set for our feature extraction.
| Statistical features | Temporal features | Spectral features |
|---|---|---|
| Kurtosis; | Zero crossing; | Maximun frequency; |
| Skewness; | Pairwise correlation; | Median frequency; |
| Mean; | Auto Correlation; | Cepstral Coefficients; |
| Standard Deviation; | Power Spectrum; | |
| Interquartile Range; | Power Bandwidth; | |
| Root Mean Square; | Fundamental | |
| Median Absolute Deviation; | Frequency Spectrum; |
The final step in data preprocessing and feature extraction is to address the difference in magnitude among the features obtained from TSFEL as several machine learning algorithms emphasise more heavily those features with a higher magnitude (Barandas et al., 2020). A normalising step is thus applied to features before classification to prevent this unwanted effect. To account for different scale factors and units, all described features are normalised to zero mean and unit variance before proceeding to algorithm development and analysis.
4.3. Algorithm Development
In order to verify if the selected features selected are informative, we use different classification methods for various dog signalling behaviours. Because the optimisation criteria are convex, Support Vector Machine classifiers are desirable in this scenario. The support vector machine is a linear classifier based on supervised learning, but it can also be used as a nonlinear classifier by using different kernel functions (Cervantes et al., 2020). In Support Vector Machine learning, the basic idea is to find the separation hyperplane that can divide the training data set correctly and have the largest set intervals. We also trained and tested the data set on other classification algorithms including logistic regression, KNN, Random forest and Naive Bayes. All our results were validated by 10-fold cross validation.
Our experiments were conducted using the Python programming language and the interface was Jupyter Labs. A standard M1 processor Macintosh with 16GB of CPU memory was used and processing time varied across different classification models.
5. Experimental Results
In prediction and classification of assistance dog signalling behaviour, conventional machine learning algorithms based on accelerometer data can be used. To distinguish between different dog behaviours and features extracted, supervised learning is used in this work. Due to the availability of annotated training data, supervised approaches are thus straightforward to implement.
In our experiments we ran different machine learning classification algorithms on the features extracted from accelerometer data from the 11 assistance dogs. The algorithms we used included Support Vector Machines, Logistic Regression, kNN, Random Forest and Naive Bayes. A classifier for each of the 11 participant dogs was trained and tested on data from that dog only, using a support vector machine classification model and the results for the detection of dog spins (in either direction) are indicated in Table 4.
| Number | Dog Breed | Precision | Recall | F1 Score | Support | Accuracy |
|---|---|---|---|---|---|---|
| 1 | Collie Mix | 0.67 | 0.71 | 0.69 | 17 | 0.78 |
| 2 | Springer/Terrier Mix | 0.67 | 1.00 | 0.8 | 4 | 0.98 |
| 3 | Spaniel | 0.46 | 0.5 | 0.55 | 11 | 0.52 |
| 4 | Poodle | 0.38 | 0.56 | 0.45 | 9 | 0.65 |
| 5 | Lurcher | 0.74 | 0.8 | 0.77 | 14 | 0.79 |
| 6 | Lurcher | 0.17 | 0.5 | 0.25 | 2 | 0.7 |
| 7 | Collie Mix | 0.64 | 0.5 | 0.56 | 14 | 0.65 |
| 8 | Hungarian Vizla | 1.00 | 0.77 | 0.87 | 13 | 0.77 |
| 9 | Border Collie | 0.67 | 1.00 | 0.8 | 2 | 0.94 |
| 10 | Australian Retriever | 1 | 0.93 | 0.97 | 15 | 0.99 |
| 11 | Golden Retriever | 0.75 | 0.43 | 0.55 | 7 | 0.76 |
| Average | 0.64 | 0.73 | 0.67 | 0.78 |
The results in Table 4 show a range of performances depending on the dog. Of the 4 evaluation measures included, recall is the most important for our use case. When an assistance dog detects a seizure onset from its owner and exhibits signalling behaviour, we always want that behaviour to be detected. Our use case can tolerate false positives where the algorithm incorrectly interprets a behaviour from the sensor data as being a signal because we can discard a false alert, but we do not want to miss a signalling behaviour, either true or false, in case it is true. Recall scores range from 0.5 to 1.0 across different dogs with an average of0.73 and while some of the per dog performance figures may be disappointing we are not interested in training a machine learning classifier to recognise signalling behaviour from each dog independently, we want to pool the annotations to train a single classifier that operates across all dogs. Nevertheless, the performance of the classifier for some dogs, notably dogs numbered 2 (Springer/Terrier), 9 (Border Collie) and 10 (Australian Retriever) was good. All of these are at the larger end of the medium sized breeds with faster movements.
The combined training data of all 11 participant dogs was used to train and test a classifier for dog spinning behaviour in either direction using the set of 5 classification model techniques mentioned earlier. Validation tests were performed using 10-fold cross validation algorithms individually for each participant and with the combined training data. The results based on the combined training data from all 11 participants are indicated in Table-5 using 5 different machine learning algorithms. Our best overall results were achieved using the random forest and the naive Bayes algorithms with naive Bayes having the best recall score at 0.98. Performance results for the support vector machine, logistic regression and kNN were not as good. It should be noted that these results were also calculated using an 10-fold cross validation to further strengthen their validity and demonstrate an acceptable level of performance for this task when used in real world scenarios.
| Number | Classifier | Precision | Recall | F1 Score | Support | Accuracy |
|---|---|---|---|---|---|---|
| 1 | Support vector machine | 0.84 | 0.62 | 0.71 | 52 | 0.71 |
| 2 | Logistic Regression | 0.74 | 0.67 | 0.70 | 50 | 0.70 |
| 3 | K-NN | 0.33 | 0.08 | 0.12 | 52 | 0.84 |
| 4 | Random Forest | 0.95 | 0.77 | 0.85 | 52 | 0.96 |
| 5 | Naive Bayes | 0.95 | 0.98 | 0.97 | 52 | 0.98 |
6. Conclusions
The combination of data from wearable sensors and machine learning is an exciting new frontier and opportunity. The contribution of this work is the design and evaluation of a behaviour recognition system based on data from a wearable accelerometer that identifies the presence of a pre-trained signalling behaviour. The set of features automatically extracted from the sensor data ensures acceptable recall in terms of classification results. The results presented here suggest that using a realtime equivalent of the AX3 accelerometer can identify dogs’ signalling behaviour and for an assistance dog trained to alert when sensing the onset of an epileptic seizure, this can then trigger an alert to the owner or carer.
One possibility suggested to further improve the quality of the classification is to use additional wearable sensors besides accelerometry. (Arablouei et al., 2022) has worked with accelerometry fused with GNSS or GPS data but this or any other form of location information would not be useful in our use case since an assistance dog’s signalling behaviour could occur anywhere, including indoors.
Future research is needed to continue to develop and refine the model to identify additional signalling behaviours that could be performed easily by dogs and for which they could easily be trained. These could include rollovers, beg-ups, and other distinct behaviours.
References
- (1)
- Arablouei et al. (2022) Reza Arablouei, Ziwei Wang, Greg J Bishop-Hurley, and Jiajun Liu. 2022. Multi-modal Sensor Data Fusion for In-situ Classification of Animal Behavior Using Accelerometry and GNSS Data.
- Barandas et al. (2020) Marília Barandas, Duarte Folgado, Letícia Fernandes, Sara Santos, Mariana Abreu, Patrícia Bota, Hui Liu, Tanja Schultz, and Hugo Gamboa. 2020. TSFEL: Time series feature extraction library. SoftwareX 11 (2020), 100456.
- Bhuvaneswari et al. (2020) M Bhuvaneswari, J Shafiq Mansoor, T.S Aravinth, M Arun Kumar, and R Sangeetha. 2020. An Automatic System for Detection and Suppression of Epileptic Seizure. In 2020 4th International Conference on Electronics, Communication and Aerospace Technology (ICECA). 1524–1529. https://doi.org/10.1109/ICECA49313.2020.9297423
- Brown and Goldstein (2011) Stephen W Brown and Laura H Goldstein. 2011. Can seizure-alert dogs predict seizures? Epilepsy Research 97, 3 (2011), 236–242.
- Catala et al. (2018) Amelie Catala, Hugo Cousillas, Martine Hausberger, and Marine Grandgeorge. 2018. Dog alerting and/or responding to epileptic seizures: A scoping review. PloS ONE 13, 12 (2018), e0208280.
- Cervantes et al. (2020) Jair Cervantes, Farid Garcia-Lamont, Lisbeth Rodríguez-Mazahua, and Asdrubal Lopez. 2020. A comprehensive survey on support vector machine classification: Applications, challenges and trends. Neurocomputing 408 (2020), 189–215.
- Chambers et al. (2021) Robert D Chambers, Nathanael C Yoder, Aletha B Carson, Christian Junge, David E Allen, Laura M Prescott, Sophie Bradley, Garrett Wymore, Kevin Lloyd, and Scott Lyle. 2021. Deep learning classification of canine behavior using a single collar-mounted accelerometer: Real-world validation. Animals 11, 6 (2021), 1549.
- den Uijl et al. (2017) Ingrid den Uijl, Constanza B Gómez Álvarez, David Bartram, Yoni Dror, Robert Holland, and Alasdair Cook. 2017. External validation of a collar-mounted triaxial accelerometer for second-by-second monitoring of eight behavioural states in dogs. PloS ONE 12, 11 (2017), e0188481.
- Hussain et al. (2022) Ali Hussain, Sikandar Ali, Abdullah, and Hee-Cheol Kim. 2022. Activity Detection for the Wellbeing of Dogs Using Wearable Sensors Based on Deep Learning. IEEE Access 10 (2022), 53153–53163. https://doi.org/10.1109/ACCESS.2022.3174813
- Kumpulainen et al. (2021) Pekka Kumpulainen, Anna Valldeoriola Cardó, Sanni Somppi, Heini Törnqvist, Heli Väätäjä, Päivi Majaranta, Yulia Gizatdinova, Christoph Hoog Antink, Veikko Surakka, Miiamaaria V Kujala, et al. 2021. Dog behaviour classification with movement sensors placed on the harness and the collar. Applied Animal Behaviour Science 241 (2021), 105393.
- Litt and Echauz (2002) Brian Litt and Javier Echauz. 2002. Prediction of epileptic seizures. The Lancet Neurology 1, 1 (2002), 22–30.
- Maa et al. (2021) Edward Maa, Jennifer Arnold, Katherine Ninedorf, and Heather Olsen. 2021. Canine detection of volatile organic compounds unique to human epileptic seizure. Epilepsy & Behavior 115 (2021), 107690. https://doi.org/10.1016/j.yebeh.2020.107690
- Majumder and Deen (2020) Sumit Majumder and M. Jamal Deen. 2020. A Robust Orientation Filter for Wearable Sensing Applications. IEEE Sensors Journal 20, 23 (2020), 14228–14236. https://doi.org/10.1109/JSEN.2020.3009388
- Migueles et al. (2017) Jairo H Migueles, Cristina Cadenas-Sanchez, Ulf Ekelund, Christine Delisle Nyström, Jose Mora-Gonzalez, Marie Löf, Idoia Labayen, Jonatan R Ruiz, and Francisco B Ortega. 2017. Accelerometer data collection and processing criteria to assess physical activity and other outcomes: a systematic review and practical considerations. Sports Medicine 47, 9 (2017), 1821–1845.
- Naik et al. (2020) Hemal Naik, Renaud Bastien, Nassir Navab, and Iain D Couzin. 2020. Animals in Virtual Environments. IEEE Transactions on Visualization and Computer Graphics 26, 5 (2020), 2073–2083. https://doi.org/10.1109/TVCG.2020.2973063
- Powell et al. (2021) Neil A Powell, Alastair Ruffell, and Gareth Arnott. 2021. The untrained response of pet dogs to human epileptic seizures. Animals 11, 8 (2021), 2267.
- Riaboff et al. (2022) L Riaboff, L Shalloo, AF Smeaton, S Couvreur, A Madouasse, and MT Keane. 2022. Predicting livestock behaviour using accelerometers: A systematic review of processing techniques for ruminant behaviour prediction from raw accelerometer data. Computers and Electronics in Agriculture 192 (2022), 106610.
- Rohan et al. (2020) Tanbin Islam Rohan, Md. Salah Uddin Yusuf, Monira Islam, and Shidhartho Roy. 2020. Efficient Approach to Detect Epileptic Seizure using Machine Learning Models for Modern Healthcare System. In 2020 IEEE Region 10 Symposium (TENSYMP). IEEE, 1783–1786. https://doi.org/10.1109/TENSYMP50017.2020.9230731
- Smeaton et al. (2022) Alan F. Smeaton, Hitesh Raju, and Ankit Sharma. 2022. Accelerometer and annotation data for trained assistance dogs performing signalling behaviour on instruction. https://doi.org/10.6084/m9.figshare.20459367.v1
- Vázquez Diosdado et al. (2015) Jorge A Vázquez Diosdado, Zoe E Barker, Holly R Hodges, Jonathan R Amory, Darren P Croft, Nick J Bell, and Edward A Codling. 2015. Classification of behaviour in housed dairy cows using an accelerometer-based activity monitoring system. Animal Biotelemetry 3, 1 (2015), 1–14.
- Yam et al. (2011) PS Yam, V Penpraze, David Young, MS Todd, AD Cloney, KA Houston-Callaghan, and John J Reilly. 2011. Validity, practical utility and reliability of Actigraph accelerometry for the measurement of habitual physical activity in dogs. Journal of Small Animal Practice 52, 2 (2011), 86–91.
- Yu et al. (2016) Pen-Ning Yu, Shokofeh A. Naiini, Christi N. Heck, Charles Y. Liu, Dong Song, and Theodore W. Berger. 2016. A sparse Laguerre-Volterra autoregressive model for seizure prediction in temporal lobe epilepsy. In 2016 38th Annual International Conference of the IEEE Engineering in Medicine and Biology Society (EMBC). 1664–1667. https://doi.org/10.1109/EMBC.2016.7591034
- Zamansky et al. (2019) Anna Zamansky, Dirk van der Linden, Irit Hadar, and Stephane Bleuer-Elsner. 2019. Log My Dog: Perceived Impact of Dog Activity Tracking. Computer 52, 9 (2019), 35–43. https://doi.org/10.1109/MC.2018.2889637