rate-distortion optimization with alternative references for
UGC video compression
Abstract
User generated content (UGC) refers to videos that are uploaded by users and shared over the Internet. UGC may have low quality due to noise and previous compression. When re-encoding UGC for streaming or downloading, a traditional video coding pipeline will perform rate-distortion (RD) optimization to choose coding parameters. However, in the UGC video coding case, since the input is not pristine, quality “saturation” (or even degradation) can be observed, i.e., increased bitrate only leads to improved representation of coding artifacts and noise present in the UGC input. In this paper, we study the saturation problem in UGC compression, where the goal is to identify and avoid during encoding, the coding parameters and rates that lead to quality saturation. We proposed a geometric criterion for saturation detection that works with rate-distortion optimization, and only requires a few frames from the UGC video. In addition, we show how to combine the proposed saturation detection method with existing video coding systems that implement rate-distortion optimization for efficient compression of UGC videos.
Index Terms— user generated content, video compression, rate-distortion optimization, denoising, quality saturation
1 Introduction
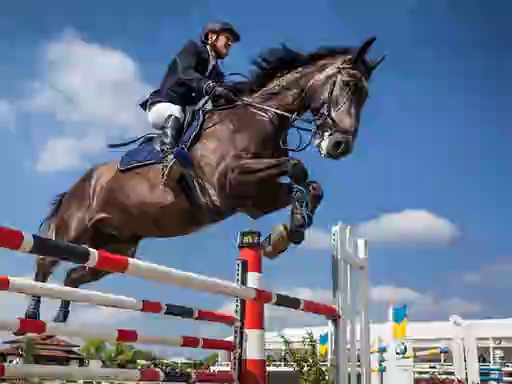
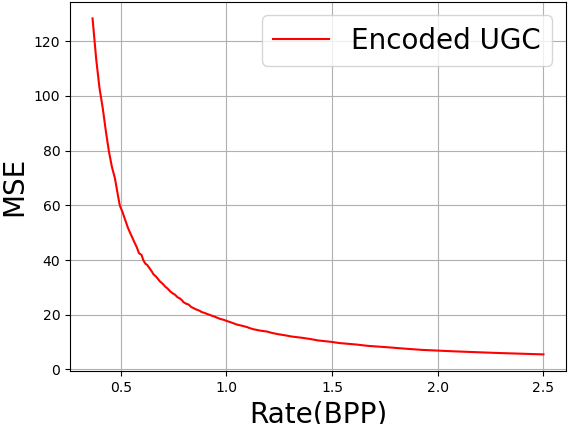
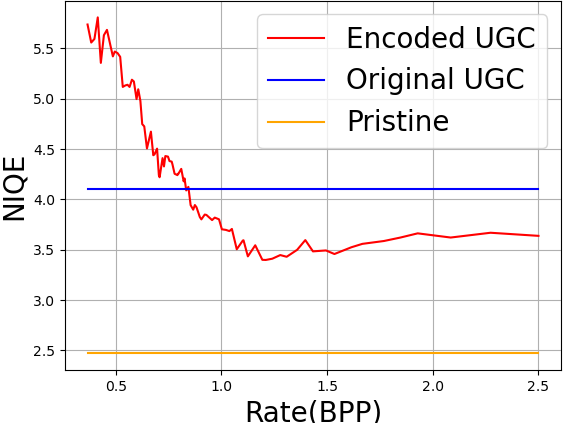
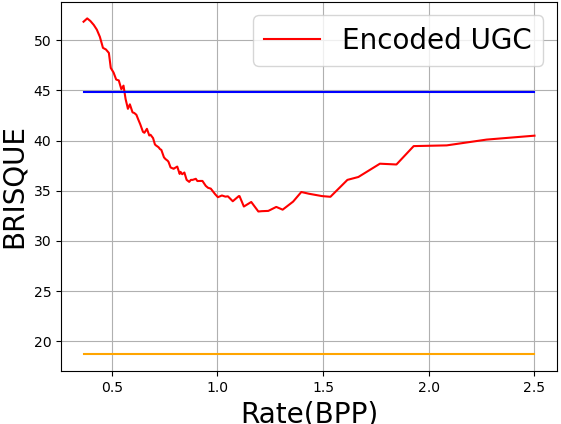
Videos that are created by users and then uploaded to video sharing services (e.g. YouTube) are commonly referred to as user generated content (UGC) [1]. Service providers re-encode UGC videos at multiple resolutions and quality levels for streaming. The traditional video coding pipeline assumes the input video is pristine and makes use of rate-distortion (RD) optimization to ensure efficient bitrate allocation [2, 3]. However, when encoding UGC videos, which may have low quality due to previous compression, a traditional RD optimization (RDO) framework that uses the UGC input as reference will allocate bitrate to preserve undesirable artifacts. To illustrate this idea consider the example of Figure 1 where a previously compressed image is re-encoded with JPEG and two no-reference image quality assessment metrics, NIQE [4] and BRISQUE [5], are used to evaluate the perceptual quality of the re-encoded image. As shown by 1(c) and 1(d), the perceptual quality does not improve (i.e., it “saturates”) when the rate is . While perceptual quality saturates, mean-squared-error (MSE) continues to decrease (1(b)), which suggests that additional rate is mostly helping represent coding artifacts in the UGC. Thus for this specific UGC image, rate should not be increased beyond .
Following [6], we define the UGC compression problem as: Given an UGC signal and a compression system (e.g., JPEG, H.264), choose coding parameters to accurately represent the perceptually meaningful parts of the signal, while avoiding allocating resources to encode compression artifacts and noise. Recent approaches to choose coding parameters for UGC are based on no-reference quality metrics and content quality classification approaches [5, 7, 8, 9, 10, 11, 12]. However, these strategies are out-of-the-loop (i.e., they are applied before encoding or after decoding, as in the example from Figure 1), and usually require training on a large-scale dataset. In [6], we addressed the UGC compression problem from an RD theoretic perspective, where the signal to be encoded is noisy and distortion is computed with respect to an unavailable pristine reference. Using the noisy source coding theorem [13, 14], we showed that a theoretically optimal UGC compression system applies an optimal denoiser to the UGC video followed by optimal source coding of the denoised UGC. For a practical UGC video compression system, we proposed using off-the-shelf denoisers to compute a denoised UGC to be used as an alternative reference for distortion computation. We showed that quality saturation occurs, and proposed a method to detect it.
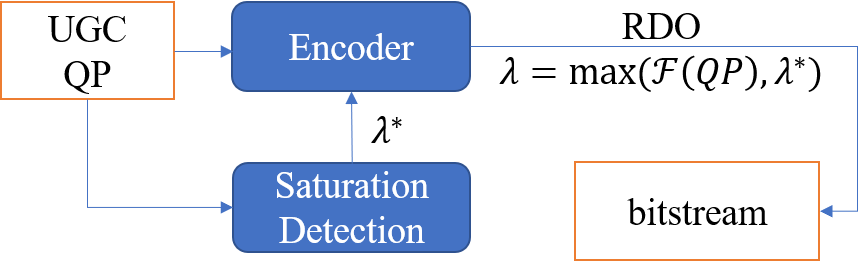
In this paper, we address several of the limitations of our previous approach [6] and work towards developing a practical UGC compression system. While in theory a denoised UGC should be used both as a reference and as a source, in [6] it was only used as a reference. In this work, we provide further evidence to support that choice. We show that there is little perceptual difference between encoding the UGC and encoding the denoised UGC (see Section 3.1). In addition, the RD curve from encoding denoised UGC does not have a MSE saturation region, which makes it difficult to decide when to stop increasing the bitrate. Finally, encoding a denoised UGC requires denoising the whole UGC video which comes with a high computational cost, while the proposed UGC compression approach only requires denoising a few video frames for saturation detection. We also show that the saturation criterion in [6] does not always work and depends on the denoising method. As an alternative, we propose a new saturation detection criterion (Section 2.2). Our approach is more principled, while also being more robust to the choice of denoiser. Finally, we propose a low complexity saturation detection method for the whole video by performing RDO with a simplified codec, and using only a subset of frames (Section 2.3). Our method returns a saturation parameter () that controls the RD trade-off and can be given as input to a traditional video coding system that performs the actual encoding and RDO (see Figure 3). Our proposed method serves as a practical plug-in module that can operate with any codec implementing RDO.
2 Quality saturation and RDO
In this section we describe our pipeline. We first introduce an elementary inequality that relates various distortion metrics and use it to define a saturation region. Then we describe the proposed UGC compression system that performs RDO.
2.1 Geometric relation between different distortions
We consider a traditional video compression system that encodes the UGC video with parameters , and produces a decoded UGC video . For such a system, there exist a set of parameters , so that , and thus , and the rate of the encoded representation of increases with . Examples of include QP parameters used in H.264. A traditional video coding system, would use the distortion to measure quality and perform RDO. In [6] we proposed using to compute distortion, where is a de-noised signal obtained from . We showed experimentally that the corresponding RD curve saturates at higher bitrates, and converges to . We can formalize this observation as follows. Using the identity , valid for any , and the triangular inequality, the distortions are related as follows:
| (1) | ||||
| (2) |
for any reference and any coding parameter . From (2), we can see that convergence occurs faster at low rates than at high rates, and detecting the transition from one regime to the other will be helpful to detect saturation. More precisely, we observe:
High bitrate, low distortion regime. When is small, then . In this region, distortion decays more slowly and thus quality has saturated.
Low bitrate, high distortion regime. When is larger, then . In this region, distortion decays at the same rate as a traditional system.
Transition point. Transition from quadratic decay (low bitrates) to linear decay (higher bitrates) occurs approximately when both terms on the right side of (2) are equal, i.e., .
2.2 Saturation region detection
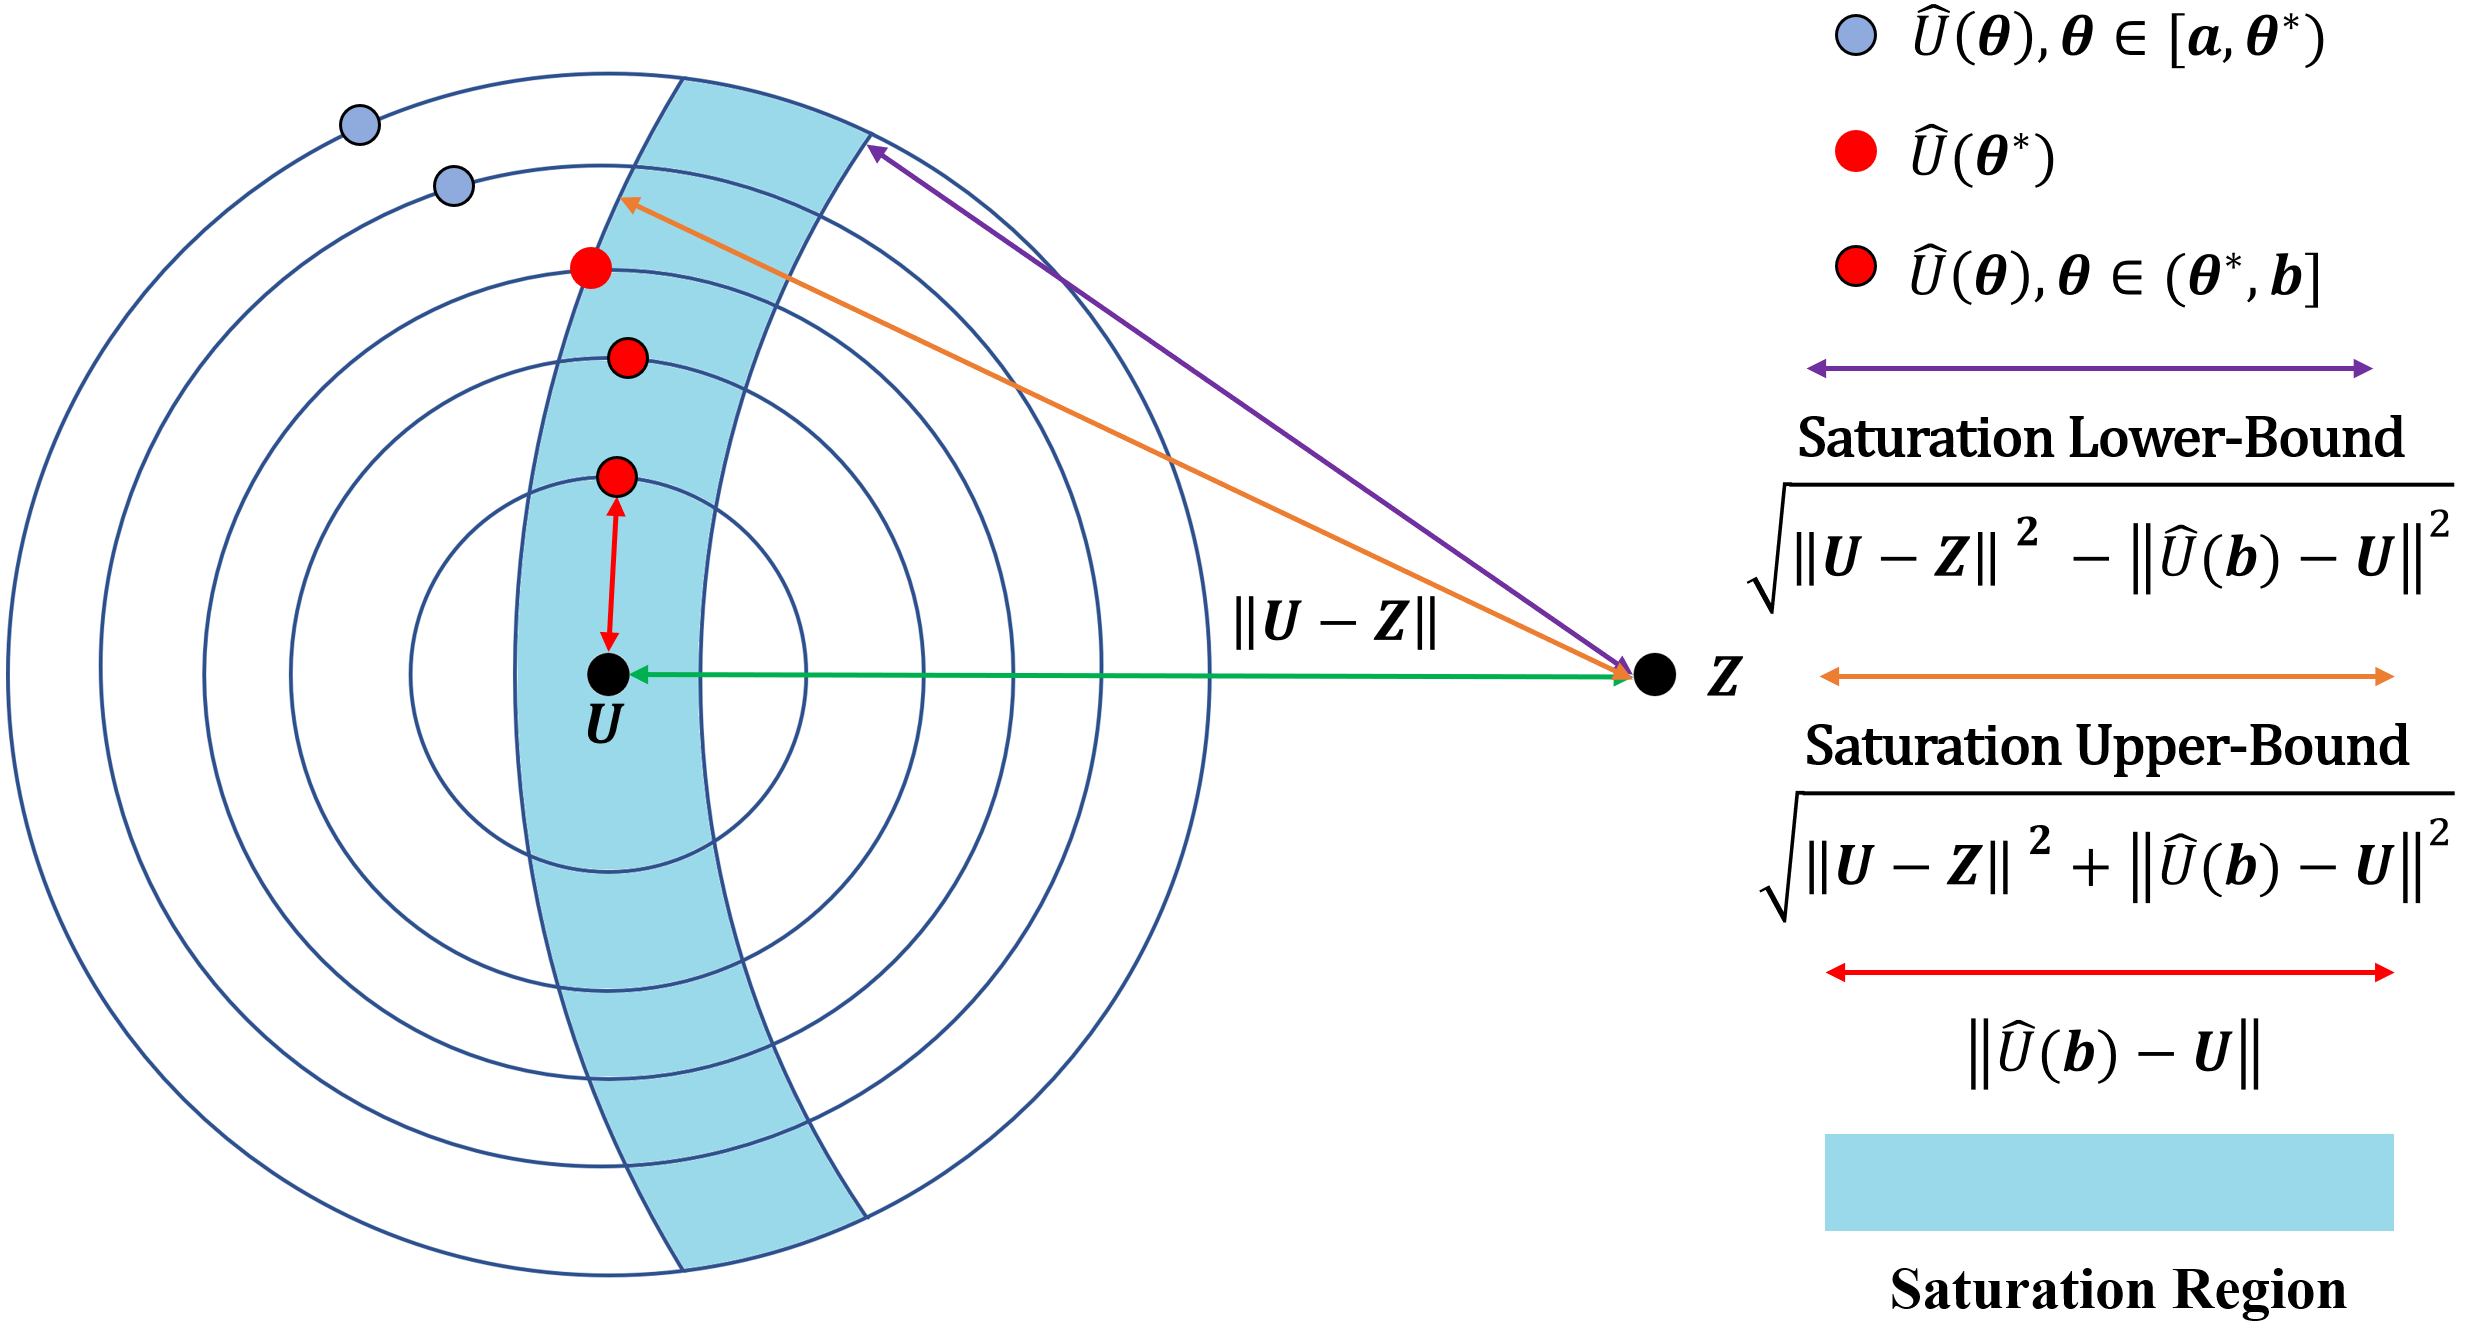
We now use the results from the previous section to detect saturation, i.e., when is sufficiently close to . From (1) we see that in the saturation region, distortion decreases more slowly. Thus our goal will be to identify the transition point from quadratic to linear behavior. Without loss of generality, suppose the coding parameter belongs to a closed interval , with a higher resulting in higher bitrate and lower distortion. We define the saturation region as the largest interval (the one with the smallest ) such that:
| (3) |
We say that is the saturation onset or saturation point. Note that
| (4) | ||||
| (5) |
, thus (3) is stronger than (2). The region (3) is illustrated in Figure 2. Each circle centered at has radius , representing possible positions of . The radius of the smallest circle is . The saturation region is delimited by two circles centered at . The largest and smallest circles have equation
| (6) | ||||
| (7) |
with radius and , respectively. The blue and red points in Figure 2 show how the saturation is detected, as we enter the shaded blue region. As increases, approaches , so that is getting smaller and is saturating.
2.3 Rate-distortion optimization with alternative reference
The encoder-decoder parameters in a traditional video codec are obtained using RDO [2, 3] by solving the optimization problem
| (8) |
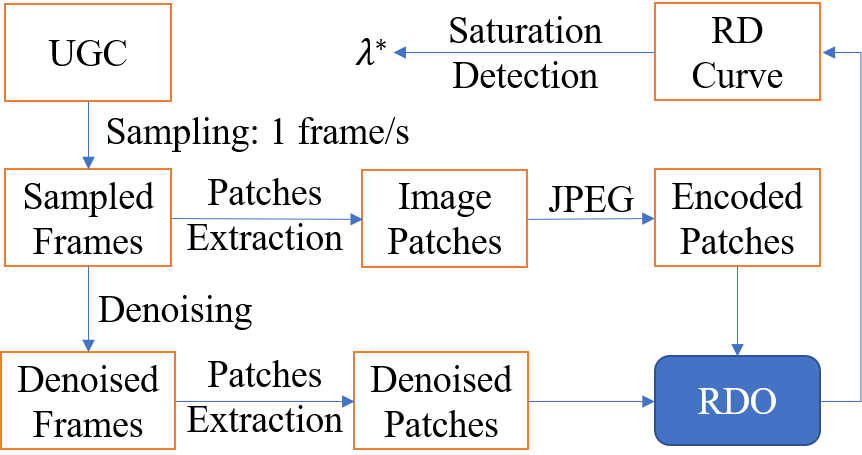
where is the Lagrange cost, is a set of coding parameters (e.g., mode decision, quantization parameters, transform size, etc.), is the MSE distortion between the encoded UGC and the input . is the rate of . The parameter controls the trade-off between rate and distortion. When is small, solutions with higher bitrate are encouraged, and thus when encoding UGC, a small leads to quality saturation. 3(a) depicts the proposed UGC compression system. It consists of a traditional video compression system that performs RDO, along with a saturation detection module, which takes an input UGC video, and returns a saturation . In a traditional compression system, a typical input parameter is the “QP” value which can be easily converted into an input [16]. If , the input “QP” parameter is in the saturation region, thus the encoder performs RDO with parameter . When , the encoder performs RDO as normal with parameter . The saturation detection module depicted in 3(b) also utilizes RDO. Because saturation detection requires a RD curve covering a wide range of RD pairs, in order to reduce computational complexity we consider a simplified system where only a few frames are considered (e.g., per second). For encoding, we use JPEG and allow different quantization parameters for each patch.
The UGC video , and the denoised UGC are partitioned into non overlaping patches. For each patch, there is a single coding parameter that will be optimized. The rate and distortion of the th patch are denoted by and , respectively. is the distortion between the encoded th patch and the denoised th patch . Given , we solve the RDO problem
| (9) |
The vector of optimal coding parameters that solves (9) is denoted by , while the optimal total rate is denoted by and the optimal total distortion (MSE between encoded UGC and denoised UGC) is given by . We apply RDO and solve (9) for a wide range of to obtain an RD curve with pairs , from which saturation can be detected. Given and , we can rewrite the saturation equation (3) and define saturation as the largest value satisfying
| (10) |
for all . In a traditional codec, distortion is computed with respect to . Since is the saturation we found when is the reference, it controls the rate-distortion trade-off using this particular choice of distortion. We still need to find the saturation appropriate for the case where is the reference used for distortion computation, and that can be provided as input to a traditional codec performing RDO. Once we obtain , the saturation rate is given by . As we do not want to operate at a rate larger than , we define the saturation as the smallest value such that
| (11) |
where is the minimizer of the RDO of (9) with parameter and using the traditional distortion .
3 Experiment
3.1 Encoding the de-noised references
For this experiment, we use the KADID-10k dataset [15, 17], which has pristine images named from ’I01’ to ’I81’. For each pristine image, we used the H.264 in Ffmpeg to simulate UGC images with compression noise using quantization values from to . Then, for each UGC image, we applied three different video/image restoration methods: De-Blocking (DB) from ffmpeg, Artifact Removal [18] (AR) and Practical Blind Denoising [19] (PBD). We encode each image (UGC or de-noised UGC) with JPEG [20], using different quality values (). Then, we use Naturalness Image Quality Evaluator (NIQE) [4] to evaluate the quality of the compression results. Note that we could still apply the idea from Figure 2 to detect the saturation. Since RDO is not used in this experiment, we detect the saturation (JPEG ) instead of using constraint (3). Choosing different , we may obtain different saturation points as is shown in LABEL:fig:Histogram left. Also, we mark the location of averaged saturation point considering all the saturation points detected by different with crossing. There are very clear turning points on the curves, which indicates that the saturation behavior exists when encoding either UGC or de-noised references. To further understand the saturation phenomenon, we calculated the average slope between the detected saturation point and points to its left and its right. As is shown in LABEL:fig:Histogram right, the left slopes are almost all negative (since quality improves before saturation) while the right slopes appear randomly distributed around zero. This provides evidence of successful saturation detection.
3.2 Saturation Detection on UGC Videos
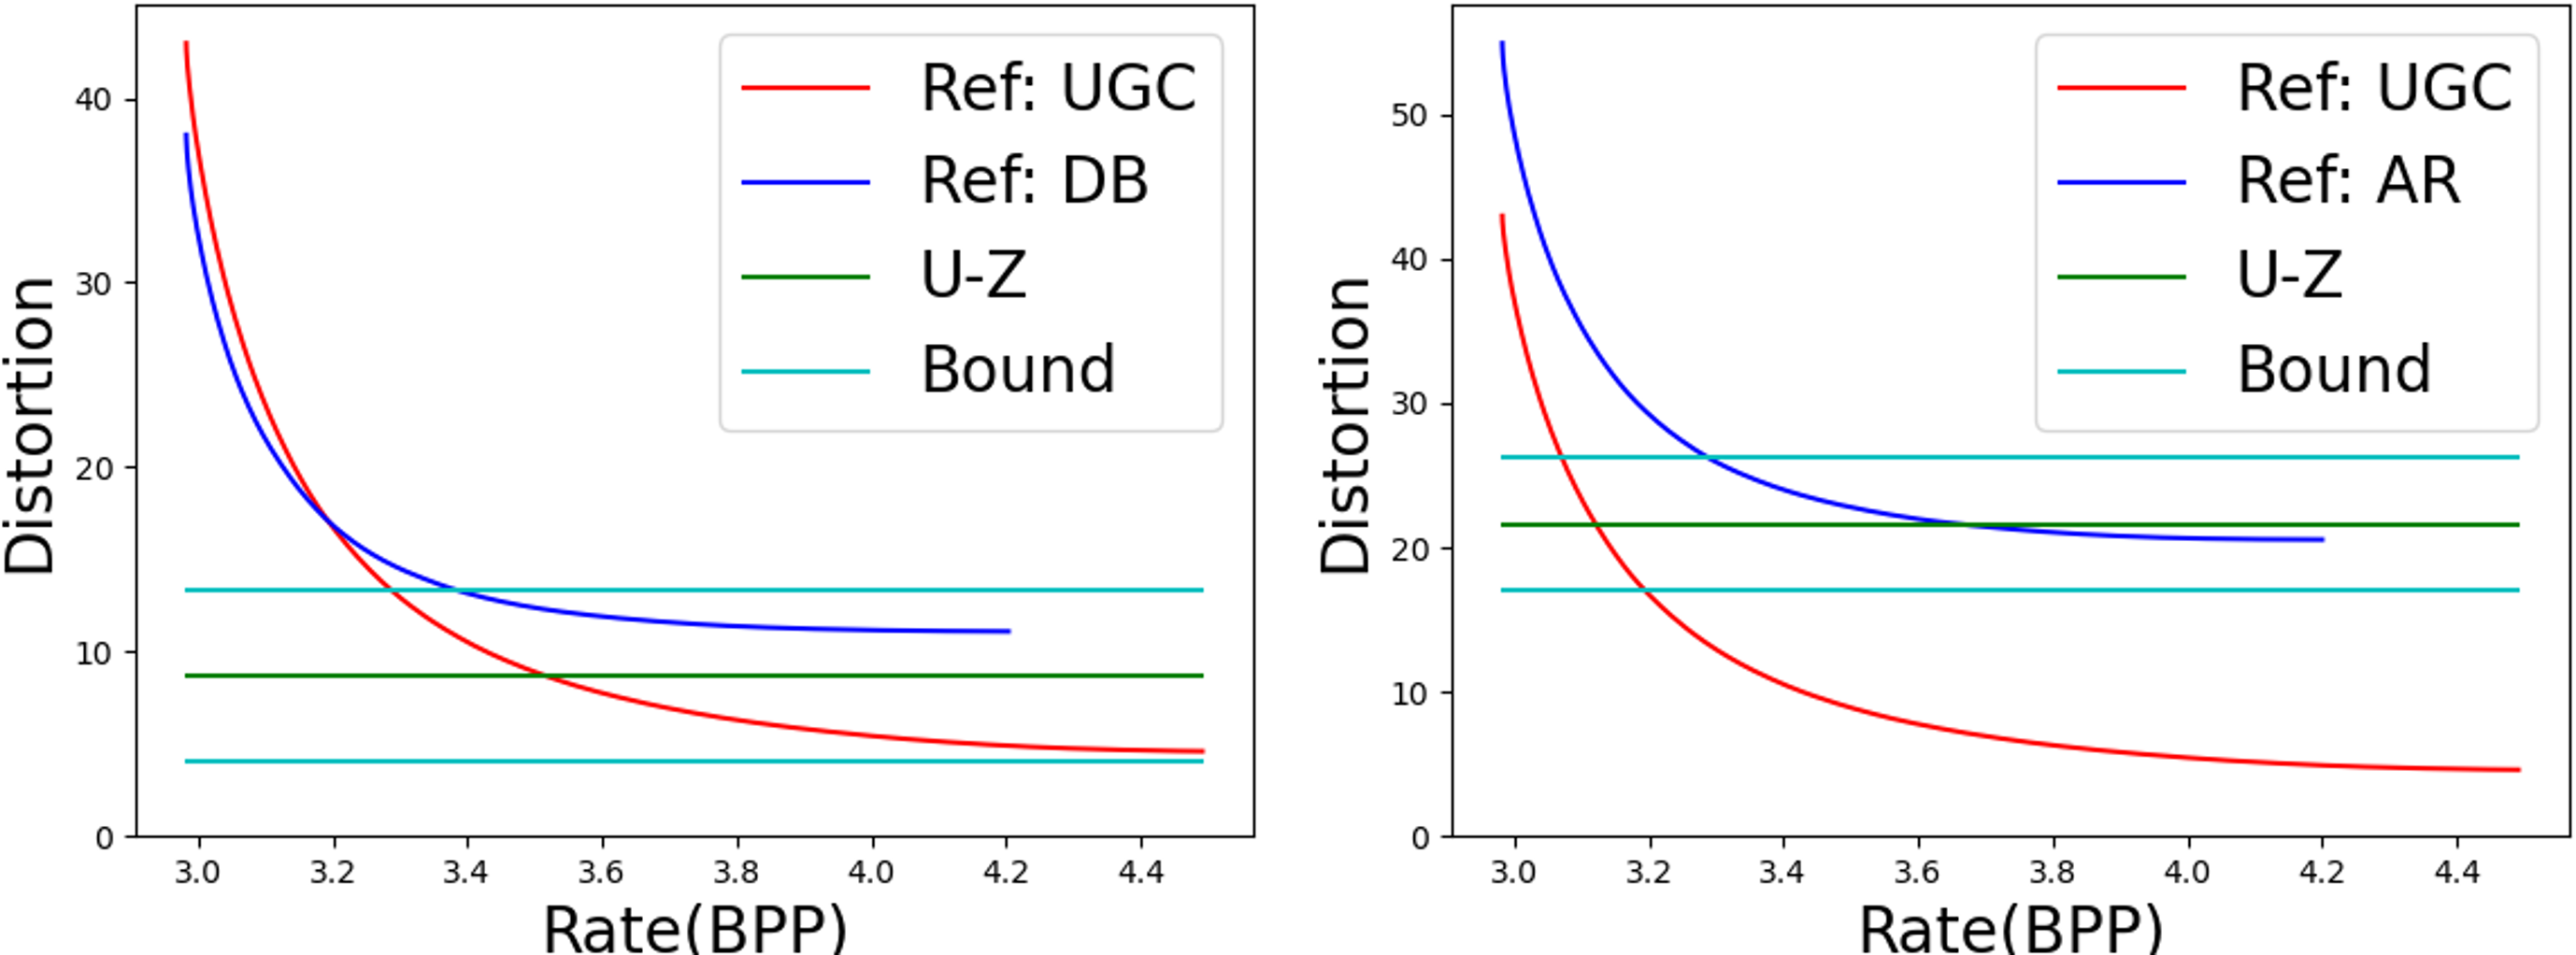
The video dataset BVI-CC [21, 22] contains 9 pristine video sequences (named ’S11’ to ’S19’) with two resolutions: and . Each video is seconds long, with frames per second. For convenient, we used the videos and down-sampled them into . We took the down-sampled videos as the pristine videos and used H.264 in Ffmpeg to create UGC videos with ranging from 23 to 51. Then we uniformly sampled 5 frames out of 300 for saturation detection. On each video, we applied three different image/video restoration methods: De-Blocking (DB) from Ffmpeg, Artifacts Removal [18] (AR) and Practical Blind Denoising [19] (PBD). Then, each frame and its DB, AR and PBD references were uniformly divided into 90 patches of size . We encoded each patch with JPEG [20], using different quality values (, ) ranging from from (worst) to (best). Since JPEG has only one quality factor, for each patch, the minimization of RDO object function (8) could be easily achieved by traversing all possible . Figure 5 shows the RD curves of a UGC video () with two different de-noised references, DB and AR. In each figure, the red curve takes as reference while the blue curve takes as reference. Each point on a curve represents compressing patches by JPEG via RDO toward a specific . Figure 5 shows that blue curves converge to the green line, which is . Using the proposed saturation detection method (10), the saturation could be found at the intersection of the blue curve and the upper light blue line, which is the upper bound of saturation in (10). Then, we could find the from the red curve using (11). In [6], saturation is detected by the intersection of blue and red RD curves. However, when is computed with AR, the blue curves are always under the red curves and there is no intersection, thus the saturation detection method from[6] would fail in this case. Nevertheless, the saturation exists and could be detected by our method.
3.3 Experiments with real H.264 codec
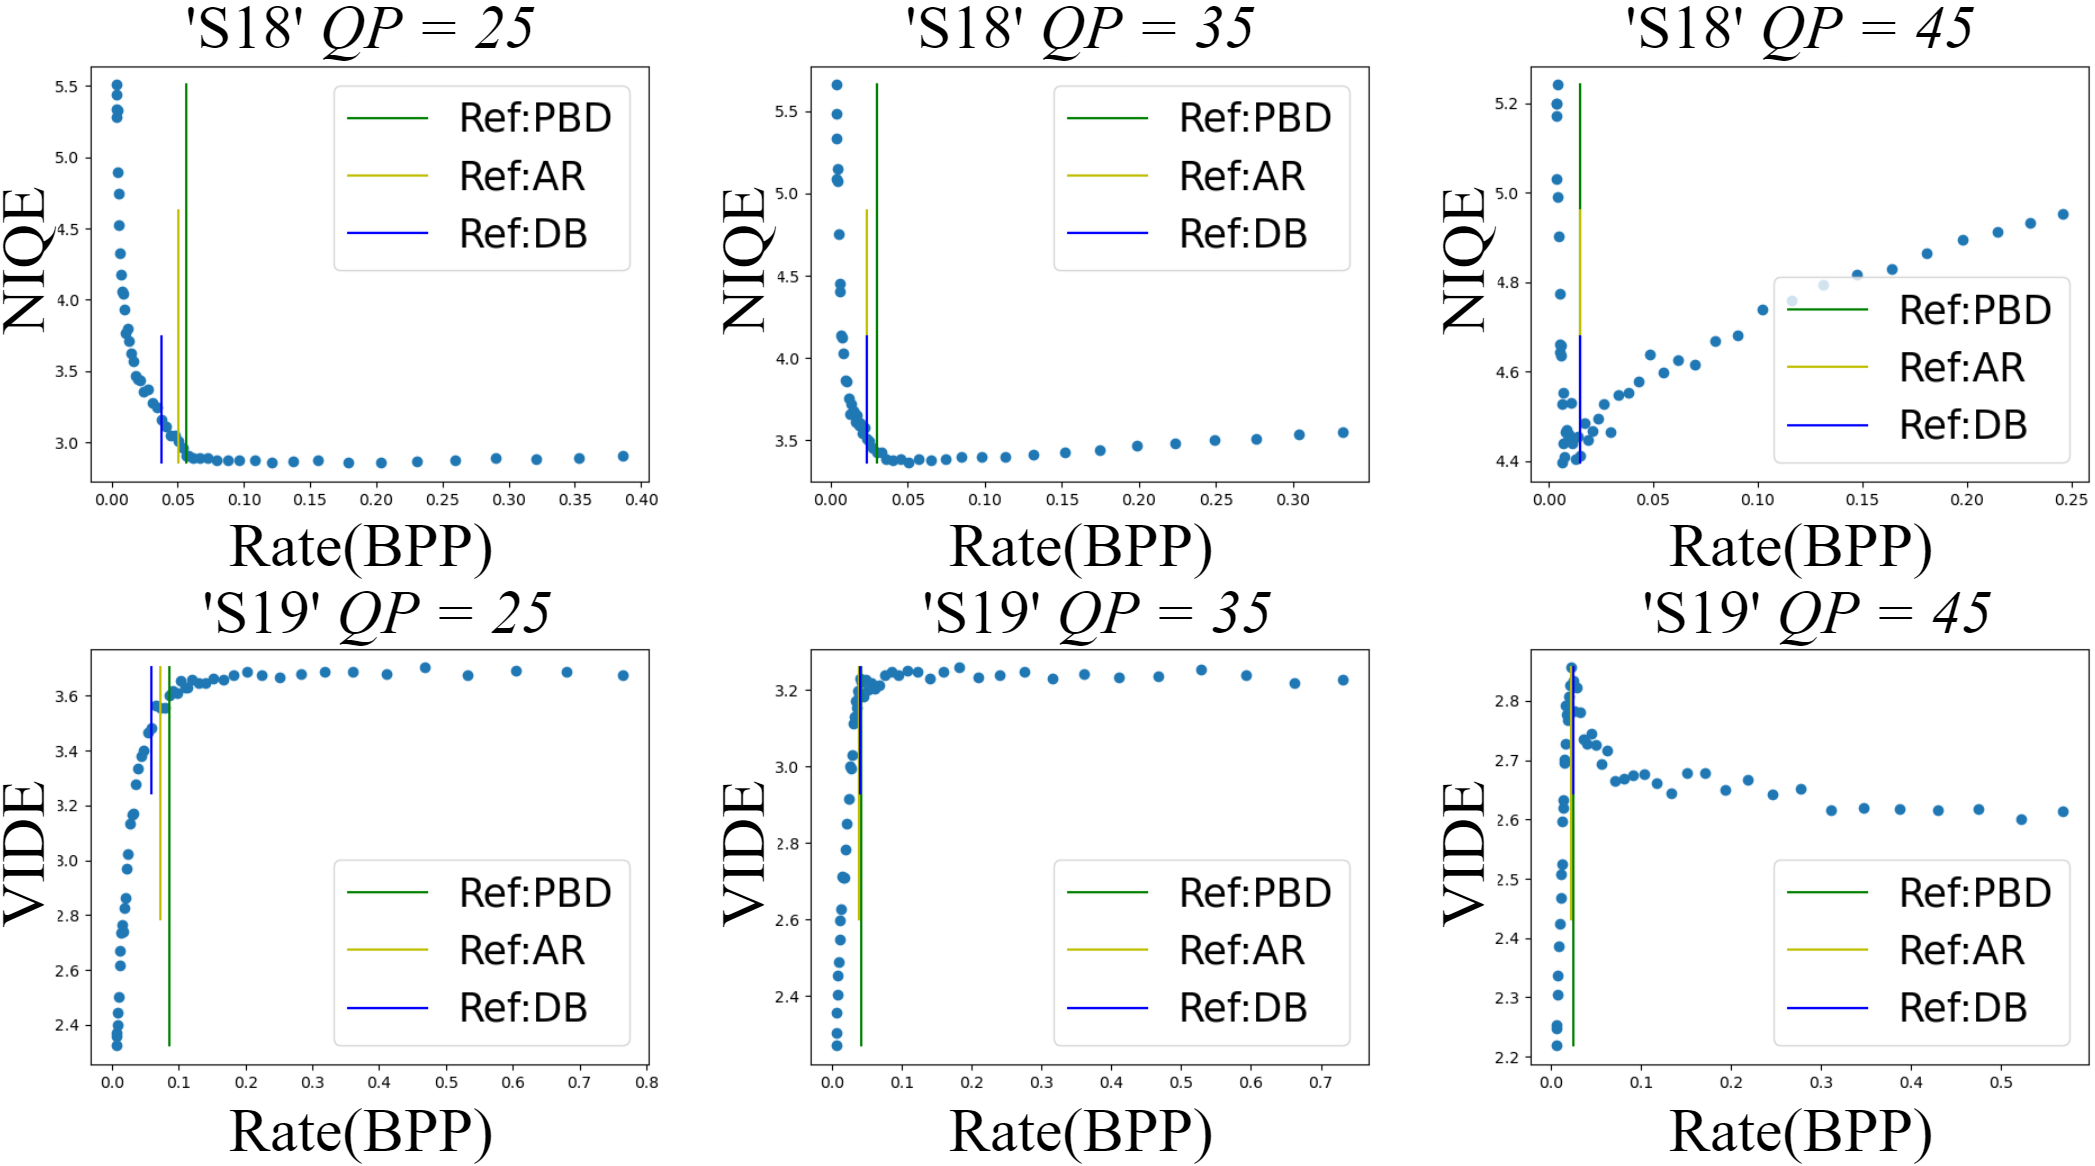
To evaluate the saturation detected, we re-compressed the UGC video with Ffmpeg H.264 codec using different and evaluated the results. Since Ffmpeg does not accept as an input (which is the output of our saturation detection method), we use the following relation [16], valid for ,
| (12) |
to translate the saturation in to . Choosing a will result in waste of rate and no improvement on quality. We use NIQE and a no-reference quality metric for UGC video, VIDE [23] for quality evaluation. Note lower NIQE value means better quality while higher VIDE value represents better quality. Figure 6 shows the quality of re-compressed UGC videos H.264 at different rates. For any UGC video in Figure 6, we could see clearly the saturation happens with both of the NIQE and VIDE. Furthermore, our detected saturation accurately marks the turning point of the quality curves, which shows the correctness and accuracy of our proposed method. We also see that when and is DB, the saturation detected (blue line) is worse than is AR or PBD. This indicates that DB may not be adaptive enough to UGC input with good quality, while AR and PBD produce better results.
4 Conclusion
In this paper, we proposed a practical system for quality saturation detection that can be combined with traditional compression systems for UGC video compression. The proposed saturation detection is based on RDO implemented on a simplified low complexity encoder. We illustrate the effectiveness of the proposed method using H.264 to compress previously compressed UGC. Our results show that the quality saturation region detected by our method is consistent with the saturation region found using no reference video quality metrics. We also show that our saturation detection method is robust to the choice of denoiser. However, our saturation detection fails when the input UGC quality is very low, and thus there is no hope that a good denoiser exists. When the UGC quality is high, and thus no saturation is expected, the proposed method fails when the denoising algorithm does not set its parameters correctly and over smooths the input UGC. The proposed framework can be complement and enhanced by exploiting existing approaches for quality detection, content type classification and no reference visual quality metrics.
References
- [1] Yilin Wang, Sasi Inguva, and Balu Adsumilli, “YouTube UGC dataset for video compression research,” in 2019 IEEE 21st International Workshop on Multimedia Signal Processing (MMSP). IEEE, 2019, pp. 1–5.
- [2] Antonio Ortega and Kannan Ramchandran, “Rate-distortion methods for image and video compression,” IEEE Signal processing magazine, vol. 15, no. 6, pp. 23–50, 1998.
- [3] Gary J Sullivan and Thomas Wiegand, “Rate-distortion optimization for video compression,” IEEE signal processing magazine, vol. 15, no. 6, pp. 74–90, 1998.
- [4] Anish Mittal, Rajiv Soundararajan, and Alan C Bovik, “Making a “completely blind” image quality analyzer,” IEEE Signal processing letters, vol. 20, no. 3, pp. 209–212, 2012.
- [5] Anish Mittal, Anush Krishna Moorthy, and Alan Conrad Bovik, “No-reference image quality assessment in the spatial domain,” IEEE Transactions on image processing, vol. 21, no. 12, pp. 4695–4708, 2012.
- [6] Eduardo Pavez, Enrique Perez, Xin Xiong, Antonio Ortega, and Balu Adsumilli, “Compression of user generated content using denoised references,” in 2022 IEEE International Conference on Image Processing (ICIP), 2022, pp. 4188–4192.
- [7] Yilin Wang, Junjie Ke, Hossein Talebi, Joong Gon Yim, Neil Birkbeck, Balu Adsumilli, Peyman Milanfar, and Feng Yang, “Rich features for perceptual quality assessment of UGC videos,” in Proceedings of the IEEE/CVF Conference on Computer Vision and Pattern Recognition, 2021, pp. 13435–13444.
- [8] Sam John, Akshay Gadde, and Balu Adsumilli, “Rate distortion optimization over large scale video corpus with machine learning,” in 2020 IEEE International Conference on Image Processing (ICIP). IEEE, 2020, pp. 1286–1290.
- [9] Suiyi Ling, Yoann Baveye, Patrick Le Callet, Jim Skinner, and Ioannis Katsavounidis, “Towards perceptually-optimized compression of user generated content (UGC): Prediction of UGC rate-distortion category,” in 2020 IEEE International Conference on Multimedia and Expo (ICME). IEEE, 2020, pp. 1–6.
- [10] Zhengzhong Tu, Chia-Ju Chen, Yilin Wang, Neil Birkbeck, Balu Adsumilli, and Alan C Bovik, “Efficient user-generated video quality prediction,” in 2021 Picture Coding Symposium (PCS). IEEE, 2021, pp. 1–5.
- [11] Xiangxu Yu, Neil Birkbeck, Yilin Wang, Christos G Bampis, Balu Adsumilli, and Alan C Bovik, “Predicting the quality of compressed videos with pre-existing distortions,” IEEE Transactions on Image Processing, vol. 30, pp. 7511–7526, 2021.
- [12] Yilin Wang, Hossein Talebi, Feng Yang, Joong Gon Yim, Neil Birkbeck, Balu Adsumilli, and Peyman Milanfar, “Video transcoding optimization based on input perceptual quality,” in Applications of Digital Image Processing XLIII. SPIE, 2020, vol. 11510, pp. 201–211.
- [13] R. Dobrushin and B. Tsybakov, “Information transmission with additional noise,” IRE Transactions on Information Theory, vol. 8, no. 5, pp. 293–304, 1962.
- [14] T. Berger, Rate Distortion Theory: A Mathematical Basis for Data Compression, Prentice-Hall electrical engineering series. Prentice-Hall, 1971.
- [15] Hanhe Lin, Vlad Hosu, and Dietmar Saupe, “KADID-10k: A large-scale artificially distorted iqa database,” in 2019 Tenth International Conference on Quality of Multimedia Experience (QoMEX). IEEE, 2019, pp. 1–3.
- [16] Iain E Richardson, The H. 264 advanced video compression standard, John Wiley & Sons, 2011.
- [17] Hanhe Lin, Vlad Hosu, and Dietmar Saupe, “DeepFL-IQA: Weak supervision for deep IQA feature learning,” arXiv preprint arXiv:2001.08113, 2020.
- [18] Jiaxi Jiang, Kai Zhang, and Radu Timofte, “Towards flexible blind JPEG artifacts removal,” in Proceedings of the IEEE/CVF International Conference on Computer Vision, 2021, pp. 4997–5006.
- [19] Kai Zhang, Yawei Li, Jingyun Liang, Jiezhang Cao, Yulun Zhang, Hao Tang, Radu Timofte, and Luc Van Gool, “Practical blind denoising via Swin-Conv-UNet and data synthesis,” arXiv preprint, 2022.
- [20] Alex Clark, “Pillow (pil fork) documentation,” Readthedocs. Https://Buildmedia. Readthedocs. Org/Media/Pdf/Pillow/Latest/Pillow. Pdf, 2015.
- [21] Angeliki V Katsenou, Fan Zhang, Mariana Afonso, and David R Bull, “A subjective comparison of AV1 and HEVC for adaptive video streaming,” in 2019 IEEE International Conference on Image Processing (ICIP). IEEE, 2019, pp. 4145–4149.
- [22] Fan Zhang, Angeliki V Katsenou, Mariana Afonso, Goce Dimitrov, and David R Bull, “Comparing VVC, HEVC and AV1 using objective and subjective assessments,” arXiv preprint arXiv:2003.10282, 2020.
- [23] Zhengzhong Tu, Yilin Wang, Neil Birkbeck, Balu Adsumilli, and Alan C Bovik, “UGC-VQA: Benchmarking blind video quality assessment for user generated content,” IEEE Transactions on Image Processing, 2021.