Cosmological measurements from void-galaxy and galaxy-galaxy clustering in the Sloan Digital Sky Survey
Abstract
We present the cosmological implications of measurements of void-galaxy and galaxy-galaxy clustering from the Sloan Digital Sky Survey (SDSS) Main Galaxy Sample (MGS), Baryon Oscillation Spectroscopic Survey (BOSS), and extended BOSS (eBOSS) luminous red galaxy catalogues from SDSS Data Release 7, 12, and 16, covering the redshift range . We fit a standard CDM cosmological model as well as various extensions including a constant dark energy equation of state not equal to , a time-varying dark energy equation of state, and these same models allowing for spatial curvature. Results on key parameters of these models are reported for void-galaxy and galaxy-galaxy clustering alone, both of these combined, and all these combined with measurements from the cosmic microwave background (CMB) and supernovae (SN). For the combination of void-galaxy and galaxy-galaxy clustering, we find tight constraints of for a base CDM cosmology, additionally allowing the dark energy equation of state to vary, and further extending to non-flat models. The combined SDSS results from void-galaxy and galaxy-galaxy clustering in combination with CMB+SN provide a 30% improvement in parameter over CMB+SN for CDM, a 5% improvement in parameter when is allowed to vary, and a 32% and 68% improvement in parameters and when allowing for spatial curvature.
keywords:
cosmology: observations - cosmology: dark energy - cosmology: large-scale structure of Universe - cosmology: cosmological parameters1 Introduction
The large-scale structure of the Universe contains a wealth of information about the expansion history of the Universe as well as the growth of structure within it. Measurements of these from spectroscopic galaxy surveys within the low-redshift Universe, in combination with Cosmic Microwave Background observations from Planck Collaboration et al. (2020), provide the best evidence currently available for the standard Cold Dark Matter (CDM) cosmological model. Modern spectroscopic galaxy surveys are focused on observing the baryon acoustic oscillation (BAO) feature, a relic of primordial sound waves, which can be used as a standard ruler (e.g. Alam et al., 2015, 2021). In addition to the BAO feature, cosmological information can be extracted using various other techniques including redshift-space distortions (RSD, Kaiser, 1987) and the galaxy distribution around voids (Lavaux & Wandelt, 2012). This work combines these three cosmological measurements from the same surveys to provide powerful constraints on the CDM cosmological model and various extensions to it.
Although the Universe is expected to be statistically homogeneous and isotropic on large scales, observations typically use different methods along and across the line of sight (LOS). For example, galaxy surveys measure the angular positions of galaxies across the LOS and redshifts along it. Consequently, the information provided by the observations differs with the angle to the LOS: In particular, separations along the LOS are sensitive to while across the LOS separations are sensitive to the comoving angular diameter distance ,
| (1) |
where
| (2) |
is the line-of-sight comoving distance, is the Hubble expansion rate at redshift , and is the transverse comoving distance to redshift . To recover an isotropic map, we require to be correct when the redshift to distance conversion is done (this is known as the Alcock-Paczynski (AP) test, Alcock & Paczynski 1979).
Measurements of the BAO feature bring in an extra dependence on , the comoving sound horizon at the baryon drag epoch, upon which the comoving BAO position depends. BAO observations with respect to the LOS allow us to perform geometrical measurements of both (the LOS cosmological dependence of the BAO position) and (the perpendicular cosmological dependence of the BAO position). Anisotropic BAO measurements thus intrinsically also include the Alcock-Paczynski test.
Further complicating this picture are RSD, which cause additional anisotropic distortions. RSD are an artificial result of the peculiar velocities of galaxies caused by the growth of large-scale structure on the observed redshifts of galaxies (Kaiser, 1987). When we incorrectly assume that the total redshift resulted from Hubble expansion, we imprint coherent anisotropies in the galaxy map. The amplitude of the large-scale RSD signal depends on , where is the logarithmic growth rate of density perturbations and is the amplitude of density fluctuations normalized using the standard deviation of density fluctuations in a sphere of Mpc. Because the AP and RSD effects both give rise to anisotropic distortions, there is typically a degeneracy between measurements of both, such that combined observations of both BAO and RSD provide covariant measurements of , and (hereafter we do not explicitly include the redshift dependence on , , or ).
For a featureless power spectrum (i.e. a power law), there would exist a perfect degeneracy between and . This degeneracy is broken by features in the power spectrum such as the BAO feature on large scales. However, the sample variance is significantly reduced if we can work on small scales. Unfortunately for the galaxy-galaxy auto-power, there are few features on small scales, and the degeneracy can only be mildly broken (Ballinger et al., 1996). On the other hand, the small-scale void-galaxy cross-correlation has a number of features, and this degeneracy can be better broken, enhancing measurements.
The key to understanding how information can be extracted from void-galaxy cross-correlations is to consider a stack of voids. While voids do not have a known size and so cannot be easily used as a standard ruler like BAO, each void will have no preferred orientation in an isotropic Universe. Taking many voids and stacking the positions of galaxies in and around these voids should produce an apparent distribution that has spherical symmetry if the AP parameter is correct when the galaxy redshifts are converted to distances and no anisotropic selection bias is present in the creation of the void sample. Although voids have the potential to provide accurate measurements, there is an increased reliance on modelling non-linear astrophysical processes compared with BAO measurements potentially leading to increased systematic errors (e.g. Paz et al., 2013; Hamaus et al., 2016; Hawken et al., 2017; Nadathur et al., 2019; Achitouv, 2019; Hawken et al., 2020; Aubert et al., 2022; Woodfinden et al., 2022).
The RSD contribution to anisotropy in voids can be modelled using linear theory with reasonable success and without needing to exclude small scales (Hamaus et al., 2014; Cai et al., 2016; Nadathur & Percival, 2019; Paillas et al., 2021). This provides our constraints on , however, with the caveat that the potential for systematic bias is higher due to the sparsity of tracers around void centres leading to a mismatch in the velocity profile of dark matter and tracers (Massara et al., 2022). The anisotropies in the void-galaxy cross-correlation function from RSD can be easily distinguished from those arising from the AP effect, and so measurements of the cross-correlation can be used to measure the AP parameter (Hamaus et al., 2015; Nadathur et al., 2019). Work in Hamaus et al. (2016); Nadathur et al. (2019); Nadathur et al. (2020b) and Woodfinden et al. (2022) applied this method to the BOSS and eBOSS surveys and resulted in a factor of between to more precise constraints than those from galaxy clustering and BAO in the same data.
The best current constraints on cosmological models from galaxy spectroscopic surveys make use of the Sloan Digital Sky Survey (SDSS). Spectroscopic galaxy surveys were undertaken as part of the SDSS I, II, III and IV experiments (York et al., 2000; Eisenstein et al., 2011; Blanton et al., 2017). For SDSS-III and SDSS-IV the galaxy surveys were called BOSS and eBOSS (these are described in greater detail in Section 2). In this work, we use all available SDSS data for luminous red galaxies (LRG). We take measurements of the distribution of galaxies around voids using the void-galaxy correlation function (hereon referred to as voids) (Woodfinden et al., 2022; Nadathur et al., 2020b) as well as information from BAO and RSD from the same galaxy sample (hereon referred to as galaxies). We aim to combine this information to provide the most accurate cosmological constraints available from SDSS.
Our paper is structured as follows: in Section 2 we summarize the data and mock catalogues used to determine the measurements used in this work as well as determine their cross-covariance. In Section 3 we review the theoretical background allowing consensus results between the void-galaxy and galaxy-galaxy clustering techniques using the same data set. In Section 4 we present the results of our analysis for a wide range of varying cosmologies and discuss the implications of this. Finally, we conclude in Section 5.
2 Data and Mocks
We use previous analyses of the void-galaxy correlation function published in Nadathur et al. (2020b) and Woodfinden et al. (2022) in combination with BAO and RSD results from galaxy clustering made from the SDSS-II (Howlett et al., 2015b), SDSS-III (Alam et al., 2015), and SDSS-IV (Bautista et al., 2021; Gil-Marín et al., 2020). These measurements are shown in Table 1. Information from the void-galaxy clustering is labelled as voids while information from galaxy-galaxy clustering is labelled as galaxies.
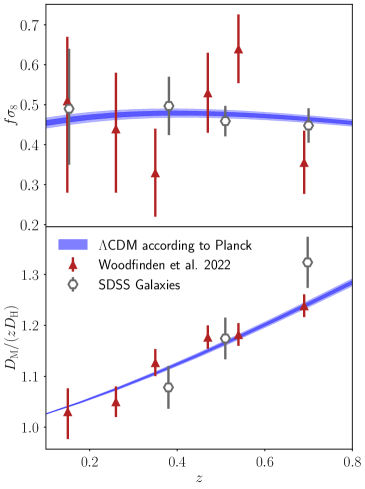
Figure 1 shows the measurements from both voids and galaxies on and on SDSS LRG. The best-fit model for CDM measured by Planck Collaboration et al. (2020) is shown for comparison.
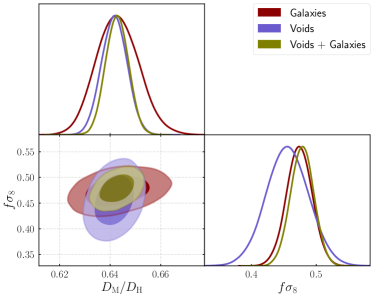
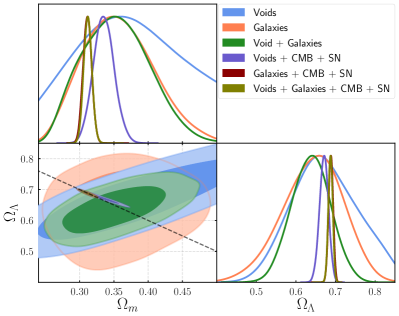
Joint fits to both RSD and AP for voids and galaxies combined lead to increased precision in measurements of both the AP effect and compared to that from voids or galaxies alone. This can be seen in Figure 2. The combination of these two measurements, described in more detail in Section 3, therefore results in a large gain of information than using either of these techniques individually due to the perpendicularity of the likelihood contours. To obtain this combination we have taken information available across a wide range in redshift (see Table 1) and compressed this, under the assumption of a flat CDM cosmology, into a single redshift at (the mean redshift of voids in this work).
| Method | Redshift Range | ||||
|---|---|---|---|---|---|
| Voids | 0.15 | ———– | |||
| Voids | 0.26 | ———– | |||
| Voids | 0.35 | ———– | |||
| Voids | 0.47 | ———– | |||
| Voids | 0.54 | ———– | |||
| Voids | 0.69 | ———– | |||
| Galaxies | 0.15 | ———– | |||
| Galaxies | 0.38 | ||||
| Galaxies | 0.51 | ||||
| Galaxies | 0.70 |
2.1 MGS
The Main Galaxy Sample (MGS; Howlett et al. 2015b; Ross et al. 2015) large-scale structure catalogue contains 63,163 galaxies from SDSS Data Release 7 (DR7 Abazajian et al. 2009) in the redshift range . Previous work from Woodfinden et al. (2022) analyzed voids using the watershed-based void-finder ZOBOV (Neyrinck, 2008). total voids at an effective redshift of were found with a median size of . Void catalogues were cut at the median size resulting in 258 voids being used in the analysis. As summarized in Table 1, this work measured and . Howlett et al. (2015b) analysed galaxies in this sample including measurements of RSD from the two-point correlation function as well as Alcock-Paczynsi measurements from BAO. This paper did not split Alcock-Paczynski measurements into and as was done for BOSS and eBOSS analysis. Instead, measurements are available for the volume-averaged distance finding and .
Along with the MGS data, we make use of mock catalogues (Howlett et al., 2015b) produced to match the footprint, redshift distribution, and clustering of the MGS data to create our cross-covariance matrix described in Section 3. 1000 mock catalogues were created out of 500 independent dark matter simulations at using the PICOLA algorithm (Howlett et al., 2015a). Fiducial cosmological parameters , , , , and were used. Mock galaxies were assigned to halos using halo abundance matching and parameters were chosen to match the galaxy clustering of the MGS data. The survey mask and selection function were also matched to MGS galaxies. Previous work in Woodfinden et al. (2022) analyzed 1000 of these to test for systematic errors.
2.2 BOSS
The Baryon Oscillation Spectroscopic Survey (BOSS Dawson et al. 2013) of SDSS-III (Eisenstein et al., 2011) surveyed over 1.5 million different objects. Large-scale structure catalogues were released in Data Release 12 (DR12 Alam et al. 2015) and surveyed a redshift extent of . Data was released in two catalogues (LOWZ and CMASS) with varying (overlapping) sky footprints; the results used in this work combine these two samples before splitting into redshift shells. Woodfinden et al. (2022) analyzed voids in the redshift range . This work ran a watershed-based void-finder ZOBOV on BOSS data before splitting the voids into 4 redshift shells , , , and . A total of 8961 voids were found with a median void size of approximately . A void size cut of the median void size was imposed resulting in 4480 voids used in the analysis. Measurements on and are summarized in Table 1. Alam et al. (2017) analysed BOSS galaxies measuring and from the BAO method and from RSD. Measurements are analysed in 3 partially overlapping redshift shells, , , and . The highest redshift shell overlaps entirely with a combination of the and shells in the redshift range (discussed in Section 2.3) and so is not included in this work. Measurements are summarized in Table 1. and information has been converted into and using the published correlation coefficients between them.
Along with the BOSS data, we make use of the Patchy mocks to create our cross-covariance matrix described in Section 3. The Patchy mocks are a set of 1000 independent mock catalogues created on the lightcone using the fast approximate Patchy algorithm (Kitaura et al., 2014). The Patchy mocks were created to match the clustering and survey properties of BOSS galaxies (Kitaura et al., 2016) with fiducial cosmological parameters , , , , and . Mock galaxies were assigned to halos using halo abundance matching and parameters were chosen to match the galaxy cluster properties measured through the monopole and quadrupole moments. The survey mask and selection function were also matched to BOSS galaxies. Previous work in Woodfinden et al. (2022) analyzed 250 of these to test for systematic errors. We use this same 250 mock sub-sample to construct our cross-covariance matrix.
2.3 eBOSS
The extended Baryon Oscillation Spectroscopic Survey (eBOSS Dawson et al. 2016) of SDSS-IV (Blanton et al., 2017) surveyed over 375,000 different objects over two hemispheres. Large-scale structure catalogues were released in Data Release 16 (DR16, Ahumada et al. 2020) and surveyed a redshift extent of . Analysis of this sample used in this work combined measurements from eBOSS with galaxies from BOSS DR12 that overlap this redshift range. Nadathur et al. (2020b) analysed voids in this sample using watershed-based void-finder ZOBOV finding a total of 4706 voids with a median void size of . A median size cut was applied resulting in 2341 voids used in the analysis. This work measured and . Galaxies in this sample were analysed by Bautista et al. (2021) and Gil-Marín et al. (2020) using BAO and RSD features from the galaxy two-point correlation function and power spectrum to infer geometrical and dynamical cosmological constraints of , , and .
Along with eBOSS data, we make use of the EZmocks to create our cross-covariance matrix described in Section 3. The EZmocks are a set of 1000 independent mock catalogues created on the lightcone using the EZmock algorithm (Chuang et al., 2015). The EZmocks were created to match the galaxy clustering and survey properties of eBOSS galaxies with fiducial parameters , , , , and . The EZmock algorithm is a fast-approximate Zeldovich method (similar to the Patchy algorithm) along with deterministic and stochastic biased relations, a probability density function mapping scheme and addition correction to account for RSD (Zhao et al., 2021).
3 Combination of Results and Likelihoods
We combine void-galaxy and galaxy-galaxy clustering measurements to take advantage of the significant gain of information from the complementary directions of parameter contours. As both methods are applied to the same data, the large-scale structure could conceivably affect both measurements. We account for any covariance between the two using the method from Alam et al. (2017) and Sánchez et al. (2017a) and previously applied to the void-galaxy correlation function in combination with galaxy clustering in Nadathur & Percival (2019) and Nadathur et al. (2020b). A cross-covariance matrix, is constructed for all observables using measurements made on mock catalogues described in Section 2. The covariance between measurements made on different mock catalogues (ex. between MGS mocks in the redshift range and eBOSS mocks in the redshift range ) will only be non-zero due to random noise and are set equal to 0. This is typical of combined analyses and the correlations for non-overlapping galaxy samples (this is not the case for the BOSS galaxy samples in this work) are close to zero (Sánchez et al., 2017b). Figure 3 shows that the cross-correlation between different void redshift slices is small. It is not possible to measure the cross-correlation directly between SDSS samples as this would require mock catalogues with a combination of volume and resolution which is not currently possible for our samples.
We combine all observables into one data vector , and at each point in theory space being sampled we calculate the value as
| (3) |
where is a vector containing the value of all observables at a particular point in the theory space being sampled.
The data vectors used have already included a prior designed to match the Bayesian results to frequentist expectations to first order allowing for errors in the covariance matrix used when fitting to the correlation functions. From these fits, we only use the covariant parameter measurements: hence only needing a smaller number of mocks, which are only used to estimate the covariance between measurements in the same redshift bins. As such we can assume these measurements as a gaussian fit and so use an appropriate likelihood function (Woodfinden et al., 2022; Percival et al., 2021). To explore the model parameter space we use MCMC sampling implemented using the Cobaya sampling package (Torrado & Lewis, 2019, 2021) and use a mixture of CAMB111https://camb.info/ and CLASS222https://lesgourg.github.io/class_public/class.html as the underlying cosmological codes (Lewis et al., 2000; Lesgourgues, 2011).
Figure 3 shows the cross-correlation matrix corresponding to the cross-covariance matrix. Only a weak correlation can be seen between measurements of and as measured by voids. While results are reported for galaxy clustering in the parameters , , and we perform a change of basis to , , and using the published correlation coefficients between them.

Results from BAO+RSD for galaxies show a strong correlation in measured parameters. We see that for all redshift bins considered in this work, there is a strong positive correlation between and , and little correlation elsewhere. We also see similar trends when looking at the correlations between redshift bins and . This significant correlation between these bins is expected as these come from the same mock catalogues which are later split into redshift shells as well as overlap in the range.
No significant correlation can be seen between results from voids and galaxies when looking at data measured from the same mock catalogues. A combination of measurements from voids and galaxies will therefore result in a significant gain in information compared to each measurement individually.
The results from combining information from void-galaxy and galaxy-galaxy correlations on measured parameters , , , and are shown in Table 2. These are found assuming a CDM cosmological model. The effective redshift of voids in the sample is calculated as the weighted sum
| (4) |
where is the redshift of the void centre, is the galaxy redshift, is the associated galaxy systematic weight, and the sum extends over all void-galaxy pairs up to the maximum separation considered, Mpc.
Parameter contours plotted in Figure 2 demonstrate the significant gain of information from the combination of these results; this gain of information is due to the orthogonality of degeneracy directions between void-galaxy and galaxy-galaxy correlations as well as the weak correlation between these two methods.
| Tracer | Redshift range | |||||
|---|---|---|---|---|---|---|
| Voids + Galaxies | ||||||
| Voids + Galaxies | ||||||
| Voids + Galaxies |
4 Results
We split the discussion of our results by the cosmological model assumed when running MCMC fits to the data. Relevant cosmological parameters are shown in each section.
4.1 CDM
For a base CDM model the AP information constrains , as shown in Table 3. If we do not know , then the BAO measurements reduce to only the relative constraints from the AP effect, while without an independent constraint on , the RSD measurement also becomes a relative measure, and only depends on the matter density.
Of note in Table 3, the uncertainty on from voids+galaxies is 43% lower than that from galaxies alone due to the increase in precision in measurements of . The measured value of from the full SDSS results is consistent with results from Planck Collaboration et al. (2020) within , however, this is in increased tension as that from galaxies alone agrees with Planck within , due to a larger uncertainty.
The combination of Planck and SN measures and . The additional information from SDSS (voids+galaxies) results in a reduction in the measured error on and a reduction in the measured error on .
| Measurement Techniques | ||||||
| Voids | ———– | ———– | ———– | ———– | ———– | |
| Galaxies | ———– | ———– | ———– | ———– | ———– | |
| Voids + Galaxies | ———– | ———– | ———– | ———– | ———– | |
| Voids + CMB + SN | ———– | ———– | ———– | ———– | ||
| Galaxies + CMB + SN | ———– | ———– | ———– | ———– | ||
| Voids + Galaxies + CMB + SN | ———– | ———– | ———– | ———– | ||
| [dashed] | ||||||
| Voids | ———– | ———– | ———– | ———– | ||
| Galaxies | ———– | ———– | ———– | ———– | ||
| Voids + Galaxies | ———– | ———– | ———– | ———– | ||
| Voids + CMB + SN | ———– | ———– | ———– | |||
| Galaxies + CMB + SN | ———– | ———– | ———– | |||
| Voids + Galaxies + CMB + SN | ———– | ———– | ———– | |||
| [dashed] | ||||||
| Voids + CMB + SN | ———– | ———– | ||||
| Galaxies + CMB + SN | ———– | ———– | ||||
| Voids + Galaxies + CMB + SN | ———– | ———– | ||||
| [dashed] | ||||||
| Voids | ———- | ———- | ———- | ———– | ———– | ———– |
| Galaxies | ———– | ———– | ———– | |||
| Voids + Galaxies | ———– | ———– | ———– | |||
| Voids + CMB + SN | ———– | ———– | ||||
| Galaxies + CMB + SN | ———– | ———– | ||||
| Voids + Galaxies + CMB + SN | ———– | ———– | ||||
| [dashed] | ||||||
| Voids | ———– | ———– | ||||
| Galaxies | ———– | ———– | ||||
| Voids + Galaxies | ———– | ———– | ||||
| Voids + CMB + SN | ———– | |||||
| Galaxies + CMB + SN | ———– | |||||
| Voids + Galaxies + CMB + SN | ———– | |||||
| [dashed] | ||||||
| Voids + CMB + SN | ||||||
| Galaxies + CMB + SN | ||||||
| Voids + Galaxies + CMB + SN |
4.2 wCDM
In this section, we consider a CDM model, where we expand the CDM model to consider a dark energy component with equation of state , where is the dark energy pressure and is the dark energy density. In the standard CDM model, , describing dark energy as a cosmological constant. A value of is required for an accelerating expansion of the Universe while a value of means that dark energy density increases as the Universe expands.
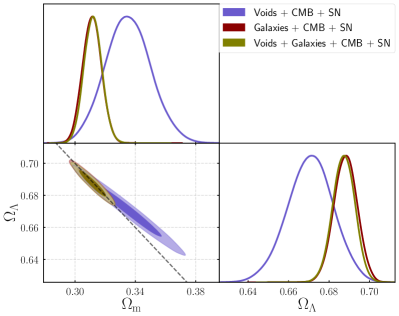
An uninformative, flat prior of is imposed. Figure 4 shows results for this cosmology and Table 3 lists the mean values and marginalized 68% credible intervals obtained for various combinations of measurement techniques. Results show reasonable agreement with standard CDM cosmology where .
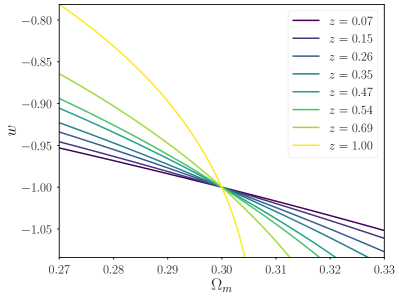
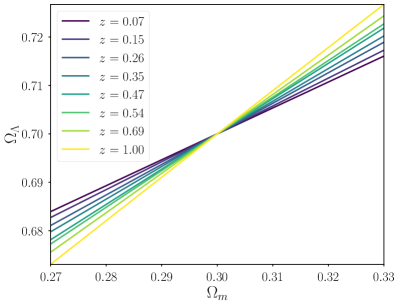
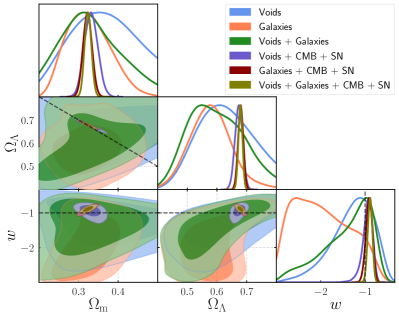
For a given cosmology and redshift, the constraints on have a strong degeneracy following the locus of models that predict the same theoretical value of . The direction of this locus changes with redshift as shown in Figure 5 for models where and are varied, as well as models where and are varied. The change in locus depends on Equation 1. The change in locus means that we significantly improve our constraints by having measurements at multiple redshifts compared with a measurement with an equivalent total error at a single redshift. Thus having void measurements at a series of redshifts is an important resource and significantly improves the cosmological constraints presented here. Measurements from upcoming surveys at high redshift will provide additional constraints on CDM and CDM beyond constraints due to the increased volume that these surveys measure.
The combination of Planck and SN only measures , and . The additional information from SDSS (voids+galaxies) results in a reduction in the measured error on , a increase in the measured error on and a reduction in the measured error on .
4.3 w(z)CDM
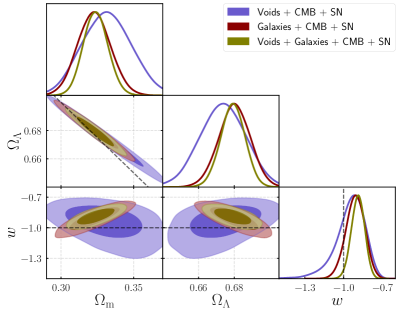
In this section, we consider adding more flexibility to the equations of state of dark energy. If dark energy is a generic dynamical fluid then the equation of state parameter should be allowed to vary over time. We adopt an equation of state parameter for dark energy with the functional form . Here and are fitting parameters and is the scale factor. In a CDM model and .
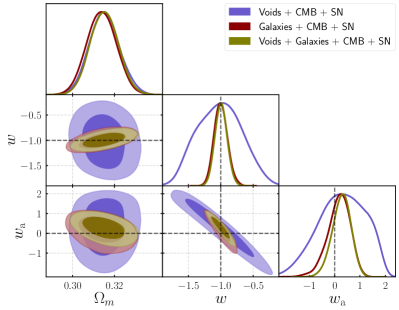
Uninformative, flat priors of and are imposed. Figure 6 shows results for this cosmology and Table 3 lists the mean values and marginalized 68% credible intervals obtained for various combinations of measurement techniques. Only the combination of SDSS data with CMB and SN results from Planck Collaboration et al. (2020) and Scolnic et al. (2018) are shown, as SDSS alone does not have enough constraining power within a reasonable prior volume. All results show agreement with and , demonstrating consistency with a CDM model. For the combination of voids with CMB and SN data, the constraints on can be seen to be hitting the upper bound of the prior; as such only lower limits are given in Table 3.
4.4 oCDM
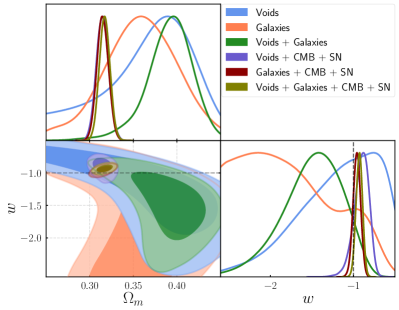
In this section, we apply an CDM model, where is left as a free parameter. In CDM spatial curvature is considered to be flat (i.e. ). A value of indicates a closed Universe while indicated an open Universe.
An uninformative, flat prior of is imposed. Figure 7 shows constraints for this cosmology and Table 3 lists the mean values and marginalized 68% credible intervals obtained for various combinations of measurement techniques. All models show a reasonable agreement with a CDM prediction for a flat Universe.
Void constraints at a single redshift are unable to close contours in the plane (Woodfinden et al., 2022; Nadathur et al., 2020a). This is because measurement of at a single redshift leads to a perfect degeneracy between these two parameters. Over a wide range in redshift, the variation in loci of models in the plane that result in the same measurement of breaks this degeneracy (see Figure 5). In this work there is still a strong degeneracy between these parameters that is not broken enough to close the contours in the plane; however, a narrowing can be observed.
The combination of Planck and SN only measures , and . The additional information from SDSS (voids+galaxies) results in a reduction in the measured error on , a reduction in the measured error on and a reduction in the measured error on .
4.5 owCDM
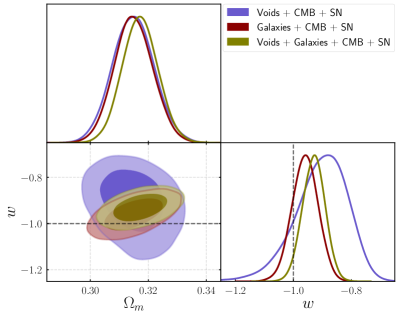
We next consider an CDM model, where is allowed to vary so that we are not imposing a flat curvature and allow the constant equation of state parameter for dark energy to vary. In a CDM model and .
Uninformative, flat priors of and are imposed. Figure 8 shows results for this cosmology and Table 2 lists the mean values and marginalized 68% credible intervals for a variety of combinations of different measurement techniques. We find reasonable agreement with flat spatial curvature with all values of consistent with and consistent with within .
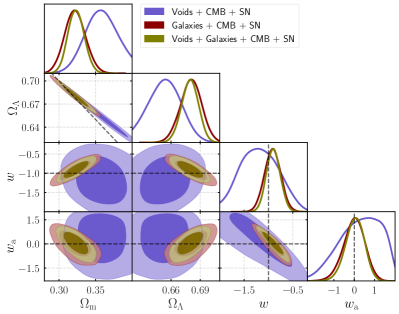
4.6 ow(z)CDM
We now consider to a CDM model. We do not impose spatial flatness, allowing to be a free parameter. We also allow for a time-varying equation of state parameter as in Section 4.3. In a CDM model , , and .
Uninformative, flat priors of , , and are imposed. Figure 9 shows results for this cosmology and Table 2 lists the mean values and marginalized 68% credible intervals. Only the combination of SDSS data with CMB and SN results from Planck Collaboration et al. (2020) and Scolnic et al. (2018) are shown, as SDSS alone does not have enough constraining power within a reasonable prior volume. Once again we see reasonable agreement with flat spatial curvature, , and across all measurement techniques. For the combination of voids with CMB and SN data, the constraints on can be seen to be hitting the upper bound of the prior; as such only lower limits are given in Table 3.
5 Conclusions
We have presented the cosmological implications of void-galaxy and galaxy-galaxy clustering over a wide redshift range in the SDSS DR7 (MGS), SDSS DR12 (BOSS), and SDSS DR16 (eBOSS) galaxy surveys. Void-galaxy and galaxy-galaxy clustering results are combined, taking into account cross-correlations between different measurement techniques and redshift bins. We see a significant gain of information from the combination of these measurement techniques, as well as from the inclusion of data from a wide range in redshift. The constraints on have a strong degeneracy following a locus of models that predict the same value (see Figure 5). The direction of this locus changes with redshift meaning that void measurements over a wide redshift range improve the cosmological constraints presented in this work beyond increased precision solely due to an increased volume measured.
We perform a Bayesian analysis, comparing these measurements to various cosmological models including base CDM, a constant dark energy equation of state allowed to vary from (CDM), a time-varying dark energy equation of state (CDM), allowing for spatial curvature (), allowing for spatial curvature with a constant dark energy equation of state allowed to vary from (CDM), allowing for spatial curvature with a time-varying dark energy equation of state (CDM). Final constraints on these cosmologies are shown in Table 3. Results from SDSS have also been combined with CMB results from Planck Collaboration et al. (2020) and Pantheon SN Ia sample from Scolnic et al. (2018) to provide extremely tight constraints on these cosmological models. With currently available data, parameter estimations and associated errors are heavily influenced by the already stringent CMB constraints. The inclusion of void information does improve the CMB constraints and is of increasing importance for models with more freedom in the low-redshift behaviour. This is true for many low-redshift cosmological constraints. However, a clear improvement can be seen in many parameter constraints from the inclusion of void data in addition to bringing in BAO & RSD and SN measurements. In the near future, upcoming data from next-generation surveys will offer comparable uncertainty to Planck CMB results using void-galaxy and galaxy-galaxy clustering alone (e.g. DESI Collaboration et al., 2016; Radinović et al., 2023).
The combination of void-galaxy and galaxy-galaxy clustering results in SDSS provides a large gain of information compared to that from galaxy-galaxy clustering alone. Results for CDM provide a % reduction in the size of the error on compared to galaxy clustering alone. Results for CDM provide a % and % reduction in the size of the error on and . Results for CDM provide a % and %, and % reduction in the size of the error on , , and when used in combination with CMB measurements from Planck and SN measurements from Pantheon. Results for CDM provide a % and % reduction in the size of the error on and compared to galaxy clustering alone. Results for CDM provide a %, and % reduction in the size of the error on , and when used in combination with CMB measurements from Planck and SN from Pantheon. Finally, results for CDM provide a %, %, %, and % reduction in the size of the error on , , , and when used in combination with CMB + SN measurements.
Void-galaxy and galaxy-galaxy clustering results are also combined with CMB + SN results as shown in Table 3. The addition of void-galaxy and galaxy-galaxy data can further increase the precision of cosmological parameters shown in various models. All results shown are in excellent agreement with a base CDM cosmological model.
Our work shows the importance of including voids as a cosmological probe and motivates the inclusion of voids as standard in the analysis of galaxy surveys due to the large information gain provided, especially when used in combination with measurements from other techniques. This is particularly important for low-redshift geometrical tests of cosmic expansion and discriminating between alternative cosmological models. Results expected shortly from DESI and Euclid will probe larger volumes over a wider redshift range. Void-galaxy and galaxy-galaxy clustering results in these surveys will provide powerful tests of the behaviour of cosmological models at low redshift.
Acknowledgments
AW and WP acknowledge the support of the Natural Sciences and Engineering Research Council of Canada (NSERC) [funding reference number 547744 and RGPIN-2019-03908 respectively]. SN acknowledges support from an STFC Ernest Rutherford Fellowship, grant reference ST/T005009/2.
Research at Perimeter Institute is supported in part by the Government of Canada through the Department of Innovation, Science and Economic Development Canada and by the Province of Ontario through the Ministry of Colleges and Universities. This research was enabled in part by support provided by Compute Ontario (computeontario.ca) and Compute Canada (computecanada.ca).
Funding for the Sloan Digital Sky Survey IV has been provided by the Alfred P. Sloan Foundation, the U.S. Department of Energy Office of Science, and the Participating Institutions.
SDSS-IV acknowledges support and resources from the Center for High Performance Computing at the University of Utah. The SDSS website is www.sdss.org.
SDSS-IV is managed by the Astrophysical Research Consortium for the Participating Institutions of the SDSS Collaboration including the Brazilian Participation Group, the Carnegie Institution for Science, Carnegie Mellon University, Center for Astrophysics | Harvard & Smithsonian, the Chilean Participation Group, the French Participation Group, Instituto de Astrofísica de Canarias, The Johns Hopkins University, Kavli Institute for the Physics and Mathematics of the Universe (IPMU) / University of Tokyo, the Korean Participation Group, Lawrence Berkeley National Laboratory, Leibniz Institut für Astrophysik Potsdam (AIP), Max-Planck-Institut für Astronomie (MPIA Heidelberg), Max-Planck-Institut für Astrophysik (MPA Garching), Max-Planck-Institut für Extraterrestrische Physik (MPE), National Astronomical Observatories of China, New Mexico State University, New York University, University of Notre Dame, Observatário Nacional / MCTI, The Ohio State University, Pennsylvania State University, Shanghai Astronomical Observatory, United Kingdom Participation Group, Universidad Nacional Autónoma de México, University of Arizona, University of Colorado Boulder, University of Oxford, University of Portsmouth, University of Utah, University of Virginia, University of Washington, University of Wisconsin, Vanderbilt University, and Yale University.
For the purpose of open access, the authors have applied a CC BY public copyright licence to any Author Accepted Manuscript version arising.
Data Availability
Data supporting this research including the cross-covariance matrices and resulting likelihood for cosmological parameters will be made public after acceptance at https://github.com/alexwoodfinden/SDSS-Void-Cosmology. Data can also be obtained in advance of acceptance by reasonable request to the corresponding author.
References
- Abazajian et al. (2009) Abazajian K. N., et al., 2009, ApJS, 182, 543
- Achitouv (2019) Achitouv I., 2019, Phys. Rev. D, 100, 123513
- Ahumada et al. (2020) Ahumada R., et al., 2020, ApJS, 249, 3
- Alam et al. (2015) Alam S., et al., 2015, ApJS, 219, 12
- Alam et al. (2017) Alam S., et al., 2017, MNRAS, 470, 2617
- Alam et al. (2021) Alam S., et al., 2021, Phys. Rev. D, 103, 083533
- Alcock & Paczynski (1979) Alcock C., Paczynski B., 1979, Nature, 281, 358
- Aubert et al. (2022) Aubert M., et al., 2022, MNRAS, 513, 186
- Ballinger et al. (1996) Ballinger W., Peacock J., Heavens A., 1996, MNRAS, 282, 877
- Bautista et al. (2021) Bautista J. E., et al., 2021, MNRAS, 500, 736
- Blanton et al. (2017) Blanton M. R., et al., 2017, AJ, 154, 28
- Cai et al. (2016) Cai Y.-C., Taylor A., Peacock J. A., Padilla N., 2016, MNRAS, 462, 2465
- Chuang et al. (2015) Chuang C.-H., Kitaura F.-S., Prada F., Zhao C., Yepes G., 2015, MNRAS, 446, 2621
- DESI Collaboration et al. (2016) DESI Collaboration et al., 2016, arXiv e-prints, p. arXiv:1611.00036
- Dawson et al. (2013) Dawson K. S., et al., 2013, AJ, 145, 10
- Dawson et al. (2016) Dawson K. S., et al., 2016, AJ, 151, 44
- Eisenstein et al. (2011) Eisenstein D. J., et al., 2011, AJ, 142, 72
- Gil-Marín et al. (2020) Gil-Marín H., et al., 2020, MNRAS, 498, 2492
- Hamaus et al. (2014) Hamaus N., Sutter P. M., Wandelt B. D., 2014, Phys. Rev. Lett., 112, 251302
- Hamaus et al. (2015) Hamaus N., Sutter P. M., Lavaux G., Wandelt B. D., 2015, JCAP, 2015, 036
- Hamaus et al. (2016) Hamaus N., Pisani A., Sutter P. M., Lavaux G., Escoffier S., Wandelt B. D., Weller J., 2016, Phys. Rev. Lett., 117, 091302
- Hawken et al. (2017) Hawken A. J., et al., 2017, A&A, 607, A54
- Hawken et al. (2020) Hawken A. J., Aubert M., Pisani A., Cousinou M.-C., Escoffier S., Nadathur S., Rossi G., Schneider D. P., 2020, J. Cosmology Astropart. Phys., 2020, 012
- Howlett et al. (2015a) Howlett C., Manera M., Percival W. J., 2015a, Astronomy and Computing, 12, 109
- Howlett et al. (2015b) Howlett C., Ross A. J., Samushia L., Percival W. J., Manera M., 2015b, MNRAS, 449, 848
- Kaiser (1987) Kaiser N., 1987, MNRAS, 227, 1
- Kitaura et al. (2014) Kitaura F. S., Yepes G., Prada F., 2014, MNRAS, 439, L21
- Kitaura et al. (2016) Kitaura F.-S., et al., 2016, MNRAS, 456, 4156
- Lavaux & Wandelt (2012) Lavaux G., Wandelt B. D., 2012, ApJ, 754, 109
- Lesgourgues (2011) Lesgourgues J., 2011, arXiv:1104.2932
- Lewis et al. (2000) Lewis A., Challinor A., Lasenby A., 2000, ApJ, 538, 473
- Massara et al. (2022) Massara E., Percival W. J., Dalal N., Nadathur S., Radinović S., Winther H. A., Woodfinden A., 2022, MNRAS, 517, 4458
- Nadathur & Percival (2019) Nadathur S., Percival W. J., 2019, MNRAS, 483, 3472
- Nadathur et al. (2019) Nadathur S., Carter P. M., Percival W. J., Winther H. A., Bautista J. E., 2019, Phys. Rev. D, 100, 023504
- Nadathur et al. (2020a) Nadathur S., Percival W. J., Beutler F., Winther H. A., 2020a, Phys. Rev. Lett., 124, 221301
- Nadathur et al. (2020b) Nadathur S., et al., 2020b, MNRAS, 499, 4140
- Neyrinck (2008) Neyrinck M. C., 2008, MNRAS, 386, 2101
- Paillas et al. (2021) Paillas E., Cai Y.-C., Padilla N., Sánchez A. G., 2021, MNRAS, 505, 5731
- Paz et al. (2013) Paz D., Lares M., Ceccarelli L., Padilla N., Lambas D. G., 2013, MNRAS, 436, 3480
- Percival et al. (2021) Percival W. J., Friedrich O., Sellentin E., Heavens A., 2021, MNRAS,
- Planck Collaboration et al. (2020) Planck Collaboration et al., 2020, A&A, 641, A6
- Radinović et al. (2023) Radinović S., et al., 2023, arXiv e-prints, p. arXiv:2302.05302
- Ross et al. (2015) Ross A. J., Samushia L., Howlett C., Percival W. J., Burden A., Manera M., 2015, MNRAS, 449, 835
- Sánchez et al. (2017a) Sánchez A. G., et al., 2017a, MNRAS, 464, 1493
- Sánchez et al. (2017b) Sánchez C., et al., 2017b, MNRAS, 465, 746
- Scolnic et al. (2018) Scolnic D. M., et al., 2018, ApJ, 859, 101
- Torrado & Lewis (2019) Torrado J., Lewis A., 2019, Cobaya: Bayesian analysis in cosmology (ascl:1910.019)
- Torrado & Lewis (2021) Torrado J., Lewis A., 2021, J. Cosmology Astropart. Phys., 2021, 057
- Woodfinden et al. (2022) Woodfinden A., Nadathur S., Percival W. J., Radinovic S., Massara E., Winther H. A., 2022, MNRAS, 516, 4307
- York et al. (2000) York D. G., et al., 2000, AJ, 120, 1579
- Zhao et al. (2021) Zhao C., et al., 2021, MNRAS, 503, 1149