Dried Blood Spot Recovery:
A Microfluidic Technique for Fast Elution Without Dilution
Abstract
Dried blood spot (DBS) has risen in popularity due to the ease of sampling, storing, shipping and more. Despite those advantages, recovery of the dried blood in solution for analysis is still a bottleneck as it is manual, time-consuming and leads to high dilutions. To overcome those issues, we have developed a microfluidic chip allowing reversible opening, holding hermetically DBS and forcing the elution buffer through the thickness of DBS. The new technique, validated with clinical samples, is automated, fast, robust, precise, compatible with in-line analysis and leads to a highly concentrated extraction. Moreover, by using model experiments with fluorescein solutions, we show that the elution process is governed by an advection-diffusion coupling commonly known as Taylor dispersion. This new technique could open the way to a new generation of analytical devices to quantify analytes in DBS samples for a wide range of applications.
I Introduction
Dried Blood Spot (DBS) is a form of sampling where drops of capillary blood are dried on filter papers. Advantages like the ease of sampling (capillary blood from pin-prick instead of venous blood draw), storage and transport (DBS are mailed), the reduced amount of blood (10-25 L), the stability of analytes and others led to a rapid growth of its use. Applications range from large-scale use (newborn and metabolic screening [1], pharmacokinetics studies [2, 3, 4, 5] to discrete use (therapeutic drug monitoring [6, 7, 8, 9]) and use in resources-limited countries (infectious disease management [10, 11, 12, 13, 14, 15, 16, 17]). Target analyte concentrations are measured by the application of various quantitative analytical techniques such as gas chromatography-mass spectrometry (GC-MS) [18, 19, 20, 21], liquid chromatography (LC) with different sensors such as MS [22, 23, 24, 25, 26, 27], fluorescence [28, 29, 30, 31, 32], UV [33, 34, 7, 35], immunoassay [23, 12, 36, 37, 38], or PCR analysis [10, 39, 40, 41].
Despite the massive utilization worldwide, some disadvantages remain. First, recovery of the samples leads to high dilution because of the need to cover the DBS with an elution buffer. At least 200 L of the elution buffer is needed per DBS, which is at least 10 times the blood volume on a DBS. The low analyte concentrations obtained induce a need for sensitive and expensive analytical techniques [42, 43, 44, 45]. This is due to the predominance of concentration-dependent sensors, such as mass spectrometers, used for DBS analysis [46]. Secondly, only a few automated extraction solutions are affordable to medical analysis departments [42, 43, 44, 47, 34, 48]. Indeed, most methods classically used are manual, tedious and slow [49]. Third, protocols are plentiful: elution buffers, DBS size, duration of elution, volume of elution vary and depend on the analyte recovered [10, 44, 50, 51, 52]. Those issues led to a growing interest in developing a new set of universal techniques allowing miniaturization, automation, high concentration recovery, fast elution, in-line elution of the DBS and others for all possible elution buffers [53, 42, 54, 55, 56, 57].
In this context, microfluidic is a promising avenue since it deals with small amounts of liquid. To our knowledge, only one microfluidic method has been proposed to recover DBS [58, 59]. This method, using digital microfluidics, is mainly passive and slow, while only being able to process the recovery of the dried blood with a wetting liquid.
We report here both a new process of microfluidic chip conception and a new universal technic for automatic extraction of analytes from DBS. We designed a microfluidic chip that can be opened and tightly closed with a plug that holds a DBS and a single channel allowing a flow of elution buffer to percolate through the DBS. The flow is monitored with a pressure controller. We characterized this new form of microfluidic chips by performing the desorption of a model system, specifically that of the fluorescein from a DBS with a water flow. Our results show a fast recovery of highly concentrated extraction of analytes. This new microfluidic DBS analysis method was also validated by quantifying Phenylalanine (PHE), an amino acid commonly measured as a biomarker for Phenylketonuria, in clinical samples. Phenylketonuria is an inborn error of metabolism, resulting in a decreased metabolism of the amino acid PHE. The associated treatment is a low PHE diet with patients having to monitor their PHE concentration by sending DBS every week to a center of analysis [60, 61]. Finally, we show that our method also works both for wetting and non-wetting elution buffers (here water and methanol), demonstrating the reliability of this new microfluidic technique for the elution with all buffer-DBS interactions.
II Experimental
II.1 Reagents and Materials
Unless otherwise specified, reagents were purchased from Sigma Aldrich. Whatman 903 filter papers were purchased from GE Healthcare.
II.2 Microfluidic Fabrication
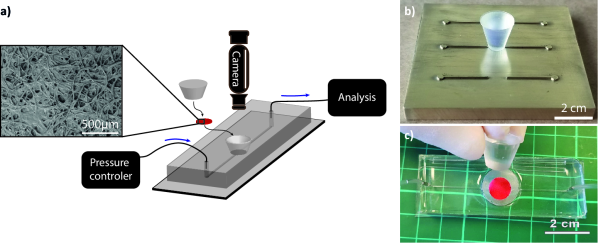
The microfluidic chips were fabricated with polydimethylsiloxane (Momentive RTV615 A) mixed with 10% cross-linking agent (Momentive RTV615 B) poured on a micro-milled brass plate. As shown in Figure 1 a) and b), the brass plate surface is made of a single channel (500 m width and height) opened in the center by a free area the size of a classical DBS (3 to 10 mm). A corresponding double-sided tape disc (3 to 10 mm diameter and 500 m thickness) of classical DBS was used to stick a 3D-printed truncated cone plug on the brass plate and thus connecting the two sections of the channel. The reticulated elastomers are treated under plasma (Femto Science CUTE) to be covalently bonded to a glass coverslip. A PDMS plug is made using a 3D-printed mold complementary to the 3D-printed plug. The PDMS plug is the exact complementary of the conic hole in the microfluidic chip. A clamping device using 4 screws was used to apply a constant pressure on the DBS allowing sealing of the chip. The plug allows the DBS to be introduced and removed in the PDMS chip. Plugs are made as truncated cones so they are easily introduced to hold the DBS and to seal the chip as shown in Figure 1 c). This is to our knowledge, the first microfluidic chip allowing a quick and easy access to its inside while staying perfectly hermetic when closed.
II.3 Microfluidic instrumentation for flow control
The microfluidic flow is controlled using a pressure controller system (Fluigent MFCS) with an M-flow unit to measure the flow rate. The Fluigent dynamic flow-rate control allows the system to reach a steady state in a few seconds. Automation of the flow control is performed by using the Fluigent script module. Automation is achieved with both target flow rate and final volume. For the elution of DBS with the non-wetting buffer (water), a first high-velocity pulse forces the elution buffer to burst through the DBS. This pulse is created with an instantaneous high pressure command (1000 mbar), immediately followed by a much lower flow rate, typically 10 L/min for a 5 mm DBS, up to the desired volume, typically 20 L.
II.4 Dried Blood Spot
DBS are made using Whatman 903 papers, a class II medical device virtually used in all international newborn screening programs, made from 100% pure cotton linters with no wet-strength additives [62]. Once spotted, the samples (fluorescein or blood) are allowed to dry for several hours before being stored in a zip bag with desiccants. 3.2, 5 and 10 mm diameter discs were punched out using biopsy punchers. Once samples are spotted, DBS are used in under a week. Figure S1 in Supporting Information (SI) shows scanning electron microscope pictures of Whatman 903 paper with and without dried blood. Typical fibers are 20 m wide and up to several millimeters long. Fresh blood spotted on the paper will fill the pores by capillary action before eventually drying. The initial porosity of the DBS is 0.5 [63] and the blood is about 80% water [64]. After drying of the blood, the porosity becomes 0.4. Figure S1 b) confirms that the paper matrix remains porous once the blood is dried, hence allowing the flow of solvent through the DBS pores.
II.5 Sample preparation for clinical assay
Clinical DBS were obtained from phenylketonuria patients. The samples analyzed consist of a single paper disc, 3.2 mm in diameter, punched out from a dried blood spot. PHE was eluted in a 96-well plate by 500 L of methanol added to 20 L of internal standard for 30 minutes at room temperature with continuous shaking. PHE concentrations were determined using a liquid chromatography tandem mass spectrometry method adapted from Tuchman and McCann [65]. Briefly, the separation was achieved on a Kinetecx F5 1.7 m, mm column (Phenomenex). 5 L of eluant was introduced directly into the electrospray source of a Xevo TQD (Waters) set in the positive ionization mode. Multiple reaction monitoring (MRM) mode was used for the quantification of the PHE.
II.6 Fluorescein experiments
Elution of fluorescein spiked DBS is monitored through the fluorescence intensity in the channel downstream the DBS. Images are recorded with a EM-CCD Hamamatsu ImagEM camera adapted on a Leica Z16 APO microscope with a FAM optic cube. The light source is a Leica EL 6000 triggered by an EG trigger from R&D Vision. No bleaching of the fluorescein has been observed. A calibration curve to link the fluorescein intensity and concentration was made by using several fluorescein concentrations in solutions (see Fig. S2 in SI).
III Results
III.1 Fluorescein elution from DBS
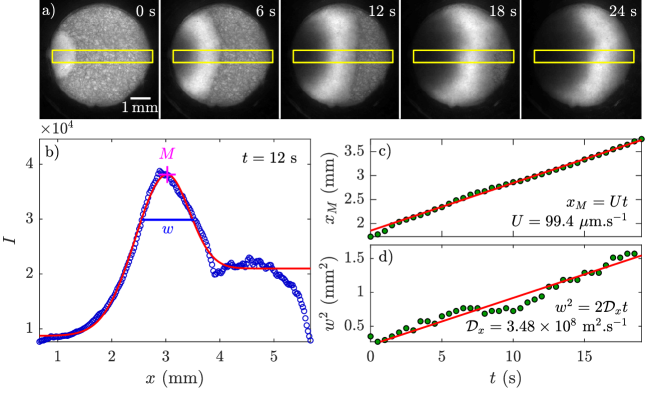
We performed experiments on the recovery of fluorescein (a fluorescent dye) from DBS with a water flow to characterize the desorption and elution process. As the water flows through the porous disc, the dry fluorescein desorbs from the DBS and we observe a bright circular front propagating on the disc as shown in Fig. 2 a) and Movie S1 (see SI). Moreover, we note an increase of the front width during its propagation. The dynamics of the front broadening can be explained by the so-called Taylor dispersion: When a solute or any microscopic entity is transported by a shear flow with a velocity gradient, the coupling between the Brownian diffusion and streamwise advection leads to an enhanced dispersion as described by Taylor in a seminal work [66]. The solute is first advected by the surrounding flow before a global broadening due to the Brownian motion, which homogenizes the front for very long times as compared to . The duration represents the diffusion time in the transverse direction, with and respectively the transverse length and diffusion coefficient of the transported entity [67].
During the elution, the liquid drives the fluorescein, initially on the disc, leading to an intensity peak, followed by a darker area at the front rear due to the fluorescein depletion. To study the dynamics of the front broadening, we only consider a small region centered on the disc (see Fig. 2 a)). For each image, the intensity profiles are spatially averaged perpendicularly to the flow as shown in Fig. 2 b). Each profile exhibits an intensity peak allowing definition of the front position and width . The temporal evolution of the front position and width are shown in Figs. 2 c) and d). Figure 2 c) shows that the front propagates with a constant velocity , which is consistent with the constant flow rate imposed by the pressure controller. Figure 2 c) shows that the front width has a quadratic time dependence in agreement with a diffusion regime. The effective diffusion coefficient, also called dispersion coefficient , is very large as compared to the molecular diffusion coefficient expected for the fluorescein i.e. m2.s-1 [68], but consistent with the Taylor dispersion phenomena.
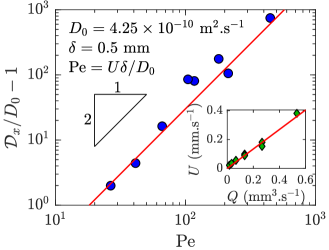
Indeed, the dimensionless dispersion coefficient increases quadratically with the Péclet number, defined as ( the disc thickness), as shown in Fig. 3. This result is in agreement with Taylor’s seminal work [66], where the dimensionless dispersion coefficient obeys to with a dimensionless coefficient imposed by the channel geometry. Thus, after the desorption, the fluorescein is transported by the surrounding flow and we observe that the dynamics of the front width is governed by the Taylor dispersion for a wide range of flow rates as shown in the inset in Fig. 3. This enhanced diffusion may facilitate the desorption process of the dry sample due to the faster spreading of the fluorescein in water.
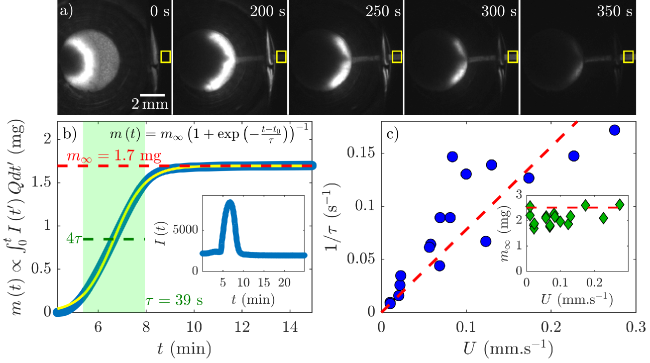
We now focus on the recovery of fluorescein extracted by elution from the Whatman disc. We examine the fluorescence intensity peak due to the fluorescein front propagation in the channel downstream as shown in Fig. 4 a). The fluorescein concentration is obtained from the intensity signal in the channel (see inset in Fig. 4 b)) by using a calibration curve to link intensity and fluorescence concentration (see Fig. S2 in SI). Thus, knowing the flow rate , we integrate the concentration as
to obtain the fluorescein mass recovered during the elution process. The recovered mass quickly increases before saturating to a plateau value. Thus it can be described by a hyperbolic tangent function , allowing us to extract both the final recovered fluorescein mass and elution duration . In Fig. 4 c), we observe that the elution duration decreases with the mean flow velocity and thus, with the flow rate , as shown in the inset in Fig. 3. Moreover, the final recovered fluorescein mass does not vary with the flow rate.
We show that the recovered fluorescein mass can be captured by a hyperbolic tangent function. As the increase of this function occurs in approximately (see Fig. 4 b)), with if we assume that the fluorescein desorbs in the first instants. As respectively shown in Fig. 4 c) and the inset in Fig. 3, the elution duration and mean flow velocity can be expressed as and the flow rate , where the distance and surface both depend on the microfluidic system. Consequently, the elution duration is given by and by using the dimensionless time , while the recovered mass can be expressed as
Finally, as the volume of the recovered solution is defined by , the concentration of the solution extracted by elution is given as a function of the dimensionless time . Indeed, and it becomes
with . Interestingly, for the range of parameters used in our experiments ( mm3 and ) this function can be non-monotonic. Thus, the flow rate can be wisely selected, with respect to the parameters of the microfluidic system ( and ) to optimize the concentration of the recovered solution.
III.2 Elution of clinical samples with methanol: a wetting-buffer specifically recovering dried blood’s amino acids.
The microfluidic method previously described is now used on clinical samples from phenylketonuria patients to quantify the concentration of the amino acid Phenylalanine (PHE). By contrast with our microfluidic technique, the standard technique is a 30-minute passive elution in wells with 520 L of (25:1) methanol: isotope-labeled standard. Methanol instantaneously precipitates the blood proteins while amino acids are eluted. Figure 5 a) shows the recovery ratio of PHE as a function of time for an elution with a volume L with the microfluidic technique for clinical sample. The time is varied over one order of magnitude by changing the flow rate . The concentration increases with and tends to level off after 20 minutes. After 4 minutes, we have a valuable recovery factor , where is the concentration value in long-time limit. After 30 minutes, the concentration of PHE recovered by the microfluidic technique is equal to that of the standard technique. As shown in the inset of Figure 5 a), the flow rates are larger than those used for the fluorescein experiments, which may explain the smaller values of the recovery factor.
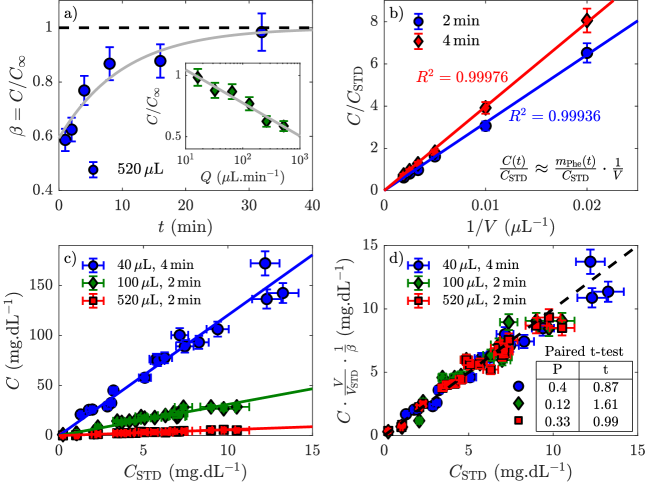
Figure 5 b) shows the concentration of PHE obtained with the microfluidic technique, normalized by the concentration obtained with the standard method, as a function of the volume for two elution times . The volume is varied over one decade by changing the flow rate. First, we note that the concentration ratio becomes quickly larger than 1. Moreover, it increases linearly as a function of , demonstrating that the PHE mass recovered by the microfluidic technique is only a function of the elution time as . Hence, a small elution volume leads to high concentration of the analyte recovered. This way to obtain larger concentrations has been tested for several clinical samples with various PHE masses in the DBS. Fig. 5 c) shows the concentration retrieved with our microfluidic method as a function of the concentration retrieved with the standard method. The concentration of the clinical samples recovered with the microfluidic technique is up to 10 times higher than the one recovered with the standard technique. Fig. 5 d) shows the same data as in Fig. 5 c) once normalized by both volumes and recovery factors . A paired t-test shows no significant statistical difference between the two methods at a 95% confidence level. P and t values of the paired t-test are shown in the table of Fig. 5 d). Finally, the recovery factors allow to predict the larger concentration values that can be obtained with our microfluidic technique.
III.3 Elution of clinical samples with water: a non-wetting buffer recovering all the dried blood analytes.
DBS are used in many situations and the protocols for retrieving back the dried blood in solution are plentiful. However, we can sort the elution buffers by their affinity with the dried blood on the paper matrix, whether the elution buffer wets the DBS or not. Wettability of the dried blood depends on the elution buffer: While methanol easily wets the DBS, water does not (see Fig. S3 in SI). In the microfluidic chip, percolation of a non-wetting fluid through the DBS tends to create large and randomly distributed dry areas. These drainage issues have already been studied by Lenormand [69]: Three main regimes exist for the displacement of a wetting fluid (air in our case) by a non-wetting fluid (water in our case). These three behaviors depend on two dimensionless numbers: the capillary number and viscosity ratio , respectively defined as and , with the streamwise mean velocity of the moving fluid, and the viscosities of the moving and quiescent fluids, the surface tension. As the two fluids here are liquid and gas (water and air in the example), the ratio of viscosity is always constant and larger than 1 in our experiments. Thus, only two of the three possible regimes are attainable: capillary fingering for low capillary numbers and stable displacement for large capillary numbers. They correspond to the limit when two of the three forces involved during displacement can be neglected. Capillary fingering occurs when the injection rate is low and viscous forces are negligible in both fluids. Stable displacement occurs at large flow rate when capillarity forces are low with a negligible pressure drop in the displaced phase.
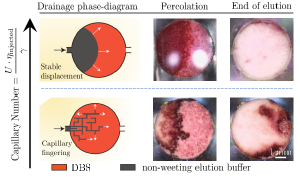
Capillary fingering is observed for a typical flow rate of L.min-1. Some areas remain dry when capillary fingering occurs during percolation of DBS by a non-wetting buffer. Those area will eventually disappear as the elution buffer dissolves the dried blood from the interface. This time depends on the dried surface area but is substantially longer than the time needed to dissolve dried blood from a properly wet area. Furthermore, the percolation stops when a capillary finger reaches the end of the DBS and connects to the microfluidic channel. Consequently, large randomly distributed areas remain dry. In order to achieve elution under two minutes without dilution, DBS percolation has to follow the stable displacement regime. The value of the capillary number can only be modified by changing the velocity of the injected fluid. To fully and homogeneously wet the DBS, we apply an initial substantial velocity pulse, with an instantaneous high-pressure command (1000 mbar), thus increasing the capillary number, before imposing a lower flow rate to complete the elution without dilution.
To validate our microfluidic technique with all possible dried blood-elution buffer interactions, we have evaluated the elution of clinical samples from phenylketonuria patients with water: a non-wetting buffer recovering all the dried blood back in solution. The standard technique is an overnight passive elution in wells with 520 L of (25:1) water: isotope-labeled standard. Our microfluidic protocol is automatized. A sharp high-velocity pulse homogeneously wets the dried blood spot and is followed by a 2-minute low flow rate leading to 40 L elution volume to avoid the capillary fingering, as previously described. Figure 7 shows the concentration of the samples retrieved with the microfluidic technique as a function of the concentration of the same DBS retrieved with the standard technique.
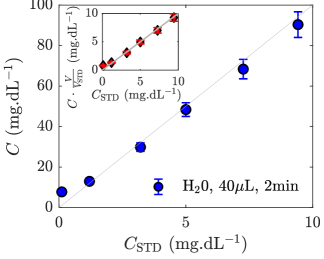
The concentration of the clinical samples recovered with the microfluidic technique is up to 10 times higher than that recovered with the standard technique. The insert in Fig. 7 shows the same data once normalized by volumes. A paired t-test shows no significant statistical difference between the two methods at a 95% confidence level. This example demonstrates the reliability of our microfluidic method for various situations.
IV Conclusion
For elution of dried blood spots, we have developed an automated microfluidic device to elute of dried blood spot. The dried blood spot is hermetically and reversibly held in the microfluidic chip. The elution buffer is driven through the DBS.
Firstly, we performed experiments on the recovery of a fluorescent dye as a model system, highlighting a Taylor dispersion phenomenon in elution process. We demonstrate that the final recovered mass of fluorescein does not depend on the flow rate, thus the flow rate can be set in order to recover a highly concentrated solution. Here, the elution is fast (under 2 minutes) and leads to the recovery of fluorescein in solution at large concentrations as compared to the standard methods.
Secondly, we characterized the different possible interaction between the elution buffer and the dried blood on the DBS. Certain buffers, such as methanol, easily wet the DBS whereas some, such as water, do not wet the DBS. In the case of the elution of a DBS with a non-wetting buffer, a drainage issue may appear, creating randomly distributed dry areas on the DBS and leading to incomplete elution. A protocol has been defined to wet the DBS with a stable displacement regime of percolation by using an initial high-pressure pulse.
Finally, for both wetting and non-wetting elution buffers, we demonstrate the utility of our method on clinical samples to measure the phenylalanine concentration, an amino acid commonly used as a biomarker for Phenylketonuria. We obtained as much as 10 times more concentrated solutions than the standard method, with a duration approximately 10 times shorter. We showed with a paired t-test that the normalized results both in volume of elution and recovery factors showed no significant statistical differences.
To conclude, this new protocol can allow elution under two minutes of dried blood spot, leading to a highly concentrated sample while allowing the use of less sensitive analytical devices.
Outline
This study was performed according to the French Public health regulations (Code de la Santé Publique - Article L1121-3, amended by Law n°2011-2012, December 29, 2011 - Article 5) using anonymized residues of DBS sampled for the follow-up of phenylketonuria patients. No other biological investigation was performed other than PHE analysis.
Acknowledgements.
The authors thank Aditya Jha and Emer Buckley for patient reading. This work has benefited from the technical contribution of the joint service unit CNRS UAR 3750. The authors also benefited from the financial support of CNRS, the Fondation ESPCI, the Institut Pierre-Gilles de Gennes (Equipex ANR-10-EQPX-34 and Labex ANR-10-LABX- 31), and PSL Research University (Idex ANR-10-IDEX-0001-02).Supporting Information Available
The following files are available free of charge.
-
•
MovieS1.mp4: The Movie S1 shows the elution process, with the front propagation and broadening, in the fluorescein experiment described in Figure 2. The parameters are thus detailed in the caption of this figure.
-
•
supp.pdf: The supporting information file contains additional Figures S1, S2, S3, respectively related to the microscopic structure of the Whatman 903 paper disc with and without dried blood, the calibration curve relating image intensity and fluorescein concentration, interaction between DBS and two elution buffers. This last figure is accompanied by a short discussion on the effect of wetting and non-wetting buffers on the elution process.
References
- Chace [2009] D. H. Chace, Mass spectrometry in newborn and metabolic screening: historical perspective and future directions, Journal of mass spectrometry 44, 163 (2009).
- Spooner et al. [2009] N. Spooner, R. Lad, and M. Barfield, Dried blood spots as a sample collection technique for the determination of pharmacokinetics in clinical studies: considerations for the validation of a quantitative bioanalytical method, Analytical chemistry 81, 1557 (2009).
- Patel et al. [2010] P. Patel, H. Mulla, S. Tanna, and H. Pandya, Facilitating pharmacokinetic studies in children: a new use of dried blood spots, Archives of disease in childhood 95, 484 (2010).
- Kissinger [2011] P. T. Kissinger, Thinking about dried blood spots for pharmacokinetic assays and therapeutic drug monitoring, Bioanalysis 3, 2263 (2011).
- Beaudette and Bateman [2004] P. Beaudette and K. P. Bateman, Discovery stage pharmacokinetics using dried blood spots, Journal of Chromatography B 809, 153 (2004).
- Coombes et al. [1984] E. Coombes, T. Gamlen, G. Batstone, and P. Leigh, A phenytoin assay using dried blood spot samples suitable for domiciliary therapeutic drug monitoring, Annals of clinical biochemistry 21, 519 (1984).
- Malm et al. [2004] M. Malm, N. Lindegårdh, and Y. Bergqvist, Automated solid-phase extraction method for the determination of piperaquine in capillary blood applied onto sampling paper by liquid chromatography, Journal of Chromatography B 809, 43 (2004).
- Meesters et al. [2010] R. J. Meesters, J. J. van Kampen, M. L. Reedijk, R. D. Scheuer, L. J. Dekker, D. M. Burger, N. G. Hartwig, A. D. Osterhaus, T. M. Luider, and R. A. Gruters, Ultrafast and high-throughput mass spectrometric assay for therapeutic drug monitoring of antiretroviral drugs in pediatric hiv-1 infection applying dried blood spots, Analytical and bioanalytical chemistry 398, 319 (2010).
- Ter Heine et al. [2008] R. Ter Heine, H. Rosing, E. Van Gorp, J. Mulder, W. Van der Steeg, J. Beijnen, and A. Huitema, Quantification of protease inhibitors and non-nucleoside reverse transcriptase inhibitors in dried blood spots by liquid chromatography–triple quadrupole mass spectrometry, Journal of Chromatography B 867, 205 (2008).
- Snijdewind et al. [2012] I. J. Snijdewind, J. J. van Kampen, P. L. Fraaij, M. E. van der Ende, A. D. Osterhaus, and R. A. Gruters, Current and future applications of dried blood spots in viral disease management, Antiviral research 93, 309 (2012).
- Anders et al. [2012] K. L. Anders, N. M. Nguyet, N. T. H. Quyen, T. Van Ngoc, T. Van Tram, T. T. Gan, N. T. Tung, N. T. Dung, N. V. V. Chau, B. Wills, et al., An evaluation of dried blood spots and oral swabs as alternative specimens for the diagnosis of dengue and screening for past dengue virus exposure, The American journal of tropical medicine and hygiene 87, 165 (2012).
- Chase et al. [2012] B. A. Chase, S. A. Johnston, and J. B. Legutki, Evaluation of biological sample preparation for immunosignature based diagnostics., Clinical and Vaccine Immunology , CVI (2012).
- Hooff et al. [2011] G. P. Hooff, R. J. Meesters, J. J. van Kampen, N. A. van Huizen, B. Koch, A. F. Al Hadithy, T. van Gelder, A. D. Osterhaus, R. A. Gruters, and T. M. Luider, Dried blood spot uhplc-ms/ms analysis of oseltamivir and oseltamivircarboxylate—a validated assay for the clinic, Analytical and bioanalytical chemistry 400, 3473 (2011).
- Johannessen [2010] A. Johannessen, Dried blood spots in hiv monitoring: applications in resource-limited settings, Bioanalysis 2, 1893 (2010).
- Li et al. [2011] W. Li, J. Zhang, and F. L. Tse, Strategies in quantitative lc-ms/ms analysis of unstable small molecules in biological matrices, Biomedical Chromatography 25, 258 (2011).
- Rohrman and Richards-Kortum [2012] B. A. Rohrman and R. R. Richards-Kortum, A paper and plastic device for performing recombinase polymerase amplification of hiv dna, Lab on a chip 12, 3082 (2012).
- Sherman et al. [2005] G. G. Sherman, G. Stevens, S. A. Jones, P. Horsfield, and W. S. Stevens, Dried blood spots improve access to hiv diagnosis and care for infants in low-resource settings, JAIDS Journal of Acquired Immune Deficiency Syndromes 38, 615 (2005).
- Mess et al. [2012] J.-N. Mess, M.-P. Taillon, C. Côté, and F. Garofolo, Dried blood spot on-card derivatization: an alternative form of sample handling to overcome the instability of thiorphan in biological matrix, Biomedical Chromatography 26, 1617 (2012).
- Kong et al. [2011] S. T. Kong, H.-S. Lin, J. Ching, and P. C. Ho, Evaluation of dried blood spots as sample matrix for gas chromatography/mass spectrometry based metabolomic profiling, Analytical chemistry 83, 4314 (2011).
- Deng et al. [2002] C. Deng, Y. Deng, B. Wang, and X. Yang, Gas chromatography–mass spectrometry method for determination of phenylalanine and tyrosine in neonatal blood spots, Journal of Chromatography B 780, 407 (2002).
- Spector et al. [2007] L. G. Spector, S. S. Hecht, S. Ognjanovic, S. G. Carmella, and J. A. Ross, Detection of cotinine in newborn dried blood spots, Cancer Epidemiology and Prevention Biomarkers 16, 1902 (2007).
- Piraud et al. [2003] M. Piraud, C. Vianey-Saban, K. Petritis, C. Elfakir, J.-P. Steghens, A. Morla, and D. Bouchu, Esi-ms/ms analysis of underivatised amino acids: a new tool for the diagnosis of inherited disorders of amino acid metabolism. fragmentation study of 79 molecules of biological interest in positive and negative ionisation mode, Rapid Communications in Mass Spectrometry 17, 1297 (2003).
- la Marca et al. [2008] G. la Marca, S. Malvagia, L. Filippi, P. Fiorini, M. Innocenti, F. Luceri, G. Pieraccini, G. Moneti, S. Francese, F. R. Dani, et al., Rapid assay of topiramate in dried blood spots by a new liquid chromatography-tandem mass spectrometric method, Journal of pharmaceutical and biomedical analysis 48, 1392 (2008).
- Kromdijk et al. [2013] W. Kromdijk, J. W. Mulder, P. M. Smit, R. ter Heine, J. H. Beijnen, and A. D. Huitema, Short communication therapeutic drug monitoring of antiretroviral drugs at home using dried blood spots: a proof-of-concept study, Antiviral therapy 18, 821 (2013).
- Castillo-Mancilla et al. [2013] J. R. Castillo-Mancilla, J.-H. Zheng, J. E. Rower, A. Meditz, E. M. Gardner, J. Predhomme, C. Fernandez, J. Langness, J. J. Kiser, L. R. Bushman, et al., Tenofovir, emtricitabine, and tenofovir diphosphate in dried blood spots for determining recent and cumulative drug exposure, AIDS research and human retroviruses 29, 384 (2013).
- Ansari et al. [2012] M. Ansari, C. R. S. Uppugunduri, J. Déglon, Y. Théorêt, F. Versace, F. Gumy-Pause, H. Ozsahin, P. Dayer, J. Desmeules, and Y. Daali, A simplified method for busulfan monitoring using dried blood spot in combination with liquid chromatography/tandem mass spectrometry, Rapid Communications in Mass Spectrometry 26, 1437 (2012).
- Nageswara Rao et al. [2012a] R. Nageswara Rao, S. Satyanarayana Raju, R. Mastan Vali, V. Sarma, and G. Girija Sankar, Lc-esi-ms/ms determination of paclitaxel on dried blood spots, Biomedical Chromatography 26, 616 (2012a).
- Tawa et al. [1989] R. Tawa, S. Hirose, and T. Fujimoto, Determination of the aminoglycoside antibiotics sisomicin and netilmicin in dried blood spots on filter discs, by high-performance liquid chromatography with pre-column derivatization and fluorimetric detection, Journal of Chromatography B: Biomedical Sciences and Applications 490, 125 (1989).
- Croes et al. [1994] K. Croes, P. McCarthy, and R. Flanagan, Simple and rapid hplc of quinine, hydroxychloroquine, chloroquine, and desethylchloroquine in serum, whole blood, and filter paper-adsorbed dry blood, Journal of analytical toxicology 18, 255 (1994).
- Nageswara Rao et al. [2012b] R. Nageswara Rao, C. G. Naidu, K. Guru Prasad, R. Padiya, and S. B. Agwane, Determination of gemifloxacin on dried blood spots by hydrophilic interaction liquid chromatography with fluorescence detector: application to pharmacokinetics in rats, Biomedical chromatography 26, 1534 (2012b).
- Römsing et al. [2011] S. Römsing, N. Lindegardh, and Y. Bergqvist, Determination of tafenoquine in dried blood spots and plasma using lc and fluorescence detection, Bioanalysis 3, 1847 (2011).
- Rao et al. [2011] R. N. Rao, S. Bompelli, and P. K. Maurya, High-performance liquid chromatographic determination of anti-hypertensive drugs on dried blood spots using a fluorescence detector–method development and validation, Biomedical Chromatography 25, 1252 (2011).
- Green et al. [2002] M. D. Green, D. L. Mount, and H. Nettey, High-performance liquid chromatographic assay for the simultaneous determination of sulfadoxine and pyrimethamine from whole blood dried onto filter paper, Journal of Chromatography B 767, 159 (2002).
- Blessborn et al. [2007] D. Blessborn, S. Römsing, A. Annerberg, D. Sundquist, A. Björkman, N. Lindegardh, and Y. Bergqvist, Development and validation of an automated solid-phase extraction and liquid chromatographic method for determination of lumefantrine in capillary blood on sampling paper, Journal of pharmaceutical and biomedical analysis 45, 282 (2007).
- Allanson et al. [2007] A. Allanson, M. Cotton, J. Tettey, and A. Boyter, Determination of rifampicin in human plasma and blood spots by high performance liquid chromatography with uv detection: a potential method for therapeutic drug monitoring, Journal of pharmaceutical and biomedical analysis 44, 963 (2007).
- Brindle et al. [2010] E. Brindle, M. Fujita, J. Shofer, and K. A. O’Connor, Serum, plasma, and dried blood spot high-sensitivity c-reactive protein enzyme immunoassay for population research, Journal of immunological methods 362, 112 (2010).
- La Marca et al. [2009] G. La Marca, S. Malvagia, L. Filippi, F. Luceri, G. Moneti, and R. Guerrini, A new rapid micromethod for the assay of phenobarbital from dried blood spots by lc-tandem mass spectrometry, Epilepsia 50, 2658 (2009).
- Lin et al. [2011] Y.-Q. Lin, R. Khetarpal, Y. Zhang, H. Song, and S. S. Li, Combination of elisa and dried blood spot technique for the quantification of large molecules using exenatide as a model, Journal of pharmacological and toxicological methods 64, 124 (2011).
- Masciotra et al. [2012] S. Masciotra, S. Khamadi, E. Bilé, A. Puren, P. Fonjungo, S. Nguyen, M. Girma, R. Downing, A. Ramos, S. Subbarao, et al., Evaluation of blood collection filter papers for hiv-1 dna pcr, Journal of clinical virology 55, 101 (2012).
- Vidya et al. [2012] M. Vidya, S. Saravanan, S. Rifkin, S. S. Solomon, G. Waldrop, K. H. Mayer, S. Solomon, and P. Balakrishnan, Dried blood spots versus plasma for the quantitation of hiv-1 rna using a real-time pcr, m2000rt assay, Journal of virological methods 181, 177 (2012).
- de Vries et al. [2012] J. J. de Vries, E. Wessels, A. M. Korver, A. A. van der Eijk, L. G. Rusman, A. C. Kroes, and A. C. Vossen, Rapid genotyping of cytomegalovirus in dried blood spots by multiplex real-time pcr assays targeting the envelope glycoprotein gb and gh genes, Journal of clinical microbiology 50, 232 (2012).
- Meesters and Hooff [2013] R. J. Meesters and G. P. Hooff, State-of-the-art dried blood spot analysis: an overview of recent advances and future trends, Bioanalysis 5, 2187 (2013).
- Déglon et al. [2012] J. Déglon, A. Thomas, P. Mangin, and C. Staub, Direct analysis of dried blood spots coupled with mass spectrometry: concepts and biomedical applications, Analytical and bioanalytical chemistry 402, 2485 (2012).
- Edelbroek et al. [2009] P. M. Edelbroek, J. van der Heijden, and L. M. Stolk, Dried blood spot methods in therapeutic drug monitoring: methods, assays, and pitfalls, Therapeutic drug monitoring 31, 327 (2009).
- Jardi et al. [2004] R. Jardi, F. Rodriguez-Frias, M. Buti, M. Schaper, A. Valdes, M. Martinez, R. Esteban, and J. Guardia, Usefulness of dried blood samples for quantification and molecular characterization of hbv-dna, Hepatology 40, 133 (2004).
- Rainville [2011] P. Rainville, Microfluidic lc–ms for analysis of small-volume biofluid samples: where we have been and where we need to go, Bioanalysis 3, 1 (2011).
- Johnson et al. [2011] C. J. Johnson, C. D. Christianson, C. N. Sheaff, D. F. Laine, J. S. Zimmer, and S. R. Needham, Use of conventional bioanalytical devices to automate dbs extractions in liquid-handling dispensing tips, Bioanalysis 3, 2303 (2011).
- Déglon et al. [2009] J. Déglon, A. Thomas, A. Cataldo, P. Mangin, and C. Staub, On-line desorption of dried blood spot: a novel approach for the direct lc/ms analysis of -whole blood samples, Journal of pharmaceutical and biomedical analysis 49, 1034 (2009).
- Arnaud [2011] C. H. Arnaud, Technology renews a basic approach, Chemical & Engineering News 89, 13 (2011).
- Li and Tse [2010] W. Li and F. L. Tse, Dried blood spot sampling in combination with lc-ms/ms for quantitative analysis of small molecules, Biomedical Chromatography 24, 49 (2010).
- Hirtz and Lehmann [2015] C. Hirtz and S. Lehmann, Le prélèvement sanguin sur papier buvard: une révolution de la biologie médicale en marche ?, in Annales de Biologie Clinique, Vol. 73 (2015) pp. 25–37.
- McDade et al. [2007] T. W. McDade, S. Williams, and J. J. Snodgrass, What a drop can do: dried blood spots as a minimally invasive method for integrating biomarkers into population-based research, Demography 44, 899 (2007).
- Demirev [2012] P. A. Demirev, Dried blood spots: analysis and applications, Analytical chemistry 85, 779 (2012).
- Manicke et al. [2011] N. E. Manicke, P. Abu-Rabie, N. Spooner, Z. Ouyang, and R. G. Cooks, Quantitative analysis of therapeutic drugs in dried blood spot samples by paper spray mass spectrometry: an avenue to therapeutic drug monitoring, Journal of the American Society for Mass Spectrometry 22, 1501 (2011).
- Abu-Rabie and Spooner [2009] P. Abu-Rabie and N. Spooner, Direct quantitative bioanalysis of drugs in dried blood spot samples using a thin-layer chromatography mass spectrometer interface, Analytical chemistry 81, 10275 (2009).
- Liu et al. [2011] G. Liu, Q. C. Ji, M. Jemal, A. A. Tymiak, and M. E. Arnold, Approach to evaluating dried blood spot sample stability during drying process and discovery of a treated card to maintain analyte stability by rapid on-card ph modification, Analytical chemistry 83, 9033 (2011).
- Stokes et al. [2011] A. H. Stokes, T. A. Moose, S. P. Parry, M. Barfield, C. A. Lovatt, W. J. Dopson, D. Melich, C. R. Overvold, S. D. Gade, and N. Spooner, Determination of drug concentrations using dried blood spots: investigation of blood sampling and collection techniques in crl: Cd (sd) rats, Laboratory animals 45, 109 (2011).
- Shih et al. [2012] S. C. Shih, H. Yang, M. J. Jebrail, R. Fobel, N. McIntosh, O. Y. Al-Dirbashi, P. Chakraborty, and A. R. Wheeler, Dried blood spot analysis by digital microfluidics coupled to nanoelectrospray ionization mass spectrometry, Analytical chemistry 84, 3731 (2012).
- Jebrail et al. [2011] M. J. Jebrail, H. Yang, J. M. Mudrik, N. M. Lafreniere, C. McRoberts, O. Y. Al-Dirbashi, L. Fisher, P. Chakraborty, and A. R. Wheeler, A digital microfluidic method for dried blood spot analysis, Lab on a Chip 11, 3218 (2011).
- BOO [2003] Nord guide to rare disorders (•, 2003) Chap. Phenylketonuria.
- BOO [2001] The metabolic and molecular basis of inherited disease (•, 2001) Chap. Chapter on Phenyketonuria.
- Healthcare [2008] G. Healthcare, Whatman™ neonatal screening cards-capabilities, Consultado el 10 (2008).
- Chao et al. [2016] T. C. Chao, O. Arjmandi-Tash, D. B. Das, and V. M. Starov, Simultaneous spreading and imbibition of blood droplets over porous substrates in the case of partial wetting, Colloids and Surfaces A: Physicochemical and Engineering Aspects 505, 9 (2016).
- Beilin et al. [1966] L. Beilin, G. Knight, A. Munro-Faure, J. Anderson, et al., The sodium, potassium, and water contents of red blood cells of healthy human adults., The Journal of clinical investigation 45, 1817 (1966).
- Tuchman and McCann [1999] M. Tuchman and M. T. McCann, Phenylalanine and tyrosine quantification by stable isotope dilution liquid chromatography–mass spectrometry from filter paper blood spots, Clinical chemistry 45, 571 (1999).
- Taylor [1953] G. I. Taylor, Dispersion of soluble matter in solvent flowing slowly through a tube, Proceedings of the Royal Society of London. Series A. Mathematical and Physical Sciences 219, 186 (1953).
- Einstein [1905] A. Einstein, Über die von der molekularkinetischen theorie der wärme geforderte bewegung von in ruhenden flüssigkeiten suspendierten teilchen, Annalen der Physik 322, 549 (1905).
- Culbertson et al. [2002] C. T. Culbertson, S. C. Jacobson, and J. M. Ramsey, Diffusion coefficient measurements in microfluidic devices, Talanta 56, 365 (2002).
- Lenormand [1990] R. Lenormand, Liquids in porous media, Journal of Physics: Condensed Matter 2, SA79 (1990).