The connection between stellar mass, age and quenching timescale in massive quiescent galaxies at
Abstract
We present a spectro-photometric study of a mass-complete sample of quiescent galaxies at with drawn from the VANDELS survey, exploring the relationship between stellar mass, age and star-formation history. Within our sample of 114 galaxies, we derive a stellar-mass vs stellar-age relation with a slope of Gyr per decade in stellar mass. When combined with recent literature results, we find evidence that the slope of this relation remains consistent over the redshift interval . The galaxies within the VANDELS quiescent display a wide range of star-formation histories, with a mean star-formation timescale of Gyr and a mean quenching timescale of Gyr. We also find a large scatter in the quenching timescales of the VANDELS quiescent galaxies, in agreement with previous evidence that galaxies at cease star formation via multiple mechanisms. We then focus on the oldest galaxies in our sample, finding that the number density of galaxies that quenched before with stellar masses is . Although uncertain, this estimate is in good agreement with the latest observational results at , tentatively suggesting that neither rejuvenation nor merger events are playing a major role in the evolution of the oldest massive quiescent galaxies within the redshift interval .
keywords:
galaxies: evolution – galaxies: star formation – galaxies: high-redshift1 Introduction
It is now well established that the local galaxy population is bi-modal in terms of colour, morphology and star-formation rate (SFR). The colour bi-modality was first observed using data from the Sloan Digital Sky Survey (SDSS, York et al., 2000), with galaxies falling into two categories: a star-forming ‘blue cloud’ and a quiescent ‘red sequence’ (e.g. Strateva et al., 2001; Baldry et al., 2004). In general, more-massive galaxies tend to be red spheroids with little ongoing star formation, whilst less-massive galaxies are mainly blue, star-forming discs. Over the past few decades, many studies have aimed to quantify the mechanisms responsible for producing the bi-modality in the galaxy population (e.g. Dekel & Birnboim, 2006; Peng et al., 2010; Gabor & Davé, 2012; Schawinski et al., 2014). However, despite the wealth of ground-based and space-based data available, understanding exactly how the shutting down of star formation relates to this distinction between galaxy types remains hugely challenging.
Observations have shown that, even within the quiescent population, galaxies demonstrate a range of characteristics. For example, more-massive galaxies are known to have formed earlier in cosmic time and much more rapidly, with clear evidence for younger stellar populations in less-massive galaxies compared to their more-massive counterparts (e.g. Cowie et al., 1996; Thomas et al., 2005b; Fontana et al., 2006; Fontanot et al., 2009; Pacifici et al., 2016). This phenomenon, referred to as ‘downsizing’, is commonly used to describe the relationship between quiescent galaxy stellar mass and age, and indicates that quenching varies as a function of stellar mass and redshift. Empirical spectral age indicators have provided strong constraints on this downsizing trend, with features such as the Dn4000 index demonstrating positive correlations with stellar mass at redshift, (e.g. Bruzual, 1983; Balogh et al., 1999; Kauffmann et al., 2003; Brinchmann et al., 2004; Moresco et al., 2011; Moresco et al., 2010, 2016).
In addition to the bi-modality of the galaxy population, one of the most important observational results of the past few decades is the differing evolution of the star-forming and quiescent galaxy stellar mass functions (GSMF) across cosmic time, with the number density of quiescent galaxies apparently increasing by almost an order of magnitude since (e.g. Cimatti et al., 2002; Abraham et al., 2004; Baldry et al., 2012; Muzzin et al., 2013; Davidzon et al., 2017; McLeod et al., 2021). However, recent studies also point to a substantial population of massive quiescent galaxies out to (e.g. Schreiber et al., 2018; Valentino et al., 2020; Carnall et al., 2020, 2022a). Together, these results allow us to quantify the quiescent galaxy fraction across cosmic time, an important observational constraint on galaxy evolution models (e.g., Somerville & Davé, 2015).
Another key result was the discovery that the sizes of quiescent galaxies have evolved much more rapidly than their star-forming counterparts since , and that quiescent galaxies follow a steeper stellar mass-size relation than star-forming galaxies at all redshifts (e.g. Shen et al., 2003; Trujillo et al., 2006; McLure et al., 2013; van der Wel et al., 2014; Mowla et al., 2019). The physical processes driving the size growth of quiescent galaxies are still not fully understood, although it is widely accepted that minor mergers play an important role in explaining the observed growth from to the local Universe (e.g. see Hopkins et al., 2010; Trujillo et al., 2011; Cimatti et al., 2012; Ownsworth et al., 2014).
Considerable effort has been devoted to understanding which physical mechanisms are required to explain the observed differences in the properties of the star-forming and quiescent galaxy populations. Our understanding of quenching mechanisms relies heavily on simulations of galaxy formation. At , simulations have been able to reproduce the observed bi-modality (see Davé et al., 2017; Davé et al., 2019; Nelson et al., 2018; Akins et al., 2022). However, the situation becomes more complicated at higher redshifts, and it is much more difficult to identify the key physical drivers of quenching. The main mechanisms thought to cause quenching can be categorised into two distinct pathways: ‘mass’ (or ‘internal’, see Somerville & Davé, 2015) quenching, and ‘environmental’ quenching. Locally, these two pathways are clearly distinguishable, suggesting that multiple mechanisms quench galaxies (e.g., Peng et al., 2010).
Mass quenching is often thought to be associated with feedback processes such as radiative- or jet-mode active galactic nucleus (AGN) feedback (e.g. Croton et al., 2006; Gabor et al., 2011; Choi et al., 2018). Quenching attributed to galaxy-galaxy interactions (often referred to as ‘environmental’ or ‘satellite’ quenching) is thought to be the result of ram-pressure stripping, caused by satellite galaxies falling into larger dark matter halos, or virial shock-heating of the circum-galactic medium (see Dekel & Birnboim, 2006, also referred to as ‘halo’ quenching).
These mechanisms can be further categorised as ‘slow’ and ‘fast’ quenching pathways, respectively (Schawinski et al., 2014; Schreiber et al., 2016; Carnall et al., 2018; Belli et al., 2019). Shorter quenching timescales are thought to be linked with quasar-mode AGN feedback, which is thought to be more prevalent at high redshift (Wild et al., 2016). In contrast, it appears that the key process responsible for quenching at low redshift is the halting of gas accretion, taking place on much longer timescales of several Gyr (e.g. Peng et al., 2015; Trussler et al., 2020).
Large spectroscopic surveys have facilitated increasingly sophisticated, statistical studies of galaxy physical properties at high redshift, with the aim of placing tighter constraints on the physical origins of quenching. The recently completed LEGA-C (van der Wel et al., 2016) and VANDELS (McLure et al., 2018) surveys provide ultra-deep spectroscopy for hundreds of quiescent galaxies at . These data sets, coupled with improved spectral energy distribution (SED) fitting methods (e.g. Carnall et al., 2019b; Leja et al., 2019a), have already enabled more-precise measurements of galaxy stellar masses, star-formation histories (SFHs) and stellar metallicities, unveiling significant correlations between these physical properties (e.g. Wu et al., 2018, 2021; Beverage et al., 2021; Carnall et al., 2022b).
A key emerging result is the finding that the observed stellar mass vs stellar age relationship for quiescent galaxies is steeper than is predicted by the most recent generation of cosmological simulations (e.g. Carnall et al. 2019a; Tacchella et al. 2022). These new spectroscopic analyses build upon a corpus of earlier work aiming to quantify these relationships, much of which was founded upon the use of elemental abundances as empirical proxies for formation and quenching timescales (e.g. Thomas et al., 2005a; Conroy et al., 2014; Kriek et al., 2019). Despite these advances in the field, continued, in-depth investigation into the physical properties of quiescent galaxies is still needed to build a thorough understanding of quenching and passive galaxy evolution.
In Hamadouche et al. (2022), we investigated the links between stellar mass, age, size and metallicity using quiescent-galaxy samples from the LEGA-C (van der Wel et al., 2016) and VANDELS (McLure et al., 2018) spectroscopic surveys at and , respectively. We examined stellar mass-age trends using the Dn4000 index as a proxy for the stellar population age, finding that more-massive galaxies exhibit higher Dn4000 values at both redshift ranges, consistent with prior evidence for the downsizing scenario at lower redshifts. In this work, we return to the VANDELS spectroscopic sample, building upon our previous results by employing full spectral fitting to probe the ages and SFHs of massive quiescent galaxies at in detail.
This study makes use of the fully completed VANDELS DR4 sample (Garilli et al., 2021), which includes more than twice the number of quiescent galaxy spectra studied in the initial analysis of Carnall et al. (2019a). Moreover, in this study we implement an improved physical model, along with additional metallicity constraints for the VANDELS sample from Carnall et al. (2022b), to better constrain star-formation histories, stellar masses and formation and quenching times. Motivated by the ongoing challenges in quantifying the correlations between key quiescent galaxy physical properties, we begin by examining the relationship between stellar mass and age in our quiescent sample at , and discuss these results in the context of downsizing.
The structure of this paper is as follows. We introduce the VANDELS survey in Section 2, before providing details of our sample selection and spectral fitting technique using the Bagpipes code (Carnall et al., 2018) in Section 3. We present our main results in Section 4 and discuss them in Section 5. Finally, we present our conclusions in Section 6. Throughout this paper, we assume a Kroupa (2001) initial mass function and the Asplund et al. (2009) Solar abundance of . We assume cosmological parameters = , = 0.3 and = 0.7 throughout. All magnitudes are quoted in the AB system.
2 The VANDELS survey
VANDELS is a large ESO Public Spectroscopy Survey (McLure et al., 2018; Pentericci et al., 2018; Garilli et al., 2021) targeting the CDFS and UDS fields, and covering a total area of 0.2 deg2. The survey data were obtained using the Visible Multi-Object Spectrograph (VIMOS, Le Fèvre et al., 2004) on the ESO VLT. The final data release (DR4; Garilli et al., 2021) provides spectra for a sample of 2087 galaxies, the vast majority of which (87 per cent) are star-forming galaxies in the redshift range . However, in this study, we focus on the remaining 281 targets (13 per cent) selected as quiescent galaxies in the redshift range .
2.1 VANDELS sample selection
The VANDELS spectroscopic sample was originally drawn from a combination of four separate photometric catalogues. Two of these are the CANDELS GOODS South and UDS catalogues (Guo et al., 2013; Galametz et al., 2013), whilst the other two are custom ground-based catalogues (described in McLure et al. 2018), covering the wider VANDELS area outside of the CANDELS footprints.
The parent quiescent sample was selected from these photometric catalogues as follows. Objects were required to have H-band magnitudes of , corresponding to stellar masses of over the redshift range of we focus on in this work (approximately 98 per cent of the full VANDELS quiescent sample has ), as well as i-band magnitudes of . To separate star-forming and quiescent galaxies, rest-frame UVJ criteria were applied following Williams et al. (2009). These criteria result in a sample of 812 galaxies, which we refer to as the VANDELS photometric parent sample.
2.2 VANDELS spectroscopy
Here we briefly summarise the VANDELS spectroscopic observations, while referring the reader to Pentericci et al. (2018) for a full description. From the parent sample of 812 quiescent galaxies described in the previous section, 281 were randomly assigned slits and observed as part of the VANDELS survey. Objects were observed for 20, 40 or 80 hours depending on their i-band magnitudes. The observations were obtained using the MR grism, providing a median resolution of across a wavelength range from Å. The VANDELS team manually measured spectroscopic redshifts, assigning redshift quality flags according to Le Fèvre et al. (2013). In this paper we only use those galaxies with spectroscopic redshift flag 3 or 4, which has subsequently been shown to correspond to a per cent probability of being correct (Garilli et al., 2021).
| Component | Parameter | Symbol / Unit | Range | Prior | Hyperparameters |
| Global | Redshift | 0.015 | Gaussian | ||
| SFH | Stellar mass formed Metallicity Falling slope Rising slope Peak time | / Gyr | (1, 1013) (0.2, 2.5) (0.1, 103) (0.1, 103) (0.1, ) | log log log log uniform | |
| Dust | Attenuation at 5500 Å Deviation from Calzetti et al. (2000) slope Strength of 2175 Å bump | mag B | (0, 4) () (0, 5) | uniform Gaussian uniform | , |
| Calibration | Zeroth order First order Second order | (0.5, 1.5) () () | Gaussian Gaussian Gaussian | , , , | |
| Noise | White-noise scaling Correlated noise amplitude Correlation length | (0.1, 10) (0.0001, 1) (0.01, 1) | log log log |
3 Methodology and sample selection
The VANDELS observations described in Section 2 produce an initial sample of 269 quiescent galaxies with robust spectroscopic redshifts, of which 87 per cent have . In this section, we describe the selection of the final quiescent sample that we use for our analysis.
3.1 Spectro-photometric fitting
We use Bagpipes (Carnall et al., 2018) to simultaneously fit the available spectroscopic and photometric data for our initial sample of 269 quiescent galaxies. We incorporate several improvements to the model used to fit the VANDELS photometric catalogues in Hamadouche et al. (2022) (based on Carnall et al. 2019a), which we briefly describe below.
We use a double-power-law star-formation history model, employing the updated 2016 versions of the BC03 stellar population synthesis models (Bruzual & Charlot, 2003; Chevallard & Charlot, 2016). We also vary the stellar metallicity from using a logarithmic prior. We use the Salim et al. (2018) dust attenuation law, which parameterises the dust-curve shape through a power-law deviation, , from the Calzetti et al. (2000) law. Nebular continuum and emission lines are modelled using the Cloudy photoionization code (Ferland et al., 2017), using a method based on that of Byler et al. (2017). We assume a fixed ionization parameter of . Full details of the free parameters and priors used in our fitting are provided in Table 1.
We take into account systematic uncertainties in the observed spectra of our galaxies by applying additive noise and multiplicative calibration models (e.g., van der Wel et al. 2016; Cappellari 2017; Johnson et al. 2021). We follow the approach outlined in Section 4 of Carnall et al. (2019a), by fitting a second-order multiplicative Chebyshev polynomial to account for problems with flux calibration, and an additive Gaussian process model with an exponential squared kernel to model correlated additive noise between spectral pixels in our data.
3.2 A mass-complete sample
To ensure that our final sample is mass complete, we restrict the sample to and (see Carnall et al., 2019a). In addition, we require members of the sample to have , in order to remove green-valley galaxies. This has been shown to be broadly equivalent to a specific SFR cut of sSFR < 0.2/, where is the age of the Universe at the relevant redshift (Carnall et al., 2018). These criteria produce a sample of 139 quiescent galaxies.
To clean the quiescent sample of potential X-ray contaminants, we remove five objects with matches in either the Chandra Seven Mega-second catalogue (Luo et al., 2017) or the X-UDS catalogue (Kocevski et al., 2018) that cover the CDFS and UDS fields, respectively. All five galaxies with X-ray matches also display strong [O ii] emission in their rest-frame UV spectra. We also search for potential radio-loud AGN using the Very Large Array (VLA) 1.4 GHz data available for both fields (Simpson et al., 2006; Bonzini et al., 2013), finding one additional AGN candidate. This object was not removed from the quiescent sample because it does not display strong [O ii] emission.
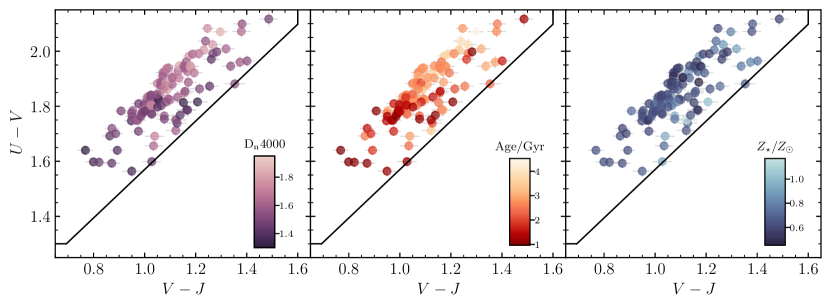
Finally, we remove one galaxy whose spectrum is highly contaminated (due to a nearby object), leaving a final, cleaned sample of 114 quiescent VANDELS galaxies. This final sample is shown on the UVJ plane in Fig. 1, colour-coded by mass-weighted age, Dn4000 and stellar metallicity.
3.3 Stacked spectra
In the sections of our analysis where we make use of stacked spectra, we use the following standard procedure to produce our stacks. We first de-redshift and then re-sample each individual spectrum onto a uniform 2.5 Å wavelength grid using the spectral re-sampling module SpectRes (Carnall, 2017). Prior to stacking, we normalise by the median flux across the wavelength range Å. The median flux across all spectra in each pixel is then calculated. Uncertainties in the stacked spectra are calculated using the standard error on the median.
For stacked spectra where we wish to show correlations with Dn4000, the spectrum is then normalised by the median flux in the blue continuum band of the Dn4000 index, such that the median flux density in the red continuum band corresponds to the Dn4000 index of the stacked spectrum. We calculate Dn4000 using the same prescription outlined in Section 3.4 of Hamadouche et al. (2022).
3.4 Size measurements
We use the Galfit (Peng et al., 2002) size measurements from Hamadouche et al. (2022) for 110/114 galaxies in the final sample. For the remaining galaxies we adopted an identical procedure to Hamadouche et al. (2022), using HST F160W images for the three galaxies within the CANDELS footprint and HST ACS F850LP imaging in CDFS for the single galaxy lying outside the CANDELS footprint.
4 Results
In this section, we present the results obtained from full-spectral fitting of our final quiescent galaxy sample.
4.1 Trends with rest-frame UVJ colour
In Fig. 1, we show the distribution of the final mass-complete sample of VANDELS quiescent galaxies (see Section 3.2) on the rest-frame UVJ diagram, coloured by mass-weighted age, Dn4000, and stellar metallicity. In the first panel, we see that the galaxies with redder U–V and V–J colours, also tend to have higher mass-weighted ages, consistent with recent literature results (e.g., Belli et al., 2019; Carnall et al., 2019a). In the next panel, the trend with Dn4000 is similar; lighter-coloured points indicate higher Dn4000 values, which is consistent with the trend seen in other samples at similar redshifts (e.g. Whitaker et al., 2013). The final panel of Fig. 1 shows the sample coloured by metallicity. There is no obvious trend between metallicity and UVJ colour. The individual metallicities we measure are however consistent with scattering around the median value of logZ determined from an optical+NIR stack at by Carnall et al. (2022b).
4.2 The relationship between stellar mass and age
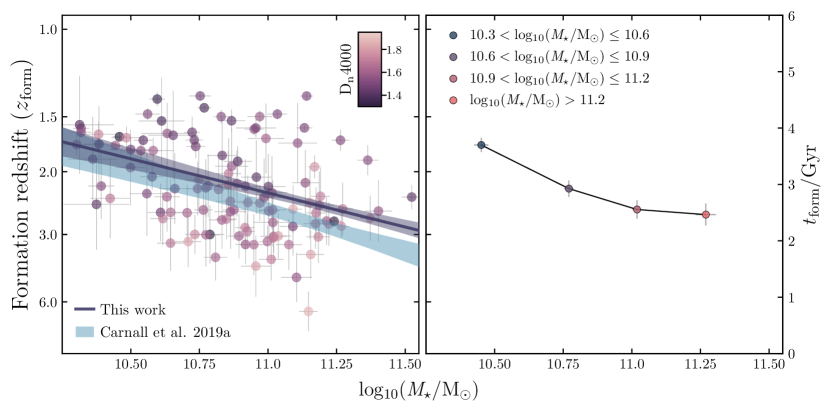
We present our results for the stellar-mass vs age relation in Fig. 2. We plot redshift of formation, , against stellar mass. The right-hand axis shows the corresponding formation time, , measured forwards from the Big Bang. In this paper, we take and to be the age of the Universe and redshift corresponding to the mass-weighted age of the galaxy. We see a clear negative correlation, albeit with considerable scatter. A trend is also visible between and Dn4000 in Fig. 2, with galaxies that have earlier formation times exhibiting higher values of Dn4000, as would be expected.
We fit a linear relationship between and logM, including an intrinsic scatter term, using the nested sampling Monte Carlo algorithm MLFriends (Buchner, 2016, 2019) using the UltraNest111https://johannesbuchner.github.io/UltraNest/ package (Buchner, 2021). We derive a best-fitting relation of:
| (1) |
We also find an intrinsic scatter of . We show the fit to our data in Fig. 2 (purple line) with the shaded region showing the 1 confidence interval.
We also show the result derived by Carnall et al. (2019a), using the VANDELS DR2 sample of 53 galaxies, which is a subset of our new 114-galaxy final VANDELS sample. The slope of our new relation is in good agreement with this previous result, however we recover a Myr offset towards younger ages.
To explore the origin of this offset, we re-fit our linear model to the sub-sample of 53 galaxies used by Carnall et al. (2019a), obtaining a result consistent with theirs. We therefore conclude that this offset is a result of our expanded statistical VANDELS DR4 sample, which contains more galaxies that have high stellar masses and lower formation redshifts with respect to the DR2 subset.
We also explore the median relationship between stellar mass and age in our sample by binning our galaxies into equal-width stellar-mass bins of 0.3 dex. This is shown in the right-hand panel of Fig. 2, where the relationship is clear up to stellar masses of . We discuss this relationship in more detail in Section 5.1, making comparisons to relevant literature, which are shown in Fig. 3.
4.3 The oldest galaxy at
From inspection of Fig. 2, it is clear that there is a single galaxy (ID: 111129) which falls significantly below the main stellar mass vs age distribution, with a formation time of Gyr (), and a quenching time ( is defined as the age of the Universe at which the normalised star-formation rate, nSFR, as defined in Carnall et al. 2018, first falls below 0.1) of = Gyr () after the Big Bang, respectively. Given recent reports, based on the first data from JWST, of the assembly of significant numbers of massive galaxies during the first billion years (e.g., Labbe et al. 2022), and their subsequent quenching during the second billion years (e.g., Carnall et al. 2022a), this is clearly an object of significant interest.
5 Discussion
In Section 4, we report the relationship between stellar mass and age from full spectral fitting of our mass-complete VANDELS quiescent sample. In this section, we discuss our results, focusing on relationships between age, UVJ position, Dn4000 and metallicity evident within our sample.
5.1 The formation times of quiescent galaxies
Over the past decade, extensive research has been conducted into the star-formation histories and ages of quiescent galaxies. This has revealed a sub-population of extremely old galaxies, which formed very early in cosmic history (e.g., Glazebrook et al. 2017; Schreiber et al. 2018; Valentino et al. 2020). These galaxies tend to have higher stellar masses and more compact morphologies than is typical for the quiescent population. In order to constrain the build-up of the quiescent population across cosmic time, and reveal the fate of these oldest, most extreme systems, detailed knowledge of the stellar mass vs stellar age relationship as a function of observed redshift is required. The stellar mass vs stellar age relation presented in Section 4.2 is based on the robust, mass-complete VANDELS spectroscopic sample. In this section, we compare these results with similar studies in the literature, across a broad redshift range.
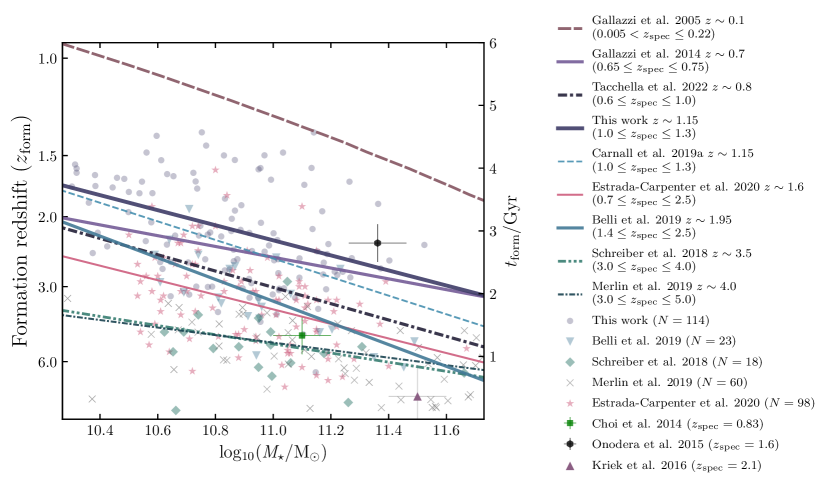
Our results are placed into the context of recent literature in Fig. 3, which shows results derived by Gallazzi et al. (2005, 2014); Choi et al. (2014); Onodera et al. (2015); Schreiber et al. (2018); Belli et al. (2019); Carnall et al. (2019a); Merlin et al. (2019); Estrada-Carpenter et al. (2020) and Tacchella et al. (2022), with the stellar mass vs age relations derived in various observed redshift ranges over-plotted. For several data-sets shown in the figure, no average relationship between stellar mass and age is calculated by the authors. In these cases, we perform a fit to the individual galaxy masses and ages, using the same method outlined in Section 4.2.
5.1.1 Slopes of the observed relationships
The slope of the stellar mass vs age relationship is intimately connected to the physics of quenching in massive galaxies. We derive a slope for the VANDELS DR4 sample of 1.20 Gyr per decade in mass. As can be seen from Fig. 3, this is in good agreement with the other literature relationships shown. At the highest redshifts, the sample of Schreiber et al. (2018) at displays a slope consistent with our result at to within 2. In the local Universe, the results of Gallazzi et al. (2005) also display a very similar slope. This suggests the slope of the stellar mass vs age relationship for massive quiescent galaxies remains broadly constant across cosmic history.
As can be seen from Fig. 3, the results of Belli et al. (2019), who study a sample of 23 massive quiescent galaxies at using data from the Keck-MOSFIRE spectrograph, suggest a steeper relation between stellar mass and age. We perform a fit to their galaxies on the stellar mass-age plane, finding a slope of 1.73 Gyr per decade in mass. Whilst this is a steeper slope than our result, it is not strongly in tension, owing to the relatively small samples involved.
In Carnall et al. (2019a) and Tacchella et al. (2022), the authors compare the observed stellar mass vs age relationship with the predictions of cosmological simulations. Carnall et al. (2019a) derive this relationship from snapshots of the 100 Mpc box runs of Simba (Davé et al., 2019) and IllustrisTNG (Nelson et al., 2018) at and . They find that these simulations predict slopes of 1.5 Gyr per decade in mass in the local Universe, but much shallower slopes at , with Tacchella et al. (2022) reporting similar findings for IllustrisTNG at .
Our results are consistent with the predicted slopes of 1.5 Gyr per decade in mass from these two simulations in the local Universe (). However, our results again suggest that simulations should seek to reproduce the same, steeper stellar mass vs age relationship for massive quiescent galaxies throughout cosmic history.
5.1.2 Normalisations of the observed relationships
The redshift evolution of the average age of quiescent galaxies at fixed stellar mass is influenced primarily by the quenching of new galaxies that join the quiescent population over time (e.g. McLeod et al. 2021). This effect is sometimes known as progenitor bias. The expected evolution of the relationships shown in Fig. 3 due to progenitor bias would be a steady increase in normalisation from high to low redshift. The rate of this decrease in formation redshift with decreasing observed redshift is also highly sensitive to the effects of merger and rejuvenation events.
Unfortunately, this idealised smooth upward evolution with decreasing redshift is not observed in Fig. 3. Whilst studies of galaxy samples at the highest observed redshifts typically return the highest formation redshifts, and the local-Universe study of Gallazzi et al. (2005) returns the lowest, there is confusion between these extremes. We report later average formation times than all studies targeting higher-redshift galaxy samples; however, both Gallazzi et al. (2014) and Tacchella et al. (2022) also report earlier average formation times than our study, despite analysing samples at lower observed redshifts (, as opposed to for our sample).
As has been discussed in several recent works (Tacchella et al., 2022; Carnall et al., 2022b), these differences are likely the result of methodological differences between studies. The two most important of these are different definitions of age (mass-weighted vs light-weighted), and differences between parametric and non-parametric SFH models, the latter of which typically return older stellar ages (Carnall et al., 2019b; Leja et al., 2019a; Leja et al., 2019b). For this reason, a clear understanding of the redshift evolution of the normalisation of this relationship requires a study applying the same methodology to observed samples at a wide range of redshifts.
5.1.3 Number density of the oldest galaxies at
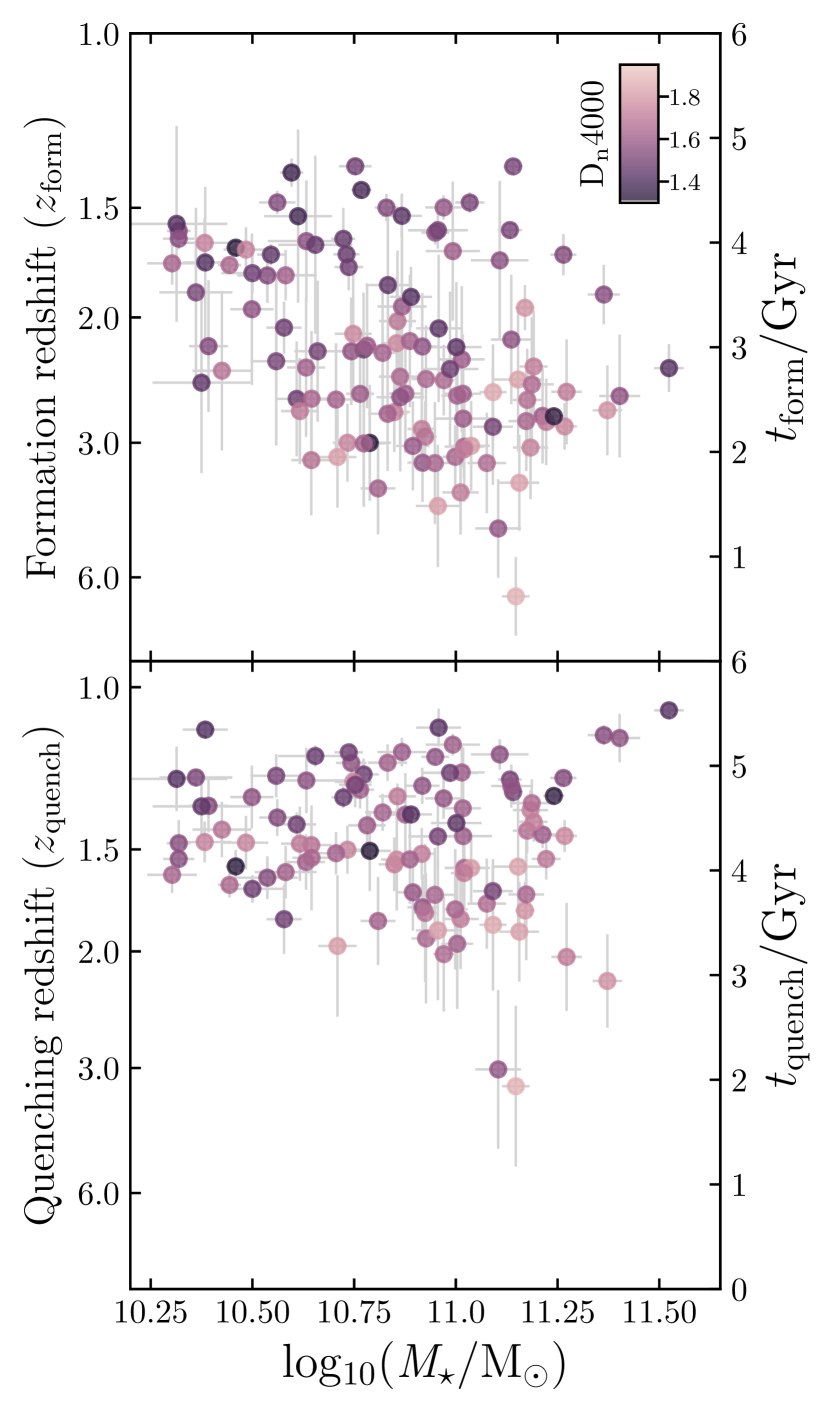
Fig. 4 shows the formation and quenching redshifts of our VANDELS quiescent sample versus stellar mass, in the top and bottom panels, respectively. A significant number of galaxies have formation redshifts of , all of which have stellar masses of . Only one galaxy has a formation redshift of (see Section 4.3).
Only two galaxies in our sample have quenching redshifts > 3. These objects are of particular interest, given that current simulations seem to under-predict the numbers of galaxies that quenched at these very early times (see Schreiber et al., 2018; Cecchi et al., 2019; Tacchella et al., 2022), possibly due to an additional mechanism capable of causing a rapid early shutdown of star formation, not yet included in simulations. We calculate the number density of galaxies in our VANDELS sample that have , recovering a value of (with Poisson uncertainties calculated using the confidence intervals presented in Gehrels, 1986). This is consistent with the results of Schreiber et al. (2018), who calculate a number density for quiescent galaxies observed at of . This preliminary agreement is encouraging, though our sample of such old quiescent galaxies is very small. Our result is consistent with neither rejuvenation or mergers having a significant impact on this population from . For example, if we had found no quiescent galaxies with in our sample, this would suggest that the majority of quiescent galaxies experience mergers and/or rejuvenation by . However, much larger samples will be necessary to conduct detailed comparisons of this nature.
5.2 The relationship between colour and age
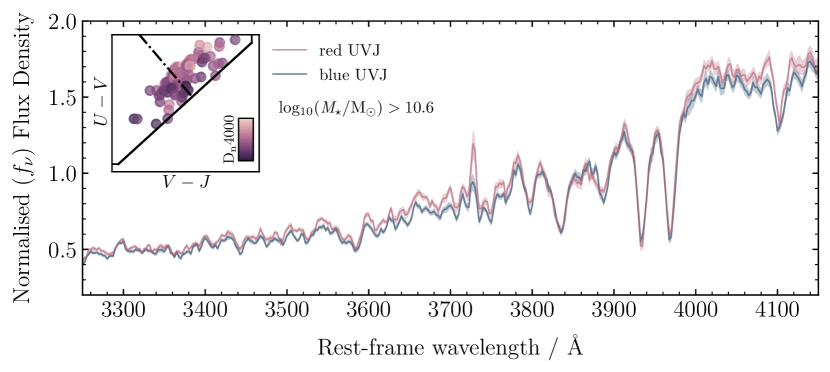
Next we consider the relationship between galaxy stellar age and position on the UVJ diagram, performing a stacking analysis of our sample using two bins in rest-frame colour. Following the approach of Whitaker et al. (2013), we divide the sample into two bins on the UVJ diagram, separated using the criteria: {ceqn}
| (2) |
as illustrated in the inset panel of Fig. 5 by the dot-dashed line. In order to minimise the impact of the correlation between stellar mass and age, we additionally restrict both UVJ bins to only include galaxies with . Adopting these criteria produces bins containing similar numbers of objects and comparable median stellar masses; and for the blue and red UVJ bins, respectively.
| UVJ position | N | Dn4000stack | Dn4000med | age / Gyr |
| Blue UVJ | 45 | |||
| Red UVJ | 47 |
In the main panel of Fig. 5 we show stacked spectra constructed from the objects in each UVJ bin and in Table 2 we present Dn4000 values calculated from the stacked spectra, together with the median Dn4000 values and stellar ages of the objects in each bin. It is clear from these results that galaxies within the red UVJ bin display larger Dn4000 values and older stellar ages than their counterparts within the blue UVJ bin. This is consistent with the expected correlation between age and UVJ colour (e.g., Whitaker et al., 2013; Belli et al., 2019), and with the trends observed in the centre panel UVJ diagram in Fig. 1, which is colour-coded by mass-weighted age from the Bagpipes fits. This stacking experiment independently confirms and quantifies the age-colour trend, given the offset in median Dn4000 values calculated for the red and blue UVJ colour bins. We note that Whitaker et al. (2013) find ages of 0.9 Gyr and 1.6 Gyr for their blue and red UVJ sub-samples, based on stacked grism spectra of quiescent galaxies at . Within the large uncertainties, this difference of Gyr is fully consistent with the difference of Gyr we find from our analysis.
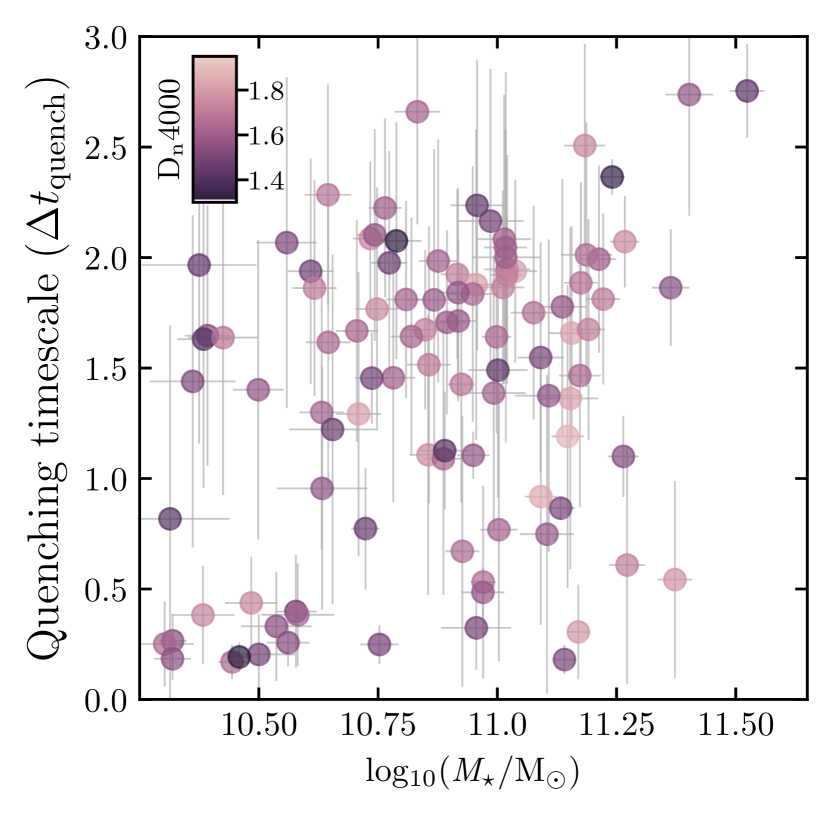
5.3 Quenching timescales
As discussed in the introduction, recent studies of the star-formation histories of quiescent galaxies point to the existence of multiple quenching channels (e.g., Belli et al., 2019; Carnall et al., 2019a; Tacchella et al., 2022). In general, the star-formation histories we derive for the VANDELS quiescent sample are consistent with this picture, displaying a range of formation and quenching times. However, to investigate this issue in more detail it is interesting to define a quenching timescale parameter: . In this work, is defined as the age of the Universe at which the normalised star-formation rate (nSFR; see Carnall et al. 2018) falls below 0.1, corresponding to the time after the Big Bang at which a galaxy is labelled as quiescent by our selection criteria. Therefore, the quenching timescale is naturally defined as:
| (3) |
In Fig. 6, we plot quenching timescale versus stellar mass for the VANDELS quiescent galaxies. It is clear that within our sample there is not a significant correlation between quenching timescale and stellar mass, with some of the highest mass galaxies having quenching timescales of Gyr, while others quench in significantly less than 1 Gyr. The mean quenching timescale for our full sample is Gyr.
Although the large scatter observed within our VANDELS sample in Fig. 6 may be a result of intrinsic galaxy-to-galaxy variations, it is still important to note the fact that properties such as star-formation histories, ages and quenching times can be affected by the fitting method (see e.g. Pforr et al., 2012; Carnall et al., 2019b; Leja et al., 2019a).
Throughout this paper we have used a double-power law parametric SFH, which is more flexible than other parametric SFHs (due to it allowing independent rising and falling phases) and is also a better estimator of stellar masses and ages (Carnall et al., 2018). Although parametric SFHs (such as the double-power law) appear to describe the majority of simulated galaxy populations well, they are not without fault; for example, parametric SFHs fail to model sharp transitions in SFR as accurately as non-parametric SFHs (Leja et al., 2019a).
For non-parametric models, SFR and ages have been shown to be more dependent on the priors used, than e.g. stellar masses (Leja et al., 2019a), however, the errors on these parameters are larger and thus more realistic than the smaller errors produced by parametric SFHs. In Fig. 6, the quenching timescales of our galaxies appear to be well-constrained, however these error bars may not be truly representative of the uncertainty on this parameter due to these SFH modelling effects. In future work, we will extend our methodology to extract quenching timescales from quiescent galaxy samples using non-parametric SFHs, in order to explore the effects of different approaches to modelling star-formation histories. This will allow for a more quantitative understanding of the mechanisms by which these galaxies have quenched, and give further insight into their evolution since quenching.
6 Conclusions
In this paper, we have explored the relationships between stellar mass, age, star-formation history and quenching timescales for a robust spectroscopic sample of quiescent galaxies at . Our main results and conclusions can be summarised as follows:
-
1.
We derive significantly improved constraints on the relationship between stellar population age and stellar mass for quiescent galaxies at . From our full VANDELS sample we derive an age-mass relation which has a slope of Gyr per decade in stellar mass.
-
2.
Comparing to previous studies in the literature, we find good agreement on the slope of the age-mass relation for quiescent galaxies from the local Universe out to . The observed slope is in good agreement with the prediction from simulations at , but significantly steeper than simulations predict at .
-
3.
The results of our spectro-photometric fitting predict that the number density of already quenched galaxies at with stellar masses is . Although subject to large uncertainties due to small-number statistics, this estimate is in good agreement with the latest measurements at . The implication is that rejuvenation or merger events are not playing a major role in modulating the number density of the oldest massive quiescent galaxies within the redshift interval , although they cannot be ruled out entirely.
-
4.
We confirm previously reported results that quiescent galaxies with redder UVJ colours are systematically older than their bluer counterparts, finding an off-set of Gyr in the median age of mass-matched samples.
-
5.
The VANDELS sample of quiescent galaxies displays a wide range of formation and quenching redshifts. We find that the mean quenching timescale is Gyr, where . The oldest galaxy within the VANDELS sample (ID: 111129) has and .
Future studies using data from surveys such as PRIMER (Dunlop et al., 2021) and the JWST Advanced Deep Extragalactic Survey (JADES), as well as near-infrared ground-based spectroscopy from the MOONS spectrograph on the VLT will provide higher SNR and larger samples of quiescent galaxies out to . Combining these data with more sophisticated galaxy fitting methods (e.g. non-parametric SFHs) will enable a better understanding of quiescent galaxy properties and quenching mechanisms out to higher redshift.
Acknowledgements
The authors thank the referee for useful comments which helped improve the quality of this manuscript. M. L. Hamadouche, R. Begley, and C. T. Donnan acknowledge the support of the UK Science and Technology Facilities Council. A. C. Carnall acknowledges the support of the Leverhulme Trust. F. Cullen and T. M. Stanton acknowledge support from a UKRI Frontier Research Guarantee Grant (PI Cullen; grant reference EP/X021025/1). Based on observations made with ESO Telescopes at the La Silla or Paranal Observatories under programme ID(s) 194.A-2003(E-Q) (The VANDELS ESO Public Spectroscopic Survey). Based on data products from observations made with ESO Telescopes at the La Silla Paranal Observatory under ESO programme ID 179.A-2005 and on data products produced by TERAPIX and the Cambridge Astronomy Survey Unit on behalf of the UltraVISTA consortium. This research made use of Astropy, a community-developed core Python package for Astronomy (Astropy Collaboration et al., 2013, 2018).
Data Availability
The VANDELS survey is a European Southern Observatory Public Spectroscopic Survey. The full spectroscopic dataset, together with the complementary photometric information and derived quantities are available from http://vandels.inaf.it, as well as from the ESO archive https://www.eso.org/qi/.
References
- Abraham et al. (2004) Abraham R. G., et al., 2004, AJ, 127, 2455
- Akins et al. (2022) Akins H. B., Narayanan D., Whitaker K. E., Davé R., Lower S., Bezanson R., Feldmann R., Kriek M., 2022, ApJ, 929, 94
- Asplund et al. (2009) Asplund M., Grevesse N., Sauval A. J., Scott P., 2009, ARA&A, 47, 481
- Astropy Collaboration et al. (2013) Astropy Collaboration et al., 2013, A&A, 558, A33
- Astropy Collaboration et al. (2018) Astropy Collaboration et al., 2018, AJ, 156, 123
- Baldry et al. (2004) Baldry I. K., Glazebrook K., Brinkmann J., Ivezić Ž., Lupton R. H., Nichol R. C., Szalay A. S., 2004, ApJ, 600, 681
- Baldry et al. (2012) Baldry I. K., et al., 2012, MNRAS, 421, 621
- Balogh et al. (1999) Balogh M. L., Morris S. L., Yee H. K. C., Carlberg R. G., Ellingson E., 1999, ApJ, 527, 54
- Belli et al. (2019) Belli S., Newman A. B., Ellis R. S., 2019, The Astrophysical Journal, 874, 17
- Beverage et al. (2021) Beverage A. G., Kriek M., Conroy C., Bezanson R., Franx M., van der Wel A., 2021, arXiv e-prints, p. arXiv:2105.12750
- Bonzini et al. (2013) Bonzini M., Padovani P., Mainieri V., Kellermann K. I., Miller N., Rosati P., Tozzi P., Vattakunnel S., 2013, MNRAS, 436, 3759
- Brinchmann et al. (2004) Brinchmann J., Charlot S., White S. D. M., Tremonti C., Kauffmann G., Heckman T., Brinkmann J., 2004, MNRAS, 351, 1151
- Bruzual (1983) Bruzual G., 1983, ApJ, 273, 105
- Bruzual & Charlot (2003) Bruzual G., Charlot S., 2003, MNRAS, 344, 1000
- Buchner (2016) Buchner J., 2016, Statistics and Computing, 26, 383
- Buchner (2019) Buchner J., 2019, PASP, 131, 108005
- Buchner (2021) Buchner J., 2021, The Journal of Open Source Software, 6, 3001
- Byler et al. (2017) Byler N., Dalcanton J. J., Conroy C., Johnson B. D., 2017, ApJ, 840, 44
- Calzetti et al. (2000) Calzetti D., Armus L., Bohlin R. C., Kinney A. L., Koornneef J., Storchi-Bergmann T., 2000, ApJ, 533, 682
- Cappellari (2017) Cappellari M., 2017, MNRAS, 466, 798
- Carnall (2017) Carnall A. C., 2017, arXiv e-prints, p. arXiv:1705.05165
- Carnall et al. (2018) Carnall A. C., McLure R. J., Dunlop J. S., Davé R., 2018, MNRAS, 480, 4379
- Carnall et al. (2019a) Carnall A. C., et al., 2019a, MNRAS, 490, 417
- Carnall et al. (2019b) Carnall A. C., Leja J., Johnson B. D., McLure R. J., Dunlop J. S., Conroy C., 2019b, The Astrophysical Journal, 873, 44
- Carnall et al. (2020) Carnall A. C., et al., 2020, MNRAS, 496, 695
- Carnall et al. (2022a) Carnall A. C., et al., 2022a, arXiv e-prints, p. arXiv:2208.00986
- Carnall et al. (2022b) Carnall A. C., et al., 2022b, ApJ, 929, 131
- Cecchi et al. (2019) Cecchi R., Bolzonella M., Cimatti A., Girelli G., 2019, ApJ, 880, L14
- Chevallard & Charlot (2016) Chevallard J., Charlot S., 2016, MNRAS, 462, 1415
- Choi et al. (2014) Choi J., Conroy C., Moustakas J., Graves G. J., Holden B. P., Brodwin M., Brown M. J. I., van Dokkum P. G., 2014, ApJ, 792, 95
- Choi et al. (2018) Choi E., Somerville R. S., Ostriker J. P., Naab T., Hirschmann M., 2018, The Astrophysical Journal, 866, 91
- Cimatti et al. (2002) Cimatti A., et al., 2002, A&A, 381, L68
- Cimatti et al. (2012) Cimatti A., Nipoti C., Cassata P., 2012, MNRAS, 422, L62
- Conroy et al. (2014) Conroy C., Graves G. J., van Dokkum P. G., 2014, ApJ, 780, 33
- Cowie et al. (1996) Cowie L. L., Songaila A., Hu E. M., Cohen J. G., 1996, AJ, 112, 839
- Croton et al. (2006) Croton D. J., et al., 2006, MNRAS, 365, 11
- Davé et al. (2017) Davé R., Rafieferantsoa M. H., Thompson R. J., 2017, MNRAS, 471, 1671
- Davé et al. (2019) Davé R., Anglés-Alcázar D., Narayanan D., Li Q., Rafieferantsoa M. H., Appleby S., 2019, MNRAS, 486, 2827
- Davidzon et al. (2017) Davidzon I., et al., 2017, A&A, 605, A70
- Dekel & Birnboim (2006) Dekel A., Birnboim Y., 2006, MNRAS, 368, 2
- Dunlop et al. (2021) Dunlop J. S., et al., 2021, PRIMER: Public Release IMaging for Extragalactic Research, JWST Proposal. Cycle 1
- Estrada-Carpenter et al. (2020) Estrada-Carpenter V., et al., 2020, ApJ, 898, 171
- Ferland et al. (2017) Ferland G. J., et al., 2017, Rev. Mex. Astron. Astrofis., 53, 385
- Fontana et al. (2006) Fontana A., et al., 2006, A&A, 459, 745
- Fontanot et al. (2009) Fontanot F., De Lucia G., Monaco P., Somerville R. S., Santini P., 2009, MNRAS, 397, 1776
- Gabor & Davé (2012) Gabor J. M., Davé R., 2012, MNRAS, 427, 1816
- Gabor et al. (2011) Gabor J. M., Davé R., Oppenheimer B. D., Finlator K., 2011, MNRAS, 417, 2676
- Galametz et al. (2013) Galametz A., et al., 2013, ApJS, 206, 10
- Gallazzi et al. (2005) Gallazzi A., Charlot S., Brinchmann J., White S. D. M., Tremonti C. A., 2005, MNRAS, 362, 41
- Gallazzi et al. (2014) Gallazzi A., Bell E. F., Zibetti S., Brinchmann J., Kelson D. D., 2014, ApJ, 788, 72
- Garilli et al. (2021) Garilli B., et al., 2021, A&A, 647, A150
- Gehrels (1986) Gehrels N., 1986, ApJ, 303, 336
- Glazebrook et al. (2017) Glazebrook K., et al., 2017, Nature, 544, 71
- Guo et al. (2013) Guo Y., et al., 2013, ApJS, 207, 24
- Hamadouche et al. (2022) Hamadouche M. L., et al., 2022, MNRAS, 512, 1262
- Hopkins et al. (2010) Hopkins P. F., et al., 2010, ApJ, 724, 915
- Johnson et al. (2021) Johnson B. D., Leja J., Conroy C., Speagle J. S., 2021, ApJS, 254, 22
- Kauffmann et al. (2003) Kauffmann G., et al., 2003, MNRAS, 341, 33
- Kocevski et al. (2018) Kocevski D. D., et al., 2018, ApJS, 236, 48
- Kriek et al. (2019) Kriek M., et al., 2019, ApJ, 880, L31
- Kroupa (2001) Kroupa P., 2001, MNRAS, 322, 231
- Labbe et al. (2022) Labbe I., et al., 2022, arXiv e-prints, p. arXiv:2207.12446
- Le Fèvre et al. (2004) Le Fèvre O., et al., 2004, A&A, 428, 1043
- Le Fèvre et al. (2013) Le Fèvre O., et al., 2013, A&A, 559, A14
- Leja et al. (2019a) Leja J., Carnall A. C., Johnson B. D., Conroy C., Speagle J. S., 2019a, ApJ, 876, 3
- Leja et al. (2019b) Leja J., et al., 2019b, ApJ, 877, 140
- Luo et al. (2017) Luo B., et al., 2017, VizieR Online Data Catalog, p. J/ApJS/228/2
- McLeod et al. (2021) McLeod D. J., McLure R. J., Dunlop J. S., Cullen F., Carnall A. C., Duncan K., 2021, MNRAS, 503, 4413
- McLure et al. (2013) McLure R. J., et al., 2013, MNRAS, 428, 1088
- McLure et al. (2018) McLure R. J., et al., 2018, MNRAS, 479, 25
- Merlin et al. (2019) Merlin E., et al., 2019, MNRAS, 490, 3309
- Moresco et al. (2010) Moresco M., et al., 2010, A&A, 524, A67
- Moresco et al. (2011) Moresco M., Jimenez R., Cimatti A., Pozzetti L., 2011, J. Cosmology Astropart. Phys., 2011, 045
- Moresco et al. (2016) Moresco M., et al., 2016, J. Cosmology Astropart. Phys., 2016, 014
- Mowla et al. (2019) Mowla L. A., et al., 2019, ApJ, 880, 57
- Muzzin et al. (2013) Muzzin A., et al., 2013, ApJS, 206, 8
- Nelson et al. (2018) Nelson D., et al., 2018, MNRAS, 475, 624
- Onodera et al. (2015) Onodera M., et al., 2015, ApJ, 808, 161
- Ownsworth et al. (2014) Ownsworth J. R., Conselice C. J., Mortlock A., Hartley W. G., Almaini O., Duncan K., Mundy C. J., 2014, MNRAS, 445, 2198
- Pacifici et al. (2016) Pacifici C., et al., 2016, ApJ, 832, 79
- Peng et al. (2002) Peng C. Y., Ho L. C., Impey C. D., Rix H.-W., 2002, AJ, 124, 266
- Peng et al. (2010) Peng Y.-j., et al., 2010, ApJ, 721, 193
- Peng et al. (2015) Peng Y., Maiolino R., Cochrane R., 2015, Nature, 521, 192
- Pentericci et al. (2018) Pentericci L., et al., 2018, A&A, 616, A174
- Pforr et al. (2012) Pforr J., Maraston C., Tonini C., 2012, MNRAS, 422, 3285
- Salim et al. (2018) Salim S., Boquien M., Lee J. C., 2018, The Astrophysical Journal, 859, 11
- Schawinski et al. (2014) Schawinski K., et al., 2014, MNRAS, 440, 889
- Schreiber et al. (2016) Schreiber C., Elbaz D., Pannella M., Ciesla L., Wang T., Koekemoer A., Rafelski M., Daddi E., 2016, A&A, 589, A35
- Schreiber et al. (2018) Schreiber C., et al., 2018, A&A, 618, A85
- Shen et al. (2003) Shen S., Mo H. J., White S. D. M., Blanton M. R., Kauffmann G., Voges W., Brinkmann J., Csabai I., 2003, MNRAS, 343, 978
- Simpson et al. (2006) Simpson C., et al., 2006, MNRAS, 372, 741
- Somerville & Davé (2015) Somerville R. S., Davé R., 2015, Annual Review of Astronomy and Astrophysics, 53, 51–113
- Strateva et al. (2001) Strateva I., et al., 2001, AJ, 122, 1861
- Tacchella et al. (2022) Tacchella S., et al., 2022, ApJ, 926, 134
- Thomas et al. (2005a) Thomas D., Maraston C., Bender R., 2005a, Highlights of Astronomy, 13, 189
- Thomas et al. (2005b) Thomas D., Maraston C., Bender R., Mendes de Oliveira C., 2005b, ApJ, 621, 673
- Trujillo et al. (2006) Trujillo I., et al., 2006, ApJ, 650, 18
- Trujillo et al. (2011) Trujillo I., Ferreras I., de La Rosa I. G., 2011, MNRAS, 415, 3903
- Trussler et al. (2020) Trussler J., Maiolino R., Maraston C., Peng Y., Thomas D., Goddard D., Lian J., 2020, MNRAS, 491, 5406
- Valentino et al. (2020) Valentino F., et al., 2020, ApJ, 889, 93
- Whitaker et al. (2013) Whitaker K. E., et al., 2013, ApJ, 770, L39
- Wild et al. (2016) Wild V., Almaini O., Dunlop J., Simpson C., Rowlands K., Bowler R., Maltby D., McLure R., 2016, MNRAS, 463, 832
- Williams et al. (2009) Williams R. J., Quadri R. F., Franx M., van Dokkum P., Labbé I., 2009, ApJ, 691, 1879
- Wu et al. (2018) Wu P.-F., et al., 2018, ApJ, 868, 37
- Wu et al. (2021) Wu P.-F., et al., 2021, arXiv e-prints, p. arXiv:2108.10455
- York et al. (2000) York D. G., et al., 2000, The Astronomical Journal, 120, 1579–1587
- van der Wel et al. (2014) van der Wel A., et al., 2014, ApJ, 788, 28
- van der Wel et al. (2016) van der Wel A., et al., 2016, ApJS, 223, 29