[b]Issaku Kanamori
Thermodynamics with Möbius domain wall fermions near physical point II
Abstract
We report on our finite temperature 2+1 flavor lattice QCD simulation to study the thermodynamic properties of QCD near the (pseudo) critical point employing and . The simulation points are chosen along the lines of constant physics. The quark mass for Möbius domain-wall fermion are tuned by taking into account the residual mass either by fine-tuning the input quark masses or by post-process using reweighting. In this talk, we focus on simulation details and present some preliminary results.
1 Introduction
Since the first physical point, continuum limit study was reported on the finite temperature phase transition of 2+1 flavor QCD being a crossover [1], lots of studies have provided consistent results to their result. However, recent 3 flavor studies suggest that one should reexamine the result with different lattice fermions and/or finer lattices [2, 3, 4, 5, 6, 7]. The common wisdom of the 3 flavor system was: the transition is first order near the chiral limit and becomes crossover as the fermion mass becomes larger, is now under serious investigation. As the finer lattice simulation becomes available, the critical mass between the first order and the crossover region becomes smaller. It also changes with the lattice fermion formulation used in the simulation. It is almost obvious that controlling lattice artifact in this study is quite a challenging task. It motivates us to reexamine the quark mass dependence of the finite temperature transition depicted in the famous Columbia plot.
In this study, we use Möbius domain-wall fermion that has almost exact chiral symmetry and investigate the light quark mass dependence at the physical strange quark mass. As the spontaneously breaking of the chiral symmetry characterizes the finite temperature transition, using a fermion formulation with chiral symmetry is very important, especially the system is close to the chiral limit. We use the same fermion formulation used in our zero temperature simulation, of which details are summarized in the supplemental material in [8]. We choose the simulation points along the line of constant physics (LCP) at which the light quark mass is fixed in the physical unit. The temperature is controlled through changing the lattice spacing . To this end, we utilize the zero temperature simulation results to obtain the gauge coupling dependence of the lattice spacing and the renormalization factor of the quark mass. The details of the -dependence and the choice of lattice parameters are presented in this conference by one of the authors (Y.A.) [9].
In this article, we first discuss at which quark mass we should simulate and the effect of the additive residual mass correction. The input quark mass must be tuned to correct the residual mass effect for the coarse lattice we use , but the mass reweighting also works for the fine lattice with . We present out preliminary results on chiral condensate and disconnected susceptibilities as well as the topological susceptibility.
2 Simulation Setup
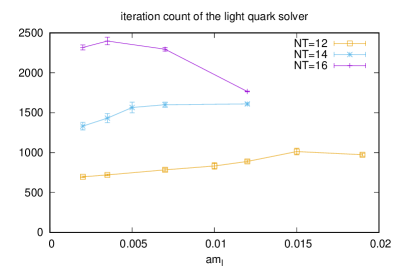
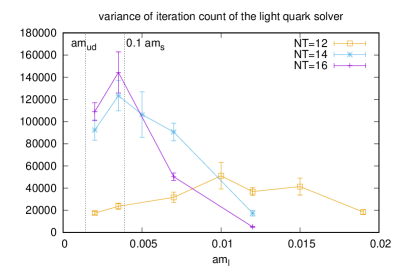
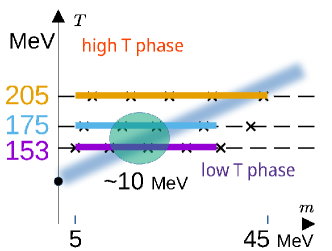
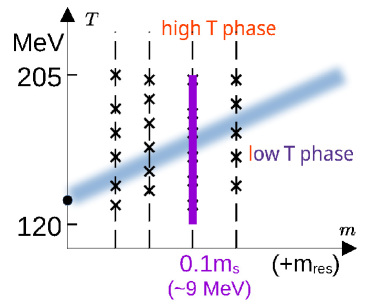
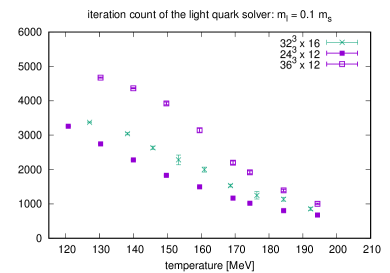
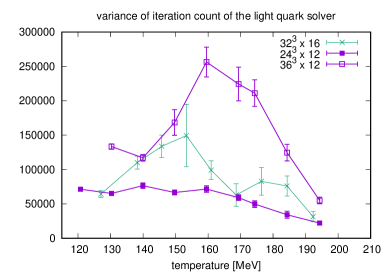
We first scanned - parameter space along fixed temperature lines to find the parameter region to prepare LCP configurations. We measured several gluonic observables: plaquette, topological charge, Polyakov loop and their susceptibilities. We also monitored the iteration counts and the variance of the light quark solver during the molecular dynamics of HMC. The iteration count is not a physical observable but it is sensitive to the spectrum of the Dirac operator. It turned out that the variance of the iteration counts exhibits most clearly the sign of (pseudo) phase transition (Fig. 1). The figure shows that the peak of the variance is around MeV. From this information we can sketch the phase diagram in - plain as the left panel of Fig. 2 (the figure assumes crossover for ). Since the quark mass explicitly breaks the chiral symmetry, we expect that the heavier light quark pushes the upper limit of the temperature of broken phase as in the figure. We start with the light quark mass ( MeV) before studying the physical point and the chiral limit in the end. To cover the (pseudo) phase transition in this range of light quark mass, we set the temperature in MeV MeV (right panel of Fig. 2).
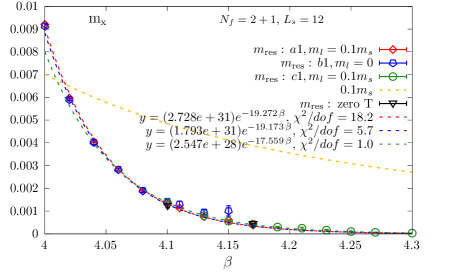
Since we use a finite 5th-dimensional extension and finite lattice spacing in the simulations, the chiral symmetry is broken and the quark mass receives an additive correction. The size of the correction is
| (1) |
where is the pseudo scalar density at the mid point in the 5th extent. As emphasized in the talk by Y.A., it is crucially important to take into account the effect of in the LCP simulation [9]. Figure 3 shows the -dependence of measured by using several parameter sets. The plot shows almost no dependence on the input bare quark mass or the lattice volume and data points are well described by an exponential ansatz in . For the coarse lattice (), which uses , the size of is compatible or even larger than plotted in yellow dashed line. We therefore need to shift the input mass to to cancel the effect of . The fine lattice () uses larger , , and the correction is small compared to the target light quark mass . We therefore use mass reweighting on the configurations generated without correcting effect. To determine the value of , we combine the measured values and results from a fit with exponential ansatz. An exponential fit by using data has a good value so we determine the for from the fit result, which has smoother -dependence than the measured value itself (the bottom fit in the Figure). On the other hand, exponential fits with data have rather poor value so we use the measured values to determined the for
3 Results
We use the following three different lattices with .
-
•
lattice, 9 points with 10k – 19k trajectories.
-
•
lattice, 8 points with 4k – 12k trajectories.
-
•
lattice, 9 points with 4k – 6k trajectories after mass reweighting (k trajectories before reweighting).
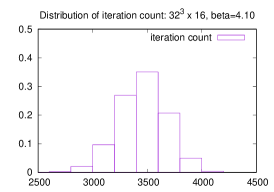
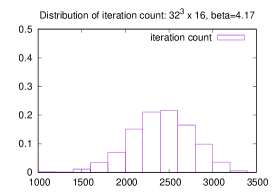
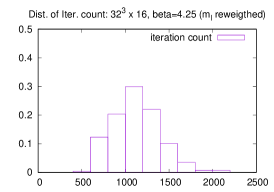
Figure 4 shows iterations counts of CG solver for the light quark during HMC and the variance, which are not physical observables but sensitive to the low mode of the Dirac spectrum. Especially from the larger volume () data, we observe that our choice of simulation points covers the (pseudo) transition point, of which temperature is – MeV. The finer lattice data () are mass reweighted from the configurations generated without corrections. The distributions of the iteration counts before and after reweighting are collected in Fig. 5. The plots show that the distribution after the reweighting has a large overlap with the original distribution, which justifies to use the reweighing method for this quantity111Post conference analysis with more statistics up to 20k trajectories gives smoother distribution than the figure.. We have also observed similar overlap for other quantities we present here.
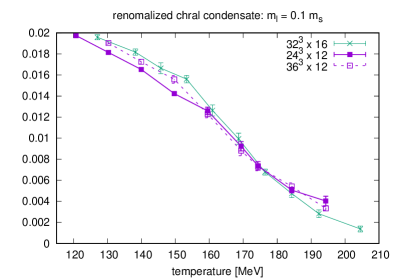
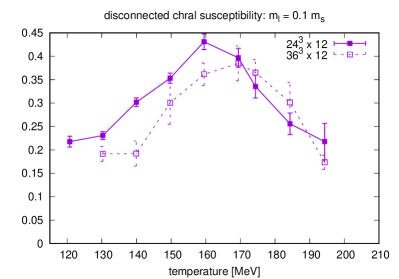
Figure 6 is the renormalized chiral condensate and disconnected susceptibility. Although the mass reweighting is not applied to the finer lattice data, the values from two different lattice spacings, and , have almost the same value of chiral condensate. This implies the divergent part of the condensate is properly subtracted by using strange quark condensate as , and the multiplicative normalization ( GeV) is properly applied. The peak of the susceptibility is located in 150–170 MeV, but changes as the volume becomes larger. We need a larger volume data to give a conclusive statement about the transition temperature.
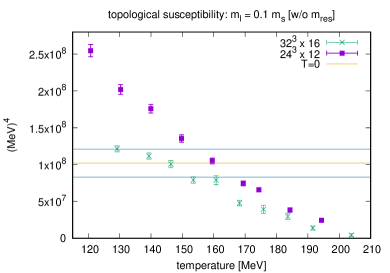
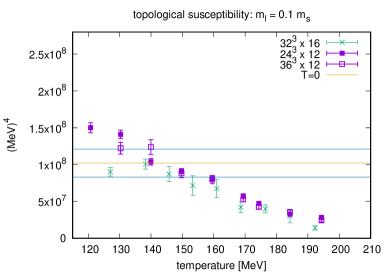
The topological susceptibility is rather sensitive to the quark mass. Therefore, without the correction we cannot obtain the correct value. The left panel of Fig. 7 demonstrates this fact. The plotted data with and differ only in the lattice spacing but corrections are not applied to both data series. One would naively expect that they give almost the same value, however, as the coarse lattice has much larger the results significantly deviate from each other. Furthermore, the value of the topological susceptibility with overshoots the value at [10] in the low temperature. After the effect of are corrected (right panel of Fig. 7), we observe a good agreement of and data in MeV. In the lower temperature, we still observe an overshoots of data. We interpret this is due to a remnant lattice artifact, because the lattice cut off of the lowest temperature simulation with is about 1.5 GeV, which is rather small.


4 Summary and Outlooks
We tuned the simulation parameters of 2+1 flavor configurations with Möbius domain-wall fermions to study the (pseudo) critical transition at finite temperature. The simulation points are chosen along the line of constant physics, where the light quark mass is set to in the physical unit. The quark mass is tuned by taking into account the effect of the residual mass. For the finer lattice with , we used quark mass reweighting to correct the residual mass effect (except for the chiral condensate of which reweighted results are to come, as additional measurements with the new valance quark mass are needed). The preliminary results confirms the correctness of the parameters and imply the transition temperature is in 150–170 MeV.
We are now adding more statistics and larger volume data, which are crucial to give a conclusive statements on the transition temperature from our data. The data with lighter quark mass at physical point are also to come.
Acknowledgments
I.K. is supported by JSPS KAKENHI (JP20K03961) and, the MEXT as ‘Program for Promoting Researches on the Supercomputer Fugaku’ (Simulation for basic science: from fundamental laws of particles to creation of nuclei) and ‘Priority Issue 9 to be Tackled by Using the Post-K Computer’ (Elucidation of The Fundamental Laws and Evolution of the Universe), and Joint Institute for Computational Fundamental Science (JICFuS). The simulations are performed on supercomputer “Fugaku” at RIKEN Center for Computational Science (HPCI project hp200130, hp210165, hp220174, and Usability Research ra000001), Oakforest-PACS at the Joint Center for Advanced High Performance Computing (JCAHPC) of the Universities of Tokyo and Tsukuba (hp200130), Polarie and Grand Chariot at Hokkaido University (hp200130). We used code set Grid [11, 12, 13] for configuration generations, a developing branch of Hadrons [14] and Bridge++ [15, 16] for measurements.
References
- [1] Y. Aoki, G. Endrodi, Z. Fodor, S.D. Katz and K.K. Szabo, The Order of the quantum chromodynamics transition predicted by the standard model of particle physics, Nature 443 (2006) 675 [hep-lat/0611014].
- [2] X.-Y. Jin, Y. Kuramashi, Y. Nakamura, S. Takeda and A. Ukawa, Critical endpoint of the finite temperature phase transition for three flavor QCD, Phys. Rev. D 91 (2015) 014508 [1411.7461].
- [3] X.-Y. Jin, Y. Kuramashi, Y. Nakamura, S. Takeda and A. Ukawa, Critical point phase transition for finite temperature 3-flavor QCD with non-perturbatively O() improved Wilson fermions at , Phys. Rev. D 96 (2017) 034523 [1706.01178].
- [4] A. Bazavov, H.T. Ding, P. Hegde, F. Karsch, E. Laermann, S. Mukherjee et al., Chiral phase structure of three flavor QCD at vanishing baryon number density, Phys. Rev. D 95 (2017) 074505 [1701.03548].
- [5] Y. Kuramashi, Y. Nakamura, H. Ohno and S. Takeda, Nature of the phase transition for finite temperature QCD with nonperturbatively O() improved Wilson fermions at , Phys. Rev. D 101 (2020) 054509 [2001.04398].
- [6] L. Dini, P. Hegde, F. Karsch, A. Lahiri, C. Schmidt and S. Sharma, Chiral phase transition in three-flavor QCD from lattice QCD, Phys. Rev. D 105 (2022) 034510 [2111.12599].
- [7] F. Cuteri, O. Philipsen and A. Sciarra, On the order of the QCD chiral phase transition for different numbers of quark flavours, JHEP 11 (2021) 141 [2107.12739].
- [8] JLQCD collaboration, Form factors of B→ and a determination of |Vub| with Möbius domain-wall fermions, Phys. Rev. D 106 (2022) 054502 [2203.04938].
- [9] Y. Aoki, S. Aoki, F. Hidenori, K.I. Hashimoto, Shoji, T. Kaneko and Y. Nakamura, Yoshifumi an Zhang, “Thermodynamics with Möbius domain wall fermions near physical point (I).” A talk at this conference.
- [10] JLQCD collaboration, Topological susceptibility of QCD with dynamical Möbius domain-wall fermions, PTEP 2018 (2018) 043B07 [1705.10906].
- [11] “Grid.” https://github.com/paboyle/Grid.
- [12] P. Boyle, A. Yamaguchi, G. Cossu and A. Portelli, Grid: A next generation data parallel C++ QCD library, 1512.03487.
- [13] N. Meyer, P. Georg, S. Solbrig and T. Wettig, Grid on QPACE 4, PoS LATTICE2021 (2022) 068 [2112.01852].
- [14] A. Portelli, N. Asmussen, P. Boyle, F. Erben, V. Gülpers, R. Hodgson et al., aportelli/hadrons: Hadrons v1.2, Nov., 2020. 10.5281/zenodo.4293902.
- [15] “Lattice QCD code Bridge++.” https://bridge.kek.jp/Lattice-code/index_e.html.
- [16] S. Ueda, S. Aoki, T. Aoyama, K. Kanaya, H. Matsufuru, S. Motoki et al., Development of an object oriented lattice QCD code ’Bridge++’, J. Phys. Conf. Ser. 523 (2014) 012046.