Monitoring Gender Gaps via LinkedIn Advertising Estimates: the case study of Italy
Abstract.
Women remain underrepresented in the labour market. Although significant advancements are being made to increase female participation in the workforce, the gender gap is still far from being bridged. We contribute to the growing literature on gender inequalities in the labour market, evaluating the potential of the LinkedIn estimates to monitor the evolution of the gender gaps sustainably, complementing the official data sources. In particular, assessing the labour market patterns at a subnational level in Italy. Our findings show that the LinkedIn estimates accurately capture the gender disparities in Italy regarding sociodemographic attributes such as gender, age, geographic location, seniority, and industry category. At the same time, we assess data biases such as the digitalisation gap, which impacts the representativity of the workforce in an imbalanced manner, confirming that women are under-represented in Southern Italy. Additionally to confirming the gender disparities to the official census, LinkedIn estimates are a valuable tool to provide dynamic insights; we showed an immigration flow of highly skilled women, predominantly from the South. Digital surveillance of gender inequalities with detailed and timely data is particularly significant to enable policymakers to tailor impactful campaigns.
1. Introduction
Despite being a fierce debate for decades, gender discrimination in the workplace remains an active issue. In fact, “Gender Equality” and “Decent work and economic growth” are among the top Sustainable Development Goals (SDGs) (Nations, 2020) of the United Nations agenda for 2030. Gender inequalities occur across various domains including education (Ellis et al., 2016), life expectancy (Pinho-Gomes et al., 2022) , personality and interests (Eagly et al., 2019), family life (Stojmenovska and England, 2021), and careers (Cheryan et al., 2013; Benson et al., 2021; Azmat et al., 2021). Hence, bridging the gender gap in the workplace is far from a trivial topic, as it entails significant welfare and cultural changes. Gender inequality in the workplace may take various forms ranging from unequal pay and promotion disparity (Benson et al., 2021; Azmat et al., 2021) to incidents of sexual harassment (Damous and Guillopé, 2021; Harnois and Bastos, 2018; Folke et al., 2020; Shaw et al., 2018). Those often occur in a nuanced way rendering the phenomenon difficult to thoroughly quantify.
Each year, the World Economic Forum publishes the Global Gender Gap Report (WEF, 2022) containing the status and the steps forward to close the gender gap in 146 countries. Some problems emphasized are the need for more women in jobs related to STEM disciplines (science, technology, engineering and mathematics), the absence of leadership positions and the need for full and effective female participation in the labour force. The gender-disaggregated data around these inequalities are often lacking, which hinders welfare policies due to the incomplete view of the problem. Recently, scientists employed data from social media (SM) and crowdsourcing platforms to provide a complementary view of society and overcome the known time and cost limitations of official surveys (Kashyap et al., 2020; Kashyap and Verkroost, 2021; Haranko et al., 2018; Verkroost et al., 2020; Tamime and Weber, 2022). The potentials of SM advertising platform estimates have been validated on a wide range of topics, including the assessment of wealth (Fatehkia et al., 2020), the rural-urban divide (Rama et al., 2020), and migration flows (Zagheni et al., 2017). Particularly for sparse populations, social media offer a valid alternative to track important socioeconomic statistics (Mejova et al., 2018; Fatehkia et al., 2018; Rama et al., 2020; Fatehkia et al., 2020).
In this study, we examine the benefits and validity of the LinkedIn Advertising (ads) platform as a potential data source for the labour market digital “census”. LinkedIn is the world’s largest social networking platform targeted at professionals with a user base of over 900 million spanning over 200 countries (membership members) (Pressroom, 2021). Although the advertising platform was initially designed to estimate audience reach, scientists have leveraged its potential to study gender disparities (WEF, 2022; Verkroost et al., 2020; Kashyap and Verkroost, 2021). At the same time, establishing a coherent metric to assess the gender gap systematically is a field of active research (Cascella et al., 2022).
To face the employment gender disparities using LinkedIn data from a sub-national perspective, we focused on Italy as a case study. Its geographical divide is an unsolved theme with a broad literature. The challenge is understanding whether gender gaps in the workplace, known from traditional survey data (Martino et al., 2020; Cascella et al., 2022; di Bella et al., 2019; Greselin and Jedrzejczak, 2020; Campa et al., 2011), are reflected in the data obtained through the LinkedIn social media platform. Italy is the third largest economy in the European Union (EUROSTAT, 2021), and although in the last years, significant progress has been made in reducing gender inequalities in the labour market, they persist in being tightly woven into the social fabric. Here, we examine those from a sub-national point of view, relating LinkedIn’s estimates to measures provided by traditional data obtained through the Italian national institute of statistics (ISTAT) (ISTAT, 2022) and the European Statistical Office (EUROSTAT) (EUROSTAT, 2022). Local perspective is particularly significant in Italy since, by Constitution, regional administrations can act directly to mitigate the problem. Finally, the need for a wide Italian presence on LinkedIn is met: it is the third European country by the number of members, with about 17 million users (Pressroom, 2021).
We aim to address the following core research questions:
RQ1 How reliable are LinkedIn advertising audience estimates, especially concerning a country’s labour force and the official
demographic figures?
RQ2 How can we enrich the current view of the gender gap in Italy as seen through LinkedIn?
RQ3 Can we predict the employment gender gap leveraging LinkedIn estimates and sociodemographic
data?
To answer the aforementioned questions, we estimated the Gender Gap Index (GGI) (Verkroost et al., 2020) on the numeric estimates of the potential audiences obtained via the platform’s API. We show that LinkedIn’s population estimates correspond to the official Italian labour force census. The gender distribution in each economic sector on LinkedIn positively correlates with the official data. Nonetheless, we observe that most sectors are under-represented, except those related to Technology, which is coherent with the highly skilled workforce the platform addresses to (Graph, 2021).
LinkedIn has its inherent population biases with gender and age ranges not uniformly represented (Kashyap and Verkroost, 2021). However, the data obtained by the platform are representative of the labour force in general, with the increased gender gap observed in the Southern part of Italy (Cascella et al., 2022) and the more senior roles having higher male estimates in leadership positions (WEF, 2022). This aligns with broader known sociodemographic inequalities in Italy (Buzzacchi et al., 2021; Martino et al., 2020). The digitalisation rate reported by ISTAT impacts the representativeness of the workforce in an imbalanced manner, with women needing to be more represented in Southern Italy. This is a crucial point to consider when leveraging this data source to assess the labour force gender gap in countries with a low digitalisation rate. Finally, we noticed that highly skilled employees (graduated or doctorate level) are more likely to move to other countries, undermining the development of the labour force, particularly in the most vulnerable areas (e.g. the South). The LinkedIn audience reflects this: the platform is more gender-balanced in the regions with more high-skilled female immigrants from abroad (e.g. North-Center). We contribute to the current literature by showing the importance of the LinkedIn advertising Platform in accurate monitoring the labour patterns within countries, focusing on Italy as a case study.
2. Related work
Traditionally, the gender divide is monitored with data provided by Census. The Global Gender Gap Index (GGGI) was theorised in 2006 (Ricardo Hausmann, 2006) and since then is employed to compare the different aspects of the gender gap (economy, health, education, politics) worldwide. In 2013, the Gender Equality Index was computed for the European Union, commissioned by the European Institute for Gender Equality (EIGE) (Janneke Plantenga and Remery, 2010). Those indices allow us to keep track of the gendered disparity and compare data worldwide and even across years; however, the sub-national disparities were not assessed.
Digital Gender Gaps.
Over the last few years, scientists have relied increasingly on digital data estimates and SM advertising platform estimates to address complex demographic and social research questions. Early on, Garcia et al. (Garcia et al., 2018) suggested a global measure for gender disparity leveraging on Facebook ad estimates for 217 countries, while more recently, Fatehkia et al. (Fatehkia et al., 2018) investigated the digital gender gap for 193 countries, confirming known trends obtained via traditional sources. Combining Facebook with Google advertising data, Kashyap et al. (Kashyap et al., 2020) assessed the worldwide digital divide. The high resolution and richness of SM advertising estimates allow for sub-national focus (Mejova et al., 2018), but also for evaluating gender inequalities concerning specific interests such as the interest in the STEM disciplines (Tamime and Weber, 2022; Vieira and Vasconcelos, 2021).
Labour Market Gender Gaps.
The LinkedIn advertising platform offers critical demographic estimates facilitating the study of various topics relating to labour dynamics (Verkroost et al., 2020; Kashyap and Verkroost, 2021). LinkedIn estimates were informative to understand the variations of gender gaps in IT industries both globally (Verkroost et al., 2020; Kashyap and Verkroost, 2021) and sub-nationally (Haranko et al., 2018). The LinkedIn Gender Gap Index (GGI) was initially proposed in (Kashyap and Verkroost, 2021; Verkroost et al., 2020) as the ratio between the estimated number of women with specific attributes over the estimated number of men with the same attribute, consisting the equivalent of GGGI for LinkedIn ad estimates. Since then, varied metrics have been proposed, but the GGGI was shown to be the most accurate to measure the gender gap (Cascella et al., 2022).
Although this study is close to the approach and methods presented in Verkroost et al. (Verkroost et al., 2020), and Kashyap et al. (Kashyap and Verkroost, 2021), the metric we employ to assess the labour gender gap slightly differs from the ones proposed in the present literature (Verkroost et al., 2020; Kashyap and Verkroost, 2021; WEF, 2022). In particular, to capture the interplay of the local dynamics in Italy, we dive into the Italian regions’ labour market data, normalise the estimates according to the official population census data, and we do not a priori assume the female gender to be under-represented. The GGGI benchmarks the current state and evolution of women’s situation in four key dimensions (Economic Participation and Opportunity, Educational Attainment, Health and Survival, and Political Empowerment); here we explore disparities for both genders.
| Age | F LinkedIn | M LinkedIn | F Census | M Census | F LinkedIn / F Census | M LinkedIn / M Census |
|---|---|---|---|---|---|---|
| 18-24 | 1.300.000 | 1.200.000 | 1.963.785 | 2.136.690 | 66,20% | 56,16% |
| 25-34 | 4.600.000 | 4.700.000 | 3.048.664 | 3.195.963 | 150,89% | 147,06% |
| 35-54 | 1.700.000 | 2.100.000 | 8.371.114 | 8.279.348 | 20,31% | 25,36% |
| 55+ | 180.000 | 380.000 | 12.371.753 | 10.396.360 | 1,45% | 3,66% |
3. Data Collection
For this study, we obtained data from the European and Italian official data statistics offices, i.e. EUROSTAT and ISTAT, respectively, and from the LinkedIn ads platform (Solutions, 2016).
Official Census and Survey Data.
Italy can be divided into five main geographical zones. ISTAT computes the rate of regular Internet users through a survey to measure how many people have daily access to the Internet, regardless of the device. Based on this yearly report, there is a uniform digital gender gap throughout Italy (on average, six percentage points difference between the rate of regular male Internet users from the female rate); in the North, the average rate of regular Internet users is 78% for men and 72% for women; in the South, the average is 71% for men and 65% for women.
-
•
North-East: Emilia-Romagna, Friuli-Venezia Giulia, Trentino Alto Adige, and Veneto
-
•
North-West: Liguria, Lombardia, Piemonte, and Valle d’Aosta
-
•
Center: Lazio, Marche, Toscana, and Umbria
-
•
South: Abruzzo, Campania, Molise, Puglia, Basilicata, and Calabria
-
•
Islands: Sardegna and Sicilia
These five zones are merged into two main groups: North-Center (North-East, North-West, Center) and South (South and Islands), composed of regions quite similar in socioeconomic status. The locations for the data collection are chosen taking the European official territorial units for statistics (NUTS from the French acronym) of level 2 for 2021 provided by EUROSTAT (EUROSTAT, 2018).
LinkedIn ad Audience Estimates.
Focusing on the Italian context, we collected aggregated counts of LinkedIn users, querying the ad campaign manager via the official application programming interface (API)111We were based on the open source code by Lucio Melito https://worldbank.github.io/connectivity_mapping/intro.html. Audiences are targeted based on geographic location, demographic criteria such as gender or age group, and job criteria such as company industry and job seniority. Here, we target the locations to a sub-national level to capture the local nuances and trends that are otherwise difficult to obtain. Overall, we gathered data for 20 regions in Italy from July to November 2022. In detail, we queried for the following characteristics (attributes).
-
•
Location. According to LinkedIn official documentation (Kimura and Kearns, 2020), this attribute can be based on the location a member has included in their profile or their IP address. We collected the Italian data referring to the NUTS2, i.e. the basic regions for applying regional policies. For Italy, they are 20 regions.
-
•
Gender. On the LinkedIn ads platform, gender is binary: Male, Female. In our study, hence we follow this binary approach. Among the know limitations of our work, we acknowledge the binary choice of gender and the overarching assumption that all LinkedIn users are active in the labour market.
-
•
Age range. Age is provided in the following ranges 18-24, 25-34, 35-54, 55+. The Age range a member belongs to, is inferred on their first graduation date, but also the Years of Experience can be used as a proxy as to what is reported by the official documentation (Kimura and Kearns, 2020).
-
•
Job seniority. It “describes the rank and influence of a member’s current role in their organization” (as stated in (Kimura and Kearns, 2020)). We target all seniority levels Unpaid, Training, Entry, Senior, Manager, Director, VP, CxO, Partner, and Owner.
- •
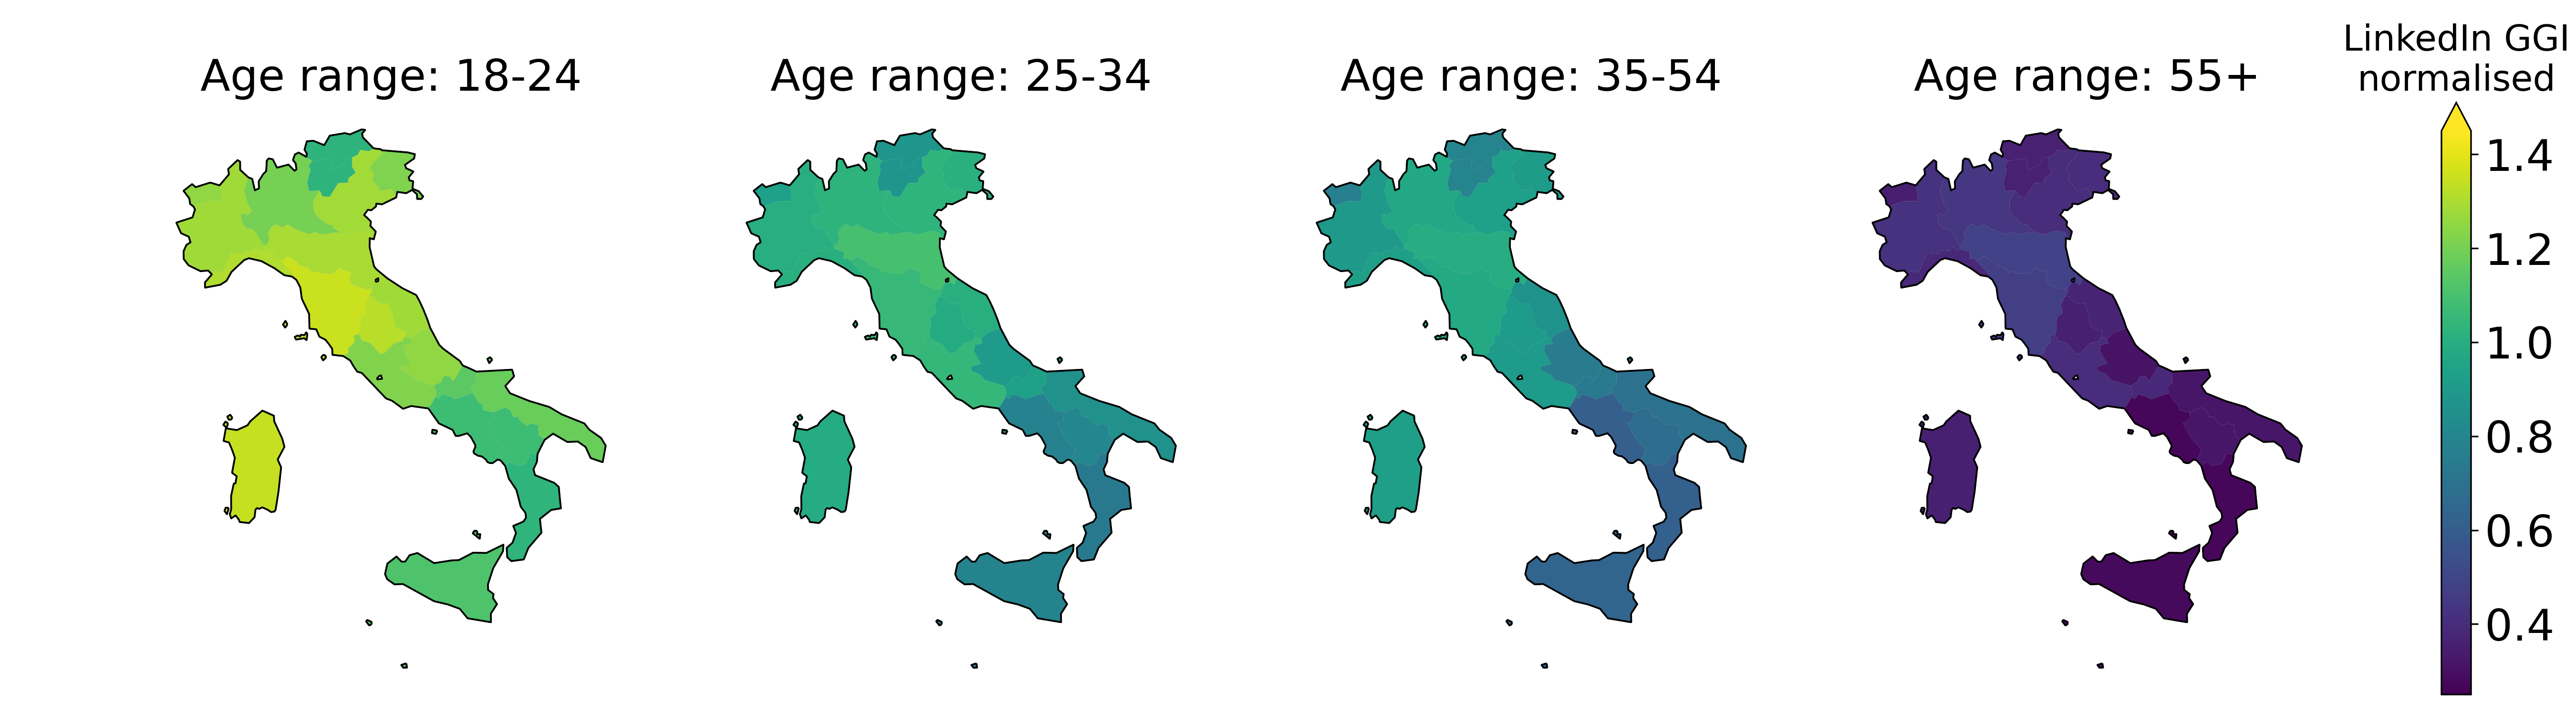
Table 1 summarises the data collection performed per age group and gender compared to the official population census (ISTAT). Further, we gathered the estimates by gender and age range per region. Figure 1 depicts the estimates obtained per Italian region.
3.1. Methods
Data Preparation.
Overall, for all the locations (20 regions in Italy), we queried by gender and age to obtain a “LinkedIn Census”. At national level, keeping the location fixed (Italy), we targeted the audiences by gender, age-range and job seniority to get seniority data, while to collect estimates per economic sector, we queried by gender, age-range and company industry. We obtained estimates for all queries (19 regions) but one; the number of women on LinkedIn older than 55 years old located in Valle d’Aosta (the smallest Italian region). In that case, the estimated number of members was less than 300 users, and hence, the API returns 0. To overcome this issue, we employed the “query exclusion” method proposed by Rama et al. (Rama et al., 2020). We obtained an estimate of over 200 members, still sufficient to ensure privacy. To apply the “query exclusion” approach, we chose several “reference cites” opting for large cities with a sufficient amount of users for the majority of the categories we are interested in. We decided to refrain from collecting data at the provincial level to avoid privacy concerns. For the same reason for queries with more specific targeted attributes (besides location, gender, and age range), we opted to obtain the data at a national level to avoid possible identification of users.
Gender Gap Metrics.
We measured the gender divide in the LinkedIn community adapting the Global Gender Gap Index (GGGI) (WEF, 2022) proposed by Verkroost et al. (Verkroost et al., 2020). First, we computed the gender gap index of the LinkedIn population normalising ads estimates by ISTAT population data:
| (1) |
where, F LinkedIn and M LinkedIn are the estimated number of women and men, respectively, in LinkedIn, while F Census and M Census are the estimated number of women and men, respectively reported by ISTAT.
For each attribute, we adapt the above equation normalising by the LinkedIn population,
| (2) |
where: F LinkedIn (Attr) refers to the estimated number of women in LinkedIn that have the specific attribute, and M LinkedIn (Attr) to the number of men, respectively. Contrary to the mainstream approach (WEF, 2022), where an over-estimation of women is not considered (GGI index greater than one), we opted for the whole range of values, also evidencing when men are the minority group. To measure the gender gap in employment status and economic section we defined the following ratios:
| (3) |
where % F Working (resp. % M Working) is the percentage of working women (resp. men). Similarly, for each economic sector, we estimated the index as the gender ratio between the EUROSTAT percentage of employed women and men in each Nomenclature of Economic Activities (NACE):
| (4) |
where % F NACE Working (resp. % M NACE Working) indicates the percentage of women (resp. men) working in a particular economic sector. All the indices introduced in this section were computed by age range and location to unveil discrepancies that may occur based on those factors.
Prediction of Gender Gap.
Finally, we assessed the digital estimates’ prediction capabilities of the gender gap. We built a multilinear regression model that leverages LinkedIn estimates and sociodemographic data to predict the gender gap in the workforce (Eq. 3). We evaluated the model performance employing the Mean Absolute Error () and the -adjusted () accounting for the number of predictors. To reduce the dimensionality, we implemented a step-wise feature selection. The set of features considered included the age range and several socio-economic regional indicators, such as the percentage of Gross domestic product (GDP) per capita in Purchasing Power Standards (PPS) expressed to the European Union average (equal 100), the gender ratio of digitalization level, the gender ratio of the percentage of young NEET (Not [engaged] in Education, Employment or Training) and a welfare policy marker: the percentage of children under two years old going to the kindergarten. We applied also 5-fold cross validation method to check overfitting and the Isolation Forest Algorithm (with contamination 0.05) to detect outliers before the model training.
4. Results & Discussion
4.1. Socioeconomic & Demographic Representativity.
This work explores an increasingly popular data source in digital Demography, the LinkedIn Advertising estimates. These data provide cost-effective insights into gender inequalities in the labour market in a detailed and timely manner, essential to crafting impactful policies, especially when the official data are sparse or hard to obtain. Our findings confirm the reliability and potential of the LinkedIn advertising audience estimates to the labour force dynamics recorded from the official sources.
Demographic Representativity.
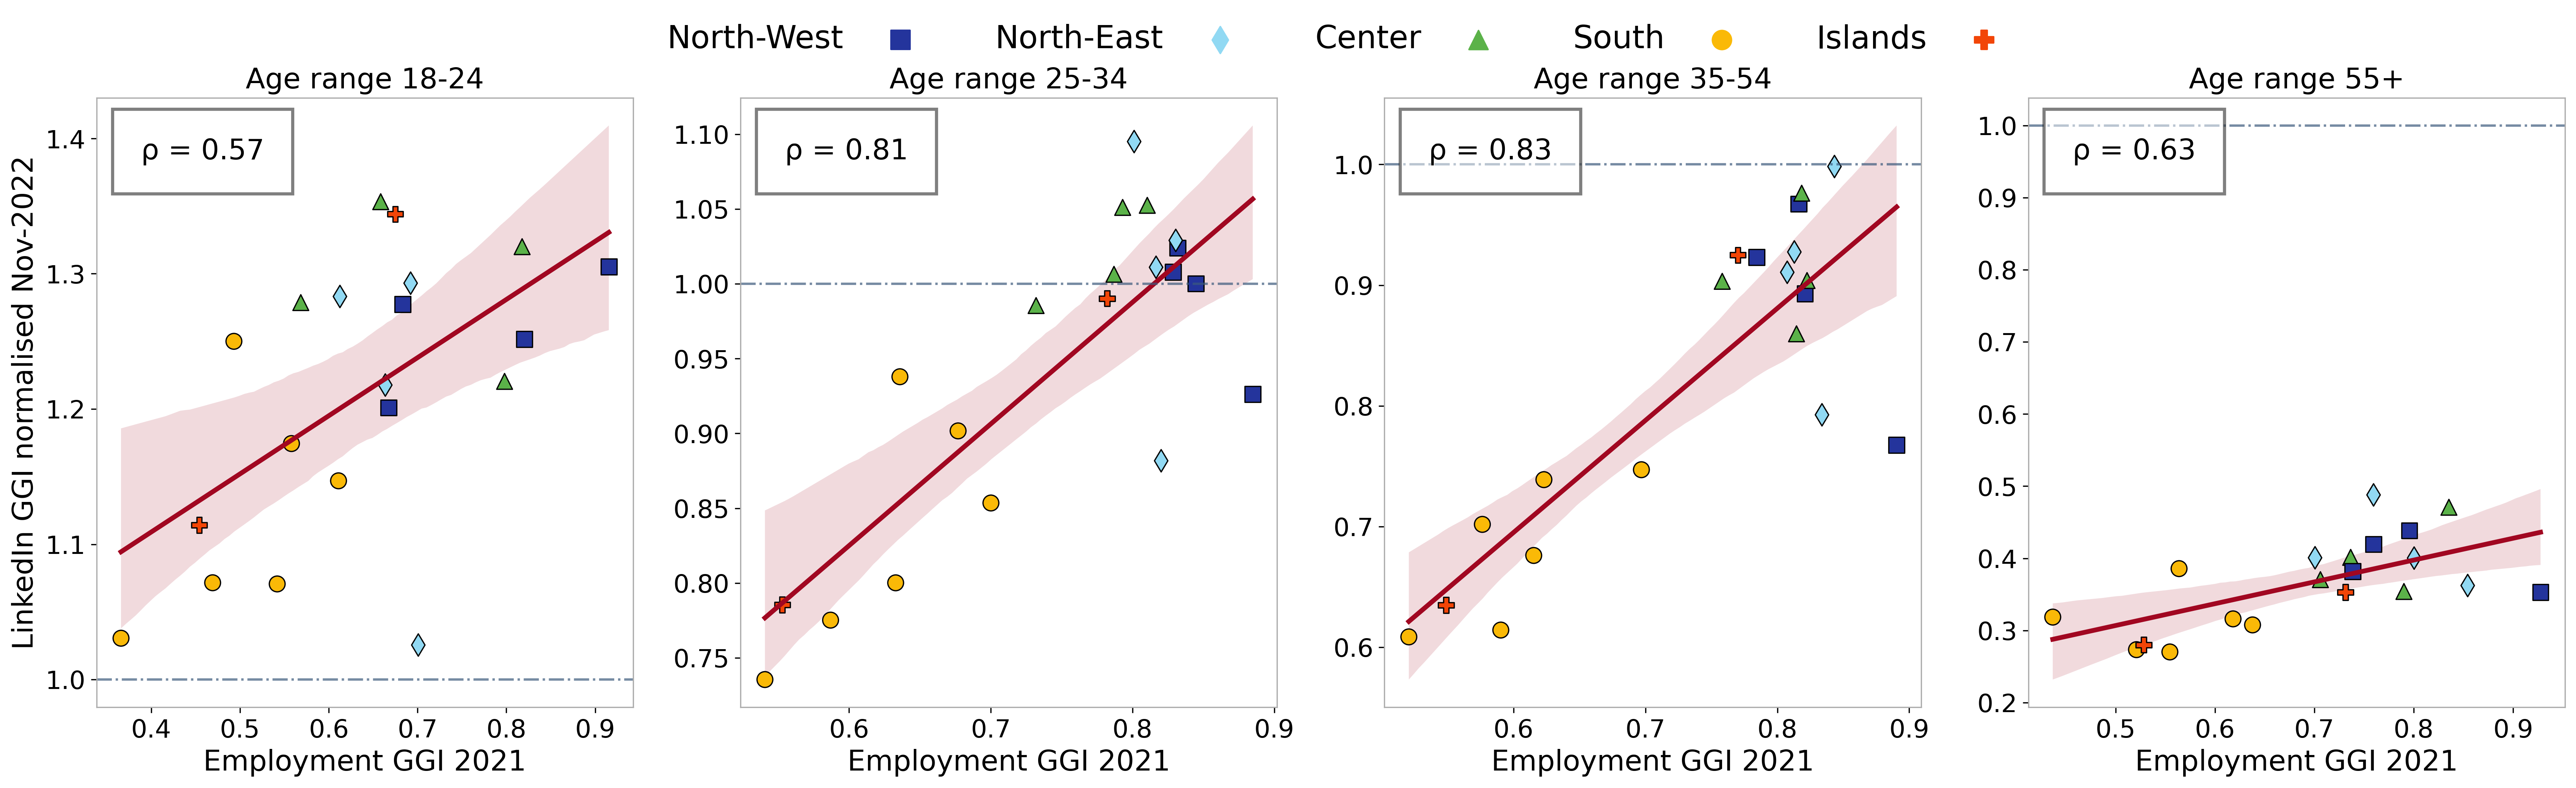
For a digital data source to be reliably employed in policy and decision-making, assessing its demographic representativity is fundamental. Comparing the LinkedIn GGI normalised index (Eq. 1) with the Employment GGI index (Eq. 3) per gender and age range (aligning the age groups are reported in Table A1), we noticed a strong positive correlation for all the age groups indicating that the obtained estimates were demographically representative of the Italian workforce (Table A5, row 2).
Figure 2 depicts the relationship of the gender gap observed in LinkedIn to the official ISTAT employment data. Women are vastly over-represented in the younger age group (LinkedIn GGI normalised above the equity line), while they are under-represented in the elder age group (LinkedIn GGI normalised under the equity line). For the ISTAT data, none of the age ranges reaches the equity line (value one on the x-axis). The percentages of women working are lower than those of men. In Figure 2, we also noticed that the Italian regional divide is captured: the Southern regions lack a workforce with respect to the Northern ones (southern regions are grouped in the lower part of the regression line). This aligns with the general employment trends in Italy (Cascella et al., 2022; ISTAT, 2020).
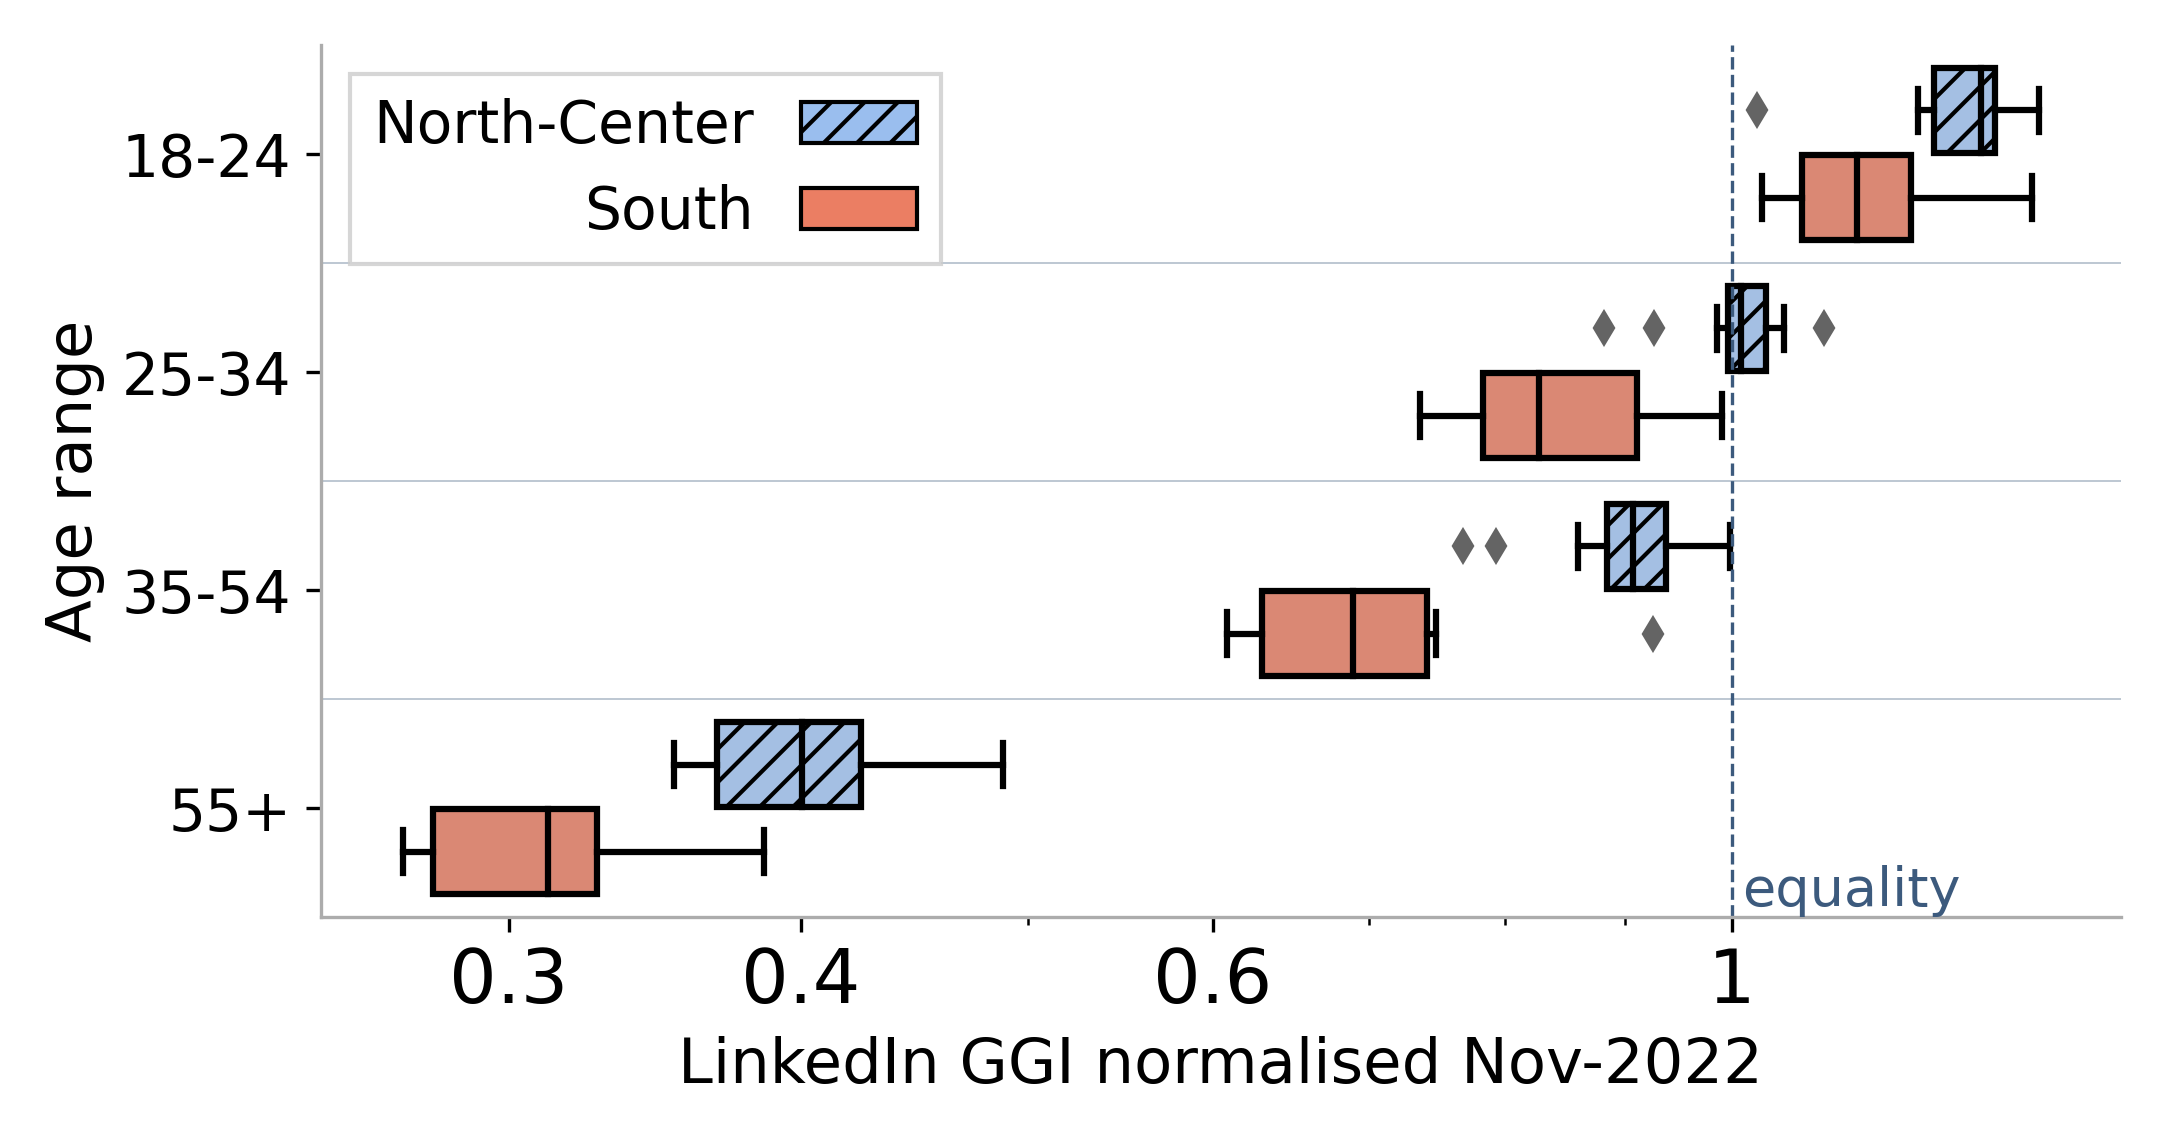
Focusing on the intrinsic biases of the medium, we observed more male than female users on LinkedIn (Figure 3) for all the age ranges from 25 years old and elder, opposite to what happens in other social media as META or Instagram (Ribeiro et al., 2020). From a geographical point of view, LinkedIn GGI normalised’s distribution varies across the country. On average, in the South, we have less gender parity, especially as the audience gets older. Consistently with the findings of Kashyap et al. (Kashyap and Verkroost, 2021), the most accurate age range representation is observed for the group of 25 to 34 years old, whereas the category of the users being more than 55 years old is strongly limited, for women in particular. In Table 1, the age range 25-34 is over-represented in LinkedIn to ISTAT data in Italy. The same behaviour was observed for the Facebook ad estimates (Ribeiro et al., 2020). This can be partly attributed to the fact that people may be temporarily located in Italy and hence not recorded by the official Census. Fake accounts may also be part of the equation (Business, 2022). Overall, the LinkedIn estimates are shown to capture the employment frame in Italy reliably.
Company Industry Representativity.
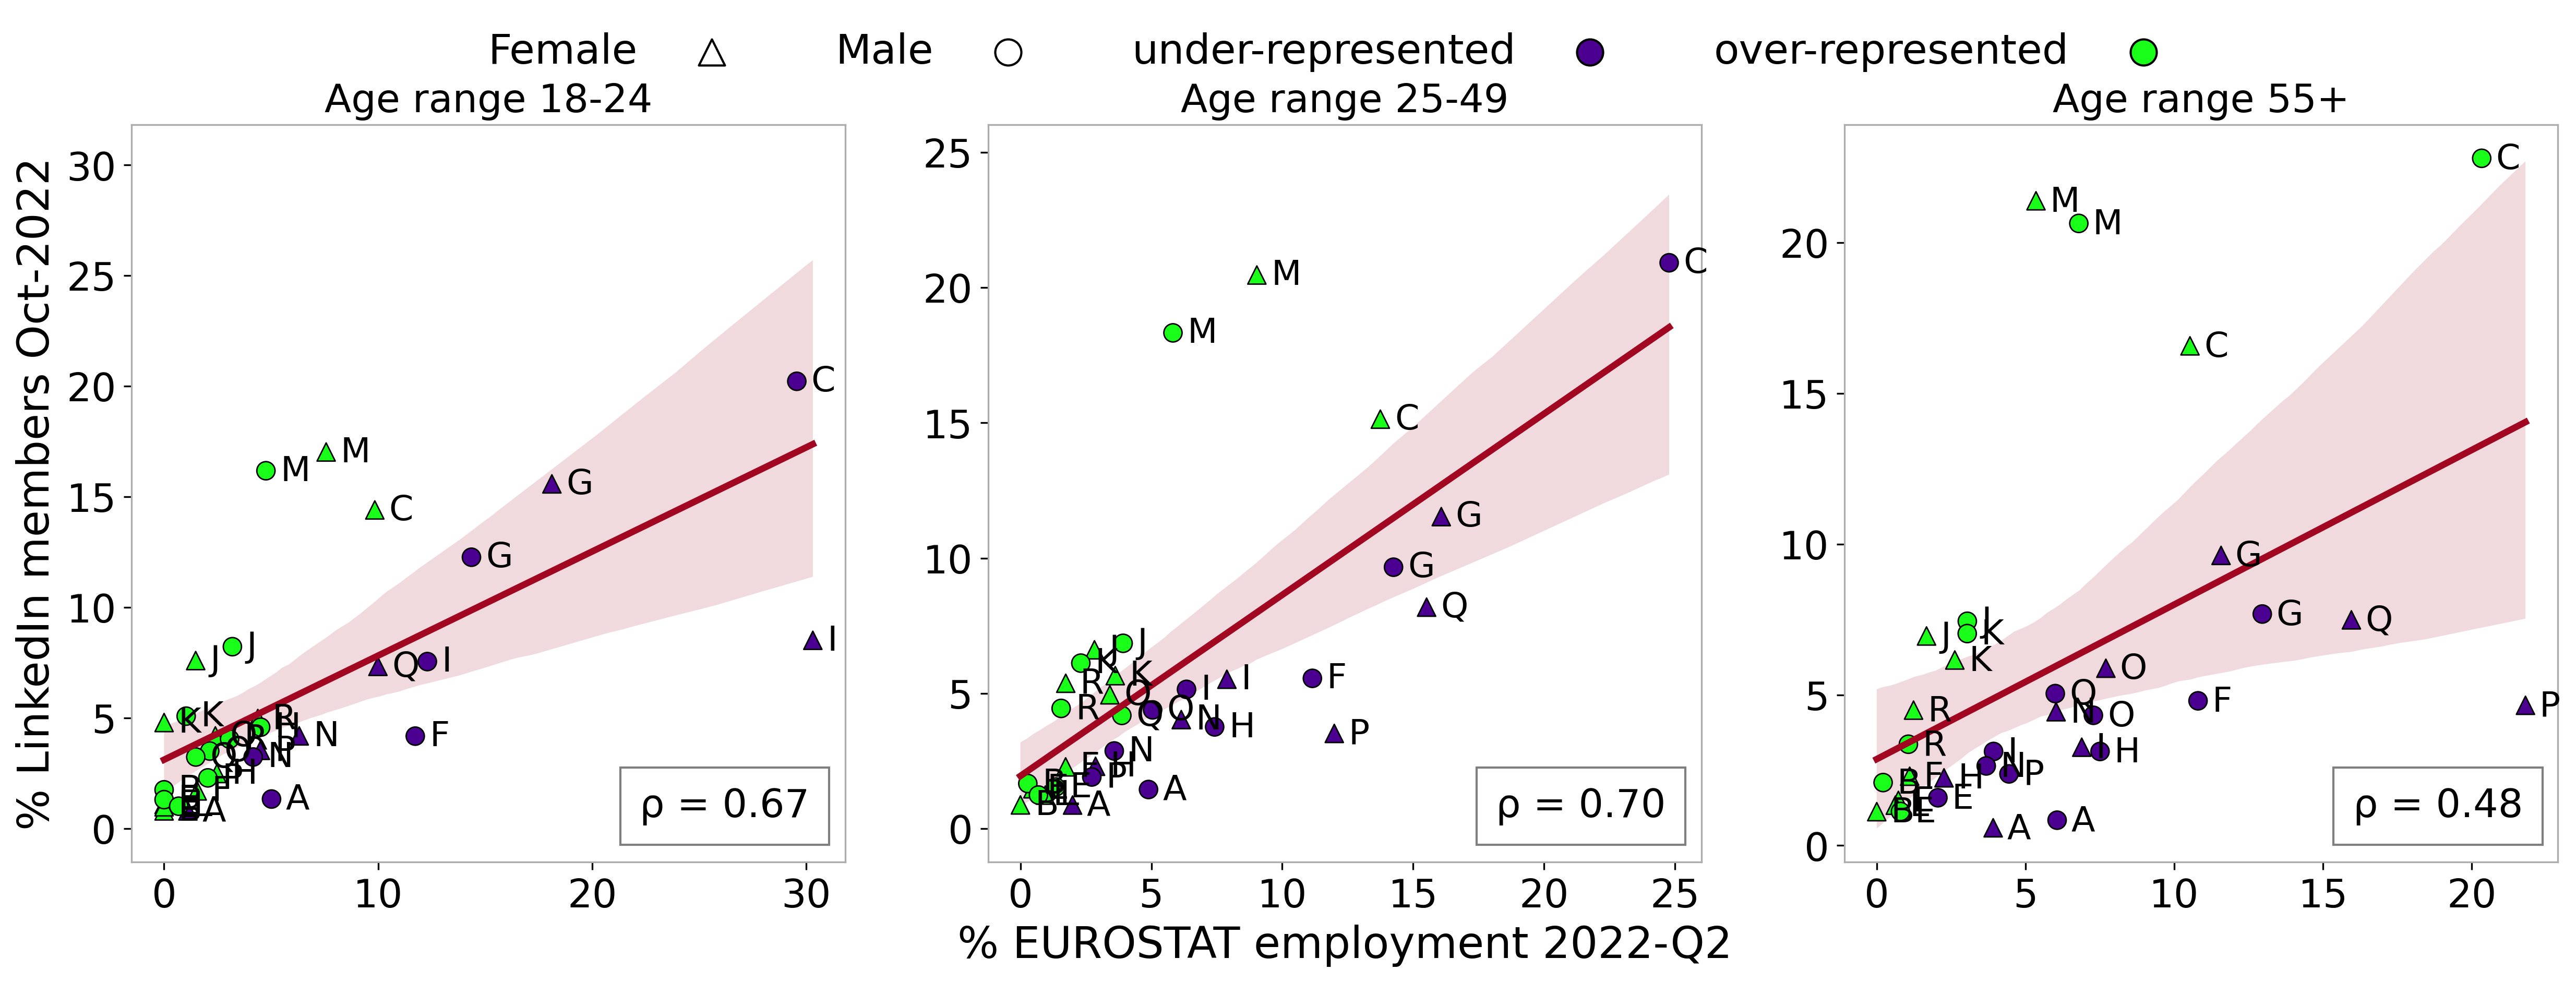
To assess possible biases within the economic sectors, we aggregated the LinkedIn users by gender, age, and per each economic sector333Since age ranges and economic sectors do not correspond perfectly between EUROSTAT and LinkedIn, we grouped them as reported in Table A2 and A4.. For each group, we estimated the percentages of employed individuals over the total number of employees for LinkedIn and EUROSTAT. Correlating these percentages, we found positive relationships reported in Table A5.
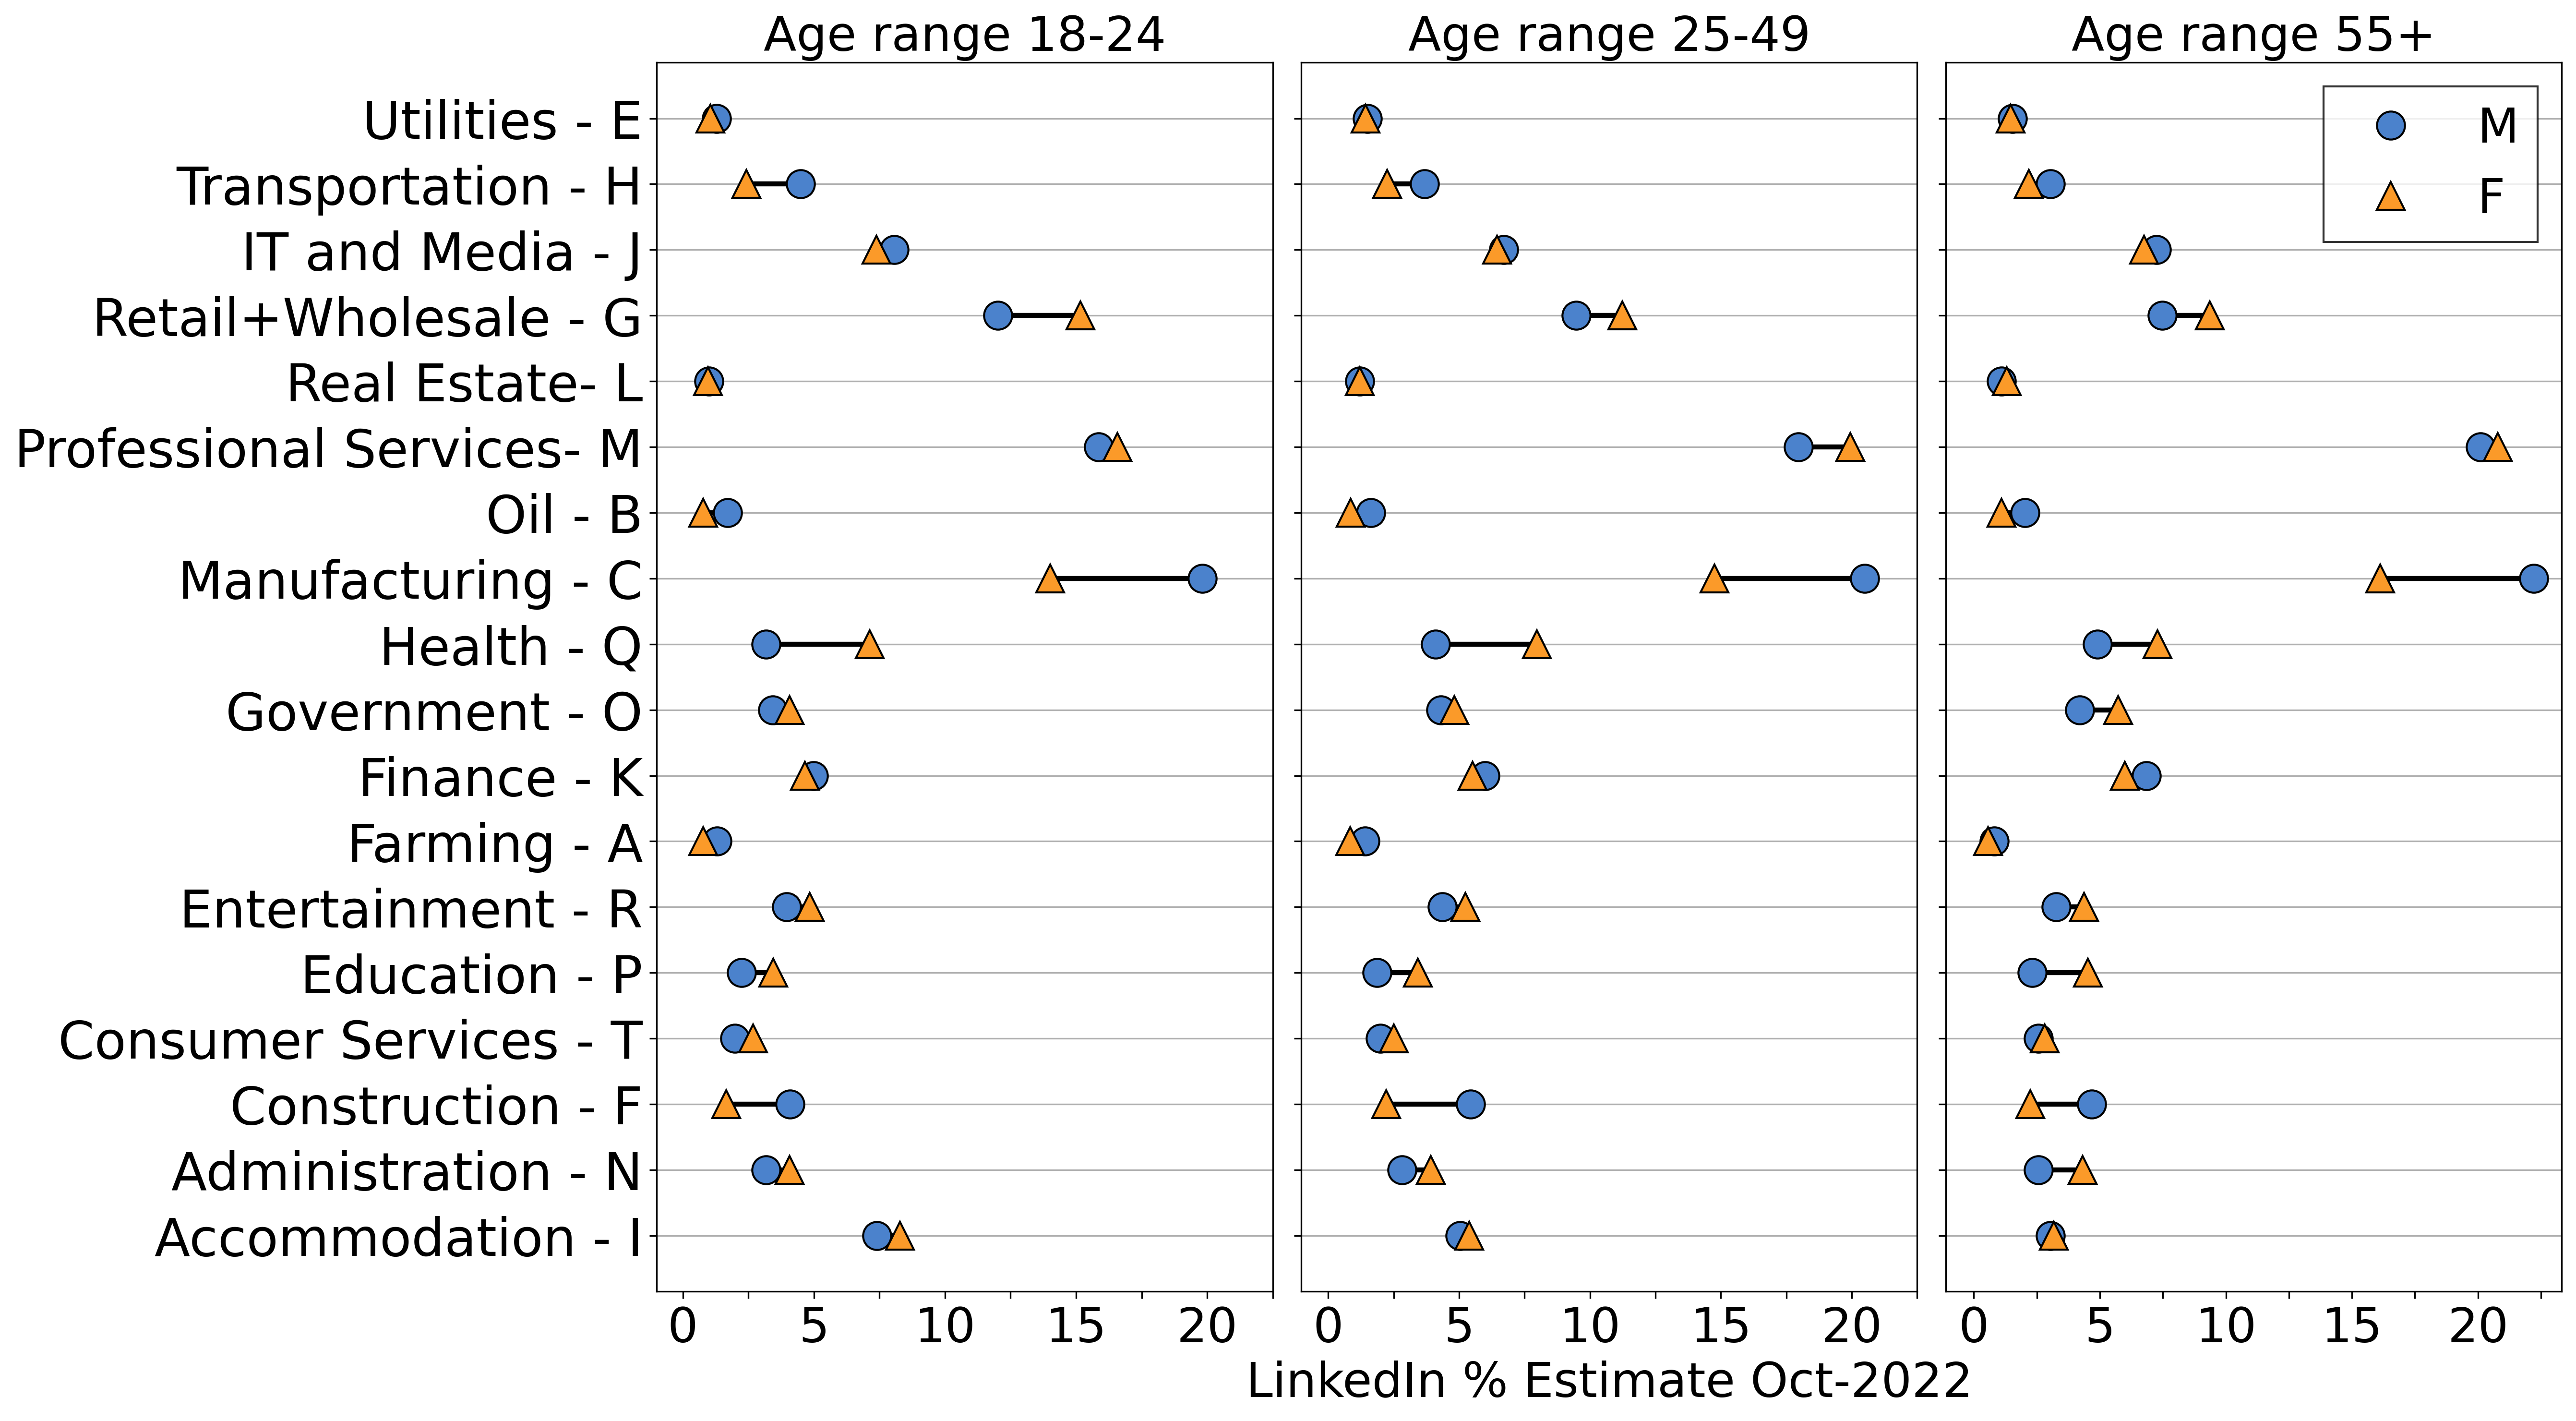
Figure 4 depicts the relationship between the two data sources, LinkedIn and EUROSTAT. We notice that on LinkedIn, several economic sectors are under-represented (e.g. Farming-A, Construction-F, Administration-N, Transportation-H), while the Technology sector is over-represented (e.g. Technology Information and Media - J, Professional Services - M).
A critical gender gap emerges in several sectors (e.g. Construction-F for men, Education-P for women, Health-Q for women), reflecting the general employment trends from official data (Unioncamere-SiCamera, 2020) (see Figure 5). To assess these gender gaps, we compared NACE employment GGI (Eq. 4) index with LinkedIn GGI (Company industry) (Eq. 2). We found a strong and statistically significant correlation (Table A5 row 6) confirming that the gender gap in the LinkedIn data mirrors the participatory gender gap in the labour market. Overall, diving into the distinct economic sectors, we observe that LinkedIn estimates are a reliable sensor for near real-time monitoring of the labour market dynamics in Italy.
4.2. Gender Gap Insights.
LinkedIn Insights: Seniority.
In Table A3, we notice that the leadership positions are not gender balanced (e.g. Manager, Owner, etc.), a finding also confirmed by Kashyap et al. (Kashyap and Verkroost, 2021) on LinkedIn estimates at a worldwide level, and social science literature on the topic (Maida and Weber, 2020; WEF, 2022). This may be due to the lack of economic participation and opportunity for women in apical positions (Cascella et al., 2022).
Digital Divide.
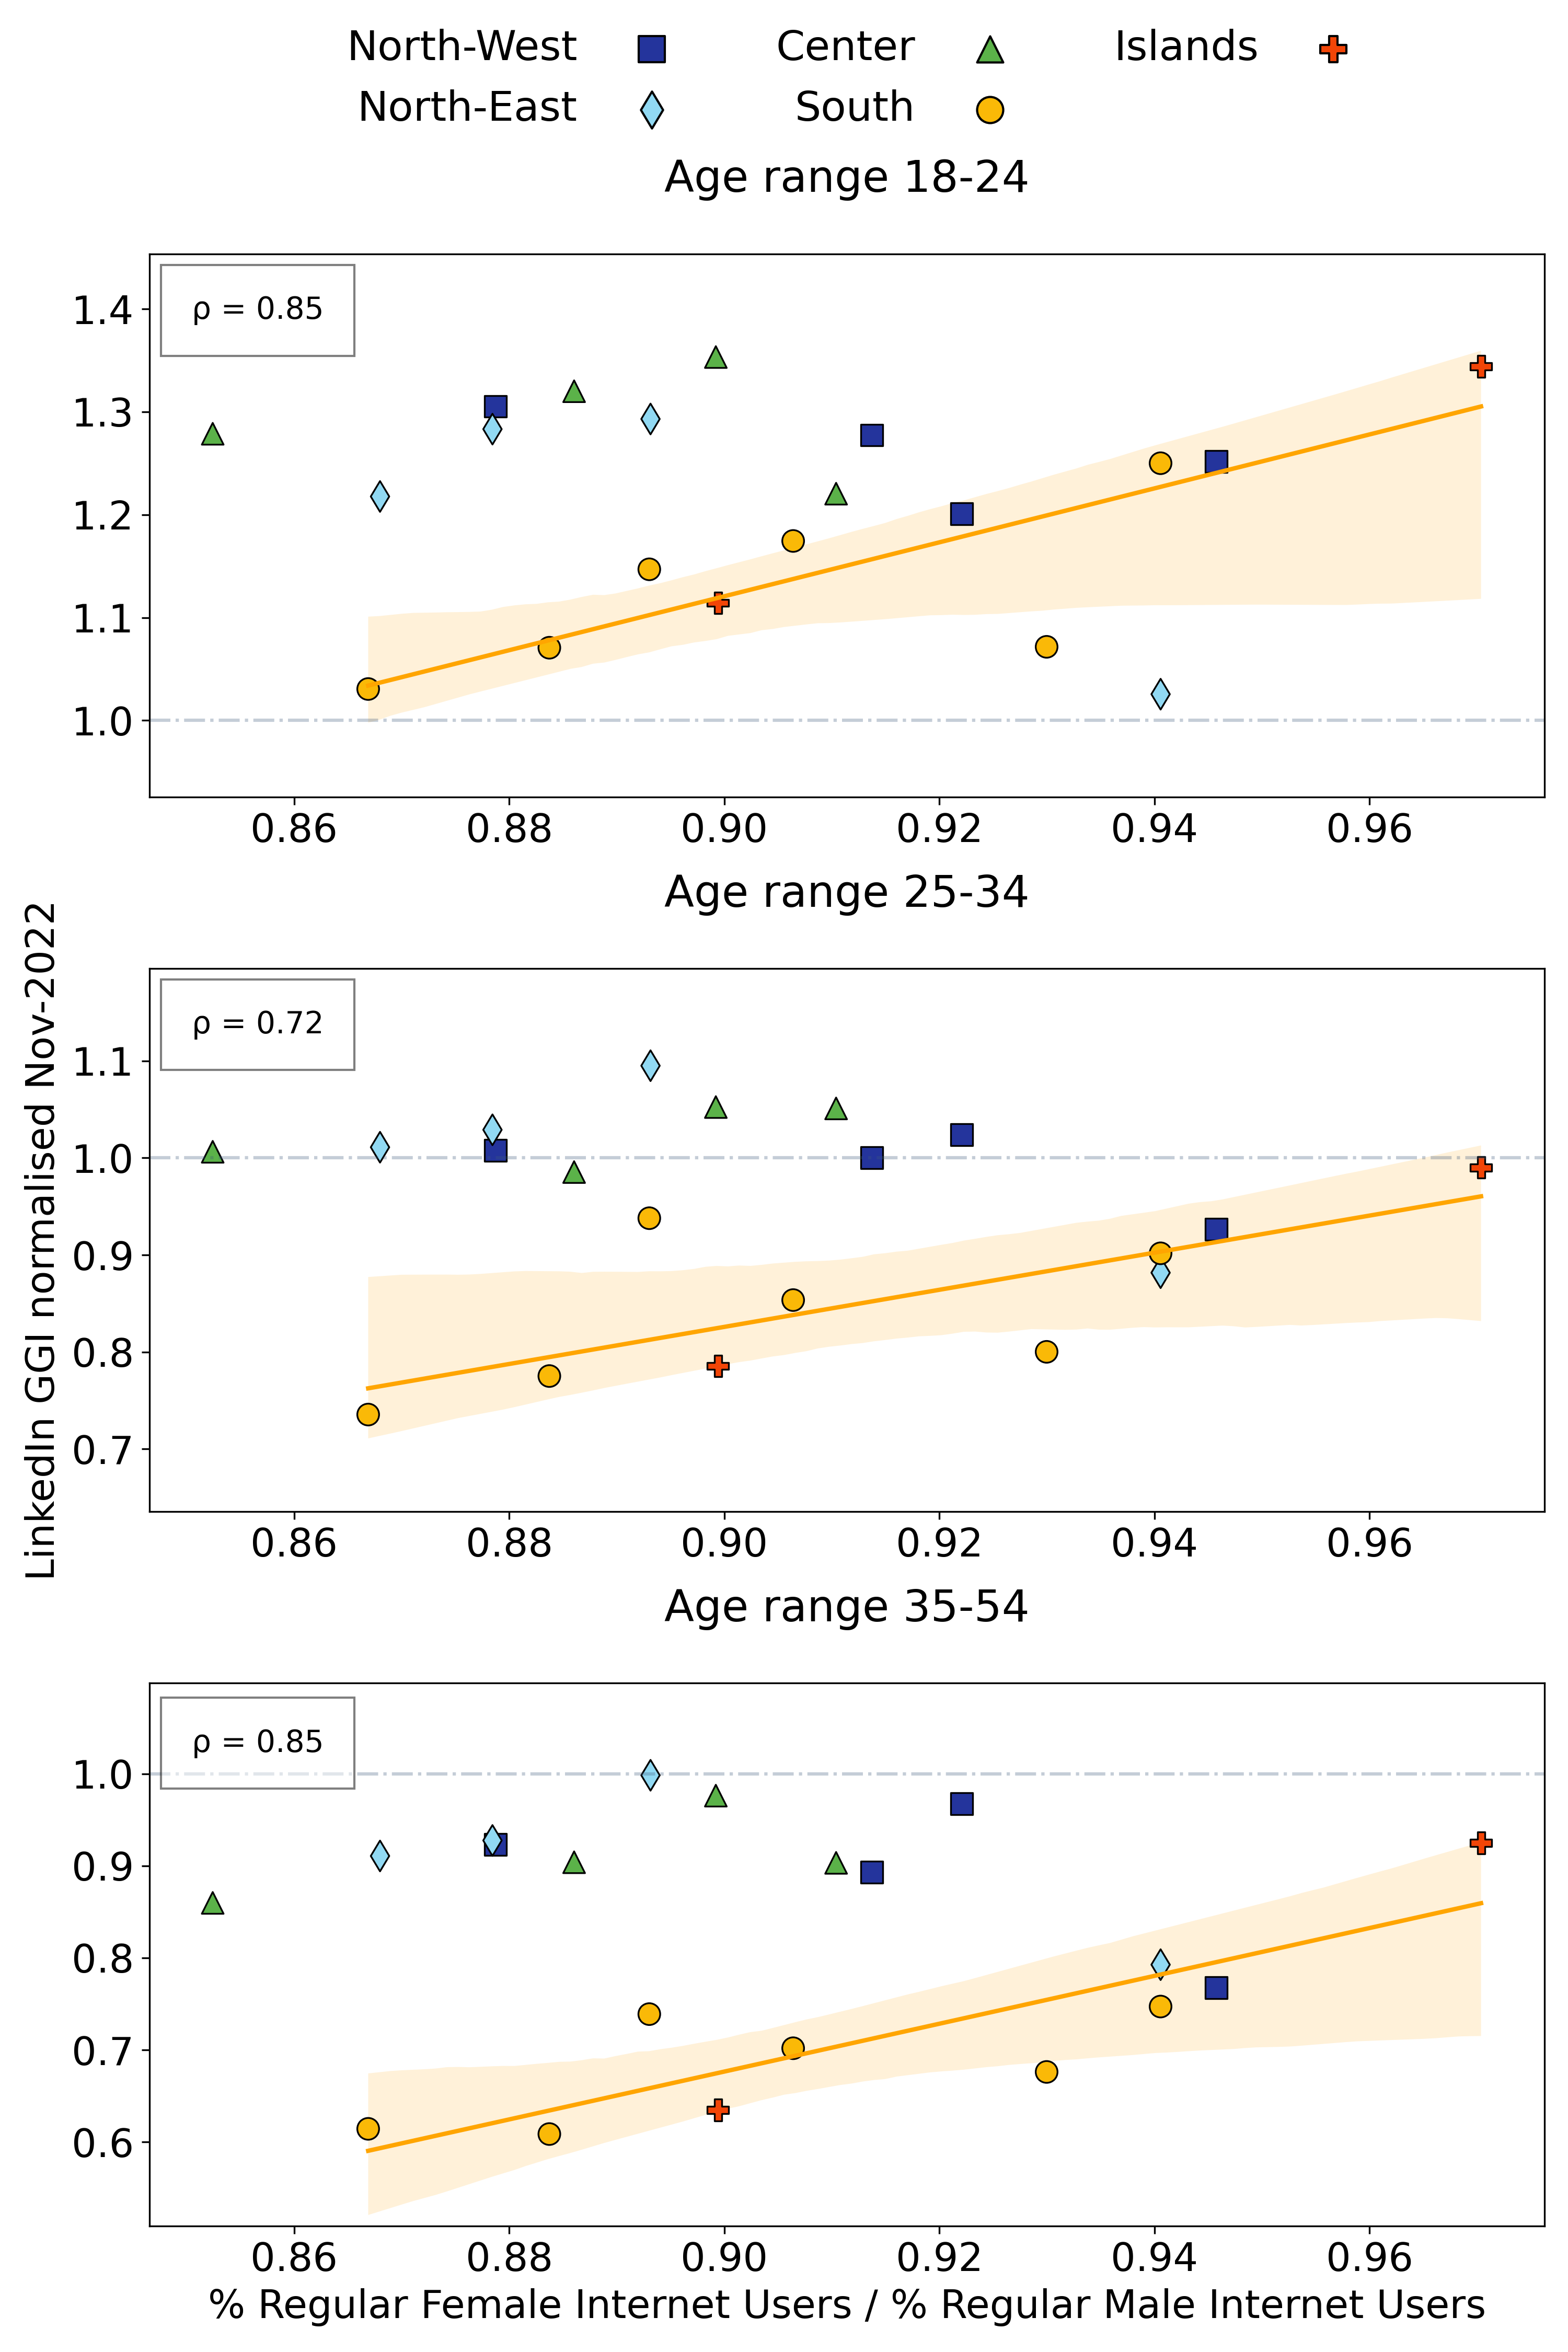
To ensure the effectiveness of the digital divide on the obtained LinkedIn ads estimates, we employed data about the regional level of digital penetration reported by ISTAT 444Section Benessere equo e sostenibile (BES, translation: Fair and sustainable welfare). After computing the respective ratios per gender, age, and region, we compared them to the LinkedIn GGI normalised (Eq. 1). We did not observe a statistically significant correlation between the gender gap in the digitalisation data and the LinkedIn GGI normalised for Italy’s Northern and Central regions. On the contrary, for the Southern regions, a strong correlation between the gender gap and digitalisation level did emerge (see Table A5 row 4 and Figure 6). Interestingly, Fatehkia et al.(Fatehkia et al., 2018), employing data from the Facebook advertising platform, also found that the digitalisation level is a good proxy for the gender gap worldwide.
Mobility.
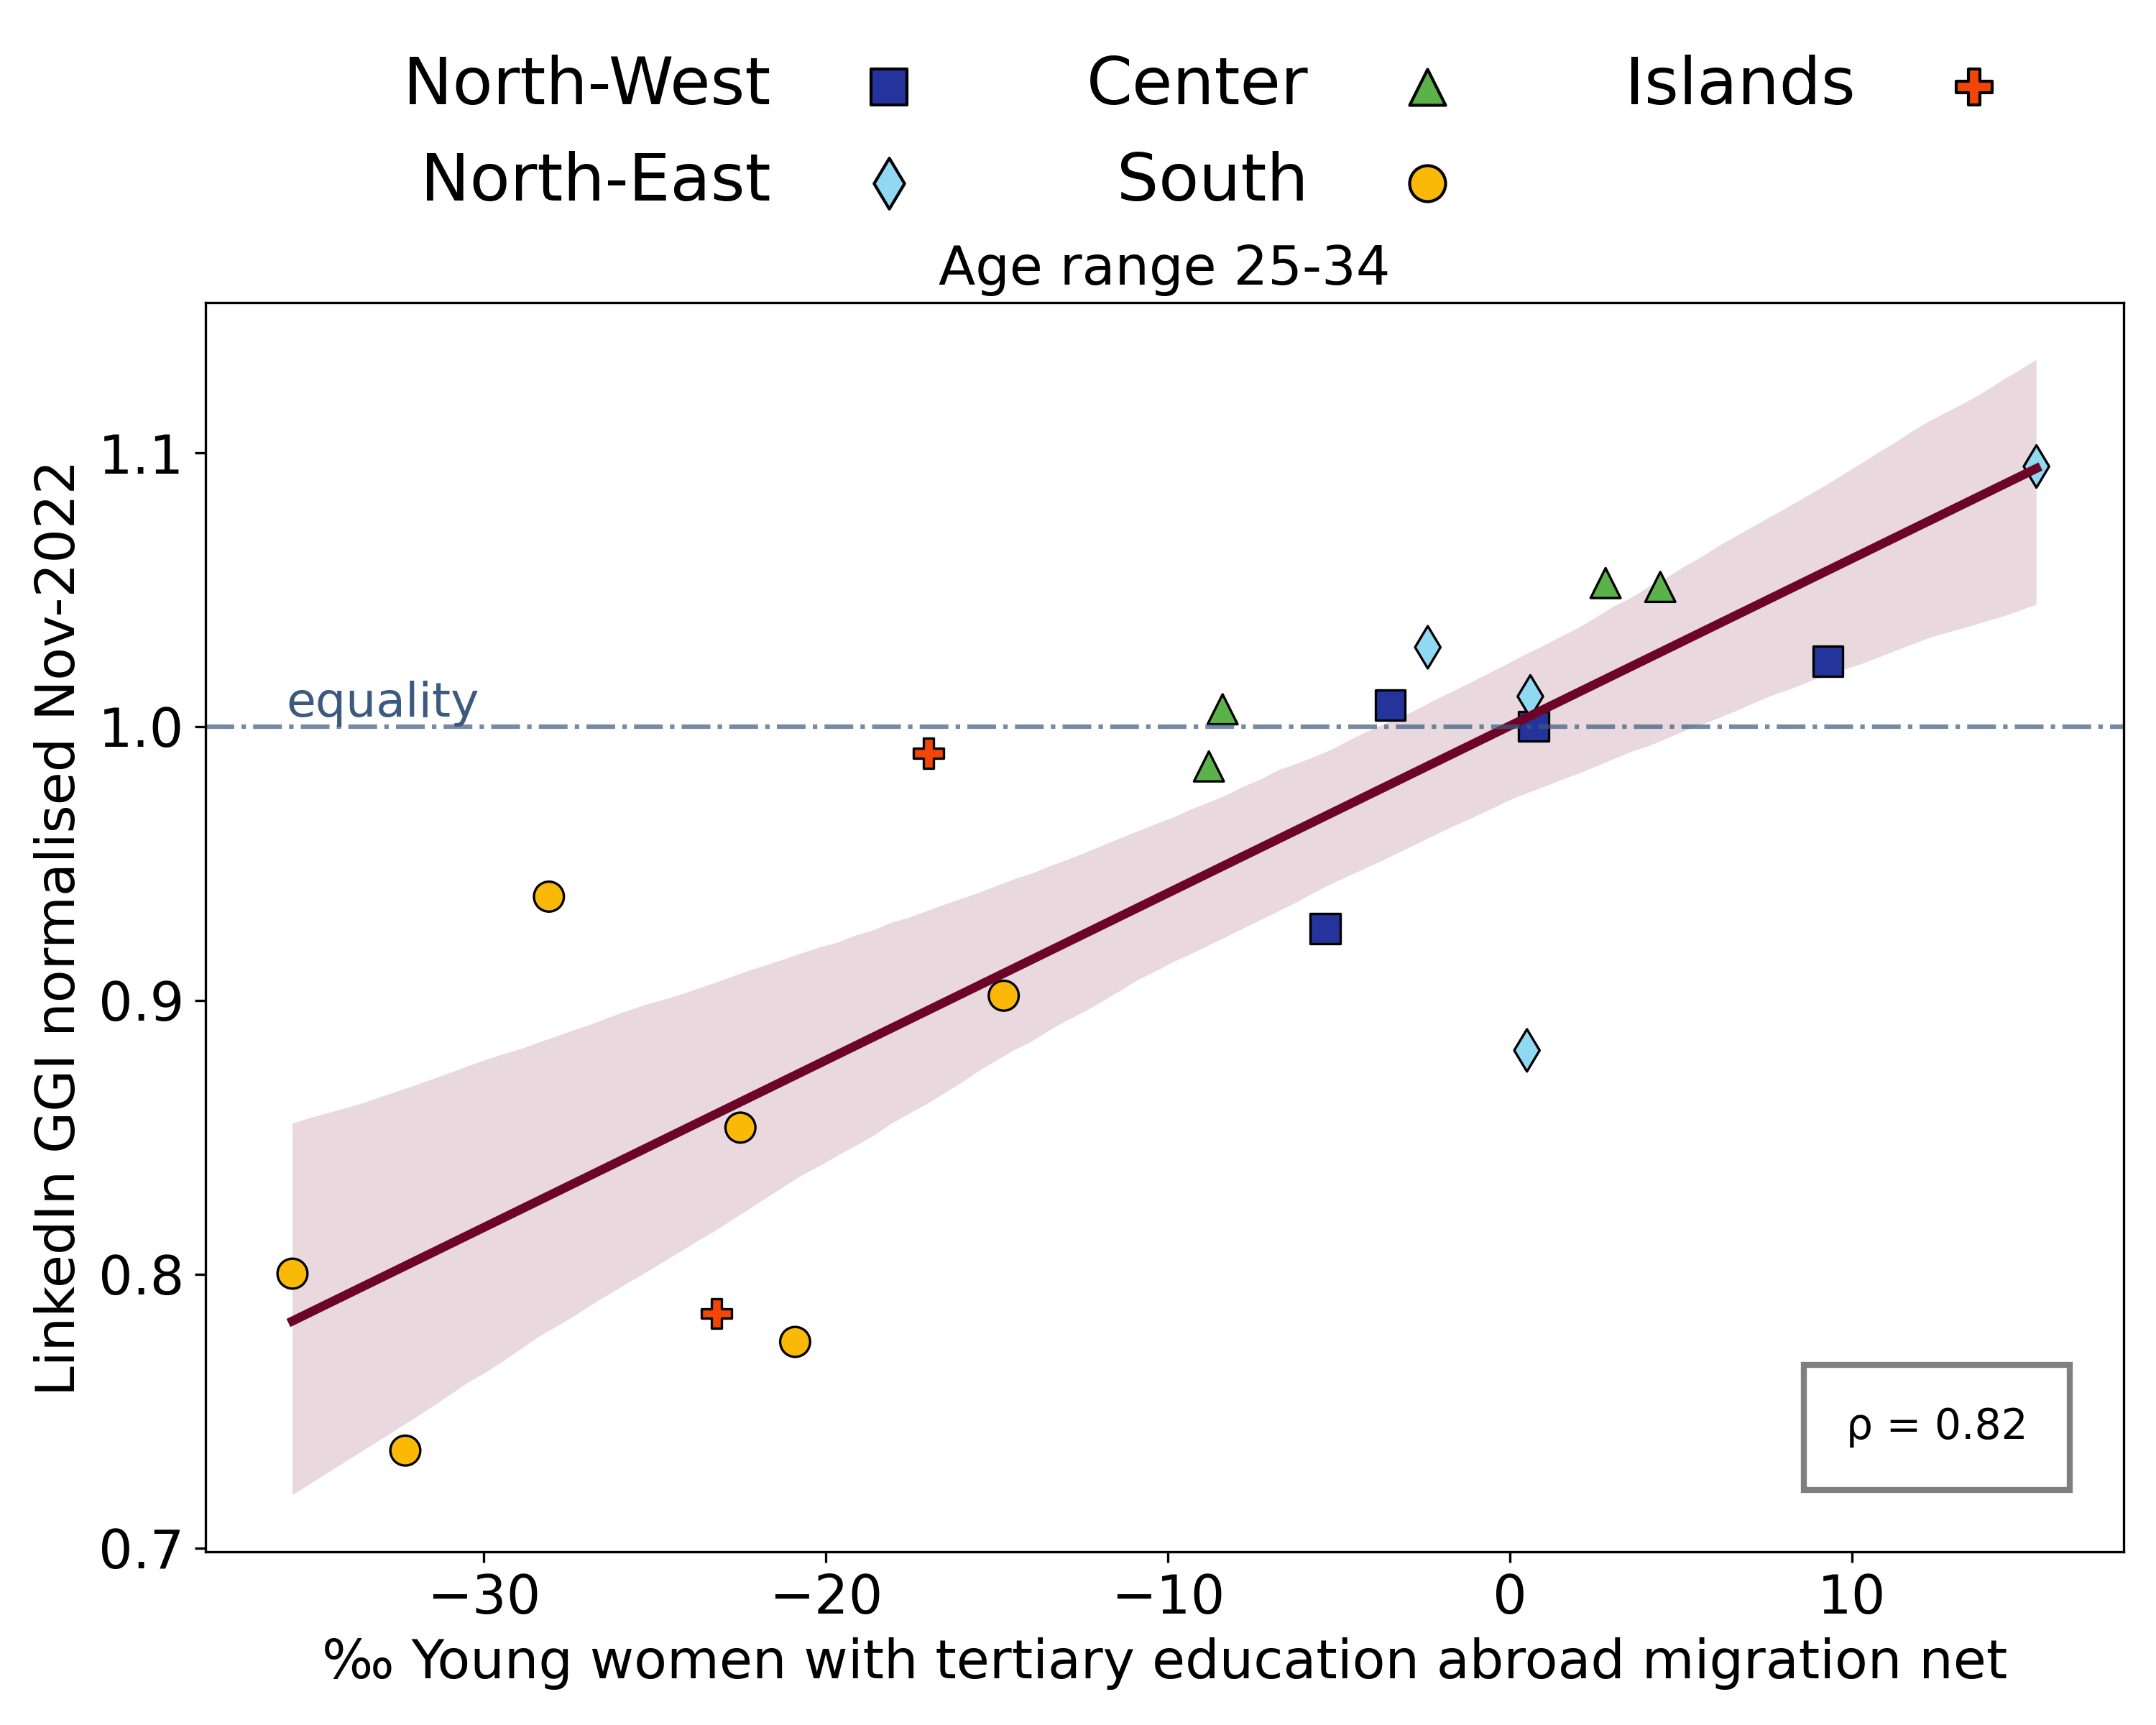
We obtained the mobility data for younger age groups (25 to 39 years old) with tertiary education (e.g. graduated, PhD) from the ISTAT, aggregated by gender and region. The data are provided as a migration net of highly educated individuals, indicating the difference between incoming and outgoing migration flows over one thousand individuals staying in Italy. A negative value indicates more people moving abroad, and a positive otherwise.
Table A5 (row 5), shows a significant positive correlation between the youth mobility measures of women and the LinkedIn GGI normalised (Eq. 1). Figure 7 shows the relationship between the most affected age ranges (25-34) (see Appendix A for the full report of age groups). In relationship with the official data, the LinkedIn GGI normalised is higher where more young graduated women arrived from abroad (Centre, North regions), and lower otherwise (South, Islands). This finding reflects a phenomenon typical for the Italian labour panorama, known as “brain drain,” where the highly educated youth seeks employment abroad (Cattaneo et al., 2019; Ruiu et al., 2019).
4.3. Predicting Gender Gap.
Predictive Modelling of the Labour Gender Gap.
Where traditionally reported data are sparse or hard to obtain, inferring the gender gap in the labour market through the lenses of LinkedIn estimates could provide insights at scale and granularity for timely and accurate policies. Here, we were interested in predicting the gender gap from the LinkedIn estimates not simply as population aggregates but to age group and geographic location. We postulated the task as a multi-linear regression problem where leveraging the LinkedIn estimates; we predicted the actual gender gap. Before training, we performed outlier detection using Isolation Forest Algorithm. Removing the outliers, the obtained result (, ) showed no improvement and let us deduce that the gender gap is uniform without off-scale points. The model was trained on a dataset of four age ranges in 20 regions. The results yielded a (, ). The results of the 5-fold cross validation yielded an average (with standard deviation 0.03) and average . Out of all data points, three residuals (difference between actual and predicted values) were more than two times greater than the residual standard error (0.06) of the distribution (Liguria 18-24; Umbria 18-24, Puglia 55+). These were all associated with the more sparse age ranges in LinkedIn (18-24 and 55+), for which the accuracy of the LinkedIn GGI normalised index falters.
5. Conclusions
Gender inequalities and discrimination in the labour market still hold despite significant advances worldwide. Given the slow pace and high cost of official surveying approaches, we assessed whether estimates from the LinkedIn advertising platform might be employed to obtain insights into the gender gaps observed in the work environment.
Here, we focused on Italy as a case study, a country for which we have detailed census data, which is at the forefront of the European economic scene but at the same time presents substantial sociodemographic inequalities. Touching upon a series of characteristics, such as seniority level and the various industrial domains, we shed light on the strengths and limitations of such tools for understanding the sub-national labour markets.
More precisely, we showed that LinkedIn advertising audience estimates could be employed as a proxy for the Italian labour market as it reflects the official statistics concerning age and gender and demographic distribution of the labour force. At the same time, the intrinsic biases of the platform - it is mainly adopted by highly skilled professionals and is less popular to older age groups - present several shortcomings to the industry category and seniority level, with industries such as Technology being more represented while others such as Farming to be underrepresented.
We also highlighted essential aspects related to the gender gap in Italy; the digital divide that varies significantly within the country can be an explanatory factor of the gender gap observed in LinkedIn, as women in the Southern regions of Italy have the lowest digitalisation rate. Last but not least, our findings underline the phenomenon of “brain drain”, of significant concern for Italy, as the younger and skilled generation is migrating abroad. Our data show that this trend is particularly intense for the female population of the Southern areas of Italy.
Acknowledgements.
The authors gratefully acknowledge the support from the Lagrange Project of the Institute for Scientific Interchange Foundation (ISI Foundation) funded by Fondazione Cassa di Risparmio di Torino (Fondazione CRT).References
- (1)
- Azmat et al. (2021) Ghazala Azmat, Vicente Cuñat, and Emeric Henry. 2021. Gender Promotion Gaps: Career Aspirations and Workplace Discrimination. SSRN Electronic Journal (2021). https://doi.org/10.2139/ssrn.3525230
- Benson et al. (2021) Alan Benson, Danielle Li, and Kelly Shue. 2021. ”Potential” and the Gender Promotion Gap. Working paper 31 (2021).
- Business (2022) CNN Business. 2022. First on CNN: LinkedIn knows there are fake accounts on its site. Now it wants to help users spot them. Retrieved February 1, 2023 from https://edition.cnn.com/2022/10/25/tech/linkedin-bot-fake-accounts-new-features
- Buzzacchi et al. (2021) Luigi Buzzacchi, Antonio De Marco, and Marcello Pagnini. 2021. Agglomeration and the Italian North-South Divide. SSRN Electronic Journal (2021). https://doi.org/10.2139/ssrn.3959983
- Campa et al. (2011) Pamela Campa, Alessandra Casarico, and Paola Profeta. 2011. Gender culture and gender gap in employment. CESifo Economic Studies 57 (3 2011), 156–182. Issue 1. https://doi.org/10.1093/cesifo/ifq018
- Cascella et al. (2022) C. Cascella, J. Williams, and M. Pampaka. 2022. An Extended Regional Gender Gaps Index (eRGGI): Comparative Measurement of Gender Equality at Different Levels of Regionality. Social Indicators Research 159 (2022). Issue 2. https://doi.org/10.1007/s11205-021-02764-x
- Cattaneo et al. (2019) Mattia Cattaneo, Paolo Malighetti, and Stefano Paleari. 2019. The Italian brain drain: cream and milk. Higher Education 77 (2019). Issue 4. https://doi.org/10.1007/s10734-018-0292-8
- Cheryan et al. (2013) Sapna Cheryan, Victoria C. Plaut, Caitlin Handron, and Lauren Hudson. 2013. The Stereotypical Computer Scientist: Gendered Media Representations as a Barrier to Inclusion for Women. Sex Roles 69 (7 2013), 58–71. Issue 1-2. https://doi.org/10.1007/s11199-013-0296-x
- Damous and Guillopé (2021) Licia Bosco Damous and Colette Guillopé. 2021. Gender-based violence in higher education and research: A European perspective. Pure and Applied Chemistry 93 (2021). Issue 8. https://doi.org/10.1515/pac-2021-0401
- di Bella et al. (2019) Enrico di Bella, Filomena Maggino, Leonardo Alaimo, and Giulia Nanni. 2019. Misurare l’uguaglianza di genere. Un’analisi regionale per l’Italia.
- Eagly et al. (2019) Alice H Eagly, Andrea Elisabeth Abele, Elizabeth Haines, Tanja Hentschel, Madeline E Heilman, and Claudia V Peus. 2019. The Multiple Dimensions of Gender Stereotypes: A Current Look at Men’s and Women’s Characterizations of Others and Themselves The Multiple Dimensions of Gender Stereotypes. Frontiers in Psychology — www.frontiersin.org 1 (2019). https://doi.org/10.3389/fpsyg.2019.00011
- Ellis et al. (2016) Jessica Ellis, Bailey K. Fosdick, and Chris Rasmussen. 2016. Women 1.5 times more likely to leave stem pipeline after calculus compared to men: Lack of mathematical confidence a potential culprit. PLoS ONE 11 (2016). Issue 7. https://doi.org/10.1371/journal.pone.0157447
- EUROSTAT (2018) EUROSTAT. 2018. Metropolitan Regions. Retrieved February 1, 2023 from https://ec.europa.eu/eurostat/web/metropolitan-regions/background
- EUROSTAT (2021) EUROSTAT. 2021. Which EU countries had the highest GDP in 2020? Retrieved February 1, 2023 from https://ec.europa.eu/eurostat/en/web/products-eurostat-news/-/ddn-20211220-1
- EUROSTAT (2022) EUROSTAT. 2022. Database. Retrieved February 1, 2023 from https://ec.europa.eu/eurostat/web/main/data/database
- Fatehkia et al. (2018) Masoomali Fatehkia, Ridhi Kashyap, and Ingmar Weber. 2018. Using Facebook ad data to track the global digital gender gap. World Development 107 (2018). https://doi.org/10.1016/j.worlddev.2018.03.007
- Fatehkia et al. (2020) Masoomali Fatehkia, Isabelle Tingzon, Ardie Orden, Stephanie Sy, Vedran Sekara, Manuel Garcia-Herranz, and Ingmar Weber. 2020. Mapping socioeconomic indicators using social media advertising data. EPJ Data Science 9 (2020). Issue 1. https://doi.org/10.1140/epjds/s13688-020-00235-w
- Folke et al. (2020) Olle Folke, Johanna Rickne, Seiki Tanaka, and Yasuka Tateishi. 2020. Sexual harassment of women leaders. Daedalus 149 (2020). Issue 1. https://doi.org/10.1162/DAED_a_01781
- Garcia et al. (2018) David Garcia, Yonas Mitike Kassa, Angel Cuevas, Manuel Cebrian, Esteban Moro, Iyad Rahwan, and Ruben Cuevas. 2018. Analyzing gender inequality through large-scale Facebook advertising data. Proceedings of the National Academy of Sciences of the United States of America 115 (2018). Issue 27. https://doi.org/10.1073/pnas.1717781115
- Graph (2021) LinkedIn Economic Graph. 2021. Future of Skills. Retrieved February 1, 2023 from https://linkedin.github.io/future-of-skills/
- Greselin and Jedrzejczak (2020) Francesca Greselin and Alina Jedrzejczak. 2020. Analyzing the Gender Gap in Poland and Italy, and by Regions. International Advances in Economic Research 26 (2020). Issue 4. https://doi.org/10.1007/s11294-020-09810-3
- Haranko et al. (2018) Karri Haranko, Emilio Zagheni, Kiran Garimella, and Ingmar Weber. 2018. Professional Gender Gaps Across US Cities. CoRR abs/1801.09429 (2018). arXiv:1801.09429 http://arxiv.org/abs/1801.09429
- Harnois and Bastos (2018) Catherine E. Harnois and João L. Bastos. 2018. Discrimination, Harassment, and Gendered Health Inequalities: Do Perceptions of Workplace Mistreatment Contribute to the Gender Gap in Self-reported Health? Journal of Health and Social Behavior 59 (2018). Issue 2. https://doi.org/10.1177/0022146518767407
- ISTAT (2020) ISTAT. 2020. Censimento permanente della popolazione e delle abitazioni. https://esploradati.censimentopopolazione.istat.it/databrowser/#/it
- ISTAT (2022) ISTAT. 2022. IStituto Nazionale di Statistice. Retrieved February 1, 2023 from https://www.ISTAT.it/en/
- Janneke Plantenga and Remery (2010) Friederike Maier Janneke Plantenga, Colette Fagan and Chantal Remery. 2010. Rationale for the Gender Equality Index for Europe. https://eige.europa.eu/publications/rationale-gender-equality-index-europe
- Kashyap et al. (2020) Ridhi Kashyap, Masoomali Fatehkia, Reham Al Tamime, and Ingmar Weber. 2020. Monitoring global digital gender inequality using the online populations of Facebook and Google. Demographic Research 43 (2020). https://doi.org/10.4054/DEMRES.2020.43.27
- Kashyap and Verkroost (2021) Ridhi Kashyap and Florianne C J Verkroost. 2021. Analysing global professional gender gaps using LinkedIn advertising data. EPJ Data Sci. (2021). https://doi.org/10.1140/epjds/s13688-021-00294-7
- Kimura and Kearns (2020) Johanna Kimura and Steve Kearns. 2020. Reach your audience: Targeting on LinkedIn. 1–34 pages. https://business.linkedin.com/content/dam/me/business/en-us/marketing-solutions/resources/pdfs/linkedin-targeting-playbook-v3.pdf
- Maida and Weber (2020) Agata Maida and Andrea Weber. 2020. Female Leadership and Gender Gap within Firms: Evidence from an Italian Board Reform. ILR Review 75, 2 (2020), 488–515. https://doi.org/10.1177/0019793920961995
- Martino et al. (2020) Paolo Di Martino, Emanuele Felice, and Michelangelo Vasta. 2020. A tale of two Italies: ”access-orders” and the Italian regional divide. Scandinavian Economic History Review 68 (2020). Issue 1. https://doi.org/10.1080/03585522.2019.1631882
- Mejova et al. (2018) Yelena Mejova, Harsh Rajiv Gandhi, Tejas Jivanbhai Rafaliya, Mayank Rameshbhai Sitapara, Ridhi Kashyap, and Ingmar Weber. 2018. Measuring Subnational Digital Gender Inequality in India through Gender Gaps in Facebook Use. In Proceedings of the 1st ACM SIGCAS Conference on Computing and Sustainable Societies (Menlo Park and San Jose, CA, USA) (COMPASS ’18). Association for Computing Machinery, New York, NY, USA, Article 43, 5 pages. https://doi.org/10.1145/3209811.3212698
- Nations (2020) United Nations. 2020. Sustainable Development Goals. Retrieved February 1, 2023 from https://www.un.org/sustainabledevelopment/sustainable-development-goals/
- Pinho-Gomes et al. (2022) Ana Catarina Pinho-Gomes, Amy Vassallo, Cheryl Carcel, Sanne Peters, and Mark Woodward. 2022. Gender equality and the gender gap in life expectancy in the European Union. BMJ Global Health 7 (2022). Issue 2. https://doi.org/10.1136/bmjgh-2021-008278
- Pressroom (2021) LinkedIn Pressroom. 2021. About Us. Retrieved February 1, 2023 from https://news.linkedin.com/about-us#Statistics
- Rama et al. (2020) Daniele Rama, Yelena Mejova, Michele Tizzoni, Kyriaki Kalimeri, and Ingmar Weber. 2020. Facebook Ads as a Demographic Tool to Measure the Urban-Rural Divide. CoRR abs/2002.11645 (2020). arXiv:2002.11645 https://arxiv.org/abs/2002.11645
- Ribeiro et al. (2020) Filipe N. Ribeiro, Fabrício Benevenuto, and Emilio Zagheni. 2020. How Biased is the Population of Facebook Users? Comparing the Demographics of Facebook Users with Census Data to Generate Correction Factors. CoRR abs/2005.08065 (2020). arXiv:2005.08065 https://arxiv.org/abs/2005.08065
- Ricardo Hausmann (2006) Saadia Zahidi Ricardo Hausmann, Laura D. Tyson. 2006. The Global Gender Gap Report 2006. 1–152 pages. https://www3.weforum.org/docs/WEF_GenderGap_Report_2006.pdf
- Ruiu et al. (2019) Gabriele Ruiu, Nicoletta Fadda, Alberto Ezza, and Massimo Esposito. 2019. Exploring mobility of Italian Ph.Ds over the last decades. Electronic Journal of Applied Statistical Analysis 12 (12 2019), 748–773. https://doi.org/10.1285/i20705948v12n4p748
- Shaw et al. (2018) Elyse Shaw, Ariane Hegewisch, and Cynthia Hess. 2018. Sexual Harassment and Assault at Work: Understanding the Costs. Institute for Women’s Policy Research (2018).
- Solutions (2016) LinkedIn Marketing Solutions. 2016. Get Started with LinkedIn Ads. Retrieved February 1, 2023 from https://business.linkedin.com/marketing-solutions/ads
- Stojmenovska and England (2021) Dragana Stojmenovska and Paula England. 2021. Parenthood and the Gender Gap in Workplace Authority. European Sociological Review Vol. 37, No. 4 (2021), 626–640. https://doi.org/10.1093/esr/jcaa064
- Tamime and Weber (2022) Reham Al Tamime and Ingmar Weber. 2022. Using social media advertisement data to monitor the gender gap in STEM: opportunities and challenges. PeerJ Computer Science (2022). https://doi.org/10.7717/peerj-cs.994
- Unioncamere-SiCamera (2020) Unioncamere-SiCamera. 2020. IV Rapporto Imprenditoria femminile. https://www.unioncamere.gov.it/sites/default/files/articoli/2022-04/IV_Rapporto%20IF_slides.pdf
- Verkroost et al. (2020) Florianne CJ Verkroost, Ridhi Kashyap, Kiran Garimella, Ingmar Weber, and Emilio Zagheni. 2020. Tracking global gender gaps in information technology using online data. Digital skills insights 2020 (2020).
- Vieira and Vasconcelos (2021) Carolina C. Vieira and Marisa Vasconcelos. 2021. Using Facebook Ads Data to Assess Gender Balance in STEM: Evidence from Brazil. In Companion Proceedings of the Web Conference 2021 (Ljubljana, Slovenia) (WWW ’21). Association for Computing Machinery, New York, NY, USA, 145–153. https://doi.org/10.1145/3442442.3453456
- WEF (2022) WEF. 2022. 2022 The global gender gap report. 1–374 pages. Issue July. https://www3.weforum.org/docs/WEF_GGGR_2022.pdf
- Zagheni et al. (2017) Emilio Zagheni, Ingmar Weber, and Krishna Gummadi. 2017. Leveraging Facebook’s advertising platform to monitor stocks of migrants. Population and Development Review (2017), 721–734.
Appendix A Appendix
We report the choices needed to compare offline data and LinkedIn estimates. Since the age ranges were not always directly comparable among different data sources, we had to link them: the age groups match between LinkedIn and ISTAT are in Table A1, in Table A2 for LinkedIn and EUROSTAT. The LinkedIn GGI (Seniority) (Eq. 2) are included in Table A3 by age ranges. Moreover, in Table A4 we outline the mapping of the EUROSTAT NACEs to the Company industry attribute in LinkedIn ads platform.
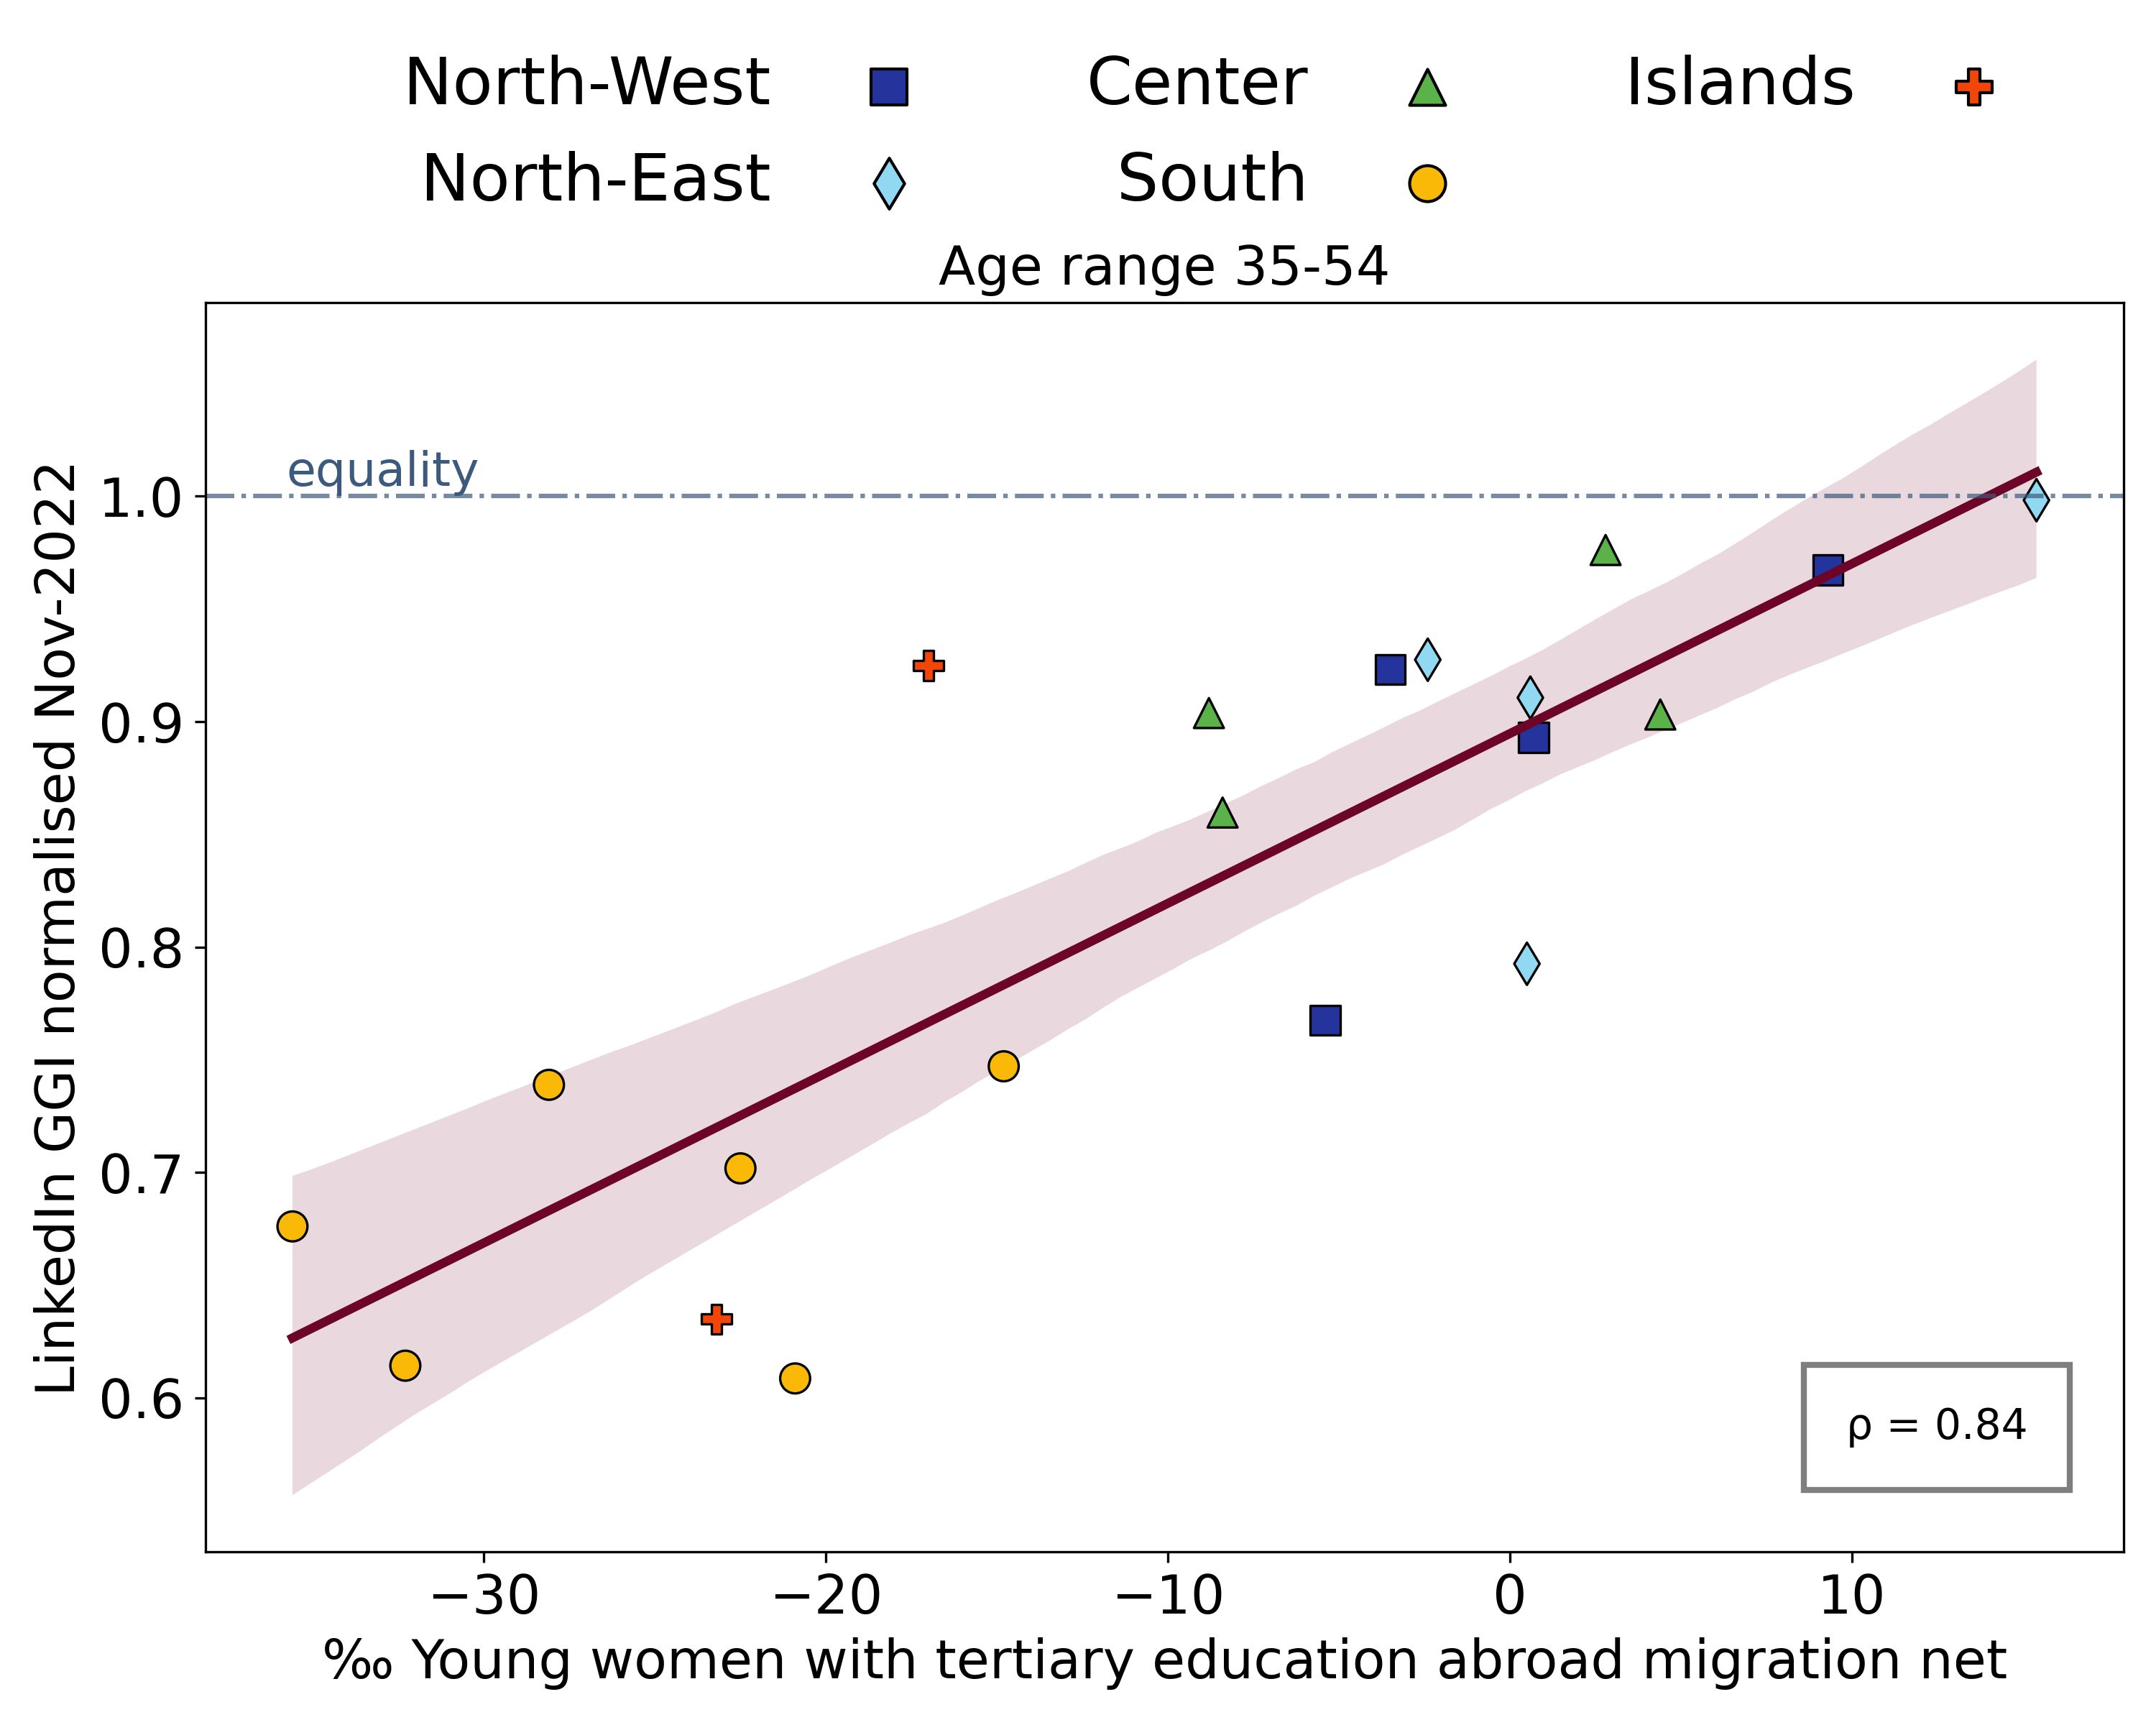
Next, we incorporate all the (Pearson) aforementioned correlation values and the statistic significance associated. In addition, to evaluate the stability of the exclusion query in our data set, in Table A5 (row 1), we provide the correlation values for the measures computed with or without exclusion query to the level of regions. The correlation values are computed correlating the original estimates of locations that hit the 300 threshold with the values obtained applying them the exclusion query. Finally, concerning the correlation with mobility data exposed in Section 4.2, the correlation among young female mobility data and LinkedIn gender gap affects also age range 35-54. Hence, we integrate Figure 7 with the plot of the regression line for age range 35-54 in Figure A1. The Pearson’s correlation values are in A5, row 5.
| ETA1 ISTAT | LinkedIn age range |
|---|---|
| Y15-24 | 18-24 |
| Y25-34 | 25-34 |
| avg(Y35-44, Y45-54) | 35-54 |
| Y55-64 | 55+ |
| AGE EUROSTAT | LinkedIn age range |
|---|---|
| From 15 to 24 years | 18-24 |
| From 25 to 49 years | avg(25-34, 35-54) |
| From 55 to 74 years | 55+ |
| Seniority | Age range | LinkedIn GGI (Seniority) |
|---|---|---|
| Unpaid | 18-24 | 0.50 |
| 25-34 | 0.36 | |
| 35-54 | 0.43 | |
| 55+ | 0.45 | |
| Training | 18-24 | 1.09 |
| 25-34 | 1.23 | |
| 35-54 | 1.79 | |
| Entry | 18-24 | 1.04 |
| 25-34 | 1.00 | |
| 35-54 | 1.18 | |
| 55+ | 1.35 | |
| Senior | 18-24 | 0.93 |
| 25-34 | 0.98 | |
| 35-54 | 1.12 | |
| 55+ | 1.01 | |
| Manager | 18-24 | 0.64 |
| 25-34 | 0.57 | |
| 35-54 | 0.71 | |
| 55+ | 0.71 | |
| Director | 18-24 | 0.62 |
| 25-34 | 0.56 | |
| 35-54 | 0.67 | |
| 55+ | 0.70 | |
| VP | 18-24 | 0.56 |
| 25-34 | 0.57 | |
| 35-54 | 0.63 | |
| 55+ | 0.61 | |
| CxO | 18-24 | 0.44 |
| 25-34 | 0.43 | |
| 35-54 | 0.46 | |
| 55+ | 0.54 | |
| Partner | 25-34 | 0.65 |
| 35-54 | 0.68 | |
| 55+ | 0.63 | |
| 55+ | 0.73 | |
| Owner | 18-24 | 0.55 |
| 25-34 | 0.47 | |
| 35-54 | 0.55 | |
| 55+ | 0.70 |
| LinkedIn Company industry | EUROSTAT NACE | Code |
|---|---|---|
| Farming Ranching Forestry | Agriculture, forestry and fishing | A |
| Oil Gas and Mining | Mining and quarrying | B |
| Manufacturing | Manufacturing | C |
| Utilities | Water supply; sewerage, waste management and remediation activities | E |
| Construction | Construction | F |
| Wholesale | Wholesale and retail trade; repair of motor vehicles and motorcycles | G |
| Retail | Wholesale and retail trade; repair of motor vehicles and motorcycles | G |
| Transportation Logistics Supply Chain and Storage | Transportation and storage | H |
| Accommodation | Accommodation and food service activities | I |
| Technology Information and Media | Information and communication | J |
| Financial Services | Financial and insurance activities | K |
| Holding Companies | Other service activities | K |
| Real Estate and Equipment Rental Services | Real estate activities | L |
| Professional Services | Professional, scientific and technical activities | M |
| Administrative and Support Services | Administrative and support service activities | N |
| Government Administration | Public administration and defence; compulsory social security | O |
| Education | Education | P |
| Hospitals and Health Care | Human health and social work activities | Q |
| Entertainment Providers | Arts, entertainment and recreation | R |
| Indices | Age Range | Pearson coefficient |
| (1) LinkedIn GGI normalised with exclusion query versus LinkedIn GGI normalised without exclusion query NUTS2 | 18-24 | 0.92 *** |
| 25-34 | 0.97 *** | |
| 35-54 | 0.98 *** | |
| 55+ | 0.99 *** | |
| (2) LinkedIn GGI normalised vs Employment GGI | 18-24 | 0.57 ** |
| 25-34 | 0.81 *** | |
| 35-54 | 0.83 *** | |
| 55+ | 0.63 ** | |
| (3) % LinkedIn members working in Company industry by gender vs EUROSTAT % employees working in NACE by gender | 18-24 | 0.67 *** |
| 25-49 | 0.70 *** | |
| 55+ | 0.48 ** | |
| (4) LinkedIn GGI normalised vs Gender Ratio Regular Internet Users in South NUTS2 | 18-24 | 0.85 ** |
| 25-34 | 0.72 * | |
| 35-54 | 0.85 ** | |
| (5) LinkedIn GGI normalised vs Female youth mobility (NUTS2) | 25-34 | 0.82 *** |
| 35-54 | 0.84 *** | |
| (6) LinkedIn GGI (Company industry) vs NACE Employment GGI | 18-24 | 0.88 *** |
| 25-49 | 0.91 *** | |
| 55+ | 0.83 ** |