IXPE and NICER view of Black hole X-ray binary 4U 1630-47: First significant detection of polarized emission in thermal state
Abstract
We present a detailed spectro-polarimetric study of Black hole X-ray binary 4U during its outburst with IXPE and NICER observations. The source is observed in disk dominated thermal state (kT keV) with clear detection of absorption features at keV and keV from both NICER as well as IXPE spectra, likely indicating a coupling of disk-wind. A significant degree of polarization (PD) and polarization angle (PA) in the energy range of keV are measured with IXPE. PD is found to be an increasing function of energy whereas PA remains roughly same within the energy range. Simultaneous energy spectra from NICER in the range of keV are modelled to study the spectral properties. Furthermore, the spin parameter of the black hole is estimated with spectro-polarimetric data as a which is corroborated by NICER observations. Finally, we discuss the implications of our findings.
keywords:
accretion, accretion disks – polarization – techniques: polarimetric – black hole physics – radiation: dynamics – X-ray: binaries – stars: individual (4U )1 Introduction
The spectro-polarimetric study of the emission from Black hole X-ray binaries (BH-XRBs) can reveal the geometry and dynamics of accretion processes. This emission can be of thermal and non-thermal origins. The Keplerian accretion disk (Shakura & Sunyaev, 1973) is considered to produce multi-colour thermal X-ray emission whereas inverse-comptonisation by a ‘hot’ corona (Titarchuk, 1994; Tanaka & Lewin, 1995; Chakrabarti & Titarchuk, 1995) of soft photons emanating from disc is believed to be responsible for higher energy non-thermal emission. These two types of emissions are the major components in the energy spectra, of which one component may dominate in a spectral state of BH-XRBs (Homan et al., 2001; Homan & Belloni, 2005; Remillard & McClintock, 2006; Nandi et al., 2012; Baby et al., 2020; Kushwaha et al., 2021, and references therein).
The X-ray emission during soft state is expected to be linearly polarized parallel to the disk plane as the thermal emission suffers electron scattering in the inner disc region. Similarly, the emission in hard state is believed to be polarized as well but in the direction of normal to the disk plane. Since the seed photons from the disk are up-scattered within corona and produce polarized high energy photons (Stark & Connors, 1977; Connors et al., 1980; Schnittman & Krolik, 2009).
Apart from different spectral states, BH-XRBs are also known for their transient nature wherein the source exhibits sudden increase in flux after a prolonged quiescence phase (Lewin & Livingston, 1995; Bildsten et al., 1997). Such outbursts can last from weeks to months before the source fades into quiescence. The frequency and duration of these outbursts varies from source to source, or sometimes even among different outbursts of the same source itself (Homan et al., 2001; Belloni et al., 2005; Nandi et al., 2012; Sreehari et al., 2018; Sreehari et al., 2019, and references therein).
4U is a recurrent X-ray transient classified as a black hole candidate from its spectral and timing properties (Barret et al., 1996; Abe et al., 2005). It undergoes quasi-periodic outbursts with a recurrence time of days (Parmar et al., 1995). It is located near Galactic plane and has a high absorption column density with N cm-2 (Smith et al., 2002; Ueda et al., 2010) which makes it difficult to estimate the mass (MBH), distance (D) and inclination () of the system. The best estimation of these parameters are M M⊙, kpc and (Kuulkers et al., 1998; Tomsick et al., 1998; Augusteijn et al., 2001; Seifina et al., 2014). NuSTAR observations suggest that the source hosts a maximally rotating BH with spin parameter: = (King et al., 2014). Pahari et al. (2018) obtained the same as using Chandra and AstroSat observations of soft state during the outburst.
4U , till date, has undergone more than outbursts in the years since its detection in . At the time of writing this letter, the source is found to be in another outburst. Moreover, polarization measurement during an outburst of 4U , to the best of our knowledge, has not been reported so far.
In this work, we focus on the spectro-polarimetric study of 4U during its outburst which started on July, and peaked on August, (Jiang et al., 2022). Subsequent to an alert generated by MAXI (Mihara et al., 2011), NICER (Gendreau et al., 2016) and IXPE (Weisskopf et al., 2022) carried out long observations during the outburst under the target of opportunity (ToO) campaign. We make use of IXPE and NICER data to study simultaneous polarimetric and spectral properties of 4U in keV and keV energy bands, respectively.
2 Observations and Data Reduction
| Obs Name | ObsID | Start MJD | Exposure (ksec) | Flux |
|---|---|---|---|---|
| NICER | keV | |||
| N1 | ||||
| N2 | ||||
| N3 | ||||
| N4 | ||||
| N5 | ||||
| N6 | ||||
| N7 | ||||
| N8 | ||||
| N9 | ||||
| N10 | ||||
| N11 | ||||
| N12 | ||||
| N13 | ||||
| IXPE | keV | |||
| X1 | ||||
2.1 IXPE
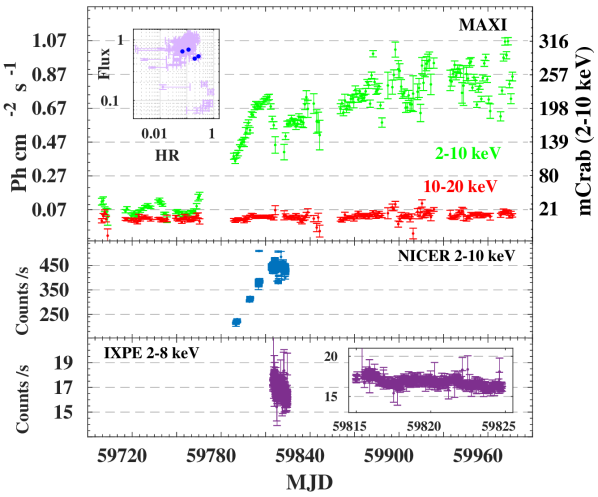
IXPE is an imaging polarimeter (Weisskopf et al., 2022) consisting of three detector units (DUs) which are polarization sensitive in the keV energy range. It observed 4U from Aug, (MJD ) to Sep, (MJD ) for ksec (Table 1). The Level-2 data of the observation are reduced and analysed with IXPEOBSSIMv30.0.0 (Baldini et al., 2022) following the procedure of Farinelli et al. (2023). Further, XPSELECT task is used to extract the source and background event lists. The source is considered within a circular region of and the background region as an annular region with inner & outer radii of & , respectively. Subsequently, the XPBIN task is used to generate the polarization cubes using the PCUBE algorithm. The Stokes I, Q and U spectra of source and background are generated with the PHA1, PHA1Q and PHA1U algorithms. The light curves in keV energy band for the different DUs are generated with the XSELECT task of HEASOFT v6.31.1 and added using the lcmath task to get a combined light curve (see bottom panel of Figure 1).
2.2 NICER
NICER observed the source from Jul, (MJD ) to Sep, (MJD ) which is well overlaps with IXPE observations (see Table 1 and Figure 1). Thirteen observations during this interval are analyzed covering the rising phase of the outburst as well as the peak of the same. The NICERDASv10 software distributed with HEASOFT v6.31.1 is used along with the latest CALDB to reduce the data from the observations. The nicerl2 task is used to perform standard calibration and screening to generate cleaned event lists. The source and background spectra along with the responses are generated in the keV energy band using the nicerl3-spect task. The spectra are rebinned to have a minimum of counts per energy bin for spectral modelling. Further, the light curves for each observation (Figure 1) in the keV energy range are generated using the XSELECT task.
3 Modelling and Results
3.1 Light Curve and Outburst profile
We consider one day averaged MAXI light curves (see top panel of Figure 1) to get a comprehensive picture of the outburst of 4U . The source, after days of inactivity goes into a new outburst in the last few days of July . The MAXI count rate, in energy range of keV, increases from its quiescent value of photons cm-2 s-1 to times on August, (MJD ). At the time of writing this letter, the source is still is in the outburst phase. Moreover, the hardness intensity diagram (HID) generated with MAXI flux ( keV) and the hardness ratio ( keV/ keV) for the entire outburst duration represents an incomplete profile (see Figure 1) when compared with those of previous outbursts in and (Baby et al., 2020). It suggests that the source may remain in this phase for few more days before it declines to quiescent low hard state (LHS).
3.2 Spectral modelling
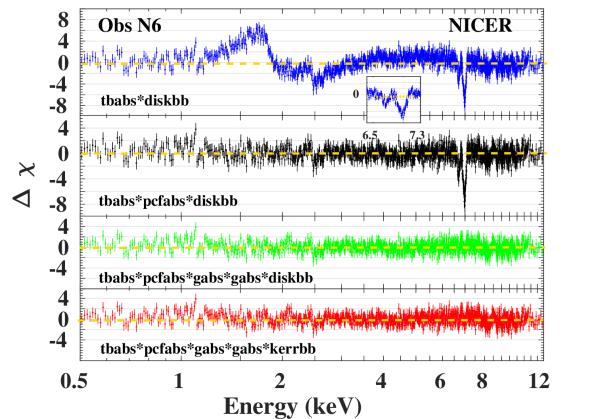
The variability observed in MAXI light curve of 4U motivates us to investigate spectral nature and its evolution during the outburst before we analyse the polarization measurement from IXPE. Therefore, we model NICER spectra, in keV, of all the observations (see Table 1) starting from rising phase to peak of the outburst. We began with Obs. N1 and fit a phenomenological model: tbabs*diskbb. The residuals from the fit do not suggest any requirement of high energy power-law but an absorption below keV is noticed (similar to top panel of Figure 2). Hence, a partial covering component pcfabs is multiplied in the model. This significantly improves the fit and results into a . The instrument originated characteristic Gold emission lines from X-ray optics of NICER are corrected with inclusion of gauss components at and keV. Further, two additional line absorption features are clearly visible in the residual between to keV ( similar to inset of Figure 2) and we model them with gabs components. These disk-wind originated absorption lines are reported previously and attributed to rest frame energies of Fe XXV and Fe XXVI lines at keV and keV, respectively (King et al. (2014); Pahari et al. (2018)). Finally, the overall fit results = and a disk temperature of kTin = keV with absorption lines at energies keV and keV. The hydrogen column density NH is estimated to be atoms cm-2. The estimation of NH is slightly lower than that of Pahari et al. (2018); Baby et al. (2020). This, we attribute to the presence of pcfabs in our model which also has NH from covering column on top of interstellar medium column of hydrogen atoms. Further, similar fit procedure is applied to rest of the NICER observations from Obs. N2 to Obs. N13 with our final phenomenological non-relativistic model tbabs*pcfabs*gabs*gabs*diskbb. The residuals resulting at various steps of fit procedure and from models are provided in Figure 2 from Obs. N6 for illustration. The spectral fits indicate a disk dominated state of the source and a very stable disk temperature of kTin= keV is observed during peak of the outburst phase.
3.3 Spin estimation with Continuum Fitting (CF) method
The spectral modelling shows a disk dominated soft state of the source during outburst. In such state, the energy spectra are suitable for spin estimation with CF method. Hence, we make use of NICER spectra, observed later than the peak of the outburst (Obs. N4 to Obs. N13), to estimate the spin parameter of BH. We follow Kushwaha et al. (2021) to apply CF method and model the spectra with the relativistic model: tbabs*pcfabs*gabs*gabs*kerrbb. The model results into reasonably acceptable fits. The residuals, as previously, rule out any signature of power-law component in high energy till keV (see bottom panel of Figure 2).
We switch off limb-darkening and apply zero torque condition at the inner boundary of the disk in kerrbb component. Moreover, the component is provided with the best estimations of distance to the source (D), inclination of the binary plane () and mass of the BH (MBH) in the binary system based on the work of Pahari et al. (2018) and Baby et al. (2020). Therefore, we fix D = kpc, , M M⊙. The spectral hardening factor () is fixed to a fiducial value of (Shimura & Takahara, 1995; Pahari et al., 2018). The other two parameters of kerrbb namely, accretion rate () and spin parameter (a∗) are allowed to vary freely. For Obs. N4, the overall fit estimates N atoms cm2, a and g s-1 with . Further, similar fit procedure is applied to rest of the observations to estimate the spin parameter. The residuals of best fit model are shown in Figure 2 from Obs. N6 for illustration. We notice that the relativistic model gives better fits (considering values ) than the non-relativistic model and also results into consistent values of spin parameter from all the selected observations during the outburst of 4U along with model generated uncertainties. A detailed analysis with NICER data may be carried out for estimation and error analysis on spin parameter (see Kushwaha et al., 2021) which is out of scope of this work.
3.4 Polarimetric properties
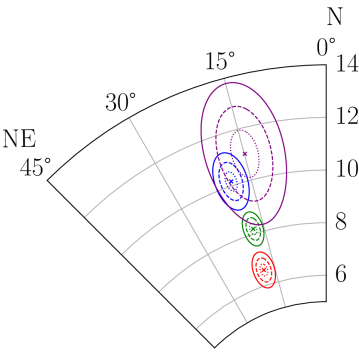
IXPE observed ksec long portion of the outburst of 4U . These observations spanned over days (see Table 1). Simultaneous observations by NICER reveal a stable spectral nature of system (see 3.2 & 3.3). Hence, IXPE observations are very suitable to study polarimetric properties for the first time from this source, using the methodology of Farinelli et al. (2023); Chatterjee et al. (2023); Jayasurya et al. (2023). Firstly, the model-independent PCUBE algorithm (Kislat et al., 2015) is used to determine the normalized Stokes parameters (Q/I & U/I), polarization angle (PA) and polarization degree (PD) in the keV, keV, keV, keV and in the total keV energy ranges, during the Obs. X1. The normalized stokes parameter are provided in Table 3. PA and PD in four energy bands are given in Table 4 and corresponding plots with error contours are presented in Figure 4. We note that the source exhibits significant polarization, with PD = % in keV energy band with all the event data from three DUs combined. The PA in the same energy band is found to be . Moreover, we observe that PD has energy dependence whereas PA is roughly same over the energy range.
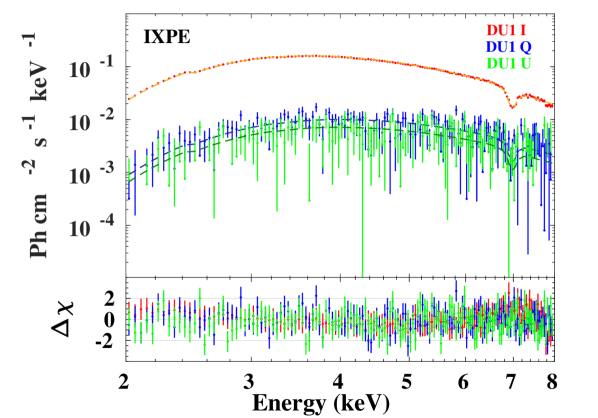
Subsequently, we also perform model-dependent analysis by fitting IXPE Stokes I, Q and U spectra in XSPEC. We borrow the relativistic model as described in 3.3 and insert the multiplicative component polpow which has PA and PD as function of energy. The component defines PD(E) = A E and PA(E) = psiE. The polpow is chosen over polcont component based on the results of PCUBE algorithm. Hence, the model polpow*tbabs*gabs*gabs*pcfabs*kerrbb is applied to fit three Stokes spectra from all the DUs of IXPE at once in XSPEC with the model. Only parameters of polpow component and a∗, of kerrbb are kept free for the fit. All other parameters are frozen to average values obtained from NICER spectral fits of Obs. N4 to Obs. N13. The fit results , as nearly zero and hence, it is fixed to zero which does not affect the overall fit. Finally, the fit procedure results into an acceptable for combined nine spectra (I, Q & U for 3 DUs). The best fit values are provided in the Table 2.
| Components | Parameter | |
|---|---|---|
| polpow | Anorm | |
| Aindex | ||
| psinorm | ||
| psiindex | ||
| tbabs | NH | |
| pcfabs | NH | |
| CvrFract(%) | ||
| kerrbb | a∗ | |
The overall fit of the spectra is shown in Figure 3. Furthermore, the model-dependent polarization results are compared with those obtained in model-independent method by integrating PA(E) and PD(E) in the keV energy band which results PA and PD. We notice PA and PD from two different approaches of PCUBE and XSPEC are in good agreement. We outline that the spin parameters resulting from NICER spectral fits and IXPE polarimetric fits are also in good agreement.
| DU1 | DU2 | DU3 | All DUs | |
|---|---|---|---|---|
| keV | ||||
| Q/I (%) | 6.74 0.29 | 6.47 0.30 | 7.14 0.30 | 6.78 0.17 |
| U/I (%) | 4.23 0.29 | 4.96 0.30 | 5.38 0.30 | 4.85 0.17 |
| keV | ||||
| Q/I (%) | 5.63 0.40 | 4.46 0.41 | 5.81 0.42 | 5.30 0.24 |
| U/I (%) | 3.45 0.40 | 4.27 0.41 | 4.04 0.42 | 3.91 0.24 |
| keV | ||||
| Q/I (%) | 6.29 0.38 | 6.72 0.39 | 7.12 0.39 | 6.70 0.22 |
| U/I (%) | 3.89 0.38 | 4.71 0.39 | 5.61 0.39 | 4.71 0.22 |
| keV | ||||
| Q/I (%) | 8.23 0.64 | 8.38 0.66 | 7.49 0.66 | 8.04 0.38 |
| U/I (%) | 5.43 0.64 | 6.75 0.66 | 6.52 0.66 | 6.22 0.38 |
| keV | ||||
| Q/I (%) | 9.33 1.55 | 8.09 1.64 | 11.30 1.61 | 9.57 0.92 |
| U/I (%) | 5.74 1.55 | 4.18 1.64 | 6.49 1.61 | 5.48 0.92 |
| keV | keV | keV | keV | keV | |
|---|---|---|---|---|---|
| PCUBE | |||||
| PD (%) | 8.33 0.17 | 6.58 0.24 | 8.19 0.22 | 10.17 0.38 | 11.02 0.92 |
| PA (∘) | 17.78 0.60 | 18.21 1.02 | 17.56 0.78 | 18.87 1.06 | 14.90 2.40 |
4 Discussion and Conclusion
In this letter, we report the significant detection of X-ray polarization from a recurrent transient BH-XRB 4U by IXPE during its outburst in . The polarization properties are consolidated with simultaneous spectral studies by NICER observations.
The most intriguing finding from our investigation is a substantial degree of polarization (PD) = % ( statistical confidence) in disk dominated outburst phase of the source in keV energy range. The energy resolved PD reaches as high as ( statistical confidence) in keV. These measurements are significantly higher when compared to those predicted from existing models (Dovčiak et al., 2008; Schnittman & Krolik, 2009; Taverna et al., 2020). Although the increasing nature of PD within keV energy range is similar as depicted by the models. This indicates that additional physical processes and effects are in play on top of electron scattering on the surface of disk along with reflection of return radiation from the near side of the disk which can further enhance the PD.
Recently, Krawczynski et al. (2022) reported polarization properties of Cygnus X-1 in LHS, and found that the observed PD is approximately twice as high as expected. These polarimetric results favour the presence of the coronal plasma in wedge shaped geometry with in the system. In the case of 4U , such strong Compton scattering medium like corona may not be present as the NICER spectra during the outburst show no signature of high energy tail. But, a weak corona may be present as observed in previous outbursts (Pahari et al., 2018; Baby et al., 2020). A weak corona may contribute to some extent in the net observed PD.
Another plausible contribution in PD could be from scattering of the photons in an obscuring medium generated by disk-wind between inner regions of the disk and an observer. The strong evidence of disk-wind comes from the NICER spectral modelling. The spectra during the outburst exhibit presence of partial covering over the disk radiation and absorption line features of Fe XXV and Fe XXVI at rest frame energies keV and keV respectively (see Figure 2). These absorption features are also present in IXPE-I spectrum but the two lines are merged, resulting in a broad absorption dip (see Figure 3). Due to poor statistics, the presence of the absorption feature is not clear in IXPE-Q and U spectra. Although the difference in intensities of the absorption lines, if they were present, in Q and U spectra would have provided an important piece of evidence about the origin of polarized emission from disk-wind. Recently, similar absorption features associated with disk-wind are also observed in outburst of 4U (Prabhakar et al., 2023).
Disk-wind in soft states may have a column density up to N cm-2 in the equatorial direction. A rough qualitative estimates are provided and discussed by Ratheesh et al. (2021). The wind may be fully ionized but Compton thick in the equatorial direction. The effective column density and therefore PD may vary with inclination angle () with respect to a distant observer. Hence, the polarized signature of 4U may be affected by disk-wind and its geometry.
We also estimate the associated electric field angle as PA = which remains mostly same within the keV energy range of IXPE. The paucity of radio observations and measurements of jet angle from the source prevented us to relate it with geometry of the system. Although we note that the PA is comparable to minus the inclination of the binary plane. In case of Cygnus X-1, PA is found to align with jet angle, which is assumed to be parallel to BH spin axis or normal to disk plane (Krawczynski et al., 2022).
Furthermore, PD and PA are estimated with spectro-polarimetric modelling in XSPEC as and , respectively. These model-dependent estimations of PD and PA are in good agreement with those computed from model-independent PCUBE algorithm. The values lie within uncertainties.
The spectro-polarimetric fit of IXPE data with relativistic model also constrains the BH spin parameter: a and accretion rate: g s-1. The is shown to be related to the mass loss rate through disk-wind outflow in 4U and other BH-XRBs (Neilsen et al., 2011; Ponti et al., 2012).
We compare the value of a∗ with that obtained by applying CF method on NICER spectra during peak of the outburst which resulted a. The spin parameter estimated with two different approaches are in good agreement. The estimations are also in line with findings of Pahari et al. (2018), whereas King et al. (2014) indicated presence of a maximally rotating BH in the system. Recent measurement by Insight-HXMT suggests a slow rotating BH with a ( statistical error) Liu et al. (2022). Here, we highlight the fact that estimation of spin parameter is highly dependent on , D and M.
To summarize, we report a significant detection of polarized emission from 4U during its outburst in . The observed high degree of polarization may be due to combined effects from the accretion disk, disk-wind and a weak corona in the system. The spin of the black hole is also estimated with spectro-polarimetric data of IXPE.
Acknowledgements
We thank the anonymous reviewer for careful reading of our manuscript to provide insightful comments and suggestions that significantly improved the manuscript in terms of both science as well as writing. Authors thank GH, SAG; DD, PDMSA and Director, URSC for encouragement and continuous support to carry out this research. IXPE, NICER and MAXI teams are also thanked for providing data products and software tools for data analysis.
Data Availability
Data used for this work are available at HEASARC website (https://heasarc.gsfc.nasa.gov/docs/archive.html) and MAXI website (http://maxi.riken.jp/top/index.html).
References
- Abe et al. (2005) Abe Y., Fukazawa Y., Kubota A., Kasama D., Makishima K., 2005, PASJ, 57, 629
- Augusteijn et al. (2001) Augusteijn T., Kuulkers E., van Kerkwijk M. H., 2001, A&A, 375, 447
- Baby et al. (2020) Baby B. E., Agrawal V. K., Ramadevi M. C., Katoch T., Antia H. M., Mandal S., Nandi A., 2020, MNRAS, 497, 1197
- Baldini et al. (2022) Baldini L., et al., 2022, SoftwareX, 19, 101194
- Barret et al. (1996) Barret D., McClintock J. E., Grindlay J. E., 1996, ApJ, 473, 963
- Belloni et al. (2005) Belloni T., Homan J., Casella P., van der Klis M., Nespoli E., Lewin W. H. G., Miller J. M., Méndez M., 2005, A&A, 440, 207
- Bildsten et al. (1997) Bildsten L., et al., 1997, ApJS, 113, 367
- Chakrabarti & Titarchuk (1995) Chakrabarti S., Titarchuk L. G., 1995, ApJ, 455, 623
- Chatterjee et al. (2023) Chatterjee R., Agrawal V. K., Jayasurya K. M., Katoch T., 2023, arXiv e-prints, p. arXiv:2301.13394
- Connors et al. (1980) Connors P. A., Piran T., Stark R. F., 1980, ApJ, 235, 224
- Dovčiak et al. (2008) Dovčiak M., Muleri F., Goosmann R. W., Karas V., Matt G., 2008, MNRAS, 391, 32
- Farinelli et al. (2023) Farinelli R., et al., 2023, MNRAS, 519, 3681
- Gendreau et al. (2016) Gendreau K. C., et al., 2016, in den Herder J.-W. A., Takahashi T., Bautz M., eds, Society of Photo-Optical Instrumentation Engineers (SPIE) Conference Series Vol. 9905, Space Telescopes and Instrumentation 2016: Ultraviolet to Gamma Ray. p. 99051H, doi:10.1117/12.2231304
- Homan & Belloni (2005) Homan J., Belloni T., 2005, Ap&SS, 300, 107
- Homan et al. (2001) Homan J., Wijnands R., van der Klis M., Belloni T., van Paradijs J., Klein-Wolt M., Fender R., Méndez M., 2001, ApJS, 132, 377
- Jayasurya et al. (2023) Jayasurya K. M., Agrawal V. K., Chatterjee R., 2023, arXiv e-prints, p. arXiv:2302.03396
- Jiang et al. (2022) Jiang J., Tomsick J., Liu H., Fabian A., Connors R., Garcia J., Hare J., 2022, The Astronomer’s Telegram, 15575, 1
- King et al. (2014) King A. L., et al., 2014, ApJ, 784, L2
- Kislat et al. (2015) Kislat F., Clark B., Beilicke M., Krawczynski H., 2015, Astroparticle Physics, 68, 45
- Krawczynski et al. (2022) Krawczynski H., et al., 2022, Science, 378, 650
- Kushwaha et al. (2021) Kushwaha A., Agrawal V. K., Nandi A., 2021, MNRAS, 507, 2602
- Kuulkers et al. (1998) Kuulkers E., Wijnands R., Belloni T., Méndez M., van der Klis M., van Paradijs J., 1998, ApJ, 494, 753
- Lewin & Livingston (1995) Lewin W. H. G., Livingston W., 1995, Journal of the British Astronomical Association, 105, 284
- Liu et al. (2022) Liu Q., Liu H., Bambi C., Ji L., 2022, MNRAS, 512, 2082
- Mihara et al. (2011) Mihara T., et al., 2011, PASJ, 63, S623
- Nandi et al. (2012) Nandi A., Debnath D., Mandal S., Chakrabarti S. K., 2012, A&A, 542, A56
- Neilsen et al. (2011) Neilsen J., Remillard R. A., Lee J. C., 2011, ApJ, 737, 69
- Pahari et al. (2018) Pahari M., et al., 2018, ApJ, 867, 86
- Parmar et al. (1995) Parmar A. N., Angelini L., White N. E., 1995, ApJ, 452, L129
- Ponti et al. (2012) Ponti G., Fender R. P., Begelman M. C., Dunn R. J. H., Neilsen J., Coriat M., 2012, MNRAS, 422, L11
- Prabhakar et al. (2023) Prabhakar G., Mandal S., G R B., Nandi A., 2023, MNRAS,
- Ratheesh et al. (2021) Ratheesh A., Tombesi F., Fukumura K., Soffitta P., Costa E., Kazanas D., 2021, A&A, 646, A154
- Remillard & McClintock (2006) Remillard R. A., McClintock J. E., 2006, ARA&A, 44, 49
- Schnittman & Krolik (2009) Schnittman J. D., Krolik J. H., 2009, ApJ, 701, 1175
- Seifina et al. (2014) Seifina E., Titarchuk L., Shaposhnikov N., 2014, ApJ, 789, 57
- Shakura & Sunyaev (1973) Shakura N. I., Sunyaev R. A., 1973, A&A, 500, 33
- Shimura & Takahara (1995) Shimura T., Takahara F., 1995, ApJ, 445, 780
- Smith et al. (2002) Smith R. K., Edgar R. J., Shafer R. A., 2002, ApJ, 581, 562
- Sreehari et al. (2018) Sreehari H., Nandi A., Radhika D., Iyer N., Mandal S., 2018, Journal of Astrophysics and Astronomy, 39, 5
- Sreehari et al. (2019) Sreehari H., Ravishankar B. T., Iyer N., Agrawal V. K., Katoch T. B., Mandal S., Nandi A., 2019, MNRAS, 487, 928
- Stark & Connors (1977) Stark R. F., Connors P. A., 1977, Nature, 266, 429
- Tanaka & Lewin (1995) Tanaka Y., Lewin W. H. G., 1995, in X-ray Binaries. pp 126–174
- Taverna et al. (2020) Taverna R., Zhang W., Dovčiak M., Bianchi S., Bursa M., Karas V., Matt G., 2020, MNRAS, 493, 4960
- Titarchuk (1994) Titarchuk L., 1994, ApJ, 434, 570
- Tomsick et al. (1998) Tomsick J. A., Lapshov I., Kaaret P., 1998, ApJ, 494, 747
- Ueda et al. (2010) Ueda Y., et al., 2010, ApJ, 713, 257
- Weisskopf et al. (2022) Weisskopf M. C., et al., 2022, Journal of Astronomical Telescopes, Instruments, and Systems, 8, 026002