Multiwavelength study of radio galaxy Pictor A: detection of western hotspot in far-UV and possible origin of high energy emissions
Abstract
A comprehensive study of the nucleus and western hotspot of Pictor A is carried out using AstroSat observations, years of Fermi, and archival Swift observations, along with other published data. We report the first detection of the western hotspot of Pictor A in the far-UV band using observations from AstroSat-UVIT. The broad-band SED of the western hotspot is explained by a multizone emission scenario where X-ray emission is caused by synchrotron emission process in the substructures embedded in the diffuse region, while the emission in radio to optical is caused by synchrotron emission process in the diffuse region. We do not notice any excess in the IR band and an additional zone (beyond 2-zone) is not required to account for the X-ray emission. Our broad-band spectro-temporal study and associated modelling of the core and hotspot of Pictor A suggests that (a) -rays originate in the nuclear jet and not from the hotspot (b) X-ray emission from the core of Pictor A has nuclear jet-origin instead of previously reported disk-origin.
keywords:
galaxies: active — galaxies: jets — gamma-rays: galaxies — X-rays: galaxies—quasar: individual (Pictor A)1 Introduction
Radio-loud Active Galactic Nuclei (AGN), characterised by powerful jets, are termed Radio Galaxies. Based on radio morphology, radio galaxies have been classified into Fanaroff-Riley (FR) I and FR II (Fanaroff & Riley, 1974). The luminous, edge-brightened, double radio sources, termed FR II, comprise “hotspots” near the outermost edges of their extended lobes. The hotspots have high radio surface brightness and are believed to be a consequence of the strong terminal shock at the end of the jet flow. The first-order Fermi acceleration at a strong shock accelerates electrons to ultra-relativistic energies. The synchrotron emission and synchrotron self-Compton (SSC) emission by these ultra-relativistic electrons could be the prime source of emission from the hotspot (e. g. Perley et al., 1997; Hardcastle et al., 2004). However, the emission mechanism in the hotspot is still a matter of debate. The multiwavelength observations of the core, jet and hotspots of the FR II sources can provide observational constraints on physical parameters and are crucial to investigate the structure and emission processes prevailing in these sources.
Broad-line radio galaxies (BLRGs) are a class of radio-loud AGNs with jets not directly pointing towards the observer. Hence, they exhibit both the disk-related and jet-related signatures in their broadband spectra and are, therefore, suitable candidates to investigate the disk-jet connection (Kataoka et al., 2011). Pictor A is a nearby BLRG (Danziger et al., 1977) located at a redshift of . The core and the primary hotspot of Pictor A, the western hotspot (WHS), are resolved in radio, infrared, optical and X-ray bands. The proximity and brightness of Pictor A makes it an ideal candidate for spatial study of the large scale jets in FR II sources.
A detailed study of Pictor A in the radio band revealed parsec-scale jet structure near core emission and complex compact components in WHS (e. g. Perley et al., 1997; Tingay et al., 2000; Tingay et al., 2008). The core and WHS emission were also investigated at infrared, optical and NUV wavebands (e. g. Roeser & Meisenheimer, 1987; Singh et al., 1990; Thomson et al., 1995; Simkin et al., 1999; Wilson et al., 2001; Isobe et al., 2017, 2020). Observations in the FUV band, along with IR, optical and NUV observations, could play an important role in constraining the accretion disk emission and particle energy distribution in the core and hotspot. However, no FUV observations of the core and hotspot have been reported to date.
Various studies were carried out to understand the origin of the X-ray emission from the core of Pictor A. Though different models were examined, most of these studies have reported that the power law model can best explain the core spectrum of Pictor A (e. g. Kriss, 1985; Singh et al., 1990; Padovani et al., 1999; Sambruna et al., 1999; Eracleous & Halpern, 1998; Eracleous et al., 2000; Grandi et al., 2002, 2006; Hardcastle et al., 2016). Grandi et al. (2002, 2006) attempted to explain the BeppoSAX observations of the core with complex models (reflection component, Fe-K line, power-law with exponential cut-off, soft excess). However, none of the spectral parameters could be constrained in their studies, and the spectrum was best explained with a power law. The absence/weak Fe-K line in previous studies indicate the presence of advection-dominated accretion flow (ADAF) in the inner accretion disk. Utilising multiple Chandra observations spread over 15 years (2000-2015), Hardcastle et al. (2016) reported a power-law model for the X-ray spectrum of the Pictor A core. Due to limited photon statistics, they could not search for the Fe-K line for any individual epoch of observation but noticed a narrow Gaussian feature at keV for the combined data set. They further noticed that the derived equivalent width is inconsistent with the upper limit reported by Sambruna et al. (1999). This inconsistency could be due to the variable nature of the line. Ricci et al. (2017) and Kang et al. (2020) studied the X-ray spectral properties of Pictor A core and assumed that the X-ray emission primarily originates in the disk-corona system. The most notable and key aspect of coronal emission is the high energy cut-off (E) in the spectrum, which is a measure of the coronal temperature (T). However, both these studies reported non-detection/marginal detection of the E in the X-ray spectrum of Pictor A. Also, the Fe-K line could not be constrained in their studies. These findings imply a weak corona and/or high jet contamination in the X-ray emission of Pictor A.
The WHS of Pictor A exhibits complex X-ray spectra which might be originated in the substructures present in the hotspot (Wilson et al., 2001; Tingay et al., 2008; Zhang et al., 2009). Hardcastle et al. (2016) fitted spectral models to the individual Chandra epochs and also to the combined spectrum of the entire WHS region using multiple observations spread over 2000-2015. Due to limited photon statistics, they could only constrain a single power law spectral model during an individual epoch of observation. They further reported that a broken power law spectral model best explains the combined spectrum of the entire WHS region. However, this broken power law nature of the combined WHS spectra could be due to the observed temporal variability of the WHS X-ray flux. Also, the wide-band X-ray spectrum of WHS of Pictor A in keV using observations from Chandra, XMM-Newton, and NuSTAR is well described by a featureless power-law model (Sunada et al., 2022).
Pictor A was not detected in the -ray band by Fermi Large Area Telescope (LAT) during its first two years of operation (Ackermann et al., 2011). With the modelling of the broadband spectral energy distribution (SED) of the core and WHS of Pictor A, Zhang et al. (2009) speculated the WHS origin of the -ray emission. Kataoka et al. (2011) attempted to explain the broadband SED of Pictor A core with a “simple phenomenological “hybrid” model”. They assumed the IR to X-ray emissions primarily to have a thermal origin and scaled the Seyfert SED template (Koratkar & Blaes, 1999) to model it. They further considered that the 5 GHz radio flux and the upper limit of the -ray flux have a jet origin and scaled the broadband SED of 3C 273 (Soldi et al., 2008) to explain it. However, the studies of both Zhang et al. (2009) and Kataoka et al. (2011) were limited due to the non-detection of the source in the -ray band. Furthermore, the model used by Kataoka et al. (2011) was an oversimplification of a realistic situation for the following reasons: (a) For typical blazars like 3C 273 the jet inclination angle is small (), and their SEDs are characterised by high bulk Lorentz factors in comparison to misaligned active galaxy (MAGN) like Pictor A. (b) Due to the variable nature of AGN, it may not be appropriate to use only a scaled 3C 273 template to explain jet emission from any other AGN.
Wilson et al. (2001) noticed that the X-ray emission from the WHS cannot be explained by a simple extension of the radio to optical spectrum at higher energy, neither a single zone SSC model could explain the observed X-ray spectral index. Utilizing the first three years of observations from Fermi-LAT, Brown & Adams (2012) detected Pictor A in the -ray band and also reported flux variability of 1 year. However, the core/jet/WHS could not be resolved due to inadequate spatial resolution of the LAT. From the SED modelling of the WHS, they suggested that in the scenario where the -ray emission is produced by the SSC process, the WHS cannot be the primary site of its origin. Based on the observed -ray flux variability of less than a year timescale, coupled with findings from SED modelling of the WHS, Brown & Adams (2012) attributed the observed -ray emission to the jet of Pictor A. However, their work was limited due to the lack of good-quality multi-band data. Also, they did not carry out the SED modelling of the core.
The origin of high energy emissions in Pictor A is still a matter of debate. The detailed study of construction and modelling of the multiwavelength SEDs of the core and WHS of Pictor A, essential to identify the origin of high energy emission, has not yet been carried out. To understand the emission mechanism at work in this source, we have carried out the construction and modelling of average broadband SED of the core and WHS of Pictor A utilising years of Fermi observations (2008-08-04 to 2021-08-04), new AstroSat observations and other archival data. Details of the analysis of multiwavelength data used in this work are given in Section 2. In Section 3, we discuss our findings, followed by a conclusion in Section 4.
2 Data and Analysis
| PL | LP | |
|---|---|---|
| TS | ||
| fluxa | ||
| alpha | ||
| beta | - | |
| TScurve | - | 0.13 |
a Flux in 0.1 - 100 GeV in units of ph cm-2 sec-1
2.1 GeV data
Thirteen years of ‘Pass 8’ data from Fermi-LAT were analysed utilizing Fermitools version 1.2.23 with a ‘P8R3_SOURCE_V2’ response function following the methodology given in Gulati et al. (2021) and also briefed in Appendix C. Three new sources (Source 1: 74.839, -45.481; Source 2: 78.535, -40.083; and Source 3: 82.027, -46.875) were detected with TS and were added to the model. Similar to the averaged -ray spectra provided in the latest Fermi-LAT catalogues (4FGL-DR2: Ballet et al. (2020); 4FGL-DR3: Abdollahi et al. (2022)), no significant curvature was noticed in the years averaged -ray spectrum of Pictor A. The 13 years averaged flux and spectral parameters are given in Table 1. An improvement in the detection significance, compared to Fermi catalogues, reported in this work using 13 years data set could be attributed to the increased photon statistics and indicates that the source was not in a very low activity state. The bi-monthly -ray lightcurve was generated for 13 years of Fermi-LAT observations (discussed in Section 3). Also, the average -ray flux was calculated during the intervals with overlapping Swift, Chandra, and AstroSat observations. Details are given in Appendix C.
2.2 X-ray data
For X-rays, we used data from the Swift X-ray Telescope (Swift-XRT; Burrows et al., 2005) that covers the energy range of keV as well as Soft X-ray Telescope (SXT; Singh et al. 2017) and the Large Area X-ray Proportional Counter (LAXPC; Yadav et al. 2016; Antia et al. 2017) onboard AstroSat (Agrawal, 2006; Singh et al., 2014; Rao et al., 2016). The energy ranges of SXT and LAXPC are keV and keV, respectively.
The X-ray spectra generated from these instruments, as described in the following sections, were fitted using a single power law with the Galactic absorption component. The intrinsic absorption was not considered to fit the spectra since no excess absorption has been reported by Hardcastle et al. (2016) using observations from Chandra, which has much better sensitivity in the soft X-ray band.
2.2.1 Swift-XRT
Swift-XRT observed Pictor A 12 times during 2010-2021. We used the online ‘Swift-XRT data products generator’ (Evans et al., 2009) to create spectral data products for the core and WHS of Pictor A. The individual IDs with the nearby time of observations, and hence with minimum variation in instrument response, are combined. This results in 5 batches for which flux and photon indices were derived for the core of Pictor A (Appendix A). The weighted average of these flux and photon indices is given in Table 2. The WHS could not be detected in any of these batches. Therefore to calculate the average X-ray spectrum for WHS, we segregated the data into two batches based on the change in the redistribution matrix file (RMF) only. The WHS could not be detected in the first batch. The flux and photon index for the WHS was calculated for the second batch. The results of the spectral fitting are given in Table 2. Details are given in Appendix A.
2.2.2 AstroSat
We observed Pictor A with AstroSat-SXT and LAXPC on January 14-15, 2018, for 19 and 30 ks, respectively. Due to the large source extraction region of AstroSat-SXT ( arcmin radius) and large field of view of non-imaging AstroSat-LAXPC (), the emission from the core and WHS could not be analysed separately. A combined core and WHS spectrum was derived in keV band using SXT observations and keV using LAXPC 111LAXPC data was analysed using the analysis software “laxpc_soft” package (August 04, 2020 version) available at the AstroSat Science Support Cell http://astrosat-ssc.iucaa.in/?q=data_and_analysis. observations following the methodology given in Gulati et al. (2021). The AstroSat-SXT and LAXPC analysis results for Pictor A are given in Table 2.
| Instrument | Energy range | Region | Flux | |
|---|---|---|---|---|
| Swift-XRT | 0.3-10.0 keV | core | ||
| WHS | ||||
| SXT | keV | a | ||
| LAXPC | keV | a |
aUnabsorbed flux in units of erg cm-2s-1
bUnabsorbed flux in units of erg cm-2s-1
cPhoton index of power-law model
2.3 UV/Optical data
2.3.1 AstroSat-UVIT
Pictor A was observed with Ultra-Violet Imaging Telescope (UVIT; Kumar et al. 2012; Tandon et al. 2017) onboard AstroSat in far-UV (FUV) filter: BaF2 (exposure time ks) and near-UV (NUV) filters: NUVB15 (exposure time ks and NUVB4 (exposure time ks). The science-ready Level-2 images provided by the Indian Space Science Data Centre (ISSDC) (processed by pipeline version ) were used to carry out standard photometry using IRAF 222IRAF is distributed by the National Optical Astronomy Observatory, which is operated by the Association of Universities for Research in Astronomy (AURA) under a cooperative agreement with the National Science Foundation.
To obtain astrometric corrections for the Level-2 images, we first derived astrometric corrections for NUV images with Gaia-early data release 3 (EDR3) catalogue (Gaia Collaboration et al., 2021) using SCAMP software (Bertin, 2006). The NUVB4 image corrected for astrometry using the Gaia-EDR3 catalogue was then used to obtain astrometric solutions for the FUV image. We report the first detection of the WHS in the FUV band (: ; : ).
The FUV image from AstroSat-UVIT of Pictor A field with core and WHS marked is shown in Fig 1.
A circular aperture of pixels and a background region of pixels was used for photometry. The derived magnitudes were converted into fluxes (Tandon et al., 2017) and corrected for galactic extinction using Cardelli et al. (1989) and Schlafly & Finkbeiner (2011). The estimated flux was also corrected for the chosen aperture size using Table 11 of Tandon et al. (2020). Further, correction for intrinsic absorption was also carried out in the derived flux values following the methodology explained in Appendix B. The extinction corrected fluxes in three UVIT filters are given in Table 3.

| Instrument | Filter | (Å) | Corea | Hotspota |
| AstroSat-UVIT | BaF2 (F2) | |||
| NUVB15 (F2) | ||||
| NUVB4 (F5) | ||||
| Swift-UVOT | V | |||
| B | ||||
| U | ||||
| UVW1 | ||||
| UVM2 | ||||
| UVW2 |
aFlux in erg cm-2s-1Hz-1
2.3.2 Swift-UVOT
The source has been observed by Swift-UVOT (Roming et al., 2005) during 12 epochs. The level 2 products 333https://heasarc.gsfc.nasa.gov/cgi-bin/W3Browse/w3browse.pl were analysed using different tasks that are a part of the heasoft (v 6.28) and the 20200724 version of the caldb. The uvotimsum task was used to merge the different observations. The task uvotdetect was used to determine the coordinates of the WHS. The coordinates of the WHS derived were in agreement with the coordinates reported by Roeser & Meisenheimer (1987). For photometry of the core (and WHS), a circular region with radius centred at the core (and WHS) position and an annular background region with inner and outer radii of and was used. uvotsource task was used to get the magnitude and flux of the core (and WHS), which was further corrected for galactic extinction using Cardelli et al. (1989) and Schlafly & Finkbeiner (2011). The derived flux values were also corrected for intrinsic absorption following the methodology explained in Appendix B. The extinction corrected fluxes for the core (and WHS) in different UVOT filters are given in Table 3. The UVOT flux was also calculated during the batches defined in Appendix A. Details are given in Appendix B.
3 Results
One of our aims is to study any possible temporal multi-band correlation, including the -ray band. Therefore, we only consider X-ray observations of this source carried out after the launch of the Fermi (August 2008). The Swift-XRT observation has near simultaneous coverage in the UV/optical band from Swift-UVOT, which is essential for a multi-band correlation study, and, therefore, is crucial for this work.
The average -ray flux was derived using Fermi-LAT data around the overlapping period of Swift observations defined in Appendix A. We also consider X-ray observations from Chandra, AstroSat-SXT, and AstroSat-LAXPC along with Swift-XRT to study the X-ray - -ray correlation. We have used the analyzed Chandra data of the core of Pictor A presented in Figure 2 by Hardcastle et al. (2016). The source was detected in the -ray band by Fermi only during two Chandra epochs (Appendix C). During the AstroSat observing period, the source was not detected in the -ray band (Appendix C).
We calculated the Pearson correlation coefficient on simulated data which is generated using Monte-Carlo simulations by considering the uncertainties in the flux values. The median value of the derived Pearson correlation coefficient is taken as the final correlation value. The median absolute deviation (MAD) (Rousseeuw & Croux, 1993; Richards et al., 2011) is considered as a measure of the uncertainty in the estimated correlation value. The X-ray and UV/optical emission from the core of Pictor A show a strong positive correlation with Pearson correlation coefficient . Though the source is weak in the -ray band, a positive correlation of -ray flux with both, X-ray and UV/optical bands, is noticed with correlation value of . The details of the correlation study are given in Appendix D. The positive correlation noticed among these three bands implies the same site of origin of these emissions.
It was also noticed during batch 5 that the -ray flux shows an order of magnitude increase with respect to 13 of years averaged flux during January 23-29, 2021 (Appendix C), which is also accompanied by an increase in X-ray and UV/optical flux. Such an increase in -ray flux has not been reported earlier for this source.
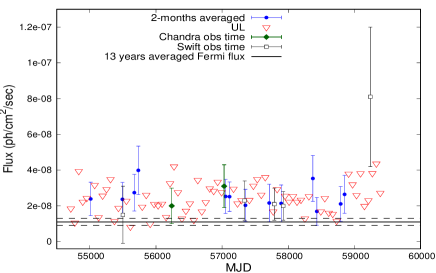
In the bi-monthly -ray lightcurve, as shown in Fig. 2, the source could not be detected in most of the time bins, and the corresponding upper limits of the flux are derived. Also, for the time bins where the source is detected, the corresponding derived flux values have large uncertainties. It is to be noted that the upper limits in Fig. 2 do not exclude flux levels comparable to those of the detections. Hence, there is a possibility that the source flux during these bins where the source was not detected may not be much lower than the estimated upper limits. Under such a scenario, one would expect to have the long-term averaged source flux similar to the detected source flux or upper limits. The 13-years averaged -ray flux of this source is noticeably lower than most of the detected flux and upper limit values (Fig. 2). Therefore, the source flux during the time bins where it was not detected is required to be much lower than the corresponding upper limits. The relatively lower long-term averaged -ray flux suggests the variable nature of this source.
A detailed study of the January 2021 multiwavelength flare and also the variability of this source will be the subject of a subsequent paper. Further, we have carried out SED modelling of the core and WHS of Pictor A to identify the possible site of these emissions.
3.1 Modelling of the core SED
The ‘Jets SED modeler and fitting Tool (JetSeT)’ (v 1.1.2) (Massaro et al., 2006; Tramacere et al., 2009, 2011; Tramacere, 2020) was used to model the SEDs of the core and WHS.
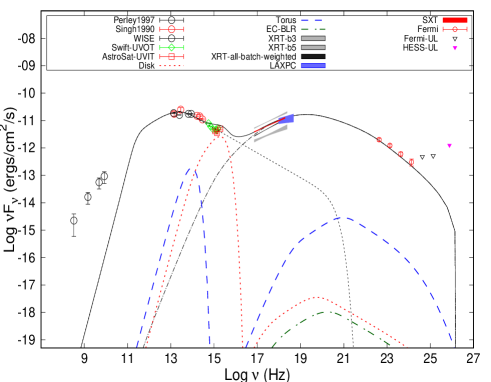
To construct the broadband SED of the core, we have used the radio data from Perley et al. (1997). IR data was used from Singh et al. (1990) and Wide-field Infrared Survey Explorer (WISE) (Cutri et al., 2013). The emission from the core was estimated in the UV band using observations from Swift-UVOT and AstroSat-UVIT. Our analysis of Swift-XRT data shows that the core emission in X-rays is orders of magnitude higher than the WHS emission. Hence the integrated X-ray emission from the core and WHS obtained in SXT and LAXPC is expected to be dominated by core emissions. The spatial resolution of Fermi was also inadequate to resolve the core and WHS emission in the -ray band (Appendix C). The flux upper limit in very high energy -rays using HESS observations is taken from Aharonian et al. (2008).
We modelled the SED within a single-zone leptonic synchrotron and inverse Compton emission scenario, where the relativistic electrons are injected into a spherical region of radius , which moves relativistically along the jet with bulk Lorentz factor under the influence of the magnetic field of strength . The blob size is constrained considering the observed -ray variation of week timescale.
The energy distribution of relativistic jet electrons was considered as a broken power law. Considering that X-ray core emission is primarily from the nuclear jet (sub-parsec/parsec scale), we constrain the bulk Lorentz factor () and jet inclination angle () value from the core to counter-jet X-ray flux ratio (Hardcastle et al., 2016). From the core to counter-jet X-ray flux ratio, we infer the value of and . Here, is the speed of the emitting blob in the unit of light velocity. A jet inclination angle of corresponds to a value of . Hence, we considered and for modelling.
The observed -ray emission from a typical flat spectrum radio quasar (FSRQ) is much higher than the predicted SSC emission. It is noticed that the inverse Compton emission from the accretion disk, BLR and/or torus by the jet electrons could explain the observed -ray emission in these sources (e. g. Dermer & Schlickeiser, 1993; Sikora et al., 1994; Błażejowski et al., 2000; Palma et al., 2011; Bhattacharya et al., 2021). The observed broadband emission from the Pictor A core is well explained by synchrotron and SSC emissions. Following the methodology adopted by Paliya et al. (2021), we estimated the accretion disk luminosity and BLR luminosity from the observed optical line emission (Sulentic et al., 1995). We noticed that the core optical-UV emission is dominated by synchrotron emission and, unlike a typical FSRQ, the contribution from various external Compton (EC) processes (from disk, BLR, and torus) is insignificant for this misaligned active galaxy. The details of possibility of EC scenario in core emission is given in Appendix 4. Therefore, in our modelling, we only consider synchrotron and SSC emission to explain the observed broadband SED of Pictor A. We also consider synchrotron self-absorption of radiation by the relativistic electrons while carrying out spectral modelling.

| Parameter | Symbol | Core | Hotspot | |
|---|---|---|---|---|
| Diffuse | Substructure | |||
| Radius of the blob | (cm) | |||
| Bulk Lorentz factor | ||||
| Jet viewing angle | ||||
| Magnetic Field | (Gauss) | |||
| Minimum electron Lorentz factor | ||||
| Maximum electron Lorentz factor | ||||
| Break Lorentz factor | ||||
| Cut-off energy | - | |||
| Spectral index (before break) | ||||
| Spectral index (after break) | ||||
| Equipartition ratio | UUB | |||
| Parameter | Core | Hotspot | |
|---|---|---|---|
| Diffuse | Substructure | ||
The SED model parameters are given in Table 4 and the corresponding jet energetics in Table 5. To derive the jet power of cold protons, we consider one proton per electron (Ghisellini et al., 2010). Our modelling suggests that the IR and UV/optical emissions are well explained by synchrotron emission. The SSC emission process explains X-ray and -ray emission in the parsec-scale jet, which falls within the extraction/analysis region (Fig. 3). The observed correlated variability between -ray, optical/UV, and X-ray lightcurves further supports the synchrotron and SSC origin of the observed core optical/UV and X-ray emissions, respectively.
3.2 Modelling of WHS SED
We analyzed data from Swift-UVOT, AstroSat-UVIT and Swift-XRT to construct the broadband SED of WHS of Pictor A. In addition, we have also used the radio to optical data from Isobe et al. (2020) (and references therein).
While modelling the broadband SED of the WHS of Pictor A, Brown & Adams (2012) attempted to explain the observed X-ray emission by the SSC process. However, they have used the X-ray data from Migliori et al. (2007), which corresponds to the X-ray emission from the diffuse regions of the lobes of Pictor A. Hence, their finding of the SSC origin of the X-ray emission from the WHS is not robust.
In this work, as a first step, we began with a single-zone leptonic model that includes synchrotron and SSC emission by non-thermal relativistic electrons, in a stationary blob () in AGN jet (Massaro et al., 2006; Tramacere et al., 2009, 2011; Tramacere, 2020). Though the radio-optical-ultraviolet data are well described by synchrotron emission within this framework, the slope of the X-ray spectrum could not be explained by the SSC process.
The broadband emission from the hotspots of radio galaxies is usually explained by a two-zone model, where radio to optical/UV emission is explained by synchrotron emission from one zone and X-ray emission is explained by synchrotron emission from the second zone (e. g. Hardcastle et al., 2007; Tingay et al., 2008; Werner et al., 2012; Hardcastle et al., 2016; Migliori et al., 2020). With the detection of parsec-scale structures in the WHS using VLA observations, Tingay et al. (2008) proposed for the first time a double-synchrotron model for the WHS emission of Pictor A. They adopted a model of the WHS region assuming two emitting components: the diffuse component of the WHS that dominates emission in the radio to the optical band, and the parsec-scale components embedded within the diffuse region that dominates the X-ray emission. Werner et al. (2012) also favoured the double synchrotron model over SSC to explain the broadband emission from the WHS of Pictor A. Hardcastle et al. (2016) reported a presence of an extended ‘bar’ region and a dominant ‘compact’ region in the WHS region of Pictor A. The temporal variability of the WHS noticed by Hardcastle et al. (2016) supports the presence of substructures even smaller in size than that reported by Tingay et al. (2008).
Migliori et al. (2007) considered the inverse Compton scattering of cosmic microwave background (IC/CMB) photons by relativistic electrons as a possible scenario to explain the X-ray emission from the diffuse regions of the lobes of Pictor A. They noticed a factor of 50 departure from the equipartition condition is required to explain the IC/CMB origin of the observed lobe X-ray emission. Migliori et al. (2020) studied the emission from the hotspots of three radio galaxies and found that a significant departure from equipartition ratio ( orders of magnitude) is required to have modelled SSC and IC/CMB flux similar to the observed X-ray emission. Alternatively, they also proposed that X-ray emission could be explained by synchrotron emission from the second population of relativistic electrons. Also, recently, the IC/CMB scenario has been ruled out for explaining the -ray emission in the kpc-scale jet of Pictor A (Breiding et al., 2022).
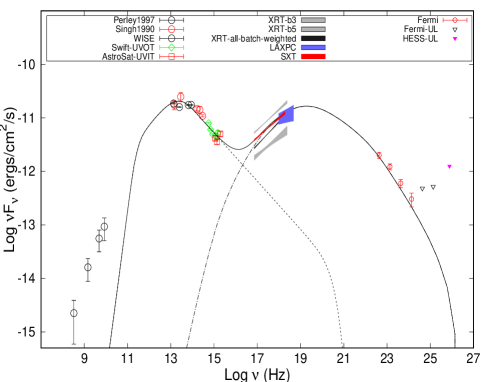
In the present work, we model the observed broadband SED of the WHS of Pictor A with a double synchrotron and SSC model where synchrotron spectrum is emitted by two components. The first component (zone-1), possibly originated in the diffuse region, whereas, the second component (zone-2), possibly originated in the parsec-scale substructures.
We have used the VLBA observations at 1.67 GHz arising from substructures (Tingay et al., 2008). The SED is fitted assuming equipartition conditions. The energy distribution of relativistic jet electrons in zone-1 was considered a power-law with exponential cut-off and a power-law in zone-2. While relativistic electrons in zone-1 produce the observed radio to optical/UV emission through the synchrotron process, the X-ray emission mainly comes from the synchrotron radiation of relativistic electrons in zone-2 (Bottom panel of Fig. 3). The estimated synchrotron energy density in our modelling is orders of magnitude larger than the CMB energy density in both diffuse and substructure regions of the WHS, which further shows that the inverse Comptonisation of CMB photons by the electrons in the hotspot is negligible in comparison to the synchrotron and SSC emission. We noticed that the IC/CMB or SSC process could not explain the observed X-ray emission in the WHS, which is in agreement with earlier findings (e. g. Zhang et al., 2009; Werner et al., 2012; Migliori et al., 2020). We also noticed that the observed -ray emission is inconsistent with an emergence from the WHS. Considering a power-law model for the electron distribution in the substructure region of the WHS, the maximum energy of electrons is found to be TeV, which is consistent with the findings of Sunada et al. (2022), where the derived lower limit for the maximum energy of the relativistic electrons is TeV.
The SED model parameters are given in Table 4 and the corresponding jet energetics in Table 5. It is to be noted that the 2 HST observations by Wilson et al. (2001) are marginally over-predicted in our modelling. However, as reported by Wilson et al. (2001), “these HST values could underestimate the true flux densities since some of the emission was resolved out”.
4 Discussion and Conclusion
In this work, we present a comprehensive study of the Pictor A core utilizing new observations from AstroSat, years of Fermi observations and radio and IR data from the literature, thereby covering a broad regime of the electromagnetic spectrum. We have also carried out a detailed study of the WHS of Pictor A using radio-to-optical data from the literature and recent IR data by Isobe et al. (2017) and Isobe et al. (2020). Additionally, we have analyzed data from Swift and AstroSat-UVIT for both core and WHS.
Our key findings from this work are as follows:
-
•
The WHS is detected for the first time in FUV band using observations from AstroSat-UVIT. The new AstroSat-UVIT observations and Swift-UVOT observations play an important role in constraining the emission mechanism in the WHS, as shown in the zoomed plot in the bottom panel of Fig 3.
-
•
The Chandra observations used by Hardcastle et al. (2016) are spread over 15 years, and only the last two Chandra epochs overlap with the initial part of the Swift observation during the year 2015 that is used in this work for the WHS.
The flux and spectral index obtained for the WHS by Hardcastle et al. (2016) during the last two epochs of Chandra are in agreement with our findings from Swift-XRT observations. The flux density at 1 keV of the combined Swift-XRT spectrum and that obtained from the combined Chandra spectrum (Hardcastle et al., 2016) are () nJy and () nJy, respectively. The X-ray spectral index of WHS derived in this work and by Hardcastle et al. (2016) for combined Chandra spectrum are and , respectively. Hardcastle et al. (2016) also reported around a 10% decrease in the X-ray flux and a slight flattening of the spectra of WHS during the last two epochs of Chandra observation. Therefore, our result supports their findings of a 10% decrease in the X-ray flux and spectral hardening of WHS.
-
•
It is found from the radio observations of blazars that the bulk Lorentz factor () and the half jet opening angle () typically follow a relation , where is in radians (e. g. Jorstad et al., 2005; Clausen-Brown et al., 2013; Saito et al., 2015; Zdziarski et al., 2015). For a jet opening angle of , a value of is required to satisfy the empirical relation between and . Hardcastle et al. (2016) inferred a much lower value and, therefore, could not explain the relation. In contrast, the value used in our study satisfies this relation.
-
•
Previous studies (e. g. Rees et al., 1982; Eracleous & Halpern, 1998; Padovani et al., 1999; Eracleous et al., 2000) could not pinpoint the origin of the X-ray emission in the core of Pictor A. Though there were attempts to explain the broadband X-ray emission of the core with accretion disk/corona origin, the essential model parameters (e. g., exponential cut-off), which are a signature of coronal emission, could not be constrained (e. g. Ricci et al., 2017; Kang et al., 2020). These findings further suggest the presence of a strong jet and/or weak corona in the Pictor A core. Hardcastle et al. (2016) found that a single power law with a narrow Fe-K at keV could explain the X-ray spectrum of combined multiple Chandra observations. However, Fe-K could not be constrained for individual Chandra epochs. In this study, similar to Hardcastle et al. (2016), we found that X-ray emission could be described by a single power law, though the presence of a Fe-K line could not be established.
-
•
From the modelling of the broadband SED of Pictor A core, we found that the optical/UV emission is dominated by synchrotron process originating from the nuclear jet and the external Compton component from the accretion disk/ BLR/torus is insignificant. Furthermore, the X-ray and -ray emission is well explained by the SSC process from the nuclear jet, which falls within the extraction/analysis region and not from the accretion disk/corona.
-
•
Previous studies could not conclusively establish the site of -ray emission in Pictor A. Both the WHS origin (Zhang et al., 2009) and the nuclear jet origin (Kataoka et al., 2011) were speculated. However, no detailed SED modelling was carried out (Brown & Adams, 2012) utilizing the observed -ray spectra of the source. In this work, a detailed study of the core and WHS of Pictor A has been carried out for the first time using the detection of the source in the -ray band. Our SED modelling of the core of Pictor A using a one-zone SSC jet model explains the -ray emission by the SSC process. Also, the predicted -ray emission from our modelling of the WHS is more than an order of magnitude lower than the observed -ray emission from Pictor A. Therefore, from the SED modelling of the core and WHS of Pictor A, we conclude that the parsec-scale jet in the core region could be the primary site of the observed -ray emission.
-
•
Further evidence for the nuclear jet origin of X-ray, UV/optical, and -ray emissions comes from the temporal study of the core of Pictor A in these bands. The positive correlation noticed between these three bands imply the same site of origin of these emissions. Since -rays originate in the jet, X-ray and UV/optical emissions are also expected to have originated in the jet of Pictor A.
-
•
Using new observations in the IR band (Isobe et al., 2017, 2020), and UV observations (Swift-UVOT, AstroSat-UVIT), we find that the 2-zone leptonic emission model well explains the SED of the WHS. Unlike Isobe et al. (2020), we have used a physical model with synchrotron and SSC emissions from 2 zones within the WHS: the diffuse region and the substructures within the WHS. Our SED modelling with a 2-zone model does not show the presence of excess emission in the infrared band and well describes the radio to X-ray data without the requirement of the additional third zone; which is in contrast to the conclusions of Isobe et al. (2020).
-
•
The energy distribution of relativistic jet electrons in the diffuse region of the WHS (zone-1) is considered a power law with exponential cut-off having , and as , and , respectively. In the substructure region of the WHS (zone-2), the energy distribution of relativistic jet electrons was considered a power-law with and as and , respectively. A order lower cut-off energy in the diffuse region indicates a significant increase in the high energy electrons in the substructure region than in the diffuse region. The parsec-scale substructures represent sites of recently accelerated regions of electrons (Tingay et al., 2008). Since a significant portion of detected flux density is contained in these substructures, more energetic electrons are expected to dominate the hotspot emission, thereby resulting in high and values. Also, radio observations indicate flattening of the WHS spectra compared to the lobes suggesting the local particle acceleration in the WHS (Perley et al., 1997).
-
•
While a magnetic field of Gauss is required to explain the SED of the core; the WHS SED is explained by a magnetic field of Gauss. This result indicates that the magnetic field has diluted significantly along the jet length.
From the core SED modelling, we found that the magnetic field value is Gauss, and the ratio of electron energy density (U) to magnetic energy density (U) . From the modelling of broadband SEDs of blazars, Ghisellini et al. (2010) reported that FSRQs, in general, have a higher magnetic field (between Gauss) compared to BL Lacs. Hence, FR II radio galaxies can have high magnetic fields if one considers that FR IIs are misaligned counterparts of FSRQs. Paliya et al. (2017) carried out a detailed study of various physical properties of blazars by construction and modelling of blazars. We noticed that around 20% sources in their sample have a ratio less than that derived in our work.
-
•
The average size of substructures in WHS resolved by Tingay et al. (2008) using radio observations is pc. We consider the same size of the substructures for our SED modelling. Hardcastle et al. (2016) reported a possible variability in the X-ray flux of WHS on a month timescale which corresponds to sub-parsec size. However, the presence of such variability is not strongly confirmed (Hardcastle et al., 2016; Sunada et al., 2022) and the apparent decrease in the source count rates may not be real and could be due to the contamination effects on the detector surface (Sunada et al., 2022). We could not detect WHS in UV and X-ray bands during individual Swift observation IDs. Therefore, we could not verify any presence of variability in WHS substructure emission. Future multiple deep observations with Swift-XRT and AstroSat-UVIT could confirm any possible variation in WHS emission.
With the availability of a large amount of data from Fermi-LAT and broad-band coverage by AstroSat, the investigation of the emission mechanism of other BLRGs will play a significant role in understanding the emission processes and the connection among different classes of AGN. Further, high-resolution and quasi-simultaneous broad-band SEDs of the core and hotspot of -ray detected FR II radio galaxies would place constraints on the radiation mechanism from the core to the hotspot of the source.
Acknowledgements
We thank the anonymous referee for constructive comments that helped us to improve the manuscript considerably. We thank Rick Perley for providing radio images from Perley et al. (1997). The author(s) thank Swathi B for help regarding the astrometric corrections of UVIT images. The author(s) thank Dr Shalima P. for discussions on intrinsic dust corrections. The author(s) acknowledge the financial support of Indian Space Research Organisation (ISRO) under AstroSat archival Data utilization program. This publication uses the data from the AstroSat mission of the ISRO, archived at the ISSDC. This work has been performed utilising the calibration data-bases and auxiliary analysis tools developed, maintained and distributed by AstroSat-SXT team with members from various institutions in India and abroad. This work has made use of public Fermi-LAT data obtained from the Fermi Science Support Center (FSSC), provided by NASA Goddard Space Flight Center. This research has made use of the NASA/IPAC Extragalactic Database (NED), which is operated by the Jet Propulsion Laboratory, California Institute of Technology, under contract with the National Aeronautics and Space Administration. This research has made use of data and/or software provided by the High Energy Astrophysics Science Archive Research Center (HEASARC), which is a service of the Astrophysics Science Division at NASA/GSFC and the High Energy Astrophysics Division of the Smithsonian Astrophysical Observatory. Manipal Centre for Natural Sciences, Centre of Excellence, Manipal Academy of Higher Education (MAHE) is acknowledged for facilities and support.
Data Availability
This work has made use of public Fermi-LAT data available at https://fermi.gsfc.nasa.gov/cgi-bin/ssc/LAT/LATDataQuery.cgi. This research has made use of data and software provided by the High Energy Astrophysics Science Archive Research Center (HEASARC) available at https://heasarc.gsfc.nasa.gov/docs/software/lheasoft/, Swift data available at https://heasarc.gsfc.nasa.gov/cgi-bin/W3Browse/w3browse.pl and the NASA/IPAC Extragalactic Database (NED). This publication has also made use of the data from the AstroSat mission of the ISRO, archived at the ISSDC (https://astrobrowse.issdc.gov.in/astro_archive/archive/Home.jsp). AstroSat data will be shared on request to the corresponding author with the permission of ISRO. This work has also made use of data from results of Hardcastle et al. (2016).
References
- Abdollahi et al. (2022) Abdollahi S., et al., 2022, ApJS, 260, 53
- Ackermann et al. (2011) Ackermann M., et al., 2011, ApJ, 743, 171
- Agrawal (2006) Agrawal P. C., 2006, Advances in Space Research, 38, 2989
- Aharonian et al. (2008) Aharonian F., et al., 2008, A&A, 478, 387
- Antia et al. (2017) Antia H. M., et al., 2017, ApJS, 231, 10
- Arnaud (1996) Arnaud K. A., 1996, in Jacoby G. H., Barnes J., eds, Astronomical Society of the Pacific Conference Series Vol. 101, Astronomical Data Analysis Software and Systems V. p. 17
- Ballet et al. (2020) Ballet J., Burnett T. H., Digel S. W., Lott B., 2020, arXiv e-prints, p. arXiv:2005.11208
- Bertin (2006) Bertin E., 2006, in Gabriel C., Arviset C., Ponz D., Enrique S., eds, Astronomical Society of the Pacific Conference Series Vol. 351, Astronomical Data Analysis Software and Systems XV. p. 112
- Bhattacharya et al. (2021) Bhattacharya D., Mohana A K., Bhattacharyya S., Bhatt N., Stalin C. S., 2021, MNRAS, 500, 1127
- Błażejowski et al. (2000) Błażejowski M., Sikora M., Moderski R., Madejski G. M., 2000, ApJ, 545, 107
- Breiding et al. (2022) Breiding P., Meyer E. T., Georganopoulos M., Reddy K., Kollmann K. E., Roychowdhury A., 2022, arXiv e-prints, p. arXiv:2210.13104
- Brown & Adams (2012) Brown A. M., Adams J., 2012, MNRAS, 421, 2303
- Burrows et al. (2005) Burrows D. N., et al., 2005, Space Sci. Rev., 120, 165
- Calzetti et al. (2000) Calzetti D., Armus L., Bohlin R. C., Kinney A. L., Koornneef J., Storchi-Bergmann T., 2000, ApJ, 533, 682
- Cardelli et al. (1989) Cardelli J. A., Clayton G. C., Mathis J. S., 1989, ApJ, 345, 245
- Celotti et al. (1997) Celotti A., Padovani P., Ghisellini G., 1997, MNRAS, 286, 415
- Clausen-Brown et al. (2013) Clausen-Brown E., Savolainen T., Pushkarev A. B., Kovalev Y. Y., Zensus J. A., 2013, A&A, 558, A144
- Cutri et al. (2013) Cutri R. M., et al., 2013, Explanatory Supplement to the AllWISE Data Release Products, Explanatory Supplement to the AllWISE Data Release Products
- Danziger et al. (1977) Danziger I. J., Fosbury R. A. E., Penston M. V., 1977, MNRAS, 179, 41P
- Dermer & Schlickeiser (1993) Dermer C. D., Schlickeiser R., 1993, ApJ, 416, 458
- Eracleous & Halpern (1998) Eracleous M., Halpern J. P., 1998, ApJ, 505, 577
- Eracleous et al. (2000) Eracleous M., Sambruna R., Mushotzky R. F., 2000, ApJ, 537, 654
- Evans et al. (2009) Evans P. A., et al., 2009, MNRAS, 397, 1177
- Fanaroff & Riley (1974) Fanaroff B. L., Riley J. M., 1974, MNRAS, 167, 31P
- Francis et al. (1991) Francis P. J., Hewett P. C., Foltz C. B., Chaffee F. H., Weymann R. J., Morris S. L., 1991, ApJ, 373, 465
- Gaia Collaboration et al. (2021) Gaia Collaboration et al., 2021, A&A, 649, A1
- Ghisellini et al. (2010) Ghisellini G., Tavecchio F., Foschini L., Ghirlanda G., Maraschi L., Celotti A., 2010, MNRAS, 402, 497
- Grandi et al. (2002) Grandi P., Urry C. M., Maraschi L., 2002, New Astron. Rev., 46, 221
- Grandi et al. (2006) Grandi P., Malaguti G., Fiocchi M., 2006, ApJ, 642, 113
- Gulati et al. (2021) Gulati S., Bhattacharya D., Bhattacharyya S., Bhatt N., Stalin C. S., Agrawal V. K., 2021, MNRAS, 503, 446
- Hardcastle et al. (2004) Hardcastle M. J., Harris D. E., Worrall D. M., Birkinshaw M., 2004, ApJ, 612, 729
- Hardcastle et al. (2007) Hardcastle M. J., Croston J. H., Kraft R. P., 2007, ApJ, 669, 893
- Hardcastle et al. (2016) Hardcastle M. J., et al., 2016, MNRAS, 455, 3526
- Isobe et al. (2017) Isobe N., Koyama S., Kino M., Wada T., Nakagawa T., Matsuhara H., Niinuma K., Tashiro M., 2017, ApJ, 850, 193
- Isobe et al. (2020) Isobe N., Sunada Y., Kino M., Koyama S., Tashiro M., Nagai H., Pearson C., 2020, ApJ, 899, 17
- Jorstad et al. (2005) Jorstad S. G., et al., 2005, AJ, 130, 1418
- Kang et al. (2020) Kang J., Wang J., Kang W., 2020, ApJ, 901, 111
- Kataoka et al. (2011) Kataoka J., et al., 2011, ApJ, 740, 29
- Koratkar & Blaes (1999) Koratkar A., Blaes O., 1999, PASP, 111, 1
- Kriss (1985) Kriss G. A., 1985, AJ, 90, 1
- Kumar et al. (2012) Kumar A., et al., 2012, in Proc. SPIE. p. 84431N (arXiv:1208.4670), doi:10.1117/12.924507
- Lewis & Eracleous (2006) Lewis K. T., Eracleous M., 2006, ApJ, 642, 711
- Massaro et al. (2006) Massaro E., Tramacere A., Perri M., Giommi P., Tosti G., 2006, A&A, 448, 861
- Migliori et al. (2007) Migliori G., Grandi P., Palumbo G. G. C., Brunetti G., Stanghellini C., 2007, ApJ, 668, 203
- Migliori et al. (2020) Migliori G., Orienti M., Coccato L., Brunetti G., D’Ammando F., Mack K. H., Prieto M. A., 2020, MNRAS, 495, 1593
- Nordon et al. (2013) Nordon R., et al., 2013, ApJ, 762, 125
- Padovani et al. (1999) Padovani P., Morganti R., Siebert J., Vagnetti F., Cimatti A., 1999, MNRAS, 304, 829
- Paliya et al. (2017) Paliya V. S., Marcotulli L., Ajello M., Joshi M., Sahayanathan S., Rao A. R., Hartmann D., 2017, ApJ, 851, 33
- Paliya et al. (2021) Paliya V. S., Domínguez A., Ajello M., Olmo-García A., Hartmann D., 2021, ApJS, 253, 46
- Palma et al. (2011) Palma N. I., et al., 2011, ApJ, 735, 60
- Perley et al. (1997) Perley R. A., Roser H.-J., Meisenheimer K., 1997, A&A, 328, 12
- Rao et al. (2016) Rao A. R., Singh K. P., Bhattacharya D., 2016, Space Research Today, 196, 30
- Reddy et al. (2018) Reddy N. A., et al., 2018, ApJ, 853, 56
- Rees et al. (1982) Rees M. J., Begelman M. C., Blandford R. D., Phinney E. S., 1982, Natur, 295, 17
- Ricci et al. (2017) Ricci C., et al., 2017, ApJS, 233, 17
- Richards et al. (2011) Richards J. W., et al., 2011, ApJ, 733, 10
- Roeser & Meisenheimer (1987) Roeser H.-J., Meisenheimer K., 1987, ApJ, 314, 70
- Roming et al. (2005) Roming P. W. A., et al., 2005, Space Sci. Rev., 120, 95
- Rousseeuw & Croux (1993) Rousseeuw P. J., Croux C., 1993, Journal of the American Statistical Association, 88, 1273
- Saha et al. (2020) Saha K., et al., 2020, Nature Astronomy, 4, 1185
- Saito et al. (2015) Saito S., Stawarz Ł., Tanaka Y. T., Takahashi T., Sikora M., Moderski R., 2015, ApJ, 809, 171
- Sambruna et al. (1999) Sambruna R. M., Eracleous M., Mushotzky R. F., 1999, ApJ, 526, 60
- Schlafly & Finkbeiner (2011) Schlafly E. F., Finkbeiner D. P., 2011, ApJ, 737, 103
- Sikora et al. (1994) Sikora M., Begelman M. C., Rees M. J., 1994, ApJ, 421, 153
- Simkin et al. (1999) Simkin S. M., Sadler E. M., Sault R., Tingay S. J., Callcut J., 1999, ApJS, 123, 447
- Singh et al. (1990) Singh K. P., Rao A. R., Vahia M. N., 1990, MNRAS, 246, 706
- Singh et al. (2014) Singh K. P., et al., 2014, in Proc. SPIE. p. 91441S, doi:10.1117/12.2062667
- Singh et al. (2017) Singh K. P., et al., 2017, Journal of Astrophysics and Astronomy, 38, 29
- Soldi et al. (2008) Soldi S., et al., 2008, A&A, 486, 411
- Sulentic et al. (1995) Sulentic J. W., Marziani P., Zwitter T., Calvani M., 1995, ApJ, 438, L1
- Sunada et al. (2022) Sunada Y., Morimoto A., Tashiro M. S., Terada Y., Katsuda S., Sato K., Tateishi D., Sasaki N., 2022, arXiv e-prints, p. arXiv:2203.02066
- Tandon et al. (2017) Tandon S. N., et al., 2017, AJ, 154, 128
- Tandon et al. (2020) Tandon S. N., et al., 2020, AJ, 159, 158
- Thomson et al. (1995) Thomson R. C., Crane P., Mackay C. D., 1995, ApJ, 446, L93
- Tingay et al. (2000) Tingay S. J., et al., 2000, AJ, 119, 1695
- Tingay et al. (2008) Tingay S. J., Lenc E., Brunetti G., Bondi M., 2008, AJ, 136, 2473
- Tramacere (2020) Tramacere A., 2020, JetSeT: Numerical modeling and SED fitting tool for relativistic jets, Astrophysics Source Code Library, record ascl:2009.001 (ascl:2009.001)
- Tramacere et al. (2009) Tramacere A., Giommi P., Perri M., Verrecchia F., Tosti G., 2009, A&A, 501, 879
- Tramacere et al. (2011) Tramacere A., Massaro E., Taylor A. M., 2011, ApJ, 739, 66
- Werner et al. (2012) Werner M. W., Murphy D. W., Livingston J. H., Gorjian V., Jones D. L., Meier D. L., Lawrence C. R., 2012, ApJ, 759, 86
- Wilson et al. (2001) Wilson A. S., Young A. J., Shopbell P. L., 2001, ApJ, 547, 740
- Wood et al. (2017) Wood M., Caputo R., Charles E., Di Mauro M., Magill J., Perkins J. S., Fermi-LAT Collaboration 2017, International Cosmic Ray Conference, 301, 824
- Yadav et al. (2016) Yadav J. S., et al., 2016, in Proc. SPIE. p. 99051D, doi:10.1117/12.2231857
- Zdziarski et al. (2015) Zdziarski A. A., Sikora M., Pjanka P., Tchekhovskoy A., 2015, MNRAS, 451, 927
- Zhang et al. (2009) Zhang J., Bai J. M., Chen L., Yang X., 2009, ApJ, 701, 423
Appendix A Swift-XRT data analysis
Pictor A was observed 12 times by Swift-XRT during 2010-2021. We used the online ‘Swift-XRT data products generator’ (Evans et al., 2009) to create spectral data products for the core and WHS. The spectra were binned to have counts per bin using grppha. The extracted spectrum were fitted with model phabs*pow using xspec version: 12.11.1 (Arnaud, 1996) to get keV flux and photon index. A Galactic absorption value of cm-2 was used for fitting the spectra. The presence of Fe-K line could not be established. The intrinsic absorption was not considered to fit the spectra since no excess absorption has been reported by Chandra (Hardcastle et al., 2016), which has much better sensitivity in the soft X-ray band.
A.1 X-ray spectrum of the core of Pictor A
To calculate the average Swift-XRT spectrum for Pictor A core, combined spectrum for the observation IDs with nearby observation dates was derived to minimize the effect of instrument response. This resulted in the segregation of data into 5 batches, as given in Table 6. The flux and photon index for the 5 batches is given in Table 7.
A.2 X-ray spectrum of the western hotspot of Pictor A
The combined spectrum for the WHS was derived for the batches mentioned above using the position taken from the XMM Newton source catalogue (4XMM-DR11) 444http://xmm-catalog.irap.omp.eu/. The WHS could not be detected in any of the batches. Hence, we segregate the 12 observations based on the change of the redistribution matrix file (RMF) only. It was noticed that the detector RMF was different for the observations after 2010. Hence, to calculate the average X-ray spectrum of the WHS, we segregate the observations into two batches: first batch (batch A) with 2 observations during 2010 and second batch (batch B) for the rest of the observations (2015-2021). Since the WHS could not be detected in batch A, we derived the WHS spectra only for batch B. The flux and photon index for the batch B (bB) is given in Table 7.
Appendix B Temporal study in UV/Optical band
Similar to Swift-XRT data, the Swift-UVOT data was segregated into batches. The galactic extinction corrected fluxes for each batch was obtained using the methodology given in Sec. 2.3.2. We carried out the required corrections for intrinsic absorption for the UV observations of the core of Pictor A following Calzetti et al. (2000); Nordon et al. (2013); Reddy et al. (2018); Saha et al. (2020).
We have used the UV spectral slope () to calculate the continuum colour excess . We fit the UV fluxes from one FUV and two NUV observations from AstroSat-UVIT to estimate . The fitted value of is . The derived value is in agreement with the average value derived from the FUV and NUV filters using the formula given by Nordon et al. (2013). Following Reddy et al. (2018), is calculated using the relation below:
| (1) |
The intrinsic extinction () is given by . and are calculated using equation (3) and equation (4) of Calzetti et al. (2000). The galactic extinction corrected fluxes are then corrected for the intrinsic absorption using equation (2) of Calzetti et al. (2000).
For the WHS of Pictor A, due to large uncertainty in the observed UVIT flux, we could not constrain . We also noticed that if one considers the same value as obtained for the core, the intrinsic corrected flux matches the uncorrected one within . This suggests that the intrinsic extinction of the WHS UV flux may not be significant. Therefore, the correction for intrinsic extinction of the WHS UV flux is excluded. The results are given in Table 8. The flux increase in all the filters of Swift-UVOT is noticed during January 2021 (b5).
| Component | Batch | Observation ID | Date of observation | Exposure time (seconds) |
|---|---|---|---|---|
| Core | b1 | 00041515002 | 2010-10-31 | 3644.486 |
| 00041515001 | 2010-10-31 | 1020.464 | ||
| b2 | 00049664001 | 2015-10-28 | 1891.801 | |
| 00081701001 | 2015-12-03 | 885.917 | ||
| 00081701002 | 2015-12-06 | 1007.287 | ||
| b3 | 00049664004 | 2017-02-05 | 468.848 | |
| b4 | 00049664005 | 2017-07-16 | 6847.401 | |
| 00049664006 | 2017-07-18 | 596.730 | ||
| 00049664007 | 2017-07-23 | 862.685 | ||
| b5 | 00049664008 | 2021-01-26 | 2626.070 |
Observation IDs 00049664002 (exposure time: s) and 00049664003 (exposure time: s) are not considered for the core analysis due to their less exposure time.
| Component | batch | Fluxa | |
|---|---|---|---|
| Core | b1 | ||
| b2 | |||
| b3 | |||
| b4 | |||
| b5 | |||
| Hotspot | bB |
a Unabsorbed flux in units of erg cm-2 sec-1
b Photon index of power-law model.
c Unabsorbed flux in units of erg cm-2 sec-1
| Filter | b1a | b2a | b3a | b4a | b5a |
|---|---|---|---|---|---|
| V | - | ||||
| B | - | ||||
| U | - | ||||
| UVW1 | - | ||||
| UVM2 | |||||
| UVW2 |
a Flux in units of erg cm-2 sec-1 Hz-1
Appendix C Temporal study in -ray band
The Fermi-LAT ‘Pass 8’ data was analysed utilizing Fermitools version 1.2.23 with a ‘P8R3_SOURCE_V2’ response function. A region of interest (ROI) centered at Pictor A was defined, and standard cuts were applied to select the good time intervals. Our initial model consists of all -ray point sources from 4FGL-DR2 catalogue (Ballet et al., 2020) within of the ROI centre, along with the standard templates for the Galactic diffuse emission model (gll_iem_v07.fits) and isotropic diffuse emission (iso_P8R3_SOURCE_V2_v1.txt).
To calculate the average flux for years dataset, we utilized the Fermipy version 0.19.0 (Wood et al., 2017). After carrying out an initial optimization of the ROI using optimize method of Fermipy, both normalisation and spectral parameters of the sources within and only normalisation of the sources lying within of the ROI centre were left to vary. Also, the normalisation of the Galactic and isotropic diffuse backgrounds and the spectral index of the Galactic diffuse background were left free during the fit. Further, the spectral parameters of the sources having Test Statistic (TS) and a predicted number of counts (Npred) less than after initial optimization were frozen. A TS map was generated using the find_sources tool of Fermipy to search for additional point sources that are not present in the 4FGL-DR2 catalogue. Three new sources (Source 1: 74.839, -45.481; Source 2: 78.535, -40.083; and Source 3: 82.027, -46.875) were detected with TS and were added to the model. We tested both power-law and log-parabola models. Similar to the averaged -ray spectra provided in the latest Fermi-LAT catalogs (4FGL-DR2: Ballet et al. (2020); 4FGL-DR3: Abdollahi et al. (2022)), no significant curvature () was noticed in the years averaged -ray spectrum of Pictor A. The years averaged -ray SED was constructed with two energy bins per decade in 100 MeV to 100 GeV energy band using the sed tool of Fermipy.
We constructed the bi-monthly -ray lightcurve in 100 MeV to 100 GeV of this source using lightcurve tool of fermipy. The best-fitting model obtained for the 13-year data set was used as an input model. The spectral parameters of all sources were frozen to the best fit values and only normalisation were left free to vary in the input model of each time bin.
The average -ray flux was calculated during the Swift, Chandra and AstroSat observing period choosing an appropriate time interval ( month timescale) such that the source is detected with TS . A power-law model was considered during these epochs owing to the low photon statistics in the -ray band. To calculate the average flux in a batch/epoch, all the spectral parameters, including the spectral index of the galactic diffuse template, were kept frozen to the 13-year averaged value, and hence, only the normalisation of the sources within were left to vary. The average flux of each batch is given in Table 9. The batches/epochs where the source was not detected, an upper limit is derived for 3 months time interval around the date of X-ray observation.
| Observatory | Batch | Start Date | End Date | Fluxa/ | TS |
| Upper limit a | |||||
| Swift-XRT | b1 | 2010 Sep 16 | 2010 Dec 15 | ||
| b2 | 2015 Oct 28 | 2015 Dec 06 | |||
| b3 | 2016 Dec 22 | 2017 Mar 22 | |||
| b4 | 2017 Jun 05 | 2017 Sep 02 | |||
| b5 | 2021 Jan 23 | 2021 Jan 29 | |||
| Chandra | E3 | 2009 Oct 26 | 2010 Jan 23 | ||
| E4 | 2012 May 03 | 2012 Aug 01 | |||
| E5 | 2012 Oct 08 | 2012 Dec 07 | |||
| E6 | 2013 Jul 09 | 2013 Oct 07 | |||
| E7 | 2013 Dec 03 | 2014 Mar 03 | |||
| E8 | 2014 Mar 07 | 2014 Jun 05 | |||
| E9 | 2014 Dec 11 | 2015 Feb 08 | |||
| AstroSat | - | 2017 Dec 01 | 2018 Feb 28 |
a Flux in units of ph cm-2 sec-1
The -ray flux shows an order of magnitude increase with respect to 13 years averaged flux during January 23-29, 2021, which is also accompanied by an increase in X-ray and UV/optical flux. A detailed multiwavelength spectral modelling of this multi-band flare will be the subject of a later paper.
Appendix D Correlation Study
As explained above, core flux for the 5 batches was calculated in UV/optical, X-ray and -ray bands. To have a robust estimate of the correlation between these bands, we first simulate the light curves by randomly drawing one million points from a random normal distribution with the mean located at the derived flux value and standard deviation as the error in the respective flux value. The Pearson correlation coefficient was calculated for this simulated data in each waveband. The median of these correlation values was taken as the final correlation value. We consider median absolute deviation (MAD) (Rousseeuw & Croux, 1993; Richards et al., 2011), defined below, as a measure of the uncertainty in the estimated correlation value.
| (2) |
where, are the derived correlation coefficients. The correlation values derived between different wavebands is given in Table 10. The correlated increase in flux in UV/optical, X-ray and -ray band during January 2021 implies the same site of origin of these emissions.
| X-ray | ||||||
|---|---|---|---|---|---|---|
| -ray |
The Pearson correlation coefficient between X-ray and -ray is .
Appendix E Possibility of EC scenario in core emission
We investigate the contribution of inverse Compton emissions from the accretion disk, BLR and/or torus by the jet electrons to the observed core emission. To calculate the contribution from accretion disk, we first derive the accretion disk luminosity (L) as follows. We estimate the accretion disk luminosity from the observed line emission flux and maximum line emission flux (Sulentic et al., 1995) following the methodology adopted by Paliya et al. (2021) and using the data from Francis et al. (1991) and Celotti et al. (1997). The accretion disk luminosity derived is ergs sec-1. We assume BLR as a thin spherical shell located at a distance cm and dusty torus located at distance of cm (Ghisellini et al., 2010).
The blob size is constrained considering the observed -ray variation of week timescale. With the half jet opening angle of inferred from Chandra observations (Hardcastle et al., 2016), the position of emitting region inside BLR constraints the variability timescale to a few hours, which is much smaller than the observed -ray variability of week timescale. Hence, we calculate the EC contribution to the observed core emission with blob placed inside the torus. The corresponding semi-opening angle is , which is in agreement with Hardcastle et al. (2016). We noticed that the contribution from various external Compton (EC) processes (from disk, BLR, and torus) is insignificant (Fig. 4). Thus, our modelling suggests that SSC process alone can explain well the X-ray and -ray emissions. Therefore, in our modelling, we only consider synchrotron and SSC emission to explain the observed broadband SED of Pictor A. The additional SED model parameters used for calculating the EC emission are given in Table 11.
| Parameter | Symbol | Core |
|---|---|---|
| Mass of black hole | M (M⊙) | |
| Inner disk radius | R (R) | |
| Outer disk radius | R (R) | |
| Accretion efficiency | ||
| Position of the blob | R (cm) | |
| Inner radius of BLR region | R (cm) | |
| Outer radius of BLR region | R(cm) | |
| Fraction of disk luminosity | ||
| reflected by the BLR | ||
| Temperature of dusty torus | Kelvin | |
| Radius of the dusty torus | R (cm) | |
| Fraction of disk luminosity re-emitted | ||
| by the torus in the infrared |