Computational Design of Molecular Probes for Electronic Pre-Resonance Raman Scattering Microscopy
Abstract
Recently developed electronic pre-resonance stimulated Raman scattering (epr-SRS) microscopy, in which the Raman signal of a dye is significantly boosted by setting the incident laser frequency near the electronic excitation energy, has pushed the sensitivity of SRS microscopy close to that offered by confocal fluorescence microscopy. Prominently, the maintained narrow line-width of epr-SRS also offers high multiplexity that breaks the “color barrier” in optical microscopy. However, detailed understandings of the fundamental mechanism in these epr-SRS dyes still remain elusive. Here, we combine experiments with theoretical modeling to investigate the structure-signal relationship, aiming to facilitate the design of new probes and expanding epr-SRS palettes. Our ab initio approach employing the displaced harmonic oscillator (DHO) model provides a consistent agreement between simulated and experimental SRS intensities of various triple-bond bearing epr-SRS probes with distinct scaffolds. We further review two popular approximate expressions for epr-SRS, namely the short-time and Albrecht A-term equations, and compare them to the DHO model. Overall, the theory allows us to illustrate how the observed intensity differences between molecular scaffolds stem from the coupling strength between the electronic excitation and the targeted vibrational mode, leading to a general design strategy for highly sensitive next-generation vibrational imaging probes.
Contributed equally to this work \altaffiliationContributed equally to this work
![[Uncaptioned image]](/html/2303.04922/assets/x1.png)
1 Introduction
Over the last one and half decades, stimulated Raman scattering (SRS) microscopy has emerged as an important vibrational bio-imaging modality complementary to standard fluorescence microscopy. Although SRS has enhanced the otherwise weak spontaneous Raman transition by up to 108-fold through stimulated emission amplification1, 2, 3, its current sensitivity of non-resonant probes is still largely limited to micromolar to millimolar range4, restricting probing the rich chemical information of dilute biomolecules in vivo, which is usually in the nanomolar to low micromolar range. This sensitivity gap has proven to be successfully tackled by customized Raman probes4. Among numerous Raman probes, some of the most sensitive ones up to date are the pyronin-based electronic pre-resonance (epr) enhanced Manhattan Raman scattering (MARS) dyes5. When the pump wavelength is tuned to be close to the electronic excitation energy, i.e. under the epr condition, the vibrational mode coupled to the electronic state would be selectively amplified with enhanced SRS signals. By carefully tuning the absorption of the dyes (660–790 nm) to moderately close to the laser wavelength (800900 nm), SRS intensities of the triple bonds (nitriles or alkynes) when conjugated into the conjugation systems of these dyes have been found to be pre-resonantly enhanced by up to 104 folds (detection limit down to 250 nM) with a well-maintained high signal-to-background ratio. Since the invention of MARS dyes, numerous exciting imaging applications have been achieved. The MARS dyes enable super-multiplexed (20 channels) vibrational imaging by taking advantage of the narrow linewidth of Raman peaks (peak width about 10 cm-1, 50–100 times narrower than fluorescent peaks) from triple bonds in the cell-silent region (1800–2800 cm-1) where there are no background signals from endogenous molecules.5, 6, 7 These ideas inspired the design of multi-functional Raman probes including photo-switchable, photo-activatable, and turn-on enzymatic probes8, 9, 10, 11, 12. They also paved the way for all-far-field single-molecule Raman spectroscopy and imaging without plasmonic enhancement by stimulated Raman excited fluorescence (SREF)13. Thus the superb vibrational properties and versatility of epr MARS dyes are widely recognized, making them essential for a wide range of vibrational spectroscopy and imaging. However, these dyes are still the only set of triple-bond bearing epr-SRS dyes until now and the principle of designing such strong Raman probes is still inconclusive. This has largely restricted the development of new epr-SRS scaffolds to further increase the sensitivity and expand the multiplexity, a central topic in the current development of SRS imaging. While the Albrecht A-term pre-resonance approximation equation was previously adopted to fit the dependence of epr-SRS signals with a single parameter of laser detuning, the treatment ignored the structure dependent factors as it assumes all frequency-independent factors as a constant. 5 The necessity to rationally explore and design new epr-SRS scaffolds hence sets a high demand for a more systematic theory to understand and predict the dependence of the epr-SRS signals on molecule structures (i.e., a structure-intensity relationship).
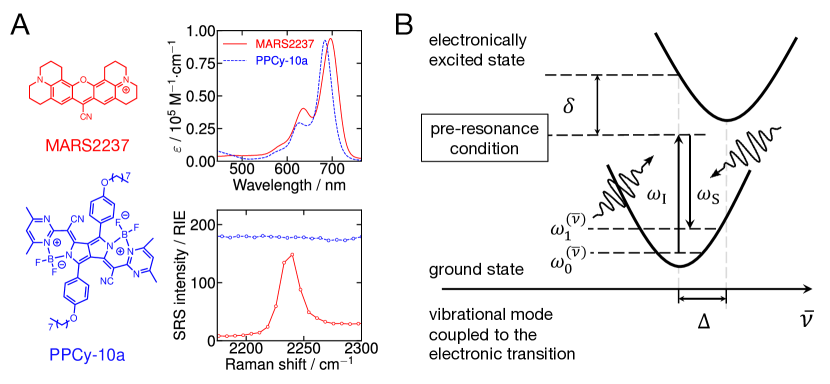
Indeed, our initial screening of molecular candidates for new epr-SRS probes revealed that the structure related factors play a crucial role. For example, a series of pyrrolopyrrole cyanine (PPCy) dyes were originally identified by us to be promising candidates of epr-SRS probes. PPCy dyes are neutral and have two nitrile groups in the conjugation system with adjustable absorption between 680 and 800 nm14. The absorption spectrum of one of those dyes, namely the PPCy-10a molecule (Figure 1A, blue), almost overlaps with that of MARS2237 (Figure 1A, red), one of the well-validated MARS dyes. The absorption maximum and molar extinction coefficient of these two molecules are also very close, implying that a similar epr-SRS signal should be expected based on the detuning and oscillator strength dependence implied from the Albrecht A-term pre-resonance approximation equation 5. However, as a stark difference to MARS2237, which presented a clear and sharp epr-SRS peak, we barely see any epr-SRS signal from the nitrile groups of PPCy-10a under the same measurement conditions (Figure 1A). This observation points out that it is not effective enough to identify novel epr-SRS probes only through the experimentally measured absorption quantities. Instead, it indicates that the epr-SRS process relies heavily on the specific molecular structures. To decipher the structure-dependent factors underlying this vibronic process, we turn to more accurate quantum chemistry approaches.
2 Theory
Theoretical tools that can accurately and reliably predict Raman intensity could greatly help us understand the key factors involved in epr-SRS. Although established computational methods for simulating resonance and pre-resonance Raman spectra exist,15, 16, 17, 18, 19, 20, 21, 22, 23, 24 they have been largely used for simulating the full spectra of individual molecules. Here, we explore an alternative task, in which we compare the intensities of a single peak, corresponding to the nitrile (CN) or alkyne (CC) bond stretch, in the pre-resonance Raman spectra of multiple large molecules (50–100 atoms). Theoretically, the SRS signal intensity is25, 26
| (1) |
where and denote the ground and first excited vibrational states of mode in the electronic ground state, is the frequency-dependent polarizability matrix element between these vibrational states, is the incident light frequency, and and are the polarizations of the incident and scattered lights. In eq 1, we omit the prefactor that depends on the incident light (pump) frequency and the Stokes pulse intensity because these factors cancel out when the SRS intensity is reported with respect to a standard reference. The conventional frequency-domain approach formulates the polarizability through the Kramers-Heisenberg-Dirac (KHD) equation27, 28
| (2) |
which involves a sum over all vibrational states (with energies ) of the excited electronic state that is near resonance with the incident light. and correspond to the energies of the ground and first excited vibrational states of the mode of interest (), respectively. , are the projections of transition dipole moment along the scattered and incident light polarizations, respectively, and is the dephasing parameter. In the remainder, we will assume the Condon approximation, , in which the coordinate dependence of the transition dipole moment is neglected. denotes the ground-state equilibrium geometry.
Time-domain approach, popularized by Heller and Tannor,29, 30 offers an efficient alternative to evaluating the above sum-over-states formula. Here, the frequency-dependent polarizability is written as the half-Fourier transform
| (3) |
of the time correlation function
| (4) |
where is the excited-state Hamiltonian, and we denote for simplicity. is the dephasing term in its more general form; for example, corresponds to the Lorentzian lineshape in the KHD expression (eq 2). In words, the computation of requires the time propagation of a quantum wavepacket in the excited electronic state, which is computationally costly for molecular Raman probes with a typical size of 50–100 atoms, even with, for example, trajectory-guided Gaussian wavepacket approaches.31, 32, 33, 34, 35, 36, 37, 38, 39, 40, 41, 42 In fact, the number of ab initio computations in the excited electronic state should be minimized to allow for efficient analysis of relatively large molecules.
The displaced harmonic oscillator (DHO) model18 offers a practical way to approximate the time propagation in the excited state. Within this model, it is assumed that the ground and excited potential energy surfaces can be sufficiently accurately represented as two harmonic potentials with equal force constants (with frequencies ) but different minima. Note that represents an arbitrary mode, and is distinguished from , the mode of interest that gives the Raman signal. In this case, the time correlation function of eq 4 simplifies into
| (5) |
is the dimensionless distance between the ground- and excited-state minima along mode and is expressed within the vertical gradient model20 as
| (6) |
where is the gradient of the excited-state potential energy with respect to the mass-scaled normal mode (see Figure 1B) evaluated at the ground-state equilibrium geometry. The dimensionless displacement parameters are directly related to the well-known Huang–Rhys factors . In eq 5, is the difference (detuning) between the vertical excitation frequency and the incident light frequency. Equation 3 is combined with the approximations in eqs 5 and 6 to provide the major simulation protocol for this study. In addition, because the laser frequency is sufficiently close to the vertical excitation gap, only the resonant part (first term on the right-hand side of eq 3) was computed.
Finally, we close the review of the methods by pointing out that two simple but useful expressions can be further derived from eq 5 under the pre-resonance conditions. First, following Heller, Sundberg, and Tannor30, 25, a short-time expansion of the time correlation function leads to
| (7) |
where and . Substituting eq 7 into the first (resonant) term of eq 3 yields the short-time expression for the SRS intensity
| (8) |
where we used and introduced the dipole strength . Alternatively, the large detuning limit can be applied directly to the KHD formula in the frequency domain, which leads to the well-known Albrecht A-term equation but now with calculable structure-dependent factors43, 44
| (9) |
The first part of eq 9 corresponds to the most common form that includes both resonant and non-resonant terms, whereas the final right-hand side expression is an approximate form assuming . Although more approximate than eq 5, the short-term and Albrecht’s expressions provide additional insight into the origins of strong pre-resonance Raman signals. For example, Albrecht’s expression reveals a strong () dependence of the Raman intensity on the detuning, which is otherwise hidden in the more accurate equation. However, it neglects the impact of spectator modes, i.e., modes that are not directly excited by the scattering event, which are still accounted for in the short-time expansion formula (eq 8) through a collective vibrational parameter that depends on all mode displacements.
3 Methods
3.1 Computational details
Practical implementation of the simulation protocol involves three quantum chemistry calculations for each molecule, namely the (a) ground-state vibrational modes and frequencies (or Hessian), (b) electronic transition dipole moment, and (c) excited state gradient, all evaluated at the ground-state equilibrium geometry (i.e., Franck-Condon point). The excited-state Cartesian forces are then transformed into the normal-mode coordinates obtained from the diagonalization of the mass-scaled Hessian of the ground electronic state. We assumed the validity of the Condon approximation, in which the transition dipole moment is a constant evaluated at a single molecular geometry, in our case the Franck-Condon point. In addition, within the DHO model, the excited state frequencies and normal modes were approximated by those of the ground state, i.e., the changes in the frequencies (mode distortion) and normal modes (Duschinsky effect) between the ground and excited electronic states were neglected.45 The DHO and Condon approximations were validated on the electronic absorption spectra of several dyes (see Sec. 4 of the Supporting Information). We performed the quantum-chemical calculations with the ORCA software package46, 47 and computed the Raman intensities from the aforementioned analytical expressions in a separate Python code. Further details of ab initio simulations are available in Sec. 1 of the Supporting Information.
Raman intensities were computed using mixed computational and experimental data. Namely, to avoid the computational errors in evaluating the vertical excitation gap, we estimated this energy from the experimental spectra. Since most of the probes exhibit absorption spectra that are dominated by the 0–0 transition48 (see Sec. 4 of the Supporting Information), we assumed that the wavelength of maximum intensity, , corresponds to this transition. Then, within the DHO model, we could recover the experimental estimate of the vertical excitation energy as
| (10) |
where is the frequency of maximum absorption. Computational data was used for all other parameters, including the transition dipole moments (analyzed in Sec. 5 of the Supporting Information). After evaluating the time correlation function within the DHO model (eq 5), we used a Gaussian dephasing in eq 3 to account for the inhomogeneous broadening of the lineshape23, 17 in the solution. was set to cm-1, which was consistent with the broadening used in the electronic absorption spectra simulations.
3.2 Experimental details
There are two independent laser systems of different fundamental wavelengths for measuring epr-SRS signals of the molecules, providing different detuning for the same molecule. One has a fundamental wavelength of 1031.2 nm (2 ps pulse width, 80 MHz repetition rate) and the other one has a fundamental wavelength of 1064.2 nm (6 ps pulse width, 80 MHz repetition rate). The different fundamental wavelengths (used as the Stokes beam) of the two laser systems provide different pump wavelengths for the same molecule. For the Raman peak of triple bond around 2200 cm-1, 1031.2 nm fundamental laser sets the pump wavelength to be around 840 nm and 1064.2 nm fundamental laser sets the pump wavelength to be around 860 nm. For example, the Raman peak for the nitrile bond of MARS2228 is 2228 cm-1, thus the pump wavelength is either 838.5 nm (when the Stokes beam is 1031.2 nm) or 860.2 nm (when the Stokes beam is 1064.2 nm). Details of the two laser systems are given in Sec. 2 of the Supporting Information. A 10 mM aqueous EdU sample is measured under each laser system as a benchmark reference sample to correct the dependence of non-resonant Raman cross section on the wavelength.
4 Results and Discussion
![[Uncaptioned image]](/html/2303.04922/assets/x3.png)
| Pump laser around 860 () nm | ||
| epr-SRS probes | absorption maximum/nm | epr-SRS intensity/RIE |
| 9CN-MARS2222 | 790 | 940 |
| MARS2228 | 760 | 435 |
| MARS2225 | 760 | 303 |
| MARS2231 | 744 | 240 |
| MARS2237 | 700 | 120 |
| 9CN-MARS2238 | 690 | 108 |
| MARS2233 | 735 | 99 |
| 9CN-MARS2240 | 675 | 86 |
| MARS2190 | 731 | 73 |
| Bodipy-alkyne | 666 | 20 |
| Pump laser around 840 () nm | ||
| epr-SRS probes | absorption maximum/nm | epr-SRS intensity/RIE |
| MARS2228 | 760 | 620 |
| MARS2231 | 744 | 324 |
| MARS2237 | 700 | 150 |
| PADBP-9 | 699 | 186 |
| MARS2190 | 731 | 132 |
| C-MARS2190 | 696 | 16 |
| C-MARS2143 | 696 | 15 |
| FC10 | 694 | 12 |
| PPCy-8a | 690 | 0 |
| PPCy-10a | 692 | 0 |
With the computational approach in hand, we first validate it by comparing the theoretical and experimental SRS intensities of molecules with various scaffolds. For the benchmark, we searched for candidates based on the criteria that the molecules strongly absorb in the epr-SRS region (660–790 nm) and that the nitrile and alkyne groups are directly conjugated to the -system. Fortunately, there are several molecule scaffolds fitting into our criteria, although not many. In addition to the pyronin (O/C/Si Rhodamine) scaffold presented in MARS dyes and PPCy dyes we introduced earlier, there are other scaffolds such as coumarin49, bodipy50 and pyrrolopyrrole51 (see Table 1). We synthesized the molecules and measured their absorption and epr-SRS signals. The data of some of the MARS dyes were adapted from previous reports 5, 6. It is noteworthy that we report epr-SRS measurements from two independent laser systems, providing different detuning for the same molecules (see Supporting Information Sec. 2 for details). The pump wavelength is tuned to be around 840 nm or 860 nm for the triple bond and the corresponding experimental results are shown in Table 2. Each laser system used EdU as the reference substance.
Figure 2 compares the measured epr-SRS intensities (red bars) of nitrile and alkyne probes with the simulated intensities (blue bars) from the DHO theory described above. Data from two SRS laser systems with different pump wavelengths (around 860 nm and 840 nm) are shown. A consistent agreement is seen between experiment and theory across magnitudes of SRS intensities on all scaffolds.
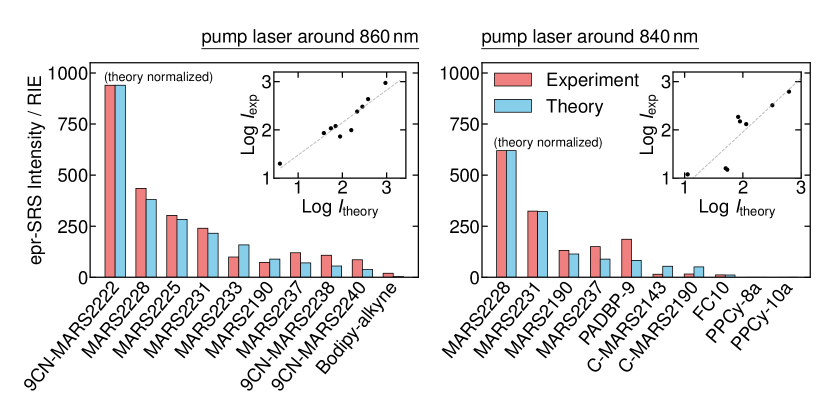
Furthermore, when the comparison is performed at a quantitative level in the inset, the presence of a linear trend in the figure reinforces the ability of our simple theoretical approach to identify high-intensity epr-SRS probes. A linear regression of the data gives a slope of 0.67 or 1.11 rather than 1, illustrating also the limitations of our approach. Admittedly, a number of approximations enter the simulations, including the DHO model for the time-correlation function and (TD)DFT level of electronic structure theory. Most of the calculated values (normalized to the strongest epr-SRS probe in each group) are within or close to the experimental standard error of about 10 % (see Figure S1 of the Supporting Information). Yet, our calculations deviate more on the intensities of alkyne dyes: they largely overestimate the SRS intensities of the alkynyl pyronin dyes C-MARS2190 and C-MARS2143, while they underestimate the intensity of PADBP-9. Whereas in conventional simulations of a single resonance Raman spectrum the effects of detuning and transition dipole strength are only moderate, e.g., the spectra are typically scaled to the highest peak, here these factors play an important role because different molecules exhibit different detunings and transition dipole strengths. Since the epr-SRS intensity depends strongly on these parameters, even seemingly acceptable quantum-chemical errors can lead to discrepancies between theory and experiment.
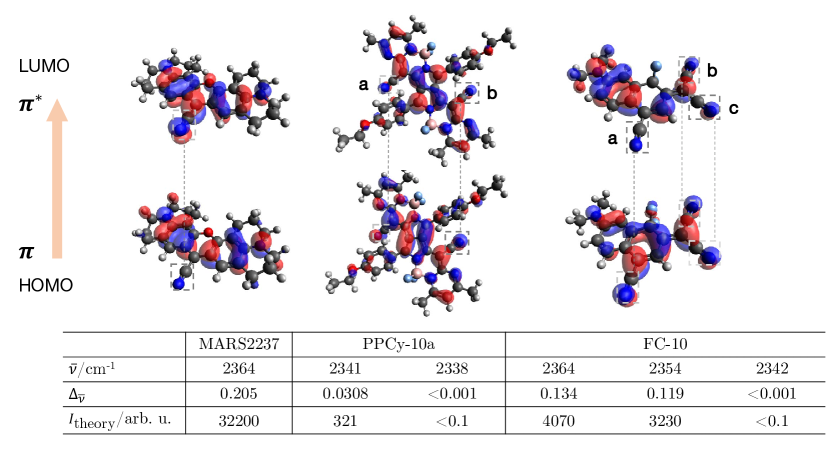
More importantly, the theoretical approach allows us to analyze the effect of the vibrational mode displacement , a key factor that enters the SRS intensity expression but cannot be easily accessed from experiments52, 53. To this end, we revisit the opening example of Figure 1A. In Figure 3 we show the highest occupied molecular orbitals (HOMOs) and lowest unoccupied molecular orbitals (LUMOs) of PPCy-10a and MARS2237, as well as the corresponding parameters related to the vibrational mode displacement between the ground and excited electronic states. The electronic transition leads to a strong electron density generation on the CN vibration for MARS2237 but not for PPCy-10a (Figure 3, comparing the HOMO-LUMO difference in the connected dashed-gray boxes). As we see from the values, the CN bond in MARS2237 has to stretch more to reach the equilibrium position when electronically excited, leading to a stronger SRS signal for this mode. The large difference in the epr-SRS signal strengths for the two probes then becomes straightforward according to eq 5, despite the fact that they exhibit similar characteristic absorption properties.
Figure 3 also reveals that simply adding more nitrile groups does not necessarily increase the overall SRS intensity. The specific comparison of MARS2237 (containing one nitrile) and PPCy-10a (containing two nitriles) is an extreme example. Additionally, in the third column of Figure 3 we present the FC-10 molecule, which contains three nitrile groups. Here, in contrast to PPCy-10a, all CN bonds are coupled to the electronic system of the dye and participate in the electronic transition. However, the coupling is weaker than in MARS2237, as demonstrated by the values of the dimensionless displacement parameter . Interestingly, in the normal mode basis, there are only two modes with non-zero displacement. We explain this by the fact that the two CN bonds labeled “b” and “c” in Figure 3 are equally displaced in the excited electronic state. Therefore, their symmetric linear combination forms a normal mode that is displaced and Raman active, whereas their antisymmetric combination is not.
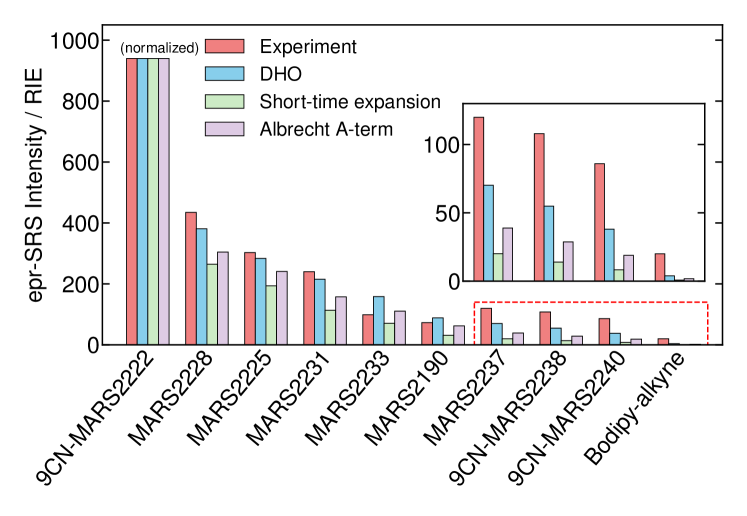
Figure 4 compares the SRS intensities of several probes simulated with the full DHO expression and two approximate expressions, the short-time expansion (eq 8) and Albrecht A-term (eq 9) formulas. As expected, both expressions are less accurate than the DHO method. Since the overall computational cost of the three approaches is almost the same and is contained mostly in the required quantum chemistry calculations, the DHO expression is recommended over the other two when a quantitative agreement is needed. Nevertheless, the qualitative trends in the intensity strength are exactly reproduced. Therefore, we can use these simpler and more interpretable expressions to seek design principles for highly sensitive pre-resonance Raman probes.
Detuning (), transition dipole moment (), and the Raman mode displacement () are the three factors that are highlighted in the Albrecht A-term formula (eq 9). The epr-SRS intensity increases steeply with an increase in either the transition dipole moment or the reciprocal of the detuning to the fourth order. Molecular probes with strong oscillator strengths are always preferred, while one carefully chooses the detuning, i.e. optimal pre-resonance regime, to tip the balance between high Raman signal strength and signal-to-background ratio, as discussed in the previous experimental work5. To better illustrate the principles derived from the theoretical analysis, in Table 3 we present an example where three structural isomers of (9CN-)MARS2228 are proposed and investigated as potential molecular probe candidates. The isomers, for which the nitrile group is attached at various positions on the conjugated aromatic ring, have not been reported before in the literature and are proposed here. Among the four molecules, the 9CN- substituted one exhibits the lowest-energy absorption maximum, leading to the smallest detuning and, hence, the strongest SRS intensity when the pump laser is consistently fixed at 838 nm. The 9CN- isomer also exhibits the strongest vibrational displacement and can, therefore, be expected to provide a stronger SRS signal even if the detuning is fixed to the same value for different molecules, i.e., even if the pump laser can be freely tuned for each molecule. An example of such calculations is shown in the bottom row of Table 3. Combining all of these factors together, it is not surprising that MARS2228 is listed as one of the most sensitive epr-SRS Raman probes to date. And as a pre-screening step, our computation may greatly facilitate the development of new epr-SRS scaffolds.
We can similarly analyze the differences between the nitrile- and alkyne-based probes. For example, the alkyne MARS2190 probe exhibits a weaker SRS signal than its nitrile-based structural analog bearing a similar chromophore (Si-pyronin), the MARS2225 probe (see Table 1 for structures and Figure 2 for intensities). Here, the displacement factors of around 0.146 for MARS2225 and 0.154 for MARS2190 cannot explain this discrepancy. In fact, in this case, we can explain the difference between the nitrile and alkyne dyes through their absorption properties, namely the dipole strength and detuning. Specifically, if we neglect the displacement factor, the ratio of their Raman intensities within the Albrecht approximation is , which agrees well with the experimental value of (see Table 2, pump laser at 860 nm).
The Albrecht A-term equation considers the contribution to the Raman intensity solely from the specific vibrational mode. In contrast, the short-time expansion is useful when analyzing the influence of other (spectator) vibrational modes. More specifically, eq 8 can be rewritten as
| (11) |
where the second part of the expression depends only on , a dimensionless factor that involves the displacement of all modes, including spectator modes.
When approaches zero, the impact of the spectator modes on the Raman intensity becomes negligible, i.e., the -dependent term becomes (see Figure S2), which corresponds to the relatively-large-detuning limit of Albrecht.43 On the other hand, reaches its optimum at , for which the short-time expansion gives roughly three times stronger intensity than Albrecht equation. That is to say, once the electronic transition properties associated with the Raman mode of interest are optimally tuned, additional fine functionalization of the spectator modes could further enhance the spectral intensity (see Supporting Information Sec. 3 for further discussion). However, as seen from Table 3, it is recognized as a mild effect compared with the aforementioned three key factors and is not expected to be the first target in the optimization protocol.
| Structure |
![[Uncaptioned image]](/html/2303.04922/assets/x7.png)
|
|||
| Isomers | 9CN-MARS2228 | 1CN-MARS2228 | 5CN-MARS2228 | 8CN-MARS2228 |
| /nm | 605 | 540 | 520 | 536 |
| /a.u. | 37.2 | 35.8 | 30.0 | 35.7 |
| 0.175 | 0.0583 | 0.0200 | 0.0595 | |
| 0.41 | 0.29 | 0.36 | 0.34 | |
| /cm-1 | 1572 | using the same detuning as 9CN-MARS2228 | ||
| /arb. u. | 2.24e+05 | 1.96e+04 | 1.81e+03 | 2.19e+04 |
5 Conclusion
To conclude, we have demonstrated that theoretical modeling can elucidate the chemical principles behind vastly different epr-SRS signals from different molecular scaffolds. The computational protocol is both robust and efficient in predicting the epr-SRS intensities and could lead towards a rational design of new epr-SRS scaffolds. Importantly, it allows us to decompose the final SRS intensity into three key factors, namely the (a) detuning, (b) transition dipole strength, and (c) vibrational mode displacement. We showed that the strength of vibronic coupling of the specific chemical bond can be visualized by the electron density distribution during the electronic transition in the epr-SRS setting. In addition, we analyzed the applicability of approximate Albrecht and short-time expressions, which can explicitly separate these parameters. Overall, although not as accurate as the full DHO model, these approximate formulas are still useful because of their interpretability.
This work provides a fundamental step towards a computationally or data-driven methodology of epr-SRS probe design, ensuring efficient utilization of experimental efforts by avoiding traditional trial-and-error procedures. In our simulations, we have observed that the relative values of the transition dipole strength and vibrational mode displacement parameters can be sufficiently accurately modeled from quantum chemistry calculations at the TDDFT level of theory, whereas the detuning cannot. This implies two possible strategies for future work. In a purely computational approach, explicitly correlated electronic structure methods could be used for determining the vertical excitation energy to high accuracy in order to minimize the error in the detuning parameter. Alternatively, in a hybrid, experimental and computational data-driven approach, experimentally available electronic absorption spectra could be used for a range of existing dyes that do not necessarily contain a nitrile or alkyne group. Then, different isomers of such dyes with a nitrile or alkyne substitution could be computationally screened for strong vibrational mode displacement, assuming that the absorption maximum is red-shifted in a predictable way6 after the addition of these functional groups. This opens new avenues for designing next-generation highly-sensitive epr-SRS palettes, driving the detection limit down to the ultimate single-molecule level. In either case, our work presents the necessary theoretical and computational basis for future design strategies.
L.W. acknowledges support from NIH Director’s New Innovator Award (GM140919). T.B. acknowledges financial support from the Swiss National Science Foundation through the Early Postdoc Mobility Fellowship (grant number P2ELP2-199757). We thank Dr. Martin J. Schnermann for sharing the FC10 dye. The computations presented here were conducted in the Resnick High Performance Computing Center, a facility supported by Resnick Sustainability Institute at the California Institute of Technology.
Computational and experimental details, connection between short-time and Albrecht equations, Duschinsky and Herzberg–Teller effects on the absorption spectra of MARS probes, comparison between the simulated and experimental transition dipole strengths
References
- Ploetz et al. 2007 Ploetz, E.; Laimgruber, S.; Berner, S.; Zinth, W.; Gilch, P. Femtosecond stimulated Raman microscopy. Appl. Phys. B 2007, 87, 389–393
- Freudiger et al. 2008 Freudiger, C. W.; Min, W.; Saar, B. G.; Lu, S.; Holtom, G. R.; He, C.; Tsai, J. C.; Kang, J. X.; Xie, X. S. Label-free biomedical imaging with high sensitivity by stimulated Raman scattering microscopy. Science 2008, 322, 1857–1861
- Ozeki et al. 2009 Ozeki, Y.; Dake, F.; Kajiyama, S.; Fukui, K.; Itoh, K. Analysis and experimental assessment of the sensitivity of stimulated Raman scattering microscopy. Opt. Express 2009, 17, 3651–3658
- Du et al. 2022 Du, J.; Wang, H.; Wei, L. Bringing Vibrational Imaging to Chemical Biology with Molecular Probes. ACS Chem. Biol. 2022, 17, 1621–1637
- Wei et al. 2017 Wei, L.; Chen, Z.; Shi, L.; Long, R.; Anzalone, A. V.; Zhang, L.; Hu, F.; Yuste, R.; Cornish, V. W.; Min, W. Super-multiplex vibrational imaging. Nature 2017, 544, 465–470
- Miao et al. 2021 Miao, Y.; Qian, N.; Shi, L.; Hu, F.; Min, W. 9-Cyanopyronin probe palette for super-multiplexed vibrational imaging. Nat. Commun. 2021, 12, 4518
- Shi et al. 2022 Shi, L.; Wei, M.; Miao, Y.; Qian, N.; Shi, L.; Singer, R. A.; Benninger, R. K.; Min, W. Highly-multiplexed volumetric mapping with Raman dye imaging and tissue clearing. Nat. Biotechnol. 2022, 40, 364–373
- Lee et al. 2021 Lee, D.; Qian, C.; Wang, H.; Li, L.; Miao, K.; Du, J.; Shcherbakova, D. M.; Verkhusha, V. V.; Wang, L. V.; Wei, L. Toward photoswitchable electronic pre-resonance stimulated Raman probes. J. Chem. Phys. 2021, 154, 135102
- Ao et al. 2021 Ao, J.; Fang, X.; Miao, X.; Ling, J.; Kang, H.; Park, S.; Wu, C.; Ji, M. Switchable stimulated Raman scattering microscopy with photochromic vibrational probes. Nature communications 2021, 12, 1–8
- Shou and Ozeki 2021 Shou, J.; Ozeki, Y. Photoswitchable stimulated Raman scattering spectroscopy and microscopy. Optics Letters 2021, 46, 2176–2179
- Fujioka et al. 2020 Fujioka, H.; Shou, J.; Kojima, R.; Urano, Y.; Ozeki, Y.; Kamiya, M. Multicolor activatable Raman probes for simultaneous detection of plural enzyme activities. J. Am. Chem. Soc. 2020, 142, 20701–20707
- Kawatani et al. 2022 Kawatani, M.; Spratt, S. J.; Fujioka, H.; Shou, J.; Misawa, Y.; Kojima, R.; Urano, Y.; Ozeki, Y.; Kamiya, M. 9-Cyano-10-telluriumpyronin derivatives as red-light-activatable Raman probes. Chemistry–An Asian Journal 2022,
- Xiong et al. 2019 Xiong, H.; Shi, L.; Wei, L.; Shen, Y.; Long, R.; Zhao, Z.; Min, W. Stimulated Raman excited fluorescence spectroscopy and imaging. Nat. photonics 2019, 13, 412–417
- Fischer et al. 2009 Fischer, G. M.; Isomäki-Krondahl, M.; Göttker-Schnetmann, I.; Daltrozzo, E.; Zumbusch, A. Pyrrolopyrrole cyanine dyes: A new class of near-infrared dyes and fluorophores. Chem. Eur. J. 2009, 15, 4857–4864
- Kumble et al. 1998 Kumble, R.; Rush, T. S.; Blackwood, M. E.; Kozlowski, P. M.; Spiro, T. G. Simulation of Non-Condon Enhancement and Interference Effects in the Resonance Raman Intensities of Metalloporphyrins. J. Phys. Chem. B 1998, 102, 7280–7286
- Bailey et al. 2000 Bailey, S. E.; Cohan, J. S.; Zink, J. I. Interference effects of multiple excited states in the resonance Raman spectroscopy of CpCoCOD. J. Phys. Chem. B 2000, 104, 10743–10749
- Petrenko and Neese 2007 Petrenko, T.; Neese, F. Analysis and prediction of absorption band shapes, fluorescence band shapes, resonance Raman intensities, and excitation profiles using the time-dependent theory of electronic spectroscopy. J. Chem. Phys. 2007, 127, 164319
- Petrenko and Neese 2012 Petrenko, T.; Neese, F. Efficient and automatic calculation of optical band shapes and resonance Raman spectra for larger molecules within the independent mode displaced harmonic oscillator model. J. Chem. Phys. 2012, 137, 234107
- Egidi et al. 2014 Egidi, F.; Bloino, J.; Cappelli, C.; Barone, V. A Robust and Effective Time-Independent Route to the Calculation of Resonance Raman Spectra of Large Molecules in Condensed Phases with the Inclusion of Duschinsky, Herzberg–Teller, Anharmonic, and Environmental Effects. J. Chem. Theory Comput. 2014, 10, 346–363
- Baiardi et al. 2014 Baiardi, A.; Bloino, J.; Barone, V. A general time-dependent route to Resonance-Raman spectroscopy including Franck-Condon, Herzberg-Teller and Duschinsky effects. J. Chem. Phys. 2014, 141, 114108
- Rao et al. 2016 Rao, B. J.; Gelin, M. F.; Domcke, W. Resonant Femtosecond Stimulated Raman Spectra: Theory and Simulations. J. Phys. Chem. A 2016, 120, 3286–3295
- Quincy et al. 2018 Quincy, T. J.; Barclay, M. S.; Caricato, M.; Elles, C. G. Probing Dynamics in Higher-Lying Electronic States with Resonance-Enhanced Femtosecond Stimulated Raman Spectroscopy. J. Phys. Chem. A 2018, 122, 8308–8319
- de Souza et al. 2019 de Souza, B.; Farias, G.; Neese, F.; Izsák, R. Efficient simulation of overtones and combination bands in resonant Raman spectra. J. Chem. Phys. 2019, 150, 214102
- Mattiat and Luber 2021 Mattiat, J.; Luber, S. Time Domain Simulation of (Resonance) Raman Spectra of Liquids in the Short Time Approximation. J. Chem. Theory Comput. 2021, 17, 344–356
- Tannor 2006 Tannor, D. Introduction to Quantum Mechanics: A Time-Dependent Perspective; University Science Books, 2006; Chapter 14
- Schatz and Ratner 2002 Schatz, G. C.; Ratner, M. A. Quantum mechanics in chemistry; Courier Corporation, 2002
- Kramers and Heisenberg 1925 Kramers, H. A.; Heisenberg, W. Über die streuung von strahlung durch atome. Z. Phys. 1925, 31, 681–708
- Dirac 1927 Dirac, P. A. M. The quantum theory of dispersion. Proc. R. Soc. A 1927, 114, 710–728
- Lee and Heller 1979 Lee, S.-Y.; Heller, E. J. Time-dependent theory of Raman scattering. J. Chem. Phys. 1979, 71, 4777–4788
- Heller et al. 1982 Heller, E. J.; Sundberg, R.; Tannor, D. Simple aspects of Raman scattering. J. Phys. Chem. 1982, 86, 1822–1833
- Rohrdanz and Cina 2006 Rohrdanz, M. A.; Cina, J. A. Probing intermolecular communication via lattice phonons with time-resolved coherent anti-Stokes Raman scattering. Mol. Phys. 2006, 104, 1161–1178
- Makhov and Shalashilin 2021 Makhov, D. V.; Shalashilin, D. V. Simulation of the effect of vibrational pre-excitation on the dynamics of pyrrole Simulation of the effect of vibrational pre-excitation on the dynamics of pyrrole photo-dissociation. J. Chem. Phys. 2021, 154, 104119
- Worth and Lasorne 2020 Worth, G. A.; Lasorne, B. Gaussian Wave Packets and the DD-vMCG Approach. In Quantum Chemistry and Dynamics of Excited States; Gonzáles, L., Lindh, R., Eds.; John Wiley & Sons, Ltd, 2020; Chapter 13, pp 413–433
- Conte and Ceotto 2020 Conte, R.; Ceotto, M. Semiclassical Molecular Dynamics for Spectroscopic Calculations. In Quantum Chemistry and Dynamics of Excited States; Gonzáles, L., Lindh, R., Eds.; John Wiley & Sons, Ltd, 2020; Chapter 19, pp 595–628
- Bonfanti et al. 2018 Bonfanti, M.; Petersen, J.; Eisenbrandt, P.; Burghardt, I.; Pollak, E. Computation of the S1 S0 vibronic absorption spectrum of formaldehyde by variational Gaussian wavepacket and semiclassical IVR methods. J. Chem. Theory Comput. 2018, 14, 5310–4323
- Werther and Grossmann 2020 Werther, M.; Grossmann, F. Apoptosis of moving nonorthogonal basis functions in many-particle quantum dynamics. Phys. Rev. B 2020, 101, 174315
- Werther et al. 2021 Werther, M.; Choudhury, S. L.; Grossmann, F. Coherent state based solutions of the time-dependent Schrödinger equation: hierarchy of approximations to the variational principle. Int. Rev. Phys. Chem. 2021, 40, 81–125
- Curchod and Martínez 2018 Curchod, B. F. E.; Martínez, T. J. Ab Initio Nonadiabatic Quantum Molecular Dynamics. Chem. Rev. 2018, 118, 3305–3336
- Prlj et al. 2020 Prlj, A.; Begušić, T.; Zhang, Z. T.; Fish, G. C.; Wehrle, M.; Zimmermann, T.; Choi, S.; Roulet, J.; Moser, J.-E.; Vaníček, J. Semiclassical Approach to Photophysics Beyond Kasha’s Rule and Vibronic Spectroscopy Beyond the Condon Approximation. The Case of Azulene. J. Chem. Theory Comput. 2020, 16, 2617–2626
- Vaníček and Begušić 2021 Vaníček, J.; Begušić, T. Ab Initio Semiclassical Evaluation of Vibrationally Resolved Electronic Spectra With Thawed Gaussians. In Molecular Spectroscopy and Quantum Dynamics; Marquardt, R., Quack, M., Eds.; Elsevier, 2021; pp 199–229
- Begušić and Vaníček 2021 Begušić, T.; Vaníček, J. Efficient semiclassical dynamics for vibronic spectroscopy beyond harmonic, Condon, and zero-temperature approximations. CHIMIA 2021, 75, 261
- Begušić et al. 2022 Begušić, T.; Tapavicza, E.; Vaníček, J. Applicability of the Thawed Gaussian Wavepacket Dynamics to the Calculation of Vibronic Spectra of Molecules with Double-Well Potential Energy Surfaces. J. Chem. Theory Comput. 2022, 18, 3065–3074
- Albrecht 1961 Albrecht, A. C. On the Theory of Raman Intensities. J. Chem. Phys. 1961, 34, 1476–1484
- Asher 1988 Asher, S. A. UV resonance Raman studies of molecular structure and dynamics: applications in physical and biophysical chemistry. Annu. Rev. Phys. Chem. 1988, 39, 537–588
- Hassing and Mortensen 1981 Hassing, S.; Mortensen, O. S. The roles of vibronic coupling and the Duschinsky effect in resonance Raman scattering. J. Mol. Spec. 1981, 87, 1–17
- Neese et al. 2020 Neese, F.; Wennmohs, F.; Becker, U.; Riplinger, C. The ORCA quantum chemistry program package. J. Chem. Phys. 2020, 152, 224108
- Neese 2017 Neese, F. Software update: the ORCA program system, version 4.0. Wiley Interdiscip. Rev. Comput. Mol. Sci. 2017, 8, 73–78
- Kostjukov 2022 Kostjukov, V. V. Excitation of rhodamine 800 in aqueous media: a theoretical investigation. J. Mol. Model. 2022, 28, 52
- Matikonda et al. 2020 Matikonda, S. S.; Ivanic, J.; Gomez, M.; Hammersley, G.; Schnermann, M. J. Core remodeling leads to long wavelength fluoro-coumarins. Chem. Sci. 2020, 11, 7302–7307
- Majumdar et al. 2014 Majumdar, P.; Yuan, X.; Li, S.; Le Guennic, B.; Ma, J.; Zhang, C.; Jacquemin, D.; Zhao, J. Cyclometalated Ir (III) complexes with styryl-BODIPY ligands showing near IR absorption/emission: preparation, study of photophysical properties and application as photodynamic/luminescence imaging materials. J. Mater. Chem. B 2014, 2, 2838–2854
- Zhou et al. 2018 Zhou, Y.; Ma, C.; Gao, N.; Wang, Q.; Lo, P.-C.; Wong, K. S.; Xu, Q.-H.; Kinoshita, T.; Ng, D. K. Pyrrolopyrrole aza boron dipyrromethene based two-photon fluorescent probes for subcellular imaging. J. Mater. Chem. B 2018, 6, 5570–5581
- Lee et al. 2019 Lee, J.; Crampton, K. T.; Tallarida, N.; Apkarian, V. Visualizing vibrational normal modes of a single molecule with atomically confined light. Nature 2019, 568, 78–82
- Xu et al. 2021 Xu, J.; Zhu, X.; Tan, S.; Zhang, Y.; Li, B.; Tian, Y.; Shan, H.; Cui, X.; Zhao, A.; Dong, Z. et al. Determining structural and chemical heterogeneities of surface species at the single-bond limit. Science 2021, 371, 818–822