Followback Clusters, Satellite Audiences, and Bridge Nodes:
Coengagement Networks for the 2020 US Election
Abstract
The 2020 United States (US) presidential election was — and has continued to be — the focus of pervasive and persistent mis- and disinformation spreading through our media ecosystems, including social media. This event has driven the collection and analysis of large, directed social network datasets, but such datasets can resist intuitive understanding. In such large datasets, the overwhelming number of nodes and edges present in typical representations create visual artifacts, such as densely overlapping edges and tightly-packed formations of low-degree nodes, which obscure many features of more practical interest. We apply a method, coengagement transformations, to convert such networks of social data into tractable images. Intuitively, this approach allows for parameterized network visualizations that make shared audiences of engaged viewers salient to viewers. Using the interpretative capabilities of this method, we perform an extensive case study of the 2020 United States presidential election on Twitter, contributing an empirical analysis of coengagement. By creating and contrasting different networks at different parameter sets, we define and characterize several structures in this discourse network, including bridging accounts, satellite audiences, and followback communities. We discuss the importance and implications of these empirical network features in this context. In addition, we release open-source code for creating coengagement networks from Twitter and other structured interaction data.
Introduction
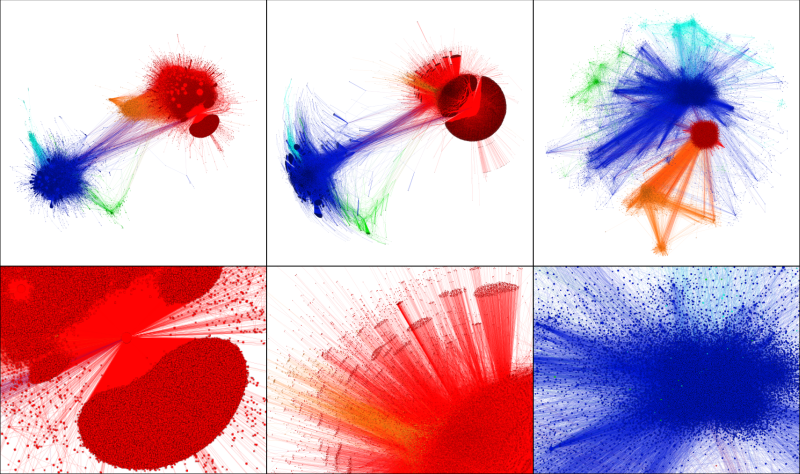
The 2020 United States (US) presidential election was — and has continued to be — the focus of pervasive and persistent mis- and disinformation spreading through our media ecosystems, including social media (Center for an Informed Public et al. 2021; Benkler et al. 2020). Efforts to understand these dynamics have driven the collection and curation of large social media datasets, and the subsequent production of large, directed network representations of social interactions to make sense of them (Abilov et al. 2021; Kennedy et al. 2022). But such network datasets can resist intuitive understanding. In large network datasets, the overwhelming number of nodes and edges present in typical representations create visual artifacts, such as densely overlapping edges and tightly-packed formations of low-degree nodes, which obscure many features of more practical interest (Nocaj, Ortmann, and Brandes 2015; Schulz and Hurter 2013) (Figure 1). In the case of the US presidential election, one feature of particular interest is the functional level of interaction between different political communities who, due partly to pervasive misinformation spread in this country’s right-wing media ecosystems, no longer share a common understanding of the election’s outcome (Pennycook and Rand 2021; Reuters 2021). Critical to understanding these inter-community interactions is characterizing the role of platform elites, who are responsible for a disproportionate share of election-related misinformation (Center for an Informed Public et al. 2021).
Here, we present an extensive case study on a dataset of English-language Twitter posts relating to the 2020 US presidential election. We take advantage of the interpretative capabilities of coengagement networks, which are similar to the co-citation networks widely used in bibliographic scholarship. This dataset, totaling 585M retweets collected from September 1st, 2020 to December 18, 2020, contains tweets referencing generic English-language terms related to voting and the election, with a focus on tweets relating to election misinformation. In practice, this dataset contains public discourse related not only to the presidential election, but also discourse related to the persistent and false claims that the results of the election were fraudulent. We create and interrogate three different coengagement networks of retweets filtered under different parameter sets, describing via a mixed-methods analysis how the salient features of these networks correspond to different discourse phenomena. These phenomena include bridge nodes, users that are retweeted by multiple and disparate audiences; satellite audiences, groups of detached users which connect to mainstream conversations in very specific ways; and followback clusters, unique and highly active groups of users that incessantly retweet each other and very specific mainstream accounts. Our analysis of followback clusters particularly shows how Twitter’s much-noted mass account removals in the wake of the 2021 attack on the US Capitol Building particularly affected these followback groups.
Our empirical and methodological contributions together are themselves a case study in the proposed triangulation analysis method, where the intersection of understandings from multiple, sometimes contradictory networks generates greater knowledge than any one network alone (Brandes 1999; Doreian 1988). We conclude this paper by discussing the advantages of coengagement networks over other social network formats, the importance of triangulation as a method for analysis of social networks, and future extensions and ethical considerations for using such a method.
Background
Mis/Disinformation, Platform Elites, and US Presidential Elections
Researchers have demonstrated the critical value of networks and network visualizations in efforts to identify key actors in political mis- and disinformation campaigns (Starbird, Arif, and Wilson 2019; Starbird 2017). Even within work in this domain, however, the terms mis- and disinformation themselves have been variously defined (Jack 2017), sometimes eschewed in favor of the broader term “influence operations” (Wanless and Pamment 2019), and sometimes even criticized as a contemporary moral panic (Mejia, Beckermann, and Sullivan 2018; Carlson 2020). For this paper, we simply define mis- and disinformation of interest as the unintentional and intentional spread of false or misleading claims that the results of the 2020 US presidential election were fraudulent. While previous research on disinformation in the 2016 US presidential election focused on foreign interference (Lukito 2020), recent analyses of disinformation in the 2020 US presidential election have focused on domestic right-wing campaigns coordinated by elites on social media and beyond (Center for an Informed Public et al. 2021; Benkler et al. 2020). Recent research has shown how platform elites vary between different political groupings in the US, and have highlighted their role in spreading misinformation during the COVID-19 pandemic (Gallagher et al. 2021).
Challenges in Visualizing Social Networks
Network visualizations of large social data can provide valuable insight into the structure of online conversations, and these visualizations have become increasingly popular as representations of computational social science’s promise (Foucault Welles and Meirelles 2015). A common goal in social network visualization is to highlight influential nodes and characterize the relationships they hold with one another (Arif, Stewart, and Starbird 2018; Stewart and Spiro 2021; Freelon, McIlwain, and Clark 2016). The simplest approach is to visualize the network in its observable entirety, with nodes representing user accounts and edges representing interactions between accounts. However, the large size of social media datasets, now often numbering in the millions or billions of nodes and edges so defined, can be intractable to visualize and render the exercise of doing so meaningless. Large social networks often encode multiple and seemingly contradictory dynamics at different scales, further exacerbating the difficulty in faithfully representing these phenomena to scholarly peers and the lay public (Jacomy 2021). These representational ambiguities can become especially misleading in the case of social data, where the lay-public often has strong priors about what to expect from the social world (Foucault Welles and Meirelles 2015).
A common solution to this problem of large graphs is to heuristically filter unimportant nodes (e.g. with low node degree) or edges (e.g. with low edge weight) until the visualization reaches a tractable size (Ham and Wattenberg 2008; Dianati 2016). Identifying those unimportant nodes and edges is a significant challenge, as the concept of importance is highly contingent on the interpretative aims of the researcher, and individually unimportant nodes may yet in the aggregate encode relevant structural information. Furthermore, there may be no single definition of node importance which addresses the full spectrum of phenomena represented by a social network. One innovation of particular relevance is the co-citation network developed in bibliographic network science, in which two published articles or authors are connected in a new work if other articles cite both of them together (Small 1973). Importance filtering based on frequency of interaction in co-citation networks is frequently implemented, and its effects on apparent resulting clusters have been analyzed in (Shaw Jr 1985). Co-citation networks have typically focused on scientific literature, although others have used similar principles in relation to the hyperlink structure of the web, most notably with Kleinberg’s concept of online hubs and authorities in search engine retrieval (Kleinberg 1999).
Here, we extend the concept of co-citation networks to social interaction data in what we call the coengagement network. Like co-citation networks, this method significantly reduces the number of nodes visualized in large datasets, while encoding information from missing nodes in visible edges that can reveal significant relationships. Additionally, this method is also tunable, meaning that researchers can produce different visualizations according to different notions of node importance as defined by two interpretable parameters. A primary contribution is the application of co-citation principles to social data representing users, rather than documents, interacting with one another online.
Coengagement Networks
Coengagement networks are closely related to the method of projection in bipartite graphs. In a typical bipartite projection, a network with two types of nodes and no within-group connections (such as a network composed of researchers and the papers that they author (Newman 2001)) is projected into one primary node type, with the remaining node type being collapsed into edge representations. This operation can productively reduce the number of nodes and edges to be visualized and analyzed, and preserves information about a primary node type while still retaining structural information from the projected node type. While we would not expect engagement networks among social media users to be bipartite, we aim to take advantage of the visual and analytical properties of bipartite projections, and therefore propose a transformation of non-bipartite graphs into bipartite graphs via the duplication of each node into two types: engaging and receiving nodes. We then project the resulting bipartite network such that engaging nodes are collapsed into edges between receiving nodes. In the context of users on Twitter, for example, this method privileges users with large audiences engaging in retweeting, commenting, liking, or even viewing, and defines relationships between users in terms of sharing similarly engaged audiences.
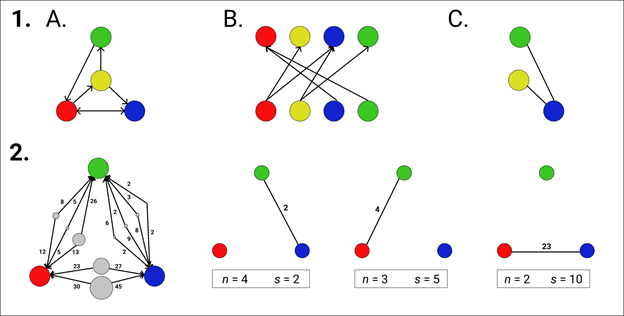
Formally, we define a directed graph G = (V, E, w) with vertices V, edges E, and edge weights w. In the current case study, we interpret G as a collection of Twitter users (V) retweeting other users (E), with edge weights w defined as the total number of retweets from one user to another. We then define a new graph G′ with vertices V′ , which contains duplicate sets of vertices VS and VR that send and receive retweets, respectively. We similarly define a new set of undirected, weighted edges E′ in G′, where directed edges from Vi to Vj are represented as undirected edges from VSi to VRj, with the same weights w′. In effect, each original user has a vertex representing the instances in which they retweet others, and a separate vertex representing when they are retweeted. We then define a projection of G′ as X, such that vertices in X are the interaction-receiving vertices VR, and edges in X are defined such that the edge weight between any two vertices i, j in X is the number of vertices in VS that have defined edges to both VRi and VRj. This final vertex set in the projected graph represents users that are retweeted and draws edges between them when they are jointly retweeted by at least one other user. We finally define two edge filtering parameters n and s on the resulting graph X. Specifically, an edge between two users in X is defined if at least n other users have retweeted both users at least s times each. The parameter n represents a minimum diversity of users retweeting two users, while s represents the minimum volume of retweeting a user must do to be considered in n.
The n and s parameters, which in practice control the number and distribution of edges in a coengagement network, are a powerful tool for targeting specific visualizations. These edge filtering parameters allow researchers to shape the output of their networks along two important, yet distinct, qualitative dimensions by modifying the distribution of edges between users. When researchers filter with a higher n value, influential users are related only if they attract engagement from large, diverse audiences, a typical goal in influential user analysis. When researchers filter with a higher s value, nodes are instead related by audiences that frequently retweet their content with a dataset, which can reveal dedicated rather than transient audiences. Different ratios of n to s can reveal other relationships: low n with high s can make highly active and coordinated audiences more salient, whereas low s with high n make more salient those infrequent instances in which content is shared widely across different communities.
In what follows, we present a series of case studies using a dataset of tweets related to the 2020 US presidential election. Specifically, we use a dataset of 585M Twitter posts containing substrings related to voting and the election (‘vote’, ‘voting’, ‘mail’, ‘ballot’, ‘poll’, and ‘election.’), define nodes as the authors of these posts, and (unprojected) edges as retweets from one user to another. We do not include quote tweets. We show that depending on the choice of the parameters n and s, different clusters of influential nodes can be distinguished, and different forms of qualitative analysis can be applied. In doing so, we demonstrate the practical implications of coengagment networks and their interpretation. Empirically, these case studies offer a unique look at engagement during the 2020 presidential election.
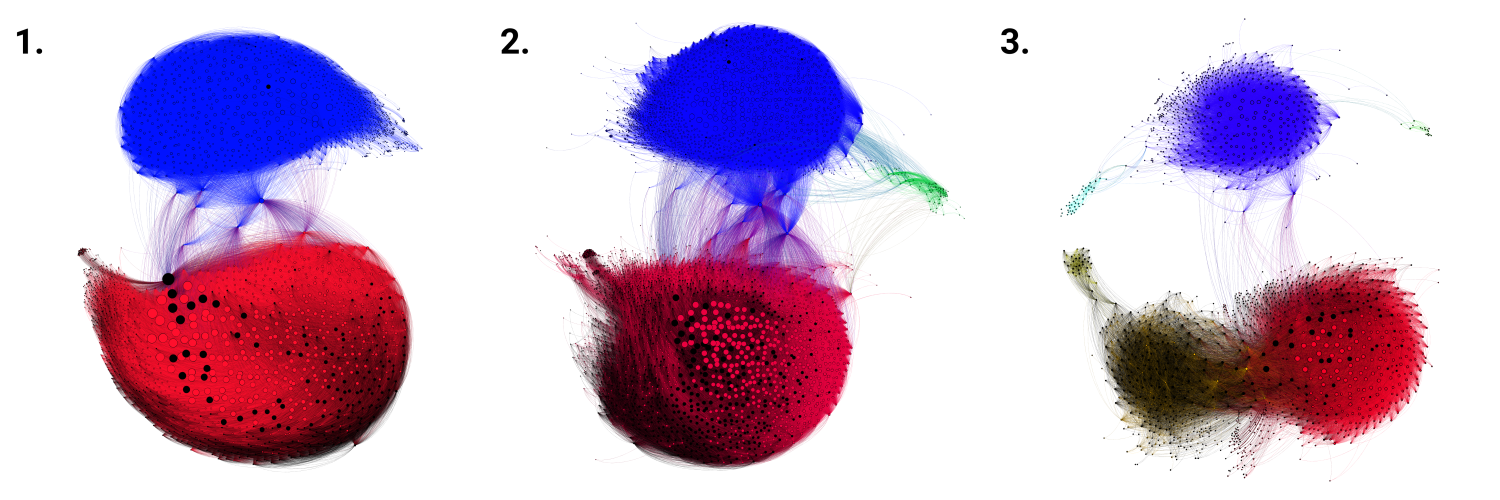
In the first case study, we choose a very high value of n and s = 1 to create a network that shows a broadly two-part structure to Twitter discussions around the presidential election, aligned with pro-Trump and pro-Biden accounts. The low s parameter highlights transient instances of high-volume crossover between these two groups but does not necessarily represent sustained engagement across these groups. We then choose a parameter set with much lower n and slightly higher s, to illustrate how a third pro-socialist grouping becomes salient at different audience sizes, and how some crossover nodes do not hold sustained engagement. We end with a third case study at very high s and very low n, to highlight two new followback communities that become salient when active, sustained engagement is prioritized over large audiences.
Findings
Case 1: Bridging Between Clusters at High Audience Sizes
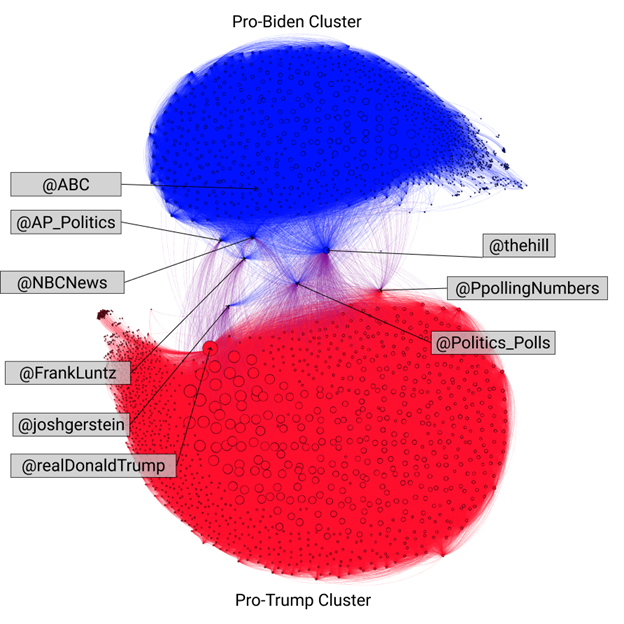
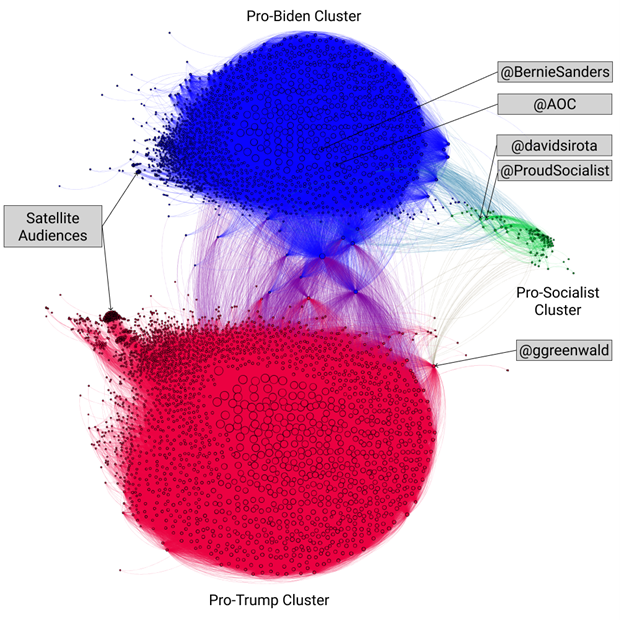
In Case 1, we generate a coengagement network where node relationships are defined by low restrictions on retweet frequency (s = 1), but high restrictions on total retweet volume (n = 10,000, Figure 3). In this and future visualizations, we use the ForceAtlas2 (Jacomy et al. 2014) visualization algorithm as implemented in the application Gephi (Bastian, Heymann, and Jacomy 2009). Intuitively, this means that two nodes are connected if at least 10,000 users retweeted both at least once during the period of this dataset, and nodes with more users retweeting both of them are more tightly linked together. Visualizing this projection reveals two tightly interconnected communities of influential users discussing the US presidential election, which we term and briefly describe as pro-Trump, and pro-Biden clusters. The pro-Trump cluster is anchored around Donald Trump’s account, and includes an array of pro-Trump political activists, political organizations, politicians, media outlets, journalists, anonymous and self-identified online influencers, activists from the antifeminist “manosphere” online culture, and conspiracy-based QAnon communities. The pro-Biden cluster includes an array of politicians, journalists, media outlets, and online influencers, some of which self-identify as pro-Biden or liberal, and others of which, such as the television network CNN, identify as non-partisan but rejected false pro-Trump claims of election fraud.
Overall, 2,499 nodes are generated in this graph, with 1,385 nodes in the pro-Trump cluster (55%) and 1,114 nodes in the pro-Biden cluster (45%). However, this set of retweets may be biased towards pro-Trump accounts due to our focus on terms related to election misinformation disproportionately spread by pro-Trump accounts.
We use the “pro-” descriptor to describe clusters as a whole, but some individual members of these clusters may identify themselves otherwise. We also use the terms pro-Trump and pro-Biden, rather than Republican and Democrat, to illustrate the extent to which traditional US party alignments are contradicted in the membership of these clusters. The Lincoln Project, a Republican advocacy group that supports conservative causes, is one of the most prominent accounts in the pro-Biden cluster, while many accounts in the pro-Trump cluster have ambivalent stances towards the Republican party outside of Trump. Their membership in a community is contingent not on their core beliefs or associations, but on their behavior in the dataset we observe, namely their posting behavior in the months before and after the presidential election. In datasets with the same users but different topics of discussion, the membership of individual users may change.
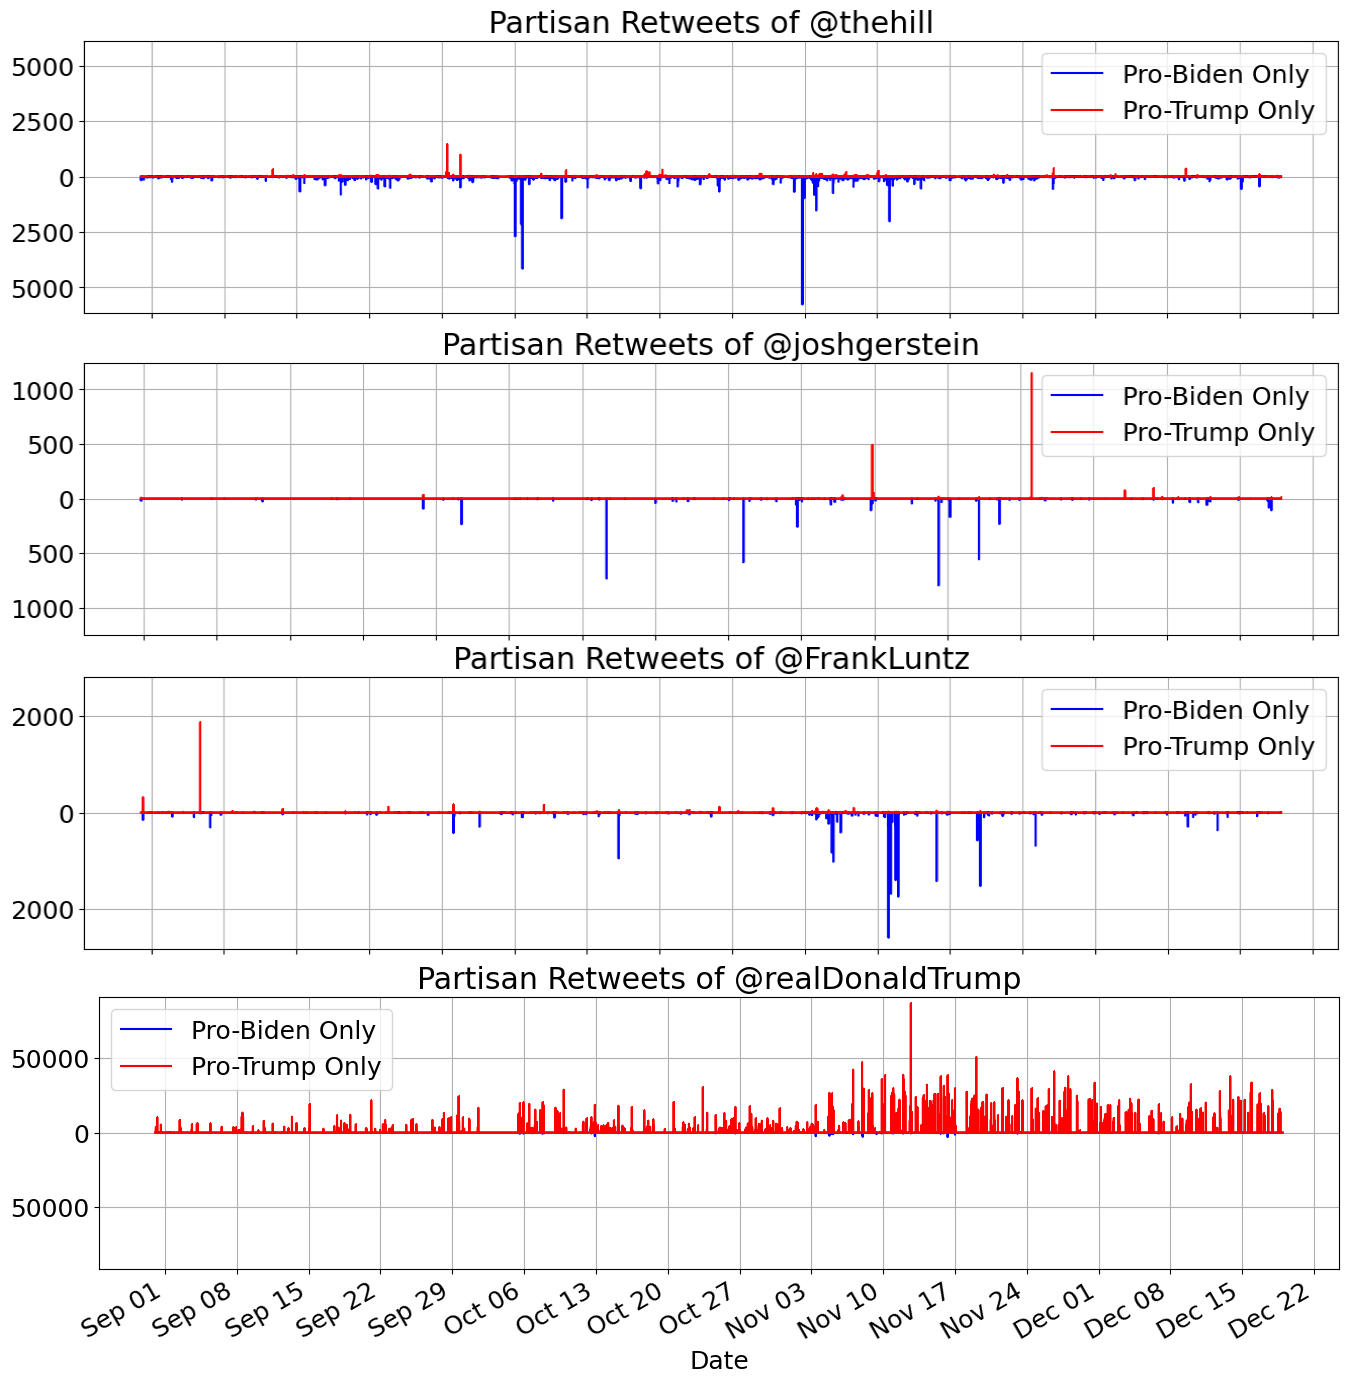
Audiences rarely retweet across clusters in large numbers, and when they do, they tend to retweet a select few cluster-spanning nodes. Almost all (98%) cross-cluster connections route through only eight nodes, labelled in Figure 3. These bridging nodes serve different functions in this discourse environment, and connect people in different ways (Figure 4). The most common form of bridging node was one where the account generally created two types of tweets, one that appealed to pro-Trump audiences, and one that appealed to pro-Biden audiences. The most transparent examples of these accounts were those that tracked polling results (@PpollingResults, @Politics_Polls, @AP_Politics, @NBCNews, @APPolitics), where those results and polls that favored Biden were retweeted by pro-Biden accounts, and those that favored Trump were retweeted by pro-Trump accounts. However, this form of apparent bridging also occurred when media accounts reported in neutral tones on events that fed preexisting pro-Trump and pro-Biden narratives respectively. The journalist account @joshgerstein was separately retweeted by both clusters for neutrally reporting on Trump’s attempts to contest the election results, with apparent pro-Trump legal judgments being more retweeted by pro-Trump users and their subsequent legal refutations more retweeted by pro-Biden users. The alternating quality of these nodes complicates the notion that they bridge communities, as their tweets are most often disproportionately shown to only one community at a time.
A special form of this alternating bridging occurred with the account @FrankLuntz, which posted updates on polls and predictions about the outcome of the presidential election. Before election day, this account was sometimes critical of Biden and released some predictions favorable to Trump, which led it to garner a slightly right-leaning cumulative audience. After the election, this account was resolute in affirming Biden’s victory in the face of false pro-Trump claims of election fraud, then earning a growing pro-Biden audience. This account displays the sensitivity of such analyses to dataset selection, as a pre-election discourse analysis would likely place the account firmly in the pro-Trump cluster, whereas a post-election discourse in the pro-Biden, and when combined, firmly between. It was rare when accounts created posts that consistently appealed to audiences in both clusters. Some individual posts had equal appeal across clusters, such as when polling accounts released vote tallies tied at nearly 50% in critical states. Other posts that had a similar appeal were simply neutral statements of fact about recent news relating to the presidential election, which were made particularly often by the account for the online news organization The Hill (@thehill). While pro-Biden leaning, the Hill’s account was one of the only accounts to consistently find engagement from both pro-Biden and pro-Trump accounts across this election time period.
The last significant point of crossover between the pro-Trump and pro-Biden clusters is the account for former president Trump itself (@realDonaldTrump). This circumstance reveals that though we imply for much of this analysis that retweets constitute endorsements, they do not always behave as such. Many pro-Biden accounts may be retweeting Trump’s account simply because his tweets are often consequential in and of themselves, even when they are clearly opposed to Biden’s election to the presidency. In several instances, pro-Biden users likely retweeted Trump’s tweets sarcastically, such as when pro-Biden users disproportionately retweeted an old tweet from 2012 reading: “Scary thought–@JoeBiden is a heartbeat away from the Presidency.”
Case 2: Third Party and Satellite Audiences at Lower Audience Sizes
| Top Election Accounts by Cross-Cluster Connections (Case 2) | |||||||||||||||||
| Biden-Trump | Biden-socialist | Trump-socialist | |||||||||||||||
| Account Name |
|
Account Name |
|
Account Name |
|
||||||||||||
| thehill | 24% | Proudsocialist | 16% | ggreenwald | 79% | ||||||||||||
| PpollingNumbers | 18% | BernieSanders | 13% | jimmy_dore | 9% | ||||||||||||
| Politics_Polls | 11% | davidsirota | 12% | TulsiGabbard | 6% | ||||||||||||
| realDonaldTrump | 7% | AOC | 11% | aaronjmate | 6% | ||||||||||||
| AP_Politics | 6% | briebriejoy | 10% | ||||||||||||||
| threadreaderapp | 5% | KyleKulinski | 7% | ||||||||||||||
| Garrett_Archer | 5% | IlhanMN | 6% | ||||||||||||||
| spectatorindex | 4% | ryangrim | 5% | ||||||||||||||
| FrankLuntz | 3% | peterdaou | 5% | ||||||||||||||
| DecisionDeskHQ | 3% | RBReich | 3% | ||||||||||||||
In Case 1, a high n parameter demonstrated the nodes and graph structure of accounts with a relatively high volume of retweets over this dataset. While revealing the relatively few shared points of reference between pro-Biden and pro-Trump audiences, groups of users with smaller retweet bases are not visible in this graph. To visualize these communities, we generate the same data at a dataset with lower n, instead filtering by s to keep the size of the node and edge set tractable. Specifically, we generate a network in which links are defined when two nodes are shared by 100 users four times (n = 100, s = 5, Figure 5). After removing non-US clusters, this reveals a third group of nodes that we term the pro-socialist cluster. The pro-socialist cluster, much smaller than either the pro-Biden or pro-Trump clusters, is centered around multiple political activists, journalists, and influencers associated with US democratic socialist candidates and causes. We note that, like the pro-Biden and pro-Trump cluster, that this cluster does not contain all pro-socialist accounts, and some of its members may not identify as such. Indeed, popular democratic socialist presidential candidate Bernie Sanders is located in the pro-Biden cluster rather than pro-socialist cluster, likely due to his widespread popularity and continued public support for Biden during this election.
At a lower volume of retweeting, more bridges appear between the pro-Biden and pro-Trump clusters, and new bridges are generated between the pro-socialist and other clusters. Notably, the relative importance of some bridges changes under the new requirement for repeated engagement (s = 5). For example, the account for reporter @joshgerstein has no cross-cutting connections in this graph, despite being responsible for 7% of all connections in the first graph. This discrepancy is likely caused by how much of this account’s pro-Trump retweet engagement comes from only two tweets, both, describing in a neutral tone, updates on pro-Trump attempts to legally invalidate the results of the election. This change demonstrates the effect of the s parameter, which can be tuned upward to select nodes for sustained engagement over a dataset, rather than widespread but momentary engagement in critical posts. The opposite effect can also be seen in those new nodes that appear as significant bridges. The spam media account @spectatorindex becomes a bridging node in Case 2, due to its sustained but low level of engagement, as do circumstantially important accounts like the governor of Arizona’s (@dougducey), whose state was the center of many false election fraud claims.
Bridges between the pro-socialist and other clusters illustrate the different modes of inter-cluster commonality that can exist between different user clusters in this graph (Table 1). Between the pro-Biden and pro-socialist clusters, there are many nodes that draw consistent engagement, including popular democratic socialist politicians Bernie Sanders, Alexandria Ocasio-Cortez, and Ilhan Omar, and an array of writers, podcast hosts and other online influencers associated with the socialist movement. Between the pro-Trump and pro-socialist clusters, however, there is little engagement, and all of it is mediated through three nodes. Most prominently among these nodes is Glenn Greenwald, a journalist who combined left-leaning views on topics such as surveillance with frequent engagement with right-wing media and criticism of mainstream media.
This second case study introduces a visualization feature which we had previously aimed to eliminate: tightly-packed clusters of low-degree nodes, in this case one-degree nodes mostly connected only to @realDonaldTrump. We note that while in ordinary graphs such nodes are usually uninteresting, in coengagement visualizations the relative isolation of these nodes reveals an important function in the election discourse environment. Particularly, many of these one-degree nodes are from communities plausibly isolated from mainstream US political discourse, but still displaying, for example, a contextual support for Trump or Biden. We term edges stemming from these nodes as satellite audiences, with inspiration from (Squires 2002).
These nodes include accounts from other countries and/or in other languages, such as high-follower right-wing accounts writing for Japanese or Brazilian audiences. Such accounts are unlikely to interact with the majority of English-language right-wing accounts prominent in this graph, but may retweet Trump as a signal of nominal allegiance to his movement. Other low-degree nodes may originate in popular English-language, US-based communities that focus on topics usually unrelated to electoral politics. For example, the low-degree account for pop musician Ariana Grande, one of the most followed accounts on Twitter, connects only to Biden and fellow musician Lady Gaga, signaling a possible separation between entertainment-focused audiences and mainstream election-focused audiences.
Case 3: Followback Clusters at High-Frequency Engagement
Implicitly in the previous cases, structure is mostly determined by the number of users choosing to retweet two different accounts. However, as s increases and n decreases, structure is increasingly determined by repeated interactions by relatively small groups of users, which makes the actions of well-coordinated groups more salient. To illustrate this, we generate a graph where links are defined by 25 users retweeting two nodes at least 25 times each over the course of the dataset (n = 25, s = 25, Figure 6).
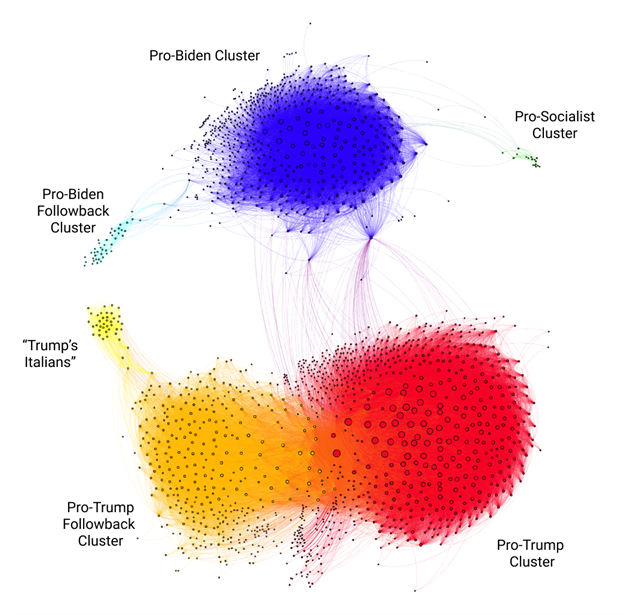
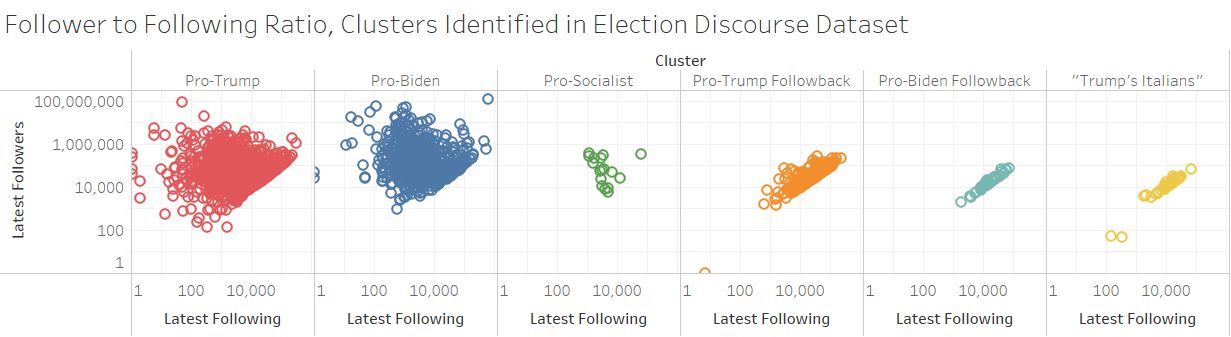
In this case, three new clusters emerge with ties to the existing pro-Trump and pro-Biden clusters. We term the new clusters in this graph followback communities, due to their unique method of gaining followers and using Twitter. Accounts in these communities attempt to gain followers by mass-following other accounts in expectation of reciprocal follows, and sometimes explicitly coordinate with other accounts to expose themselves to a wider audience of potential followers. Because Twitter limits the number of users an account can follow by that account’s current follower number, these accounts can often be distinguished from others by their nearly 1:1 ratio between followers and following totals (Figure 7). In addition to this follower manipulation practice, these communities have other unique behaviors compared to the clusters previously identified. Their median retweet total is much higher than that of the previously-identified clusters, and retweets are a much higher percentage of their total tweeting behavior. Their frequent retweeting likely propels their visibility in this visualization. Qualitatively, their behavior is also different from other users on the platform. They engage in retweet “trains,’ in which they make posts tagging members of their own community and then retweet these posts incessantly in an attempt to garner more followers for all participants (Gallagher 2020). They are almost entirely pseudonymous, with screen names and profile information often detached from any offline presence. One of the followback clusters is much larger than the others and associated with the core pro-Trump cluster, one is smaller and an off-shoot of the larger pro-Trump followback cluster, and the smallest cluster is associated with the core pro-Biden cluster.
As with previous clusters, we can investigate the nodes which bridge one cluster to another. In this case, however, both followback clusters have no connections to non-followback clusters not aligned with their preferred candidate. In all three cases, an important point of cross-cluster connection are the accounts for the two presidential candidates themselves (@JoeBiden and @realDonaldTrump), but unlike other groups, most nodes in the followback clusters are connected to these nodes. This feature of dense cross-cluster connectedness reflects a critical function of the engagement from followback clusters: to retweet the followback community, but also to retweet the influential nodes supporting their presidential candidate of choice.
Multiple followback clusters can exist supporting the same presidential candidate, and different clusters may share unique user characteristics. By inspecting the usernames and user-entered profile descriptions of the smaller pro-Trump followback cluster, we found that 29/41 accounts provided some indicator of Italian American identity, either explicitly identifying as such, identifying as part of “Trump’s Italian Army,” or including Italian flag emojis paired with US flag emojis. While the larger pro-Trump followback also contained some self-identified Italian users, they were by no means the majority as in the smaller cluster. This smaller cluster was linked to the main pro-Trump followback cluster only through four bridging nodes, two of which identified as part of Trump’s Italian army, and two which self-described as duplicate accounts for the same user. This cluster otherwise only formed internal connections and connections with @realDonaldTrump and @Llinwood, the account of L. Lin Wood, a lawyer who advanced many false conspiracy theories relating to the election and litigated on Trump’s behalf in some post-election court cases.
All three followback clusters reflect the curious quality of coengagement networks where users can play both the role of edge and node. Recall that coengagement networks are graph projections, where each edge is comprised of engagements from many unseen nodes present in a ordinary, unprojected version of the graph. Almost 38% of the unprojected nodes that comprise the edges in followback clusters are themselves represented as nodes in the coengagement networks, compared to less than 1% of the accounts in the core pro-Trump, pro-Biden, and pro-socialist clusters. This is to say that followback clusters uniquely play the role of their own audience, relentlessly sharing their own members’ content in addition to their chosen candidates. This feature sheds light on how the smaller pro-Trump followback cluster can separate itself in this graph, as its self-identified Italian American accounts specifically and at the threshold we set retweet only each other. This analysis does not allow us to speculate as to the level of explicit coordination or the motives behind these accounts for acting in this way. While some of these clusters’ unusual behavior could indicate automated or semi-automated activities, previous reporting has indicated that at least some of these accounts are likely operated and coordinated by otherwise ordinary users that simply aim to support Trump’s candidacy on Twitter (Gallagher 2020).
Synthesis: Cluster Contingency and Differential Moderation
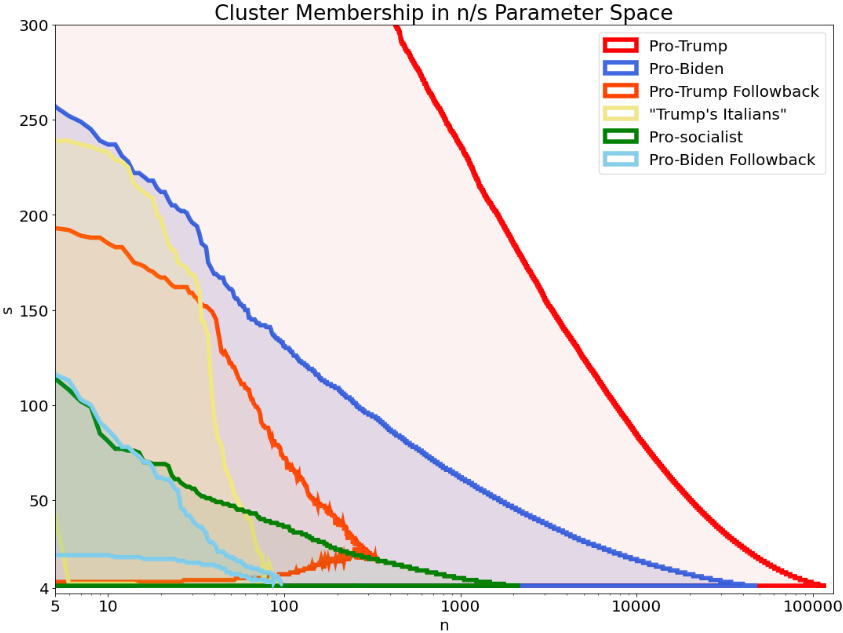
By examining the full n/s parameter space, we can develop a sense for the relative size and sharing characteristics of the clusters that we have identified so far. We calculate the results of repeated network clusterings using the Louvain algorithm on a range of possible n and s parameter combinations, assigning cluster labels via high-degree landmark nodes associated with each previously-identified cluster. In Figure 8, we illustrate the boundaries at which these clusters are no longer salient. The pro-Trump, pro-Biden, and pro-socialist clusters are all contained within a maximum number of engaged users that steadily declines with restrictions on these users’ number of retweets. By contrast, the followback clusters cannot be detected unless users’ minimum retweets are elevated, but are never salient at a size of greater than 110 users. We note that the point at which a cluster fails to be detectable is not the point at which all nodes in these clusters are removed, but rather the point at which these nodes become subsumed into larger clusters. For example, the two highest degree pro-socialist nodes from Case 2 are relatively-marginal nodes in Case 1, while many of the most popular Trump followback accounts in Case 3 are found in the core pro-Trump cluster in Cases 1 and 2. These facts reiterate that the clusters we identify here are not found with respect to the actual ideologies or social ties between nodes, but rather through an understanding of how nodes are perceived by their engaged audience variously defined.
We conclude these case studies by noting how the clusters we identify here were subject to different levels of moderation in the wake of the US presidential election (Figure 9). On January 6, 2021, a large group of rioters, associated with a range of pro-Trump movements contesting the results of the 2020 presidential election, entered the US Capitol building while its representatives were in session. Following this event, Twitter suspended a large number of accounts said to have encouraged this violent protest, as well as accounts associated with the QAnon conspiracy movement (Romm and Dwoskin 2021). To measure the effect of these and other more recent suspensions on our dataset, we identified all accounts that were suspended as of September 3, 2021. Since the election, most of the pro-Trump followback cluster in this case study (71%) has been suspended by Twitter, compared to 32% of accounts in the core pro-Trump clusters, 2% of the core pro-Biden cluster, 7% of the pro-Biden followback cluster, and 2% of the pro-socialist cluster. In other words, these suspensions have disproportionately affected the pro-Trump followback users we identified in Case 3, which is to say groups of pro-Trump users with frequent intracommunity retweet activity.
Comparison: Directed Engagement Graph and Flows
We conclude our case studies with a brief comparison to a more standard network form, which we refer to as the directed engagement graph. In directed graphs, each node is an account, each edge is a directed retweeting relationship, and edge weights signify the frequency of engagement. In this present dataset, the unfiltered directed graph consists of 22M nodes and 299M edges. This graph cannot be visualized effectively with our current software and computing power, although a version with heavily filtered edge weights can be observed in Figure 1.
We first assess whether coengagement graphs represent nodes typically perceived to be important in the directed graph. We compare the weighted (in)degrees of both graph, which in the case of the directed engagement graph is simply equal to the number of times an account has been retweeted. We find that of the top 1000 most retweeted accounts, 95%, 96% and 85% are represented across Cases 1, 2, and 3 respectively. Furthermore, we find that the nodes we choose to include in Cases 1, 2, and 3 account for 54%, 64%, and 51% of all retweets in this dataset, despite only representing fewer than 0.1% of the accounts in our data. There are some highly-retweeted nodes in the directed graph that are not visible in each coengagement network. However, these missing nodes are also mostly unrelated to the 2020 US presidential election. For example, the most retweeted nodes missing from Cases 1, 2, and 3 respectively are a fan account for pop musician Justin Beiber, a fan account for the Korean pop music group BTS, and the account for Billboard, a music media outlet. These nodes are highly retweeted in these datasets because of competitions in which fans “vote” for their favorite musicians. They may be missing from our coengagement visualization simply because they are essentially apart from the apparent main topic of the dataset, and thus have fewer opportunities to “share” an audience with another node that is collected under these terms. Some relevant highly-retweeted accounts, such as the Twitter account for Donald Trump’s daughter Ivanka Trump, are also missing from Case 3 likely because they did not publish enough election-related tweets to reach the 25-retweet threshold.
We second assess whether structures found in the directed graph are significantly different from the coengagement graph. To do this, we cluster the directed graph using the Infomap algorithm (Rosvall, Axelsson, and Bergstrom 2009), a different clustering method which views directed, weighted edge interactions as flows of information between nodes. We find that the pro-Biden, pro-Trump, socialist, and pro-Trump followback clusters are all still found under this algorithm, with the pro-Biden followback cluster being subsumed into the pro-Biden cluster. No other large cluster is found which combines nodes found in these case studies into new mixtures. We do find, however, that clusters apparent in these case studies, such as the pro-Biden cluster, often are subdivided into smaller clusters in the directed network.
These smaller clusters reveal the tradeoffs between directed networks and coengagement networks, as they most likely stem from Infomap’s tendency to privilege connections between high-indegree nodes, i.e. retweets between influential accounts. For example, a pro-Biden subcluster in the directed graph is centered around official accounts and reporters for the media outlet The New York Times. These popular accounts frequently retweet each other, probably to promote each others’ work, which strengthens their association in graph forms and algorithms which understand high-degree nodes as routes through which users travel. By contrast, in coengagement graphs, the influence of interactions between influential nodes on the resulting form and clusters is dampened, due to its focus on large but not necessarily important shared audiences. In social engagement data in which user engagements can be seen as travelling from node to node, such as use clicks through profile pages, directed retweet networks and clustering algorithms that consider them may be more appropriate. In data such as this Twitter retweet dataset, where engagements are enacted from relatively stable positions and circumstances, coengagement graphs may be more appropriate.
Discussion
We introduce coengagement networks and illustrate their value for a mixed methods analysis of a dataset of Twitter posts related to the 2020 US presidential election. We illustrate how the number of apparent clusters perceived in these networks is contingent on the minimum proposed size and activity level of their engaged audiences. When seen through the lens of large, momentarily interested audiences, there appears to be two dominant pro-Trump and pro-Biden communities. When including smaller engaged audiences, a pro-socialist cluster emerges, and when focused on highly-active but even smaller engaged audiences, unique followback clusters emerge with severely different user behavior. These networks make clear that Twitter’s moderation in the wake of the attack on the US Capitol Building disproportionately affected these pro-Trump followback accounts, while also affecting a number of pro-Trump accounts with more ordinary retweeting behavior. Taken together, the insights from these networks depict an ecosystem of popular and activist discourse communities in the presidential election with few but crucial points of overlap, and the de facto removal of the majority of influential member is one of these communities in the wake of the US Capitol attacks.
The purpose of our case study is not necessarily to draw definitive conclusions or cause-and-effect relationships, but to use visualization to expose those features of this discourse ecosystem that deserve further study. We describe a mostly binary structure of pro-Trump and pro-Biden engagement in English-language US election discourse, and provide a typification of the points of crossover between these two clusters of accounts. We identify a detectable and yet marginal tide of third-party US political discourse in the pro-socialist cluster whose growth and comparative influence on non-election discourses may yet have further importance. We identify the phenomenon of satellite audiences, where high-degree nodes, and particularly the account @realDonaldTrump, serve as singular points of reference for many communities with only marginal connection to English-language election discourse. And we characterize followback communities, which use unique posting strategies and engage in unusually partisan rhetoric to support specific candidates in our election dataset.
The social network visualization approach described here makes transparent many features which contribute to this understanding of Twitter discourse around this election, while reducing visual clutter and artifacts typical to equivalent large datasets. However, we stress that the sum total narrative could not be found from any of these visualizations taken alone, and indeed some visualizations have contradictory features which could, when viewed in isolation, generate misleading insights as to the nature of these communities. For example, we have shown that the pro-Trump followback cluster is from the perspective of the size of their engaged audience a somewhat marginal phenomenon, ceasing to be organizationally coherent at the level of more than a hundred users. Portraying them with equal prominence to more typical political communities may mislead viewers as to their relative impact on the overall election conversation compared to, for example, the core pro-Trump cluster. Yet small groups of coordinated users can nonetheless have an outsize impact in online communities (Center for Countering Digital Hate 2021), and our analysis of Twitter suspensions since the presidential election show that this followback community was specifically targeted for moderation at a much greater rate than other communities. Depending on the visualization goals of the researcher — proportional impact, or behavioral diversity — forefronting this community may or may not be informative to their chosen audiences. Portraying multiple visualizations that provide both interpretations, and analyzing the discrepancies between them, provides a level of explanatory power that no single visualization is likely to otherwise achieve.
Overall, what we describe in this paper is an interpretative, mixed-methods workflow, in which visual artifacts derived from quantitative network transformations are combined with a deep qualitative understanding of the US Twitter election context, to the benefit of both. Given the contingency of network visualizations on their initial parameters, deep understanding of the context of a given dataset is necessary to interpret and triangulate their different incarnations. However, given the size of contemporary social interaction datasets, quantitative methods such as the coengagement network are necessary to reduce the complexity of online conversations to artifacts which are tractable to qualitative researchers. We advocate for the continued use of coengagement networks in mixed-methods research, as a tool that both stimulates and benefits from deep contextual understanding of increasingly unwieldy social data.
Ethical Considerations, Limitations, and Software Sharing
As network visualizations continue to be central in social media analysis, we believe it is necessary to briefly examine the ethical considerations on whether network visualizations such as these should be used in every circumstance. We have chosen here to visualize users participating in a high-prominence topic, consisting of mostly public-facing accounts such as politicians and media outlets. The same methods applied to communities with a higher expectation of privacy, or who face higher risks from exposure, may be unethical surveillance if researchers have not derived consent from members of these communities. There are also ethical implications to naming accounts visualized as nodes in networks. Some users, due to gender, race, or other factors, are at higher risk of harassment if identified as influential in a given community, while other users who explicitly seek attention in online communities may use their identification in networks as a propaganda tool in hateful campaigns. In our reporting of this work, we have declined to name some accounts for both reasons. We also stress here how the data collection procedure, and subsequent description of that procedure, affects which communities appear to be participating in a phenomenon. Several politically-active Twitter communities in the US that have been previously described in research, such as Black Twitter (Clark 2019) and non-English language communities (Fang 2021; Soto-Vásquez et al. 2020), are not explicitly visible in our analysis, likely due to their different posting volumes and the choice of terms and topics on which we chose to center our data collection. Researchers working with such visualizations whose research bears on policy and public perception must explain such limitations in the communication of their work.
We have described the basic form of an approach for visualizing engagements in social network data, and there are many ways in which this method can be modified to more saliently capture engagement dynamics. For example, the current formulation of this method places emphasis on users who frequently share content, which is not necessarily undesirable given the external impact of this behavior. However, different formulations of the network projection scheme, such as those that weight users’ engagements relative to their average level of engagement, may be a better reflection of real discourse communities that exist at lower sharing volumes. We also observe that many of these coengagement networks create densely-connected subgraphs in which most nodes are connected to most other nodes, making internode relationships difficult to visually identify. Accordingly, these networks may be complementary with other techniques to improve visualizations of social networks, such as the edge sparsification procedures for densely-connected networks proposed by Nocaj et al. (2015).
In the hopes that others may replicate our methods of both visualization and analysis on new datasets, we make the code available for generating these graphs either from structured data received from the Twitter API, or in general JSON and CSV-based formats.111https://github.com/uwcip-research/Coengagement-Networks This code uses the visualization capabilities of the open-source network visualization library Gephi, and its implementation of the ForceAtlas2 algorithm for network visualization (Bastian, Heymann, and Jacomy 2009; Jacomy et al. 2014). We have packaged this code in publicly-available Docker containers, a relatively portable and stable code format which can be run on many machines with relatively few installation requirements. Additionally, we have made available node and link data for all visualizations displayed in this paper, as well as a list of Twitter ID numbers for tweets and users corresponding to data used to generate these graphs. We hope by making the code for generating these graphs open-source, other researchers both qualitative and quantitative will both explore the potential and limitations of this method, as well as contribute modifications to this scheme as appropriate.
Acknowledgments and Funding
We would like to acknowledge Clément Levallois for his advice on the open-source implementation of this project, and Paul Lockaby for ample support in data collection. We received funding from the University of Washington’s The Center for an Informed Public, The John S and James L Knight Foundation (G-2019-58788), Craig Newmark Philanthropies, and the Omidyar Network.
References
- Abilov et al. (2021) Abilov, A.; Hua, Y.; Matatov, H.; Amir, O.; and Naaman, M. 2021. VoterFraud2020: a Multi-modal Dataset of Election Fraud Claims on Twitter. arXiv:2101.08210 [cs].
- Arif, Stewart, and Starbird (2018) Arif, A.; Stewart, L. G.; and Starbird, K. 2018. Acting the Part: Examining Information Operations Within #BlackLivesMatter Discourse. Proceedings of the ACM on Human-Computer Interaction, 2(CSCW): 1–27.
- Bastian, Heymann, and Jacomy (2009) Bastian, M.; Heymann, S.; and Jacomy, M. 2009. Gephi: an open source software for exploring and manipulating networks. In Third international AAAI conference on weblogs and social media.
- Benkler et al. (2020) Benkler, Y.; Tilton, C.; Etling, B.; Roberts, H.; Clark, J.; Faris, R.; Kaiser, J.; and Schmitt, C. 2020. Mail-In Voter Fraud: Anatomy of a Disinformation Campaign. SSRN Scholarly Paper ID 3703701, Social Science Research Network, Rochester, NY.
- Brandes (1999) Brandes, U. 1999. Layout of graph visualizations. PhD diss., University of Konstanz.
- Carlson (2020) Carlson, M. 2020. Fake news as an informational moral panic: the symbolic deviancy of social media during the 2016 US presidential election. Information, Communication & Society, 23(3): 374–388.
- Center for an Informed Public et al. (2021) Center for an Informed Public; Digital Forensic Research Lab; Graphika; and Stanford Internet Observatory. 2021. The Long Fuse: Misinformation and the 2020 Election. https://purl.stanford.edu/tr171zs0069.
- Center for Countering Digital Hate (2021) Center for Countering Digital Hate, C. 2021. The Disinformation Dozen. https://www.counterhate.com/disinformationdozen.
- Clark (2019) Clark, M. D. 2019. To tweet our own cause: A mixed-methods study of the online phenomenon ”Black Twitter”. Ph.D. diss, The University of North Carolina at Chapel Hill, United States – North Carolina.
- Dianati (2016) Dianati, N. 2016. Unwinding the hairball graph: Pruning algorithms for weighted complex networks. Physical Review E, 93(1): 012304.
- Doreian (1988) Doreian, P. 1988. Using multiple network analytic tools for a single social network. Social Networks, 10(4): 287–312.
- Fang (2021) Fang, J. 2021. Social media sites popular with Asian Americans have a big misinformation problem. http://prismreports.org/2021/05/26/social-media-sites-often-used-by-asian-americans-have-a-big-problem-with-right-wing-misinformation/.
- Foucault Welles and Meirelles (2015) Foucault Welles, B.; and Meirelles, I. 2015. Visualizing Computational Social Science: The Multiple Lives of a Complex Image. Science Communication, 37(1): 34–58.
- Freelon, McIlwain, and Clark (2016) Freelon, D.; McIlwain, C. D.; and Clark, M. 2016. Beyond the Hashtags: #Ferguson, #Blacklivesmatter, and the Online Struggle for Offline Justice. Technical Report ID 2747066, Social Science Research Network.
- Gallagher (2020) Gallagher, E. 2020. Trump Trains. https://erin-gallagher.medium.com/trump-trains-84bea1c3170d.
- Gallagher et al. (2021) Gallagher, R. J.; Doroshenko, L.; Shugars, S.; Lazer, D.; and Foucault Welles, B. 2021. Sustained Online Amplification of COVID-19 Elites in the United States. Social Media + Society, 7(2).
- Ham and Wattenberg (2008) Ham, F. V.; and Wattenberg, M. 2008. Centrality Based Visualization of Small World Graphs. Computer Graphics Forum, 27(3): 975–982.
- Jack (2017) Jack, C. 2017. Lexicon of lies: Terms for problematic information. Data & Society, 3(22): 1094–1096.
- Jacomy (2021) Jacomy, M. 2021. Situating Visual Network Analysis. Billet, Aalborg University.
- Jacomy et al. (2014) Jacomy, M.; Venturini, T.; Heymann, S.; and Bastian, M. 2014. ForceAtlas2, a continuous graph layout algorithm for handy network visualization designed for the Gephi software. PloS one, 9(6).
- Kennedy et al. (2022) Kennedy, I.; Wack, M.; Beers, A.; Schafer, J. S.; Garcia-Camargo, I.; Spiro, E. S.; and Starbird, K. 2022. Repeat Spreaders and Election Delegitimization: A Comprehensive Dataset of Misinformation Tweets from the 2020 U.S. Election. Journal of Quantitative Description: Digital Media, 2.
- Kleinberg (1999) Kleinberg, J. M. 1999. Hubs, authorities, and communities. ACM computing surveys (CSUR), 31(4es): 5–es.
- Lukito (2020) Lukito, J. 2020. Coordinating a Multi-Platform Disinformation Campaign: Internet Research Agency Activity on Three U.S. Social Media Platforms, 2015 to 2017. Political Communication, 37(2): 238–255.
- Mejia, Beckermann, and Sullivan (2018) Mejia, R.; Beckermann, K.; and Sullivan, C. 2018. White lies: a racial history of the (post)truth. Communication and Critical/Cultural Studies, 15(2): 109–126.
- Newman (2001) Newman, M. E. J. 2001. Scientific collaboration networks. II. Shortest paths, weighted networks, and centrality. Physical Review E, 64(1): 016132.
- Nocaj, Ortmann, and Brandes (2015) Nocaj, A.; Ortmann, M.; and Brandes, U. 2015. Untangling the Hairballs of Multi-Centered, Small-World Online Social Media Networks. Journal of Graph Algorithms and Applications, 19(2): 595–618.
- Pennycook and Rand (2021) Pennycook, G.; and Rand, D. G. 2021. Research note: Examining false beliefs about voter fraud in the wake of the 2020 Presidential Election. Harvard Kennedy School Misinformation Review.
- Reuters (2021) Reuters. 2021. 53% of Republicans view Trump as true U.S. president -Reuters/Ipsos. Reuters.
- Romm and Dwoskin (2021) Romm, T.; and Dwoskin, E. 2021. Twitter purged more than 70,000 accounts affiliated with QAnon following Capitol riot. Washington Post.
- Rosvall, Axelsson, and Bergstrom (2009) Rosvall, M.; Axelsson, D.; and Bergstrom, C. T. 2009. The map equation. The European Physical Journal Special Topics, 178(1): 13–23.
- Schulz and Hurter (2013) Schulz, H.-J.; and Hurter, C. 2013. Grooming the hairball-how to tidy up network visualizations? In INFOVIS 2013, IEEE Information Visualization Conference.
- Shaw Jr (1985) Shaw Jr, W. 1985. Critical thresholds in co-citation graphs. Journal of the American Society for Information Science, 36(1): 38–43.
- Small (1973) Small, H. 1973. Co-citation in the scientific literature: A new measure of the relationship between two documents. Journal of the American Society for information Science, 24(4): 265–269.
- Soto-Vásquez et al. (2020) Soto-Vásquez, A. D.; Gonzalez, A. A.; Shi, W.; Garcia, N.; and Hernandez, J. 2020. COVID-19: Contextualizing Misinformation Flows in a US Latinx Border Community (Media and Communication During COVID-19). Howard Journal of Communications, 0(0): 1–19.
- Squires (2002) Squires, C. R. 2002. Rethinking the black public sphere: An alternative vocabulary for multiple public spheres. Communication theory, 12(4): 446–468. Publisher: Wiley Online Library.
- Starbird (2017) Starbird, K. 2017. Examining the Alternative Media Ecosystem Through the Production of Alternative Narratives of Mass Shooting Events on Twitter. Proceedings of the International AAAI Conference on Web and Social Media, 11(1): 230–239.
- Starbird, Arif, and Wilson (2019) Starbird, K.; Arif, A.; and Wilson, T. 2019. Disinformation as Collaborative Work: Surfacing the Participatory Nature of Strategic Information Operations. Proceedings of the ACM on Human-Computer Interaction, 3(CSCW): 127:1–127:26.
- Stewart and Spiro (2021) Stewart, L. G.; and Spiro, E. S. 2021. Nobody Puts Redditor in a Binary: Digital Demography, Collective Identities, and Gender in a Subreddit Network. Proceedings of the ACM on Human-Computer Interaction, 5(CSCW1): 8:1–8:31.
- Wanless and Pamment (2019) Wanless, A.; and Pamment, J. 2019. How Do You Define a Problem Like Influence? Journal of Information Warfare, 18(3): 1–14.