Keystroke Dynamics: Concepts, Techniques, and Applications
Abstract
Reliably identifying and authenticating users remains integral to computer system security. Various novel authentication tenchniques such as biometric authentication systems have been devised in recent years. This paper surveys keystroke-based authentication systems and their applications such as continuous authentication. Keystroke dynamics promises to be non-intrusive and cost-effective as no addition hardware is required other than a keyboard. This survey can be a reference for researchers working on keystroke dynamics.
Keywords— keystroke, authentication, behavioral, identification, imposter, detection, security.
1 INTRODUCTION
Methods of authentication are a crucial aspect of computer security because of the sensitive data stored on servers and cloud storage around the world. Therefore, these storage systems need to adopt several layers of security using multiple factors of authentication. Usernames and passwords are the most used form of authentication. To add extra layers of security, biometric authentication has been introduced, such as fingerprints, facial recognition, and iris scans. Also gaining attention is behavioral biometric authentication such as monitoring- keystrokes, and voice recognition. Keystroke biometric authentication systems are a convenient and user friendly authentication option. Though it shows great potential, its real world application so far has been limited. Keystroke biometric authentication systems have several advantages.
-
1.
They are cost effective as no additional hardware is required, only the regular keyboard is needed.
-
2.
They are non-intrusive and does not create any extra hassle for the user.
-
3.
The systems can be deployed remotely.
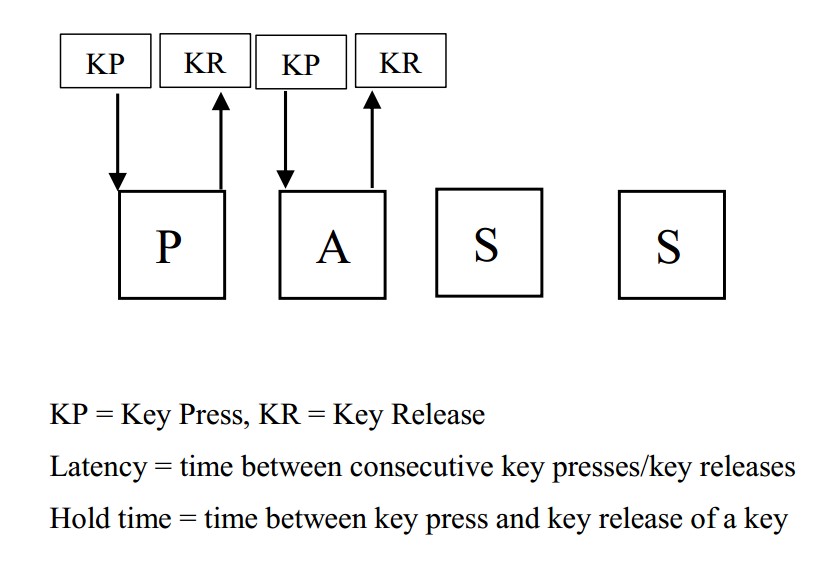
Keystroke authentication operates by creating a template for each user based on their typing pattern during an enrollment period. Once enrolled, the test sample from the user is contrasted with the representation of that same user and a matching score will be calculated. Matching scores are calculated based on the timing features of keystrokes. Figure 1 provides an overview of the timing features of keystrokes.
Researchers use three kinds of keystroke data for authentication.
-
1.
Free-text, also known as dynamic text [84]. Free-text permits the user to type freely without any restriction. For example, if a user writes a paragraph on a topic, it will be free-text.
-
2.
Fixed-text or static text [65]. Fixed-text is constant during the authentication process, during both template creation and testing. An example of fixed-text is a password.
-
3.
Semi Fixed-text, shares some characteristics wit free and fixed-text. Example of semi fixed-text - linux commands, the keystroke data of this paper [121].
The oldest survey article we reviewed is Alsultan and Warwick’s article from 2013. Alsultan and Warwick [12] focused on free-text keystroke systems. Fixed-text or semi fixed-text keystroke systems were not included in their survey. In our survey, we focus on all kinds of keystroke systems. Zhong and Deng [126] presented a comprehensive survey of keystroke dynamics; Giot, Dorizzi, and Rosenberger [44] provided a review of previously created keystroke benchmarking datasets; Ali et al. [10] presented an elaborate survey of the keystroke data collection details and classification algorithms. However, as these surveys were published in 2015, they were not able to cover more recent trends in keystroke dynamics research or updated benchmark datasets e.g., [25], [109], [84], [121], [120] etc. available since 2015.
Saini, Kaur, and Bhatia [96] and Saifan et al. [95] presented a comprehensive review on keystroke dynamics research - especially for touch screen and mobile devices. But these papers are not up to date as these were published in 2016. Also these papers did not consider all kinds of devices for keystroke dynamics research - their only focus was mobile devices.
Shinde, Shetty and Mehra [103] mainly focused on different aspects of static keystroke authentication. They did not discuss dynamic or continuous keystroke authentication in their survey. In our survey, we explain both static and dynamic keystroke authentication. Ali et al. [9] provided a comprehensive assessment of the newest datasets and algorithms used in keystroke dynamics based research. This survey was conducted in 2017 and new datasets and algorithms are now available.
Sanghi and Arya [98] presented a review of the methods and metrics used in keystroke dynamics. This paper described various applications of keystroke dynamics as well. Sadikan, Ramli, and Fudzee [93] performed a comprehensive analysis of the applications of keystroke dynamics. From this paper, we mention the latest applications of keystroke dynamics. Tewari [114] discussed only deep learning algorithms for keystroke dynamics. Conversly, in this paper we focus on many differing types of algorithms for keystroke dynamics.
In this survey, we present keystroke dynamics performance metrics, the latest benchmark datasets for keystroke dynamics, state of the art keystroke authentication algorithms, keystroke data processing techniques, keystroke dynamics for touch screen and mobile devices, the current applications of keystroke dynamics. This paper is a detailed reporting of the current keystroke dynamics research works and is a guideline for future researchers.
| Covered Areas | |||||||
| Reference | Year | Citations | Datasets | Algorithms | Mobile Devices | Data Processing Techniques | Applications |
| Alsultan and Warwick [12] | 2013 | 115 | Yes | Yes | No | No | Yes |
| Zhong and Deng [126] | 2015 | 60 | Yes | Yes | Yes | No | Yes |
| Giot, Dorizzi, and Rosenberger [44] | 2015 | 43 | Yes | No | No | No | No |
| Ali et al. [10] | 2015 | 30 | Yes | Yes | No | No | No |
| Saini, Kaur, and Bhatia [96] | 2016 | 20 | No | No | Yes | No | No |
| Saifan et al. [95] | 2016 | 11 | No | No | Yes | No | No |
| Shinde, Shetty and Mehra [103] | 2016 | 7 | Yes | Yes | No | No | No |
| Ali et al. [9] | 2017 | 103 | Yes | Yes | No | No | No |
| Sanghi and Arya [98] | 2017 | 2 | No | Yes | No | No | Yes |
| Sadikan, Ramli, and Fudzee [93] | 2019 | 10 | Yes | No | No | No | Yes |
| Maiorana, Kalita, and Campisi [75] | 2021 | 4 | No | No | Yes | No | No |
| Tewari [114] | 2022 | 1 | Yes | Yes | No | No | No |
| This Survey | Yes | Yes | Yes | Yes | Yes | ||
Table 1 shows a comparison of existing surveys on keystroke dynamics. This paper surveys recent papers on keystroke dynamics. We highlight their unique contributions, advantages and disadvantages. We have categorized the studies based on their contribution to one of the following categories: keystroke datasets, keystroke authentication algorithms, significance of keystroke data preprocessing techniques, keystroke authentication on touch screen and mobile devices, applications of keystroke dynamics.
1.1 Methodology
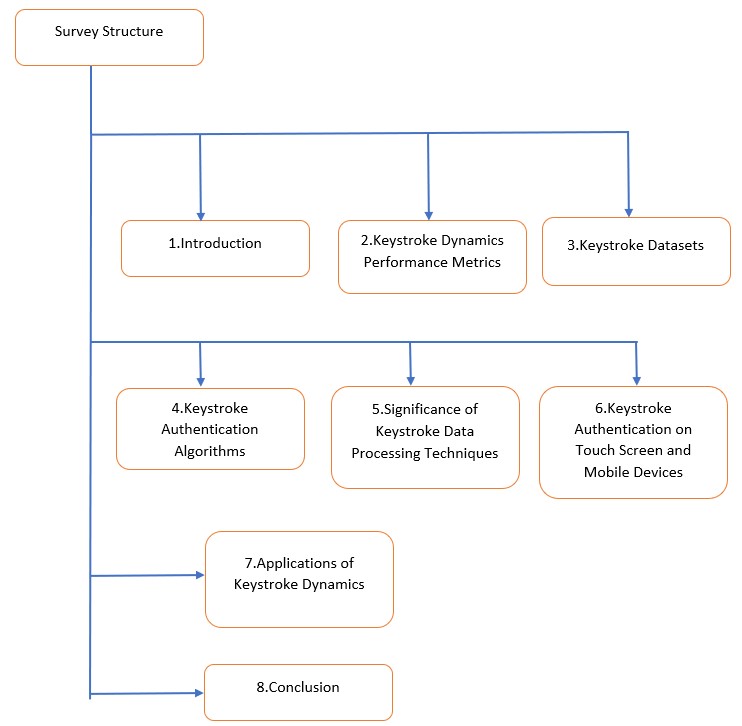
Throught the paper, we cover all recent developments of keystroke dynamics research and their applications. We collected papers from 2013 to present on keystroke dynamics from Google Scholar. We categorized them based on their contribution and uniqueness. Previous surveys on keystroke dynamics could not cover the recent scenarios. Others focused on specific areas like keystroke dynamics on touch screen and mobile devices, keystroke authentication algorithms, keystroke datasets etc. We also cover in this paper all the areas of keystroke dynamics. An overview of the structure of this paper is shown in Figure 2.
2 Keystroke Dynamics Performance Metrics
There are a number of performance metrics used in keystroke dynamics and each is used to present some specific information about the biometric system. This section describes all the metrics and when they are preferably used.
2.1 False Accept Rate and False Reject Rate
The most common performance metric used in biometric systems are the False Accept Rate (FAR) and the False Reject Rate (FRR). The FAR is the measure of the likelihood that the biometric system will incorrectly grant access to an unauthorized user [37]. This is calculated as the ratio of the number of false acceptances divided by the total number of impostor attempts, as shown in equation 1.
The measure of the likelihood that an authorized user will be incorrectly rejected by the biometric system is called the FRR. This is measured by dividing the number of false rejections by the total number of genuine attempts, as shown in Equation 2.
The ideal value for both FAR and FRR is 0%, which translates to granting access to all genuine users while all impostors are caught. However, real world biometric systems are not ideal. Therefore, a lower value for both FAR and FRR is preferred instead. A system with 0% FAR is considered to have utmost security, while a system with 0% FRR is highly convenient. There is usually a trade-off between security and convenience, as a highly secure system may reject too many genuine users, thus being inconvenient while a highly convenient system may be insecure and therefore ineffective. The FAR is also known as the False Positive Rate (FPR), while the FRR is 1 - True Positive Rate (TPR).
| (1) |
| (2) |
2.2 Equal Error Rate
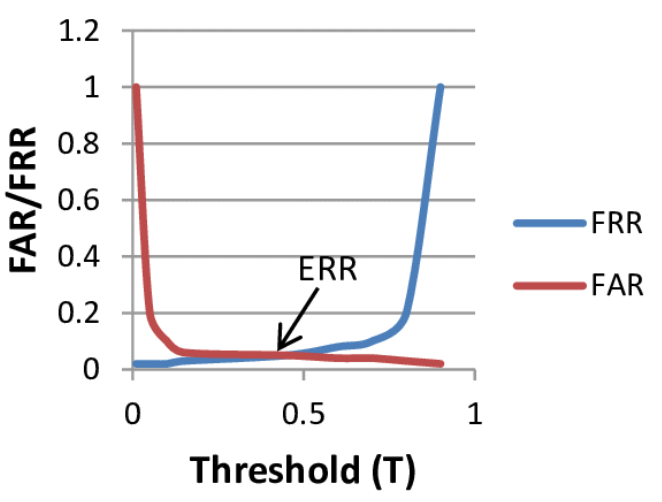
The equal error rate (EER) is also a commonly used performance metric, especially when it is challenging to find an operating point between the FAR and FRR. The EER indicates the instance of FAR and FRR intersecting. Similar to the FAR and FRR, a lower EER value is preferred. As shown in Figure 3, a threshold closer to 0 favors convenience (low FRR) but is less secure (high FAR), while a threshold closer to 1 favors security (low FAR) but is less convenient (high FRR). The EER balances these two points.
2.3 ROC and AUC
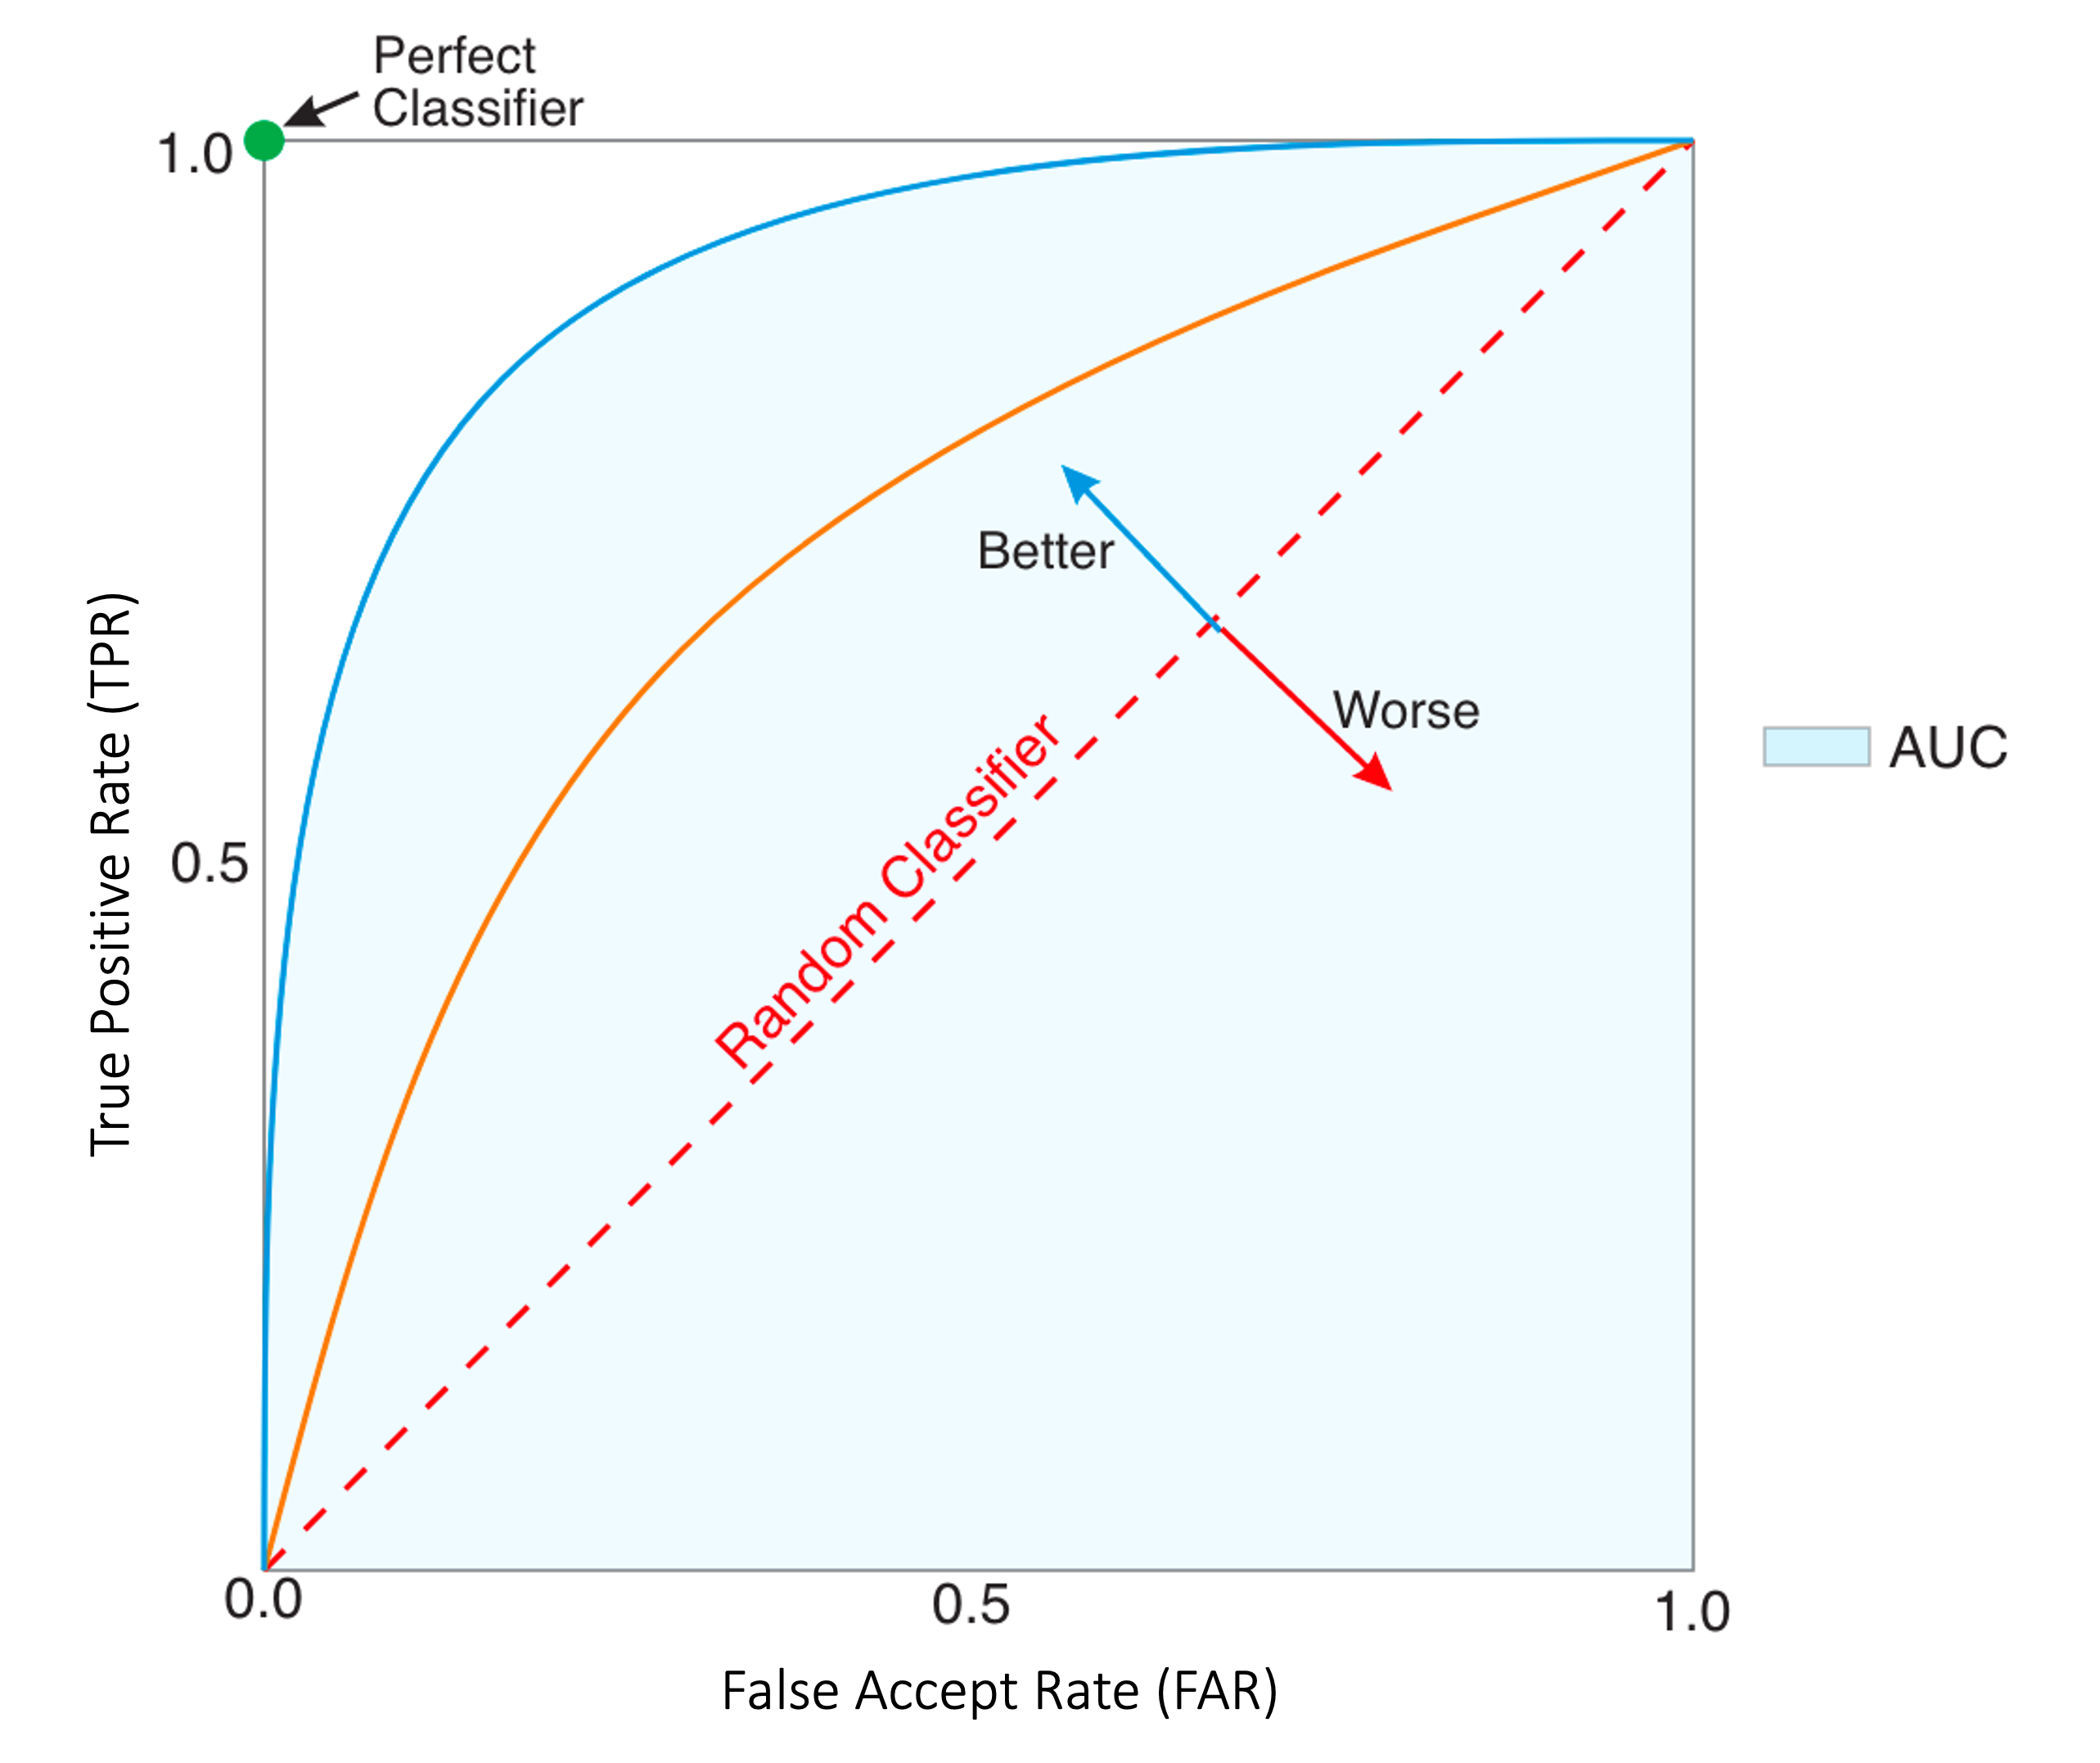
The Receiver Operating Characteristic (ROC) curve, is a graphical plot of FAR and TPR (i.e., 1 - FRR) that visualizes the performance of a binary classifier while the threshold for classiciation is changed. This metric provides a clear visualization of keystroke dynamics performance across varying classification thresholds. A perfect classifier will have a point at the top left corner with coordinate (0.0, 1.0) which illustrates no false accept or false reject (Figure 4). Since this is hardly practicle in a large scale system, a classifier closer to the coordinate (0.0, 1.0) is therefore desired. The diagonal from the top right to bottom left corners indicates a random classifier, which is similar to a random guess and therefore not desired. A classifier with an ROC curve lower than the diagonal line is mostly assumed to have been wrongly labeled and therefore can be flipped. The Area Under the Curve (AUC), often associated with the ROC curve, provides an combined performance measurement across all varying thresholds of classification.
2.4 ANIA and ANGA
In behavioral biometric studies, especially in continuous user authentication, performance metrics such as FAR, FRR, ROC and AUC may not be sufficient, as they fail to illustrate the average keystroke count required for a genuine user to be rejected or an impostor to be detected. Therefore, to further evaluate the performance of a CUA system, the Average Number of Impostor Actions (ANIA) and Average Number of Genuine Actions (ANGA) are used, where the actions in this case are keystrokes [83]. The ANGA is the number of legitimate actions users can perform before they are wrongfully denied access, while ANIA is the number of actions impostors can do before they are detected and locked-out. ANGA is perfered to be high (in fact, it is desired that a legitimate user should never be denied access), and ANIA as low as possible, so as to reduce the amount of actions an illegitimate user can perform before detection.
The ANIA and ANGA are mostly used in keystrokes dynamics continuous authentication and can be calculated as shown in Equation 3 and 4, where is the amount of consecutive actions a user (genuine or impostor) can finish before an authentication/identification decision is made.
| (3) |
| (4) |
2.5 Authentication Time
The authentication time is an additional metric used in keystroke dynamics to describe the usability in the system. The metric is the total average time necessary for collecting keystroke data and the average of time system takes to permit or deny user access [119]. While the desire to achieve a very low FAR and FRR stand, it is important to achieve this with a very short authentication time. For example, the authentication system of Zheng et al. [125] achieved FAR and FRR of 1.30% but with a very long authentication time (approximately 38 minutes). Such a long authentication time would leave impostors uncaught as most impostors require signifigantly less time to complete attacks. Additionally, the mouse dynamics-based authentication of Shen et al. [101] had 3.33% FAR and 2.12% FRR with about 119 seconds authentication time. Although this FAR and FRR is higher than that of Zhen et al., it could be considered a better system based on the lower authentication time.
3 Keystroke Datasets
A keystroke dataset is required to perform satisfactory evaluation of keystroke dynamics-based authentication algorithms The quality, size and nature (fixed or free-text) of the dataset is a crucial factor in evaluating the performance of these algorithms. To perform evaluation, an algorithm is applied that measures and compares the difference in timing between key presses and releases in the dataset, using this information to make an authentication decision. This section details various keystroke datasets and their effectiveness in terms of authentication performance.
3.1 CMU Dataset (2009)
Killourhy and Maxion [65] collected fixed text (password) keystroke data and evaluated 14 algorithms with that dataset. 51 subjects were included in data collection. The fixed password was “.tie5Roanl”. Each subject typed this password 400 times during 8 sessions with 50 attempts in each session. There was at least one day gap between two sessions to reflect the temporal variation of typing of the subjects. A Microsoft Windows application was used for the data collection. For more accurate timestamps, an external reference clock was utilized. Killourhy and Maxion evaluated different algorithms with this dataset and achieved EER between 9.6% and 10.2%.
3.2 GreyC-A Dataset (2009)
Giot, El-Abed, and Rosenberger [46] proposed a benchmark database and software for measuring the performance of authentication systems leveraging keystroke dynamics for user access control. Their focus was on static-keystroke authentication (such as passwords or pass phrases). GREYC-Keystroke proposed software for the development of a keystroke dynamics database. Extracting the information from the data was simple as the data were stored in an SQLite file. The features of this software application were - 1) The default password was "greyc laboratory". However, each participant was free to choose a different password. 2) A new participant could be added to the database. 3) Each participant was free to practice the typing of the password without storing the data. 4) The mean vector of each participant was available. 5) Collected keystroke data were stored in the database. 6) A participant had to type the password again if any mistake was made. They developed a standard keystroke dynamics database using the GREYC-Keystroke software. The data consisted of 133 participants including researchers, students, and employees. Each participant typed the password between 5 and 107 times. The authors collected the data of 7555 attempts. Most of the participants attended minimum 5 sessions. On average there were 51 attempts per participant. In [47], they used the GREYC keystroke dataset to evaluate their proposed technique based on SVM learning. The enrollment step was limited to 5 captures. The administrator set a passphrase that the users had to type. A two-class SVM was utilized for the enrollment. This SVM-based machine learning approach only needed five captured samples to develop the model. They used four types of algorithms for their experiment - 1) Statistical algorithm, 2) Distance-based algorithm, 3) Rhythm-based algorithm, 4) Machine learning based algorithm. They also investigated the variations in the authentication method due to different keyboards. The authors also considered the consequences of some other factors like differing amounts of samples needed to develop the model, individual or global threshold, the database size etc. The EER was calculated by using ten vectors from the head of the dataset for enrollment and the remaining samples used for the verification. In terms of EER, their proposed method performed better than all other algorithms.
3.3 GreyC-B Dataset (2012)
Giot, El-Abed, and Rosenberger [48] created a new dataset for keystroke based biometric systems. To develop the dataset, two types of logins and passwords were used- chosen and imposed. Leveraging a web environment the data collected free from any restriction. They performed statistical analysis of some key factors including the effect of password size on performance, significance of fusion techniques etc. Each participant had to choose their own login and password during the first session. Participants were free to participate in the session when convenient. There were three different steps in a session. In each step, a participant had to type a login and a password multiple times. Participants were not allowed to correct any tying mistakes. A progression bar was displayed to show the remaining number of inputs required to fulfill the session. The data collection process consisted of three steps. 1) Ten attempts using a prior researcher chosen login and password, 2) Ten attempts for the user chosen login and password, 3) Ten imposter samples from two other participants. 83 individuals participated in the data collection. They collected 5185 genuine samples, 5439 imposed samples and 5754 imposter samples. For each participant, 20 samples were used for training and the remaining samples were used for testing (with a minimum of 20). The conclusions of their experiment were - 1) Using an individual threshold was better than using a global threshold for computing the EER, as an individual threshold is a value specific to a user that determines the origin of the sample - legitimate user or an imposter, 2) Using logins provided better results than using passwords, 3) The performance improved by doing the fusion of all features (monographs and digraphs), 4) The performance was dependent on the password size and entropy.
3.4 Pace Dataset (2013)
Bakelman et al. [18] collected fixed-text numeric keypad data for keystroke authentication of 30 subjects over for four days. On each day a maximum of 60 samples were collected for each subject. There were 11 keystrokes per sample from numeric sequence, and the Enter key. The data was collected by a third party keylogger. The subjects had to type the samples with only right hand in order to simulate typing a phone number or ATM pin. There were 20 samples per subject. For this dataset, they got the EER 10.5% and 6.1%.
3.5 Clarkon I Dataset (2014)
Vural et al. [118] developed a new dataset containing short pass-phrases, long text transcription(fixed-text) and free text. They also recorded videos showing subjects during data collection in order to capture the facial expressions and hand movements of the subjects. Vural et al. started the data collection at Clarkson University in 2011. The dataset includes 2 kinds of fixed text (password and transcriptions) and free text from 39 participants incliding university employess and students. For each participant, the data was collected in two one-hour sessions each occuring on a different day. The first task was typing 3 different passwords. The subjects typed each password 20 times. The passwords were: yesnomaybe, bahaNe312!, ballzonecart. For the second task, the subjects had to answer 9 survey questions in free text with a minimum of 500 characters to answer each survey question. The last task was copying the commencemen speech of Steve Jobs at Stanford University. A browser based keylogger was used for the data collection. The data was collected for a period of 11 months between August 2011 and June 2012 in a lab at Clarkson University. On average each subject provided 11066 keystrokes in session 1 and 10467 keystrokes in session 2. Every dession recording was analyzed to determine digraphs and trigraphs. N-graphs greater than 500 milliseconds or shorter than 30 milliseconds in length were discarded. In session 1, on average there were 8406 digraphs and 389 unique digraphs per subject, 7561 trigraphs and 1603 unique trigraphs per subject. In session 2, on average there were 8261 digraphs and 388 unique digraphs per subject, 7520 trigraphs and 1620 unique trigraphs per subject. To evaluate this dataset, two algorithms were used - Leggett et al. [70] and Gunetti & Picardi [51]. Using the algorithm of Leggett et al. [70], an FAR of 0.25% and FRR of 17.65% were obtained for a threshold of 0.9; an FAR of 3.45% and FRR of 8.82% were obtained for a threshold of 0.85. Ceker and Upandhyaya [25] utilized this dataset to examine the accuracy of a single-class support vector machine (SVM) on longer text data, as opposed to shorter password text. They found that using the four ranking digraphs by comonality (‘he’, ‘re’, ‘th’ and ‘an’) resulted in a 2.94% EER, while using the most common 12 or more digraphs led to an almost 0% EER.
3.6 OhKBIC Dataset (2015)
Monaco et al. [81] described the results of the One-handed Keystroke Biometric Identification Competition (OhKBIC). In the dataset, Monaco et al. included the data of normal typing and handicapped typing (typing with one hand). Data was collected from three online exams of undergraduate students. There were 64 subjects. In each exam, there were five essay questions. The subjects typed normally in the first exam. The subjects were directed to type with their left hand only for the second exam and with their right hand only for the third exam. Each subject typed a minimum 500 keystrokes on each exam. The data was collected by a JavaScript based keylogger and transferred to a server. Each used different keyboard make and models throughout the three exams which was a drawback of this dataset. A portion of the data collected from the first exam of normal both-hands typing was used as labeled training data. The unlabeled data included all three types of data (both-hand) typing, left-hand typing and right-hand typing data. The top team used two regression models (Artificial Neural Network and Counter-Propagation Artificial Neural Network) and one prediction model (Support Vector Machine) for pairwise coupling [53]. The best recognition rate ranged from 55.7% to 82.8% for both-hand section, 19.9% to 30.5% for left-hand section and 24.8% to 34.3% for right-hand section.
3.7 Buffalo Dataset (2016)
Sun, Ceker, and Upadhyaya [109] proposed a shared dataset containing keystrokes collected from 157 participants. The data was both fixed and free-text. The data collection process continued for 4 months between September and December 2015. For each subject, the data was colled in 3 sessions. The tasks included fixed text transcription and answering quesions in free text. On average there was a 28 days gap between 2 sessions to consider the temporal variations. There are 2 sections in the dataset- in one section the subjects used same keyboard across sessions. In the other section, the subjects used different keyboards across sessions. The first task was copying the 2005 commencement speech of Steve Jobs at Stanford University. The speech was divided into 3 parts with each part of equal length, the subjects had to type one part in each session. The second task consisted of multiple subtasks including answering survey questions and describing a picture, sending an email with attachment and free internet browsing. Each session lasted for about 50 minutes with 30 minutes for the first task and 20 minutes for the second task. A system logger was adopted for the data collection on the windows platform [42][110]. Among the 157 subjects, the data of 148 subjects was included in the dataset. The data of the remaining users was discarded due to mistakes. On average each subject typed around 5700 keystrokes in each session, around 17000 keystrokes in 3 sessions. There was a 3 to 5 week time gap between 2 sessions to reflet the temporal effect. Gaussian mixture model, a probabilistic model for classifying data into different categories based on the probability distribution, was utilized to evaluate this dataset. The EER was 0.01% and 0.39% for Gaussian mixture model with one and two components, respectively.
3.8 Clarkson II Dataset (2017)
A novel dataset was proposed by Murphy et al. [84] that included keystrokes, mouse events and active programs. 103 users contributed the data for a period of around 2.5 years. Unlike the other datasets, the data was collected on the users’ personal computers during normal use. Keystrokes and mouse data were recorded while users make use of their computers, such as for typing, gaming etc thereby classifying the data as free-text. The users provided 12.9 M keystrokes with each used providing an average of 125K keystrokes. The keylogger was installed on each user’s computer to recorded keystroke and mouse movement movement events. The recorded data was sent to a remote database server. 10 samples, each sample consisting of 1000 keystrokes, were used to form the reference profile of a user. The rest of the data of a user was considered genuine test samples. For each user, the data of all other users was considered as imposter data. The EER was 10.36% for this dataset. This result was worse compared to fixed-text and controlled free-text datasets because it is a completely uncontrolled dataset and as such contains several keystrokes that are not usually seen in typing tasks.
| Reference | Type of data | Number of subjects | Average number of keystrokes per subject | Notes |
| Killourhy and Maxion [65] | Fixed | 51 | 4400 | Imposed password |
| Giot, El-Abed, and Rosenberger [46] | Fixed | 133 | Unspecified | Subjects practiced on other keyboards before authenticating on the actual keyboard |
| Giot, El-Abed, and Rosenberger [48] | Fixed | 48 | Unspecified | Imposed and individual credentials |
| Bakelman et al. [18] | Fixed | 30 | 220 | Password and numeric input |
| Vural et al. [118] | Fixed & Free | 39 | 21,533 | Includes videos of subjects’ facial expression and hand movements |
| Monaco et al. [81] | Free | 64 | minimum 1,500 | One-handed |
| Sun, Ceker, and Upadhyaya [109] | Fixed & Free | 157 | 17,000 | Desktop, and Multi-keyboard |
| Murphy et al. [84] | Free | 103 | 125,000 | Desktop, and Completely uncontrolled |
| Dhakal et al. [36] | Free | 168,000 | 800 | Desktop |
| Palin et al. [88] | Free | 37,370 | Unspecified | Mobile |
| Wahab et al. [121] | Semi-Fixed | 42 | 2,048 | Account recovery |
| Wahab et al. [120] | Free | 86 | 24,000 | Multi-keyboard and bilingual |
3.9 Aalto Datasets (2018; 2019)
The Aalto University desktop [36] and mobile [88] datasets are large-scale datasets collected using an online typing test on desktop computers and mobile devices. The desktop dataset has 136 million keystrokes gathered over three months from 168,000 subjects. Participants were instructed to transcribe fifteen (15) sentences in english by typing them as fast and accurate as possiable. The 15 sentences were randomly taken fom a set of 1,525 samples consisting of at least 3 words and a maximum of 70 characters. Subjects were allowed to make typing errors, correct them or add new characters when typing, and as a result, they could type more than 70 characters. The dataset is categorized as a controlled free-text dataset because it involves transcribing - subjects did not type contents of their own but were shown what to type. There were 15 sessions during each participants transcribed only one sentence. The front end of the online test was deployed as an HTML web page leveraging CSS for website styling. JavaScript was used for dynamic events on the website such as keypresses and the data were stored in a MySQL database. A key-logger was used in capturing keystroke data including imtestamps of key up and down events as well as the key that was pressed.
The Aalto mobile dataset [88] was collected from 37,370 participants in a preforming transcription services on a website. It is an extension of the Aalto desktop dataset and followed the same procedure but on mobile devices. Subjects were to memorize a given sentence, and then type it quickly and accurately. Being a web-based method with browser-side logger, as opposed to laboratory-based, there was less control over the quality of the data collected, and web applications on mobile devices have limited access privileges. As a result, many participants’ data were found with undefined keycodes (229 or 0); many devices’ down and up keystroke events are were equal, producing invalid keystroke duration of 10ms; and the keycodes of some pressed keys are missing.
3.10 AR Dataset (2021)
Wahab et al. [121] used a new dataset of 500,000 keystrokes, designed for account recovery, to determine the performance of five differing keystroke dynamics-based algorithms [51], [59], [65], [64] - Euclidean distance, Manhattan distance, Scaled Manhattan distance, Mahalanobis distance, and the Gunetti and Picardi’s algorithm. A total of 44 subjects were used during data collection including both students and university employees. The subjects had to complete an account recovery form that contained different fields. This type of data is called semi-fixed as it is neither free-text nor fixed-text. Two collection sessions were hosted for gathering the data. In the first session, the subjects had to fill out an enrollment form ten times. The data collected from session one was used to create the profile of a subject. In the second session, the subjects had to fill out the same form again five times. The data collected from session two was used as genuine keystroke data for the corresponding subject and imposter data for other subjects. There was a one or two weeks gap between the sessions. The fields of the enrollment form were- Full name, Address, City, Zip, Phone, Email, Declaration, Password. For each of the 42 subjects the enrollment task was completed ten times. 28 subjects attended the second session and 16 subjects acted as imposter. Five algorithms were used for the evaluation of this account recovery dataset. Scaled Manhattan distance algorithm showed the best performance. The best EER was 5.47% for individual fields, 0% for five fields combined and 0% for seven fields combined.
3.11 Multi-K dataset (2022)
Wahab et al. [120] created two novel free-text keystroke dynamics datasets. The first was a multi-keyboard keystroke dataset. Data was collected by leveraging four physical keyboards - mechanical, membrane, ergonomic and laptop keyboards. The second dataset collected data from both English and Chinese languages. 86 users participated in the data collection - 60 users using four different keyboards during collection and 26 users for the bilingual dataset. A keylogger deployed on a website was leveraged for collection of both datasets. In order to collect data for the multi-keyboard dataset, three desktop computers and one laptop were arranged in their lab. Mechanical, ergonomic and membrane keyboards were connected to the three desktop computers respectively. The fourth one was a laptop keyboard. All the four keyboards were QWERTY physical keyboards. Mechanical keyboards leverage spring supported switches to deploy each key and detect a keypress. They can be noisy and are used by typists and gamers.
In this study, the four different types of keyboards used include a Das mechanical keyboard with the MX-Brown switch, a PERIBOARD-512 ergonomic keyboard, a Logitech MK270 membrane keyboard, and a DELL Latitude 5410 laptop computer with a chicklet style keyboard. The Das mechanical keyboard is specifically designed to mitigate the demand on the fingers while typing, while the PERIBOARD-512 ergonomic keyboard offers an angled design for more comfort. The Logitech MK270 membrane keyboard, on the other hand, is relatively cheap and quiet, with short key travel and a single pressure pad for registering keystrokes. The DELL Latitude 5410 laptop computer, uses a 14-inch chicklet style keyboard. To collect data, the researchers developed a web system based on Python luanguage leveraging the Django modules, which was hosted on an Amazon cloud server.
In this system’s UI, there were screens for Signup/Sign-in, keyboard selection, Q/A task selection, and Q/A. During the Signup/Sign-in process, users had to enter their first and last names and were given a unique ID to secure their personal information. After signing up, the keyboard selection screen appeared, which was designed to determine the order of data collection. Each user was required to answer four questions in a specific order for each of the four keyboards. The tasks screen displayed the Q/A tasks linked to the selected keyboard, and the user had to type at least 50 words for each task. The Q/A screen recorded the user’s answers to the task questions, with the keystrokes being logged in the background. To ensure proper logging of keystrokes, users were prohibited from copying and pasting into the text area. It took about 8 months to gather both datasets. For the multi-keyboard data collection, users provided data in two sessions. During the first session, the user had to complete 16 tasks, which were repeated in the second session. The bilingual data collection was conducted remotely, with users accessing the web system through a web link from any computer. The same keyboard was used for both English and Chinese, and users were instructed to finish at minimum 8 tasks in each language. The data was saved in a remote MySQL database
To examine the impact of multi-keyboard and multi-language data in keystroke dynamics, Wahab et al. employed two free-text algorithms: the Instance-based Tail Area Density (ITAD) metric and the D-Vectors model. On average, each user provided around 14,000 keystrokes for the multi-keyboard dataset. For each user, per keyboard type, data of the initial visit was used for enrollment, while data from the second visit was used for testing. There were 200 keystrokes in each test sample, and the performance was measured using the Equal Error Rate (EER). The results indicated that enrolling and testing with different keyboards affect keystroke dynamics performance where keyboard size and layout were two significant factors.
In the bilingual experiment, their aim was to investigate the impact of multi-language data in keystroke dynamics. On average, each user provided around 10,000 keystrokes for both English and Chinese languages. Monograph and digraph features were extracted from the dataset. Data from the first two questions was used for enrollment and data from the other questions was used for testing, with around 900 keystrokes used for enrollment and each test sample consisting of 200 keystrokes. The results revealed a performance degradation for cross-language in keystroke dynamics, with a performance loss of 14% when enrollment was done with Chinese data and testing was done with English data, and a loss of 6.4% when enrollment was done with English data and testing was done with Chinese data.
4 Keystroke Authentication Algorithms
To guage the effectiveness of keystroke authentication systems, an authentication algorithm is required. Different kinds of keystroke authentication algorithms have been developed by researchers. In this section state-of-the-art keystroke authentication algorithms are explored.
4.1 Statistical Algorithms
Statistical algorithms are easy to implement, model and explain. They are deterministic and also do not require heavy computing power and/or memory. However, they require manual extraction of features which could be difficult and/or daunting and are less accurate when dealing with very large datasets. Below, we describe common statistical algorithms used for keystroke dynamics.
4.1.1 Gaussian Mixture Model
Gaussian Mixture Model (GMM), a linear non-Gaussian multivariate statistical method, is a popular algorithm used for handling non-Gaussian data. It is a statistical method based on the weighted sum of probability density functions of multiple Gaussian distributions [118, 35]. GMM generates a vector of mean values corresponding to each component and a matrix of covariance which includes components’ variances and the co-variances between each other. The parameter set is used for expressing GMM. The parameter comprises of component weights , mean vector and covariance matrix as shown in Equation 5. The parameters are estimated using the iterative expectation–maximization (EM) algorithm [34]. In every iteration, parameter () is updated if the iteration yields a higher likelihood and fits the distribution of the training dataset.
Given a set of reference samples (also known as profile), the mixture density for the keystroke input sample is defined as the weighted linear combination of M pure Gaussian distributions as given in Equation 7
| (5) |
| (6) |
| (7) |
4.1.2 Euclidean Distance
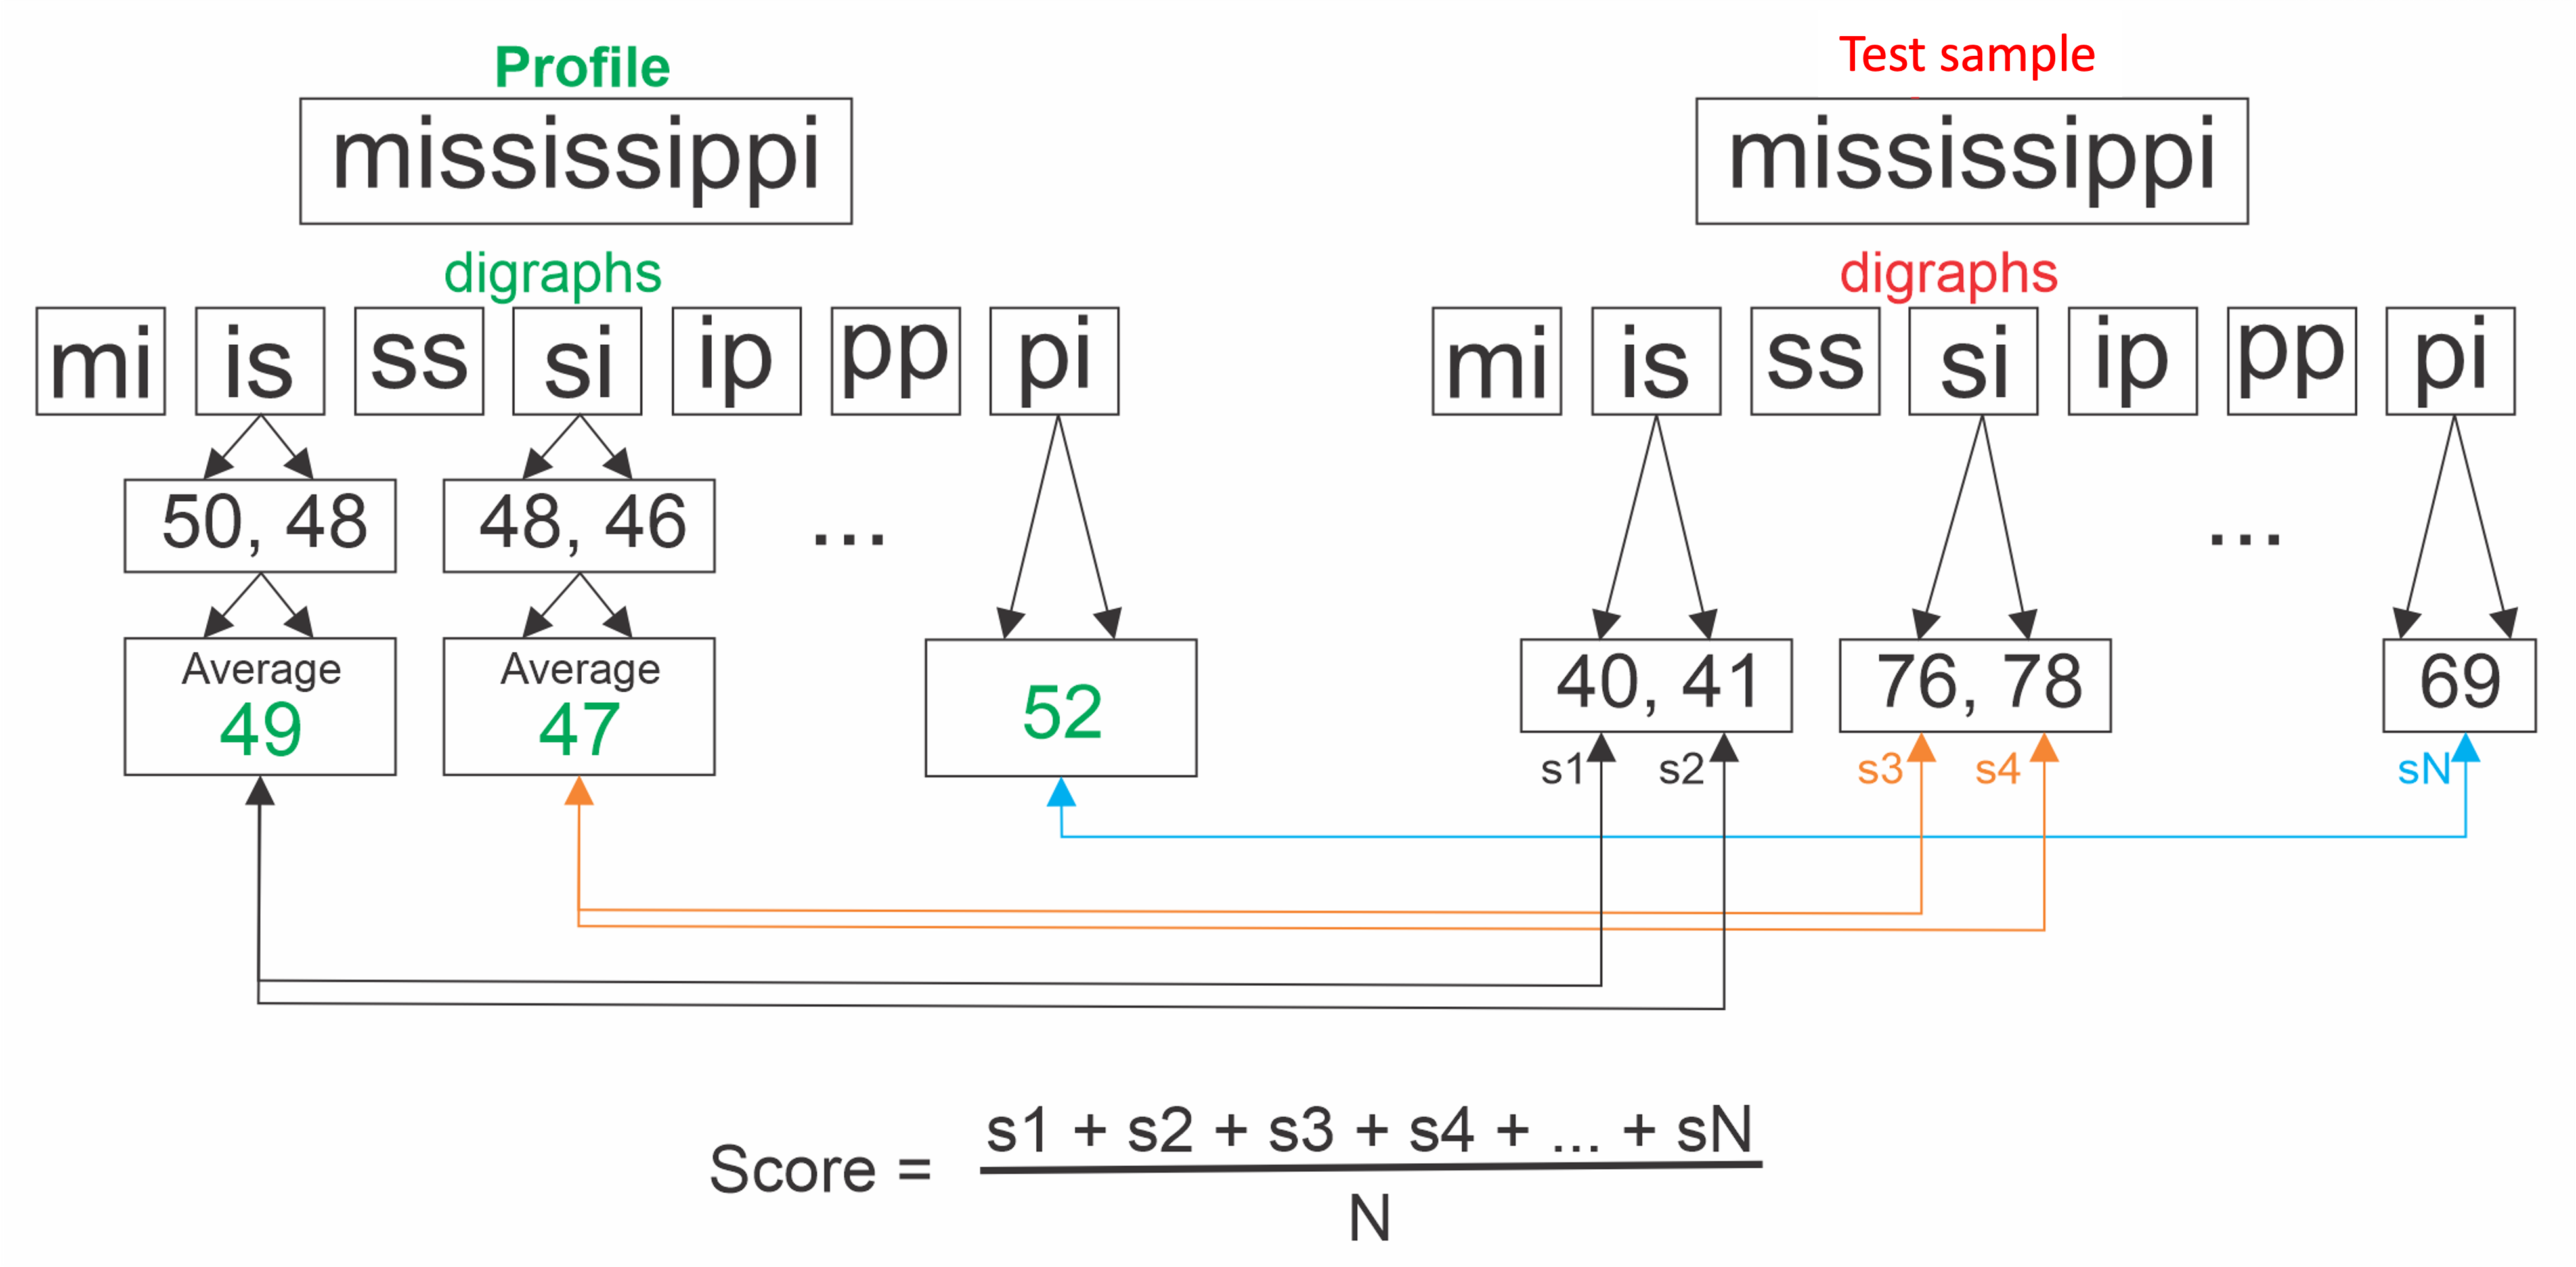
Euclidean distance is shortest distance between two locations (points) in Euclidean space and is found as given in equation 8, where represents the amount of digraphs shared between the test sample and the profile, is the individual test graph duration for the shared graph in the test sample, and is the mean of the graph in the profile [65, 113]. The Euclidean distance is an instance-based similarity metric and comparison is done on a single occurrence of a graph from the test sample to the reference profile as shown in Figure 5. The Euclidean distance assumes that the distribution of the graphs to be compared have the same variance. Hence, for two graphs with significant difference in variance, the Euclidean distance result is less accurate. Furthermore, if a correlation is present between the features, which is generally the case in real-world datasets, the Euclidean distance between a point and the mean of the points can give less accurate or misleading data about the distance between points. A reason for this is because Euclidean distance is a distance between two points only and fails to consider the relationship between a point and other points.
| (8) |
4.1.3 Manhattan and Scaled Manhattan Distance
The Manhattan distance, also known as the city-block distance, has been commonly used by keystroke researchers [20, 115, 64] and can be calculated as given in equation 9. is the number of digraphs shared between the test sample and the profile, is the individual test graph duration for the shared graph in the test sample, and is the mean of the graph in the profile. The Manhattan distance also follows an instance-based procedure (Figure 5). Similar to the Euclidean distance, the Manhattan distance assumes that the test and profile graphs have the same variance, which is often times not the case. Hence, the Scaled Manhattan distance, a modified version, is used. It can be calculated as given in equation 10. The Scaled Manhattan distance is identical to the Manhattan distance, except that the former is divided by the standard deviation () of the graph in the profile [65].
| (9) |
| (10) |
4.1.4 Instance-Based Tail Area Density
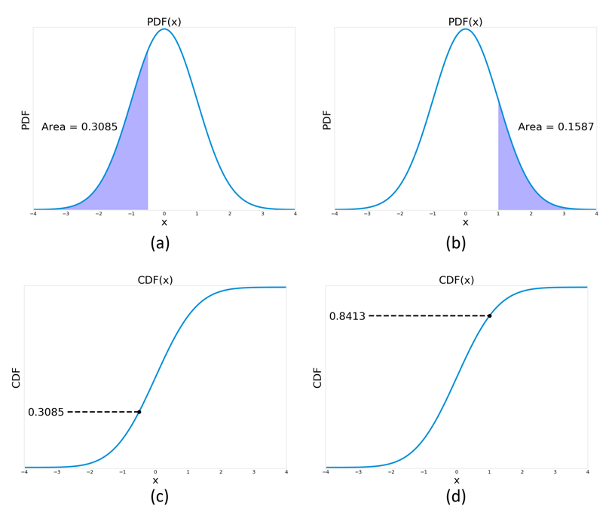
Ayotte et al. [17] proposed the instance-based tail area density (ITAD) metric, a novel instance-based graph comparison algorithm, to decrease the required number of keystrokes for authentication. The ITAD metric is also an instance-based similarity metric (Figure 5). This metric uses the tail area under the probability density function (PDF) or the percentile value of each test graph in the profile sample. Alternative to the instance-based algorithm is the distribution-based algorithm [17]. Distribution-based algorithms compare the PDF of each graph in the test and profile samples. Unlike distribution-based which requires that there are at least 4 instances of a graph in the test and profile samples before they can be compared, instance-based algorithms (such as ITAD) can compare graphs in the test and profile samples even when there is just a single instance of that graph in the test sample. ITAD can be calculated as shown in Equation 11, where CDFg is the empirical cumulative distribution function of the th graph in the gallery (profile), Mg is the median of the th graph in the gallery, x is the individual test graph duration for the th graph in the test sample that was shared with the gallery, and is the number of graphs shared between the test sample and the gallery. The ITAD metric scores for N graphs are averaged and a single similarity score is returned as given in Equation 12.
The illustration in Figure 6 depicts the computation of the ITAD metric using a graphical representation. The ITAD metric is calculated as the area of the tail of the PDF. If the sample falls below the median, the ITAD metric is determined by the tail area on the left, while if it is above the median, it’s determined by the tail area on the right. ITAD performs better than any distance metrics (such as the Scaled Manhattan) which are based on mean and standard deviation of graphs and are affected by outliers. ITAD metric scores ranges between 0 and 0.5 and can be interpreted as a measure of similarity. The larger the score is, the closer the test sample is to the profile.
| (11) |
| (12) |
4.1.5 Mahalanobis Distance
Mahalanobis distance is an example of a distribution-based algorithm. It is an effective multivariate distance metric that measures the distance between a point and a distribution [94, 127, 126, 65]. It takes into consideration the correlation between features which is more suitable when features are not independent. It is best for finding multivariate outliers and finds its applications in multivariate anomaly detection, classification and one-class classification. The Mahalanobis equation is shown in Equation 13, where is the feature vector of a test sample, is the mean feature calculated from the profile template, and is the inverse covariance matrix of the user profile template.
| (13) |
4.1.6 Gunetti and Picardi’s Metric
Gunetti and Picardi’s free-text algorithm [51] combines typing speed (A-measure) and the degree of disorder (R-measure) to measure similarity. The ‘A’ measure represents the distance between typing samples and in terms of -graphs, where is the number of consecutive keystrokes ( is monograph, =2 is digraph, =3 is trigraph etc.), is given in Equation 14, where t is a constant for determining n-graph similarity. For example, let G, and G, be the same n-graph occurring in typing samples and , with duration and , respectively. We say that G, and G, are similar if and only if 1 max(,)/min(,) t.
The ‘R’ measure on the other hand quantifies the degree of disorder between two sequences. Given a array of elements, a simple measure of the degree of disorder of with respect to (its ordered counterpart) is computed as the sum of the distances between the position of each element in and the position of the same element in .
| (14) |
4.2 Machine Learning Based Algorithms
Machine learning methods have been increasingly employed for keystroke dynamics. Here, we will detail the three classifications of machine learning including supervised, unsupervised and reinforcement learning with a focus on keystroke dynamics-based authentication techniques.
4.2.1 Supervised Learning
Supervised Machine Learning results in a model that predicts the outcome/label (i.e., P(ŷ|x), where ŷ (0, 1)) of a given data after the model has been trained with labelled data. The model at training has access to the label of the input (training) data which is usually used for computing training errors through the loss function. Based on training errors, the model backpropagates and updates the weights. When model training is complete, it is used to predict unseen input data in the absence of labels. Model accuracy is represented by the number of accurate predictions over the total number of predictions.
Supervised Machine Learning can be further divided into classification and regression. Classification uses an algorithm to accurately predict a class label on a test data - e.g., classifying user behavior as genuine or imposter. Binary classification refers to a problem involving two classes and multi-class classification refers to a problem with greater than three classes. On the other hand, regression is used for predicting the relationship between the label and input variables. Here, instead of predicting classes, regression makes numerical predictions such as predicting the weather or average salary. In keystroke dynamics, the focus is either to verify if the user is who he/she claimed to be (known as authentication), or to identify the user who the query sample belongs to (known as identification). Both scenarios belong to the classification type, hence, keystroke dynamics uses the classification techniques.
4.2.1.1 Support Vector Machine
A support vector machine (SVM) is a type of supervised learning model leveraged for classification problems. The SVM algoritum computes hyperplane(s) that uniquely seperate classes of points of data. The hyperplane, also known as the decision boundary, is an N-dimensional space plane, where N is the number of features in the dataset. Of several hyperplanes possible, the goal is to compute a boundry with the maximum margin that separates the classes (legitimate users from impostors) [47, 67, 123, 105]. This algorithm derives its name from support vectors, which are data points that are closer to the hyperplane and decides the orientation of the plane.
In keystroke dynamics, it is assumed that the keystroke samples in the instance of enrollment and verification have the an equal distribution, which is not usually the case, and as a result a lower prediction accuracy is obtained from most traditional machine learning classifiers. In this regard, SVM has a support for adaptive learning [27], where an existing SVM classifier (source) is adapted to another SVM classifier (target) based on some projection techniques. Knowing that there exist variations in users’ typing pattern at every sample, especially when the samples have a wide time margin (weeks, months or years apart), the adaptive SVM modifies the hyperplane of a pre-trained classifier using the new data points with minimum retraining, and therefore performs better than the regular SVM trained on the same amount of labelled data. The SVM classifier is a commonly used classifier in keystroke dynamics, especially on a small feature set dataset [25, 45].
4.2.1.2 Naive Bayes
The Naive Bayes classifier is a probabilistic machine learning model used for classification and based on the Bayes theorem with “naive" independent assumptions between features [16, 55, 32]. The Bayes’ theorem finds the probability of an event occurring given that the probability of another event has already occurred, as shown in Equation 15, where is the posterior probability, is the prior probability of the label class, is the prior probability of the predictor and is the likelihood. The Naive Bayes classifier offers several advantages, such as being less computationally demanding compared to other traditional machine learning models, and performing well on small training data when the assumption of feature independence holds. Additionally, it can be used for solving multi-class prediction problems, which are identification problems that involve predicting one of several possible classes (or outcomes) for a given input. In keystroke dynamics, where dependencies between features may exist, the Naive Bayes classifier may not be as effective and is therefore less commonly used.
| (15) |
4.2.1.3 Tree-Based Models
Tree-based models are a type of supervised machine learning algorithm used for classification. They use a set of conditional statements to recursively split training data into subsets. The end result model is a roadmap of logical decisions that describes the dataset. Tree-based models are easy to implement and interpret, less computationally intensive, and are popularly used in keystroke dynamics because of their non-parametric attributes, making it preferable even for a non-Gaussian distributed data [102]. Tree-based models are tolerant to outliers and intra-class variation problems, work with both numerical and categorical variables, and require less data preprocessing steps such as variable transformations (scaling, normalization etc). However, they are prone to overfitting and high variance. Popular tree-baseed methods used in keystroke dynamics are random forest [17, 11], gradient boost and extreme gradient boost (XGBoost) [105, 28]
4.2.1.4 K-Nearest Neighbors
K-Nearest Neighbors (KNN) is a non-parametric supervised machine learning classifier (although can also be unsupervised) that classifies new data points based on their proximity with data points of already known classes. KNN works on the assumption that data points of similar classes are closer to each other and can be found near each other [57, 107, 16]. During testing the distances between a new point of data and prior points (neighbors) is calcualted. A class label is assigned to a new data point based on a majority vote between its K nearest neighbors, where K is the number of neighbors that will be checked to determine the class to assign for the new query point. Generally, the optimal value of K is found experimentally, as a low value of K results in low bias but high variance, while a high value of K gives high bias and low variance. Distance metrics (such as the Euclidean distance, Manhattan distance, Hamming distance etc.) are used in calculating the distance between the query point and other data points. These distance metrics form the decision boundaries. KNN is known as a lazy learner it does the nearest neighbor calculation at every run time. Because of this, it is used only on less dimensional data and has high computational cost when used on high dimensional data.
4.2.1.5 Multi-Layer Perceptron
Multi-layer Perceptron (MLP) is a type of supervised learning algorithm cosisting of input, output, and several hidden layers (those in between the input and output layer). The input data to be processed are passed to input layer, the output layer does the classification, and the hidden layer (non-linear layer) preforms the the computational work. Therefore, data flows in forward direction from the input layer to the output layer. MLP is a neural network with multiple layers and each layer is a combination of neurons such that the output of some neurons are passed as input to other neurons in the next layer. The number of neurons and hidden layers used is dependent on the type of classification problem being solved. MLP is capable of learning non-linear models, but it requires several hyperparameter tuning such as the number of hidden neurons, hidden layers and iterations. Hence, it is computationally intensive and requires both genuine and imposter data to train. Neural network is capable of producing much better performance than the statistical algorithms and any other machine learning algorithms when working with big data that has both genuine and impostor samples [5, 52, 108, 90].
4.2.2 Unsupervised Learning
Unsupervised learning is a type of ML used for identifying patterns in datasets that contain unlabeled data points whereas with supervised learning the data is labeled and the algorithm is trained on this data to make predictions. In keystroke dynamics, unsupervised learning algorithms are often used for outlier detection. Some of the unsupervised learning algorithms used in keystroke dynamics include One-class SVM (OCC), K-NN and K-Means [61, 121]. These algorithms are useful in situations where obtaining labeled data is difficult, costly, or impossible, and the ground truth (label) is unknown.
| Dataset reference | Algorithm reference | Name of the algorithm | Result |
| Murphy et al. [84] | Migdal and Rosenberger [77] | Distance Metric Fusion | EER-3.6% |
| Vural et al. [118] | Ceker and Upadhyaya [24] | Gaussian Mixture Model | EER-0.08% |
| Ahmed and Traore [5] | Ahmed and Traore [5] | Sorted Time Mapping Technique along with Neural Networks | EER-2.46% |
| Murphy et al. [84] and Sun, Ceker, and Upadhyaya [109] | Ayotte et al. [17] | Instance-Based Tail Area Density Metric combined with Fused Matching Score | EER-7.8% and 3% |
| Foresi and Samavi [40] | Foresi and Samavi [40] | Novel Statistical Model | FAR-0.0% and FRR-2.54% & 2.87% |
| Popovici et al. [90] | Popovici et al. [90] | Combination of MLP and Trust Algorithm | Classification rate-80% |
| Vural et al. [118] | Ceker and Upadhyaya [27] | Transfer Learning Techniques | EER-19.47% |
| Killourhy and Maxion [65] | Singh et al. [105] | XGBoost | Accuracy-93.60% |
| Syed, Banerjee, and Cukic [111] | Syed, Banerjee, and Cukic [111] | Event Sequences | Increased Effectiveness |
| Killourhy and Maxion [65] | Ravindran, Gautam, and Tiwari [92] | ECM-ELM Classification Model | Stable and Good Accuracy(86.97%) |
| Singh et al. [104] | Singh et al. [104] | Authentication without Template | SFR & SFA - 87 |
| Wu et al. [123] | Wu et al. [123] | Triboelectric Device | EER-1.15% |
| Killourhy and Maxion [63] | Kobojek and Saeed [66] | Recurrent Neural Network | EER-0.136 |
| Krishnamoorthy et al. [67] | Krishnamoorthy et al. [67] | mRMR Feature Selection Technique | Accuracy-0.9740 and F1 score-0.9701 |
| Killourhy and Maxion [65] | Zhong, Deng, and Jain [127] | Nearest Neighbor(New Distance Metric) and Outlier Removal | EER-0.084 and ZMFAR-0.405 |
| Acien et al. [1] | Acien et al. [1] | TypeNet | EER-2.2% |
4.3 Deep Learning-Based Algorithms
Deep learning is a machine learning technique which learns features automatically from data. The data in this case are sequential keystrokes data. Deep learning, when modeled properly, is robust to natural variations in sequential or temporal data. Deep learning is data hungry and its performance is partially directly proportional to the volume of the training data used, and as such, its application in keystroke dynamics has been limited due to the lack of large publicly available datasets. However, with the availability of large keystroke datasets such as the Aalto [36, 88] and Clarkson II [59] dataset, this option is now being explored [1, 2]. Popular deep neural network types are the convolutional neural network (CNN) and recurrent neural network (RNN).
4.3.1 Convolutional Neural Network
Convolutional neural networks (CNN’s) [50] are deep learning algorithms that take in an input image and learn to identify key features in the image mich like human vision. The basic CNN architecture is comprised of several layers such as the input layer, convolution layer where high-level features are extracted from the input image, pooling layer where the spatial size of the convolved feature is reduced, and the fully connected or dense layer where the result is flattened out and passed through an activation function that outputs the final classification result [41]. Basically, CNN uses convolution, also known as a sliding window (known as a “filter”) that passes over the image, extracting key features feeding them to lower layers in the network. A CNN, when trained with enough data, can successfully capture the spatial and temporal information in the data. Although CNN was originally created for image classification where pixels form a two-dimensional grid, it has found its usefulness in keystroke dynamics [26, 72, 124] and several other fields.
To leverage the CNN for keystroke analysis, keystrokes data are grouped into sequences, with each sequence containing a fixed length () of sequential keystroke data. Each sequence is then converted into a two-dimensional grid of specified dimension (similar to an image), and all sequences are passed as input into the CNN model to be trained, where is the sequence length (also known as timesteps) and is the number of features. The overall input size is represented by - [samples (), timesteps (), features ()], where samples () is the total number of sequences created from the dataset. There are two main types of CNN that can be used - the two-dimensional CNN (2D-CNN) and the one-dimensional CNN (1D-CNN). The 2D-CNN is the standard CNN where the kernel (filter) slides along 2 dimensions on the input data and extracting the spatial features [72]. The 1D-CNN on the other hand, has a kernel that covers all the features and slides along one dimension [74]. Both the 1D-CNN and 2D-CNN have shown to be effective on time-series sequential data such as the keystroke data, however, the 1D-CNN is preferable and has produced better results in literature. This is because 1D-CNNs are designed to handle sequences of one-dimensional vectors, while 2D-CNNs are designed to handle images or data represented in two dimensions. In keystroke dynamics, the data is usually represented as sequences of time-based features including but not limited to hold time and inter-key time. 1D-CNNs can capture the temporal patterns in the sequences of these features, whereas 2D-CNNs would not be well-suited for this type of data. Additionally, due to the sequental characteristic of keystroke data extensive padding would be required to produce a 2D representation, which would be computationally expensive and may negatively affect model performance. 1D-CNNs are computationally more efficient and better suited for keystroke dynamics data, as they can effectively handle the sequential patterns in the data without the need for padding. Although CNN is less computationally intensive as contracted with recurrent neural network (RNN), it can not process all keystroke data in a sequence simultaneously and it is unable to capture the sequence order information like RNN would.
4.3.2 Recurrent Neural Network
The recurrent neural network (RNN) [76] is a deep learning algorithm best used for sequential or time series data such as keystroke data, and are commonly used for natural language processing including speech recognition and language translation. A RNN keeps track of information from previous inputs through its memory gate, and decides which information in the past should be remembered or forgotten based on the current input and output. As a result, unlike other deep neural networks, the output of RNN depends on previous information in the sequence, especially for a unidirectional RNN. However, a bidirectional RNN can produce a output that depends on both the past and future information in the sequence. At step t the RNN receives as input, with the knowledge of the state it computes its output using Equation 16 and 17. , and are matrices of network parameters. Furthermore, the weight parameters of the RNN are shared within each layer and can be adjusted through backpropagation and gradient descent. The input to an RNN is also three dimensional - the first dimension is the total number of sequences created from the dataset, the second is the timesteps or length of sequence, and the third is the number of features. When using RNN, it is important that the length of sequence is fixed, however, there are situations where authentication decision is needed on keystroke samples less or greater than the fix length. To solve this, sequences less than the required length are usually padded, while sequences greater than the required length will be truncated.
| (16) |
| (17) |
A major challenge with RNN is the exploding and vanishing gradient problem [56, 19]. This is due to a gradient growing too big or two small for accurate calcauations creating an unstable model. A possible solution is to reduce the size of the network by reducing the number of hidden layers or neurons. Other variants of RNN such as long short term memory (LSTM), gated recurrent unit (GRU) and bidirectional recurrent neural network (BRNN) were created to solve the exploding and vanishing gradient problem.
4.3.2.1 Long Short Term Memory
is a popular RNN architecture, introduced by Hochreiter and Schmidhuber [56] as a solution to the vanishing gradient problem. It is used in modeling long-distance relations in input data. The main benefit of LSTM is inclusion of a cell state, which simply acts like a memory chain by storing information from past states. There are three gates in LSTM - an input gate, an output gate, and a forget gate. The three gates act as logic control within the model used to predict the model’s output. The forget gate is computed using Equation 18, where is the sigmoid function, is the output from previous step, is the input from current step, and and are the weight matrix and bias for the forget gate. At the input gate, the following computations with Equation 19 and 27 is carried out. Results are then used to update the cell state using Equation 21, where represents the state of the previous cell. The final output for the current step is calculated as given in Equation 22 and 23.
This variant of RNN has been widely used in keystroke dynamics for both authentication and identification[1, 66, 33]. Acien et al. [1] created a deep learning architecture that is quite different from the conventional LSTM architecture with the siamese neural network (SNN) and they called TypeNet. SNN is a class of neural network architectures that contain two or more mirrored sub-networks. A major difference between SNN and other traditional LSTM models is that, a SNN is designed to find the degree of simularity of the inputs to teh sub-networks. Hence, it is able to predict new classes of data from users not seen during training without the need to retrain the model. The architecture achieved state-of-the-art performance in keystroke dynamics authentication with EER of 2.2% and 9.2% on Aalto desktop [36] and mobile [88] datasets, respectively.
| (18) |
| (19) |
| (20) |
| (21) |
| (22) |
| (23) |
4.3.2.2 Gated Recurrent Unit
is also a variant of RNN with similar properties to a LSTM by also addressing the vanishing gradient risk of RNN models [30]. Here, instead of a “cell state” and three gates used in LSTM, GRU uses hidden states and has two gates - a reset gate , and an update gate . The reset and update gates control which information to retain. The network computations are shown below. The GRU is without the memory unit which makes it expose the full hidden content without any control. With fewer gates, GRU trains faster, are less complex and performs better than LSTM, especially on smaller dataset [66, 71]. In relation to keystroke dynamics, [66] contrasted the performance of GRU and LSTM on the same dataset using two scenarios, first was using only the dwell time, and the second was using all the data. They reported that the GRU (15% EER) outperformed LSTM (21.9% EER) when only the dwell time is used, but the LSTM (13.6% EER) outperformed GRU (22.4% EER) when all the date was used.
| (24) |
| (25) |
| (26) |
| (27) |
5 Significance of Keystroke Data Processing Techniques
Throughout the following section the impact of different data preprocessing techniques is described. The performances of keystroke authentication algorithms depend largely on keystroke data that is used for authentication. So it is important to determine which type of data can give the best result.
5.1 Effects of Text Filtering
Huang et al. [60] tried to determine the effect of gibberish text on the performance of keystroke dynamics. Noise or gibberish text can originate when a user plays a computer game or does some unnecessary task. Huang et al. decided that the unnecessary text should be filtered out due to its negative impact on authentication performance. For the evaluation of their hypothesis, they used a novel dataset that was collected when the users were performing normal day-to-day activities. There was no restriction or control over the users. They were free to type anything in order to analyze the noise keystrokes. Huang et al. used a keystroke logger to collect the data of 60 users in a campus student computer labatory. Each user provided at least 11000 keystrokes. They used Gunnetti and Picardi’s algorithm [51] for evaluation. Huang et al. used samples of 1000 keystrokes to create user profile. Each user profile consisted of 10 samples with the rest reserved for testing. They also used the "zone-of-acceptance" algorithm by Leggett et al. [69]. From the dataset, Huang et al. detected four types of gibberish keystrokes - repeating characters, gaming patterns, long string with few distinct characters, long string with no white spaces or separators. They then used two types of algorithms in order to remove gibberish keystrokes. The first one was based on regular expressions which identified four patterns of gibberish keystrokes. The second one was a spell checker which checked for correct English words. They also used context-based filtering and determined that 23.3% data of their dataset was gibberish. The evaluation showed that though gibberish keystrokes did not have much effect on FAR, they negatively impacted FRR. Spell checker filtering showed better performance than regular expressions but the best result was achieved by combining both filters.
5.2 Effect of Data Size
Huang et al. [58] analyzed the preformance degradation on keystroke authentication systems by experimenting with datasize. In this work, Huang et al. tried to determine the impact of reference profile size and test sample. They used two algorithms for their evaluation process. The first one was Gunetti and Picardi’s algorithm [51]. The second one was the "zone-of-acceptance" algorithm by Legget et al. [70]. Huang et al. used this dataset [118] for their evaluation process and performed two experiments. In experiment 1, Huang et al. detected all instances of digraphs and trigraphs in the previously collected user’s data, then created a reference profile and a test sample of specific size. Every instance of data contained within the reference profile was divided into five samples in order to implement the Gunetti-Picardi algorithm. The dataset contained the data of 39 users. Huang et al. performed the tests 50 times to avoid errors. In experiment 2, each user’s data was divided into groups of 1000 digraphs. The range of reference profile size was from 6000 digraph instances to 17000 digraph instances. Only 25 users had enough data to perform the tests. From experiment 1, the results indicated that the FAR value improved when the reference profile size was contant and the test sample size increased. The results also showed that keeping the test sample size constant and increasing the reference profile size did not necessarily improve the FAR. The IPR (Imposter Pass Rate) improved when the reference profile size increased. The IPR values did not decrease for smaller test sample. In experiment 2, Huang et al. used the "zone-of-acceptance" algorithm. The results showed that both FAR and IPR improved with an increasing the reference profile size. Huang et al. also found out that the reference profile should consist of a minimum of 10000 keystrokes or more to achieve good performances.
5.3 Impact of Faulty Users’ Data
In [87], Ozbek tried to improve on classification performance of keystroke data by removing the users who degrade the performance. Ozbek used two benchmarking databases with different number of users and passphrases for the evaluation. 1) GREYC Keytroke Data: 133 participants that typed the passphrase "greyc laboratory" on an AZERTY keyboard for the collection. There were 7555 attempts [46]. For this dataset, Ozbek removed some of the users with a low number of captures leaving only the 100 participants with more than 50 attempts. 2)CMU Keystroke Data: 51 participants typed the password ".tie5Roanl" with 400 attempts per user [65]. The data of the two datasets were used as they were and no features were removed. Also no dimension reduction techniques were implemented to improve the performance. To evaluate the preformance Ozbek used support vector machine (SVM), decision tree and K-nearest neighbour (KNN) classifiers. For these three classifiers, each keystroke datum was divided into training, testing and validation set. 70% of the data was used for training, 15% was used for testing and 15% was used for validation. No crossvalidation technique was applied. Ozbek used a histogram to detect the faulty users. Re-classification of the data was performed with the remaining users. For both datasets, Ozbek achieved higher accuracy by eliminating the users with misclassifications at the time of training. First Ozbek removed the worst five users which improved the performance. Ozbek achieved better results by removing more users having misclassifications. However, removing the users from the database was not a standard option. The main goal was to demonstrate that the worst users could be recognized and eliminated if required.
5.4 Impact of Non-Conventional Keystroke Features
Alsultan, Warwick, and Wei [13] tried to use non-conventional keystroke features for authentication of users. In the case of the non-convention features, the focus was mainly on the overall typing patterns. Percentage of performing certain actions were considered, such as editing actions, general typing actions etc. The goal was to understand the typing behavioFr of a user. Two types main of typing features were considered - semi-timing and editing features. Semi-timing features were different from the common timing features used in previous experiments. These features were calculated for greater amounts of time. The semi-timing features that they used were - 1) Word-per-Minute (WPM) = Number of words / Total typing time in minutes, 2) negUD (negative Up-Down) = Number of negative UDs / Total number of keypairs, 3) negUU (negative UP-Up) = Number of negative UUs / Total number of keypairs. Editing features were characteristics such as typing error frequency, text editing etc. The editing features were - 1) Error rate, 2) CapsLock usage, 3) Shift key usage. Thirty participants provided data for this study and participants had to complete eight typing tasks. The tasks included copying text of 1000 characters. The text was taken from the Guardian newspaper. In the text, there were numbers, both upper and lower case letters and punctuation marks. Alsultan, Warwick, and Wei used a C++ language based GUI program for the data collection. The participants could download the application in their own machines. As the user’s profile, a feature vector of nine features was generated and saved in the database. Out of eight typing tasks each were accompklished with a typing sample from a single source. Features were identified and extracted independently of each typing task.
In the analysis phase, eight samples per subject were used for training and testing of the classifier. As a classifier, decision trees were used in this research. Cross-validation was used in the classification process. In their experiment, Alsultan, Warwick, and Wei used eight samples to perform eight cross-validation experiments. They used seven samples for training and one sample for testing. They used the statistics toolbox in Matlab and two error rates to represent the results - False Accept Rate (FAR) and False Reject Rate (FRR). They obtained low error rates in this study and computed the rates of error for a variable number of participants. For the decision tree classifier, they obtained a FAR of 0.007, 0.0104 and 0.0109 for 15, 25 and 30 participants respectively. Alsultan, Warwick, and Wei obtained a FRR of 0.1, 0.25 and 0.28 for 15, 25 and 30 participants respectively. They also used Support Vector Machines (SVMs) for the classification. Feature subset selection was used in SVMs based classification in order to decrease the dependency between the features.
Alsultan, Warwick, and Wei achieved the best results for a feature set of five features - a FAR of 0.0183 and a FRR of 0.444. They computed the error rates for 30 participants. The focus was on true intruder’s detection in the second part of this study. In this part, typing samples from unknown users were used to test the system. Here, they used binary classification. For the binary classification, they used the training data from 25 legal users and testing data from five intruders. Each intruder generated three typing samples to test the system. For the decision tree classifier, Alsultan, Warwick, and Wei achieved a FAR of 0.011 and a FRR of 0.375 for 25 genuine users without any intruders. For the SVMs, they achieved a FAR of 0.0112 and a FRR of 0.49. When the data of the five intruders was tested against the genuine users’ data, they got the same FAR in case of SVMs. In this study, the FRR improved with a value of 0.28 by utilizing non-conventional features. The lowest FAR was 0.011 which was also comparable to the results generated by conventional features.
6 Keystroke Authentication on Touch Screen and Mobile Devices
This section describes various aspects of keystroke authentication on touch screen and mobile devices. As people are being more dependent on touch screen devices like tablets and mobile phones, it is necessary to ensure security and authentication systems based on these devices.
6.1 RHU Keystroke
El-Abed, Dafer and El Khayat [38] coined a new benchmark named, RHU Keystorke, which uses touch screen keystorke dynamics They used a Windows Phone app for data collection. The data were stored in a keystroke dynamics database and necessary features were extracted. The participants in the data collection were students of varying backgrounds to ensure the scenario was as real as possible. The data were stored in two tables. Users Table features were: Username, Password, Trialsattempted, Gender, age. Timers Table features were: Id, Trials, Username, PP (time difference between two key presses), PR (time difference between a key press and a key release), RP (time difference between a key release and a key press), RR (time difference between two key releases), Date. Their goal was to make a publicly available benchmark for keystroke authentication. A total of 53 participants participated in 3 sessions typing the password rhu.university 15 times in each session. On average there was 5 days gap between two sessions. The RHU Keystroke benchmark consisted of four timing features - PP, PR, RP, RR.
In [39], El-Abed, Dafer, and Rosenberger proposed a benchmark for keystroke dynamics using a mobile phone and tablet. The touch screen based benchmark was developed in both portrait and landscape orientation. The objective of this benchmark was to evaluate the keystroke authentication algorithms for varying models of devices and different orientations. To observe the acquired keystroke signals, an online visualizer was provided. They used an Android application for developing their benchmark. The app was written in Java for Android devices. They used Nexus 5 and Samsung Galaxy Note 10.1 2014 tablet for data collection. There were two main purposes of this keystroke benchmark. Firstly, they wanted to investigate the patterns of tping of the users for a veriety of orientations, but the device and the password were same. Secondly, they wanted to analyze the effect of different devices on the typing patterns of the users keeping the orientation and the password constant. Data was gathered from 47 users. The users type the password "rhu.university" in four configurations in each session: phone/portrait, tablet/portrait, phone/landscape, tablet/landscape. The key features of the benchmark were - PP, PR, RP, RR, TT (time of typing the password), Screen Orintation (portrait or landscape), Screen Size. El-Abed, Dafer, and Rosenberger performed a statistical analysis using their benchmark and used the Kruskal-Wallis test [54] for the analysis. The goal was to reflect the changes of the keystroke features due to different orientations and different devices. The results indicated that the keystroke features varied significantly for different orientations and different devices. These results must be considered for touch-screen-based mobile authentication technology.
6.2 Combination of Touch-Based and Time-Based Features
Gautam and Dawadi [43] tried to analyze different features of the touch-screen keyboard for keystroke authentication. They tried to combine the effect of touch-based and timing features and proposed a dataset of 7 users. The authentication system consisted of three steps - Enroll, Verify and Identify. The user authorization process consisted of two phases. For both the training and enrollment phase, a reference template was generated. In the testing or authentication phase, the test samples were matched against the reference template using the Median Vector Classifier [6]. They used four features for the authentication - Key hold time (H), Flight time (FT), Pressure (P), Area (A). They used the string .pie7Crawl for their dataset. The dataset consisted of 47 features. In order to perform their experiment, Gautam and Dawadi utilized a OnePlus 3 Android phone with an AMOLED capacitive touch screen and 1080 * 1920 pixels (5.5 inches). All the 7 participants were touch sceen smart phone users. Every user typed the string .pie7Crawl7 on the touch screen keyboard. Among the 7 participants, one was considered a legal user and the other 6 participants were considered imposters. The legal user participated in 40 sessions. Among those sessions, 10 were reserved for training and the rest for testing. Each of the other 6 participants (imposters) participated in 5 sessions. By using the median vector proximity algorithm, Gautam and Dawadi achieved an average EER of 8.33% and standard deviation EER of 7.07%.
6.3 Statistical Keystroke Dynamics System
In [8], Al-Obaidi and Al-Jarrah proposed a classifier leveraging a median-based method for keystroke authentication on mobile devices. The classifier was used as an anomaly detector on the SU dataset [15]. For this dataset, the CMU password (".tie5Roanl") was used. There were both timing and touch features of mobile devices in the dataset. There were 11 characters in the password including the Enter key resulting in 71 features in total (timing and touch screen features). 42 users took part in the data collection typing the same password 51 times. 34 entries were used for training and 17 were used for testing. The data collection was performed on Android devices, a tablet and a mobile phone. The proposed statistical classifier model used the median of the training features. The testing features were authenticated against the training features. There were three timing features - Hold (H), Up-Down (UD), Down-Down (DD) and two touch screen features - Pressure (P) and Finger Area (FA). The first five entries of each subject were used to create an imposter set. Al-Obaidi and Al-Jarrah achieved an EER of 8.53% for 41 timing features and an EER of 6.79% for both timing and touch screen.
In [7], Al-Obaidi and Al-Jarrah proposed a keystroke authentication system for use on mobile devices. They adopted an anomaly detector leveraging statistical distance-to-median that used both the timing and touch screen features. The goal was to develop a suitable keytroke dataset for mobile devices and evaluate the performance of the distance-to-median anomaly detector. Al-Obaidi and Al-Jarrah performed their experiment on Nexus smartphones and tablets and used five features for the authentication system - Hold, Latency or Up-Down (UD), Down-Down (DD), Pressure (P), Finger Area (FA). The system consisted of two phases. In the training module, the required tasks were - 1) Registration of users through user-id and password, 2) Selection of the number of attempts of password entry and the pass-mark, 3) Password typing for the selected number of times, 4) Template generation. In the testing phase, the test vector was compared against the template stored in the database. The test vector was generated from the login attempt. The data was collected from 56 users each typing a 10 character password 51 times. For a different pass-mark per subject, they achieved an EER of 0.049. For a global pass-mark, Al-Obaidi and Al-Jarrah achieved an EER of 0.054 and implemented three verification models based on distance to obtain their results. Al-Obaidi and Al-Jarrah obtained an FRR (false rejection rate) of 5.6% for the FAR (false acceptance rate) of 5%.
6.4 Impact of Touchscreen Features
In [15], Antal, Szabo, and Laszlo used their dataset of 42 individuals to investigate the interaction of touchscreen features on the performance of keystroke authentication systems. For data collection purpose, they developed an Android application for a Nexus 7 tablet and a Mobil LG Optimus L7 P710. The application had its own software keyboard. During the registration period, the users had to enter their data such as their gender, date of birth, experience of smartphone usage etc. Data was collected in multiple sessions. Most users participated in two sessions in two weeks. The users entered the same password (tie5Roanl) during each session 30 times. A total of 42 individuals provided their data with 51 entries for each user. Entries containing deletions were discarded from the dataset. As all users entered the same password, the data of each user could be used both as legal user and impostor. Among the 42 users, 37 were tablet users and 5 were mobile phone users. The system saved both the timing and touchscreen features. They used WEKA (version 3.6.11) [86] software for their experiment. Weka’s search methods was used to optimize some of the default parameters of the classifiers. They used Bayesian network, Nearest neighbors (k-NN, IBk in Weka), Naive Bayes, Decision trees, Support vector machines, Multilayer perceptrons etc. for the evaluation process. In the identification phase, Antal, Szabo, and Laszlo used two datasets to compute the accuracy - one with touchscreen features (pressure and finger area) and one without touchscreen features. There were 41 features in the first one and 71 features in the second. The data was used without any modification or feature selection and without boosting or tuning methods. They used 10 fold cross-validation in their experiment and computed the classification accuracies by taking the average of 10 runs. All algorithms performed better on the dataset containing touchscreen features. In the verification phase, R script developed by Killourhy and Maxion [65] was used for performing the measurements. Three anomaly-detection algorithms were included in the R script - Euclidean, Manhattan and Mahalanobis metrics. The normalized data was split into three equal segments. In each part, there were 17 samples from each user. User’s template was generated using two-thirds of the data with the remaining data used for FRR testing. In the case of FAR testing, the first five samples from each user were used as impostor data. The measurements were performed three times using a different fold each time for training and testing. The lowest EER was 12.9% which was achieved using the Manhattan metric for both timing and touchscreen features. For timing features, the lowest EER was 15.3%, achieved by the Manhattan metric. Their findings showed that in the identification phase, the accuracy of each classifier increased by 10% due to the addition of touchscreen features. In the verification phase, the EER was reduced by 2.4%.
| Reference | Data | Algorithm | Result or Contribution |
| El-Abed, Dafer and El Khayat [38] | Password | Benchmark dataset | |
| El-Abed, Dafer, and Rosenberger [39] | Password | Kruskal-Wallis Test | Proof of variation of keystroke feature due to different orientations and different devices |
| Gautam and Dawadi [43] | String | Median Vector Proximity | Average EER-8.33% and Standard deviation EER-7.07% |
| Al-Obaidi and Al-Jarrah [8] | CMU password | Statistical Median-Based Classifier | EER-6.79% |
| Al-Obaidi and Al-Jarrah [7] | Password | Statistical Distance-to-Median Anomaly Detector | EER-0.049%(for different pass-mark) |
| Antal, Szabo, and Laszlo [15] | Password | Manhattan Metric | EER-15.3% |
| Corpus et al. [31] | Password | Neural Network Model | Accuracy-73.33% |
| Kambourakis et al. [62] | Password and Passphrase | Random Forest and k-NN | Lowest EER-13.6% |
| Giuffrida et al. [49] | Password | Machine Learning and Distance Metrics | EER-0.08% |
| Lee et al. [68] | PIN | Distance-Based Classification and OCSVM | EER-7.89% |
| Buschek, De Luca, and Alt [23] | Password | Anomaly Detectors and Classification Methods | Combination of spatial and temporal features |
6.5 Keystroke Dynamics and Accelerometer Biometrics
In [31], Corpus et al. described the use of accelerometer biometrics (the measurement of how a person holds his mobile device) in conjunction with keystroke dynamics. They proposed a model for security in mobile applications by combining accelerometer biometrics with previously studied keystroke dynamics. The goal was to apply their model in a real world use case. For data collection, they created an application using the IDE Android Studio 1.3.2. They used a QWERTY soft keyboard and collected the keystroke data from 30 users. Users had to type a password of 8-16 characters a total of 8 times. The collected data were stored in two different text files. The first file recorded the data related to keystroke dynamics and the second file contained the data of accelerometer biometrics. Among the 8 samples of each user, the first 6 samples were used for training and the remaining 2 samples were used for testing. Their models were - Naive Bayes, Decision Tree, J48 and Neural Networks. They developed their models on three sets of features to train their models - accelerometer biometrics only, keystroke features only and lastly a combination of the both. The neural network model showed the best performance for combined features. However, adding feature selection improved the performance. Chi Square attribute was used to rank the features and the low rank features were removed. Corpus et al. also removed the features which were highly correlated to other features. After data cleaning the accuracy increased to 68.89% after implementing the feature selection techniques. They used a pre-labeled test set to test the best model. The test accuracy was 73.33%, FAR was 27.59% and FRR was 26.67%. Corpus et al. modified their data collection tool for real world testing through a prototype. The enrollment of the username and four password samples was included in the mobile application. A web server was used for the implementation of re-modeling and testing processes. Play Framework in Eclipse was used in the web server. After the data collection and feature extraction, the data was submitted in a csv file in the web server. At the server side, Rapid Miner libraries were used for re-modeling. Six users participated in this test. These was no password sample of these six users in the database. Each user chose their own password and typed the password four times. The users tested their own passwords and the passwords of their co-participants. The prototype combining accelerometer biometrics with keystroke dynamics, they concluded that accelerometer biometrics has an impact on keystroke dynamics based authentication. Though the prototype showed low FAR (7%), the recognition performance was above average (60%-70%). It concluded that the prototype was not fully accurate and ready to deploy.
6.6 Touchstroke Based Authentication System
Kambourakis et al. [62] developed and evaluated a touchstroke based authentication system in the Android platform. They used two new features for their experiment a apart from commom keystroke features - speed and distance. They adopted two commonly used authentication procedures.
-
1.
In the first procedure, the users had to type the password 7q56n5ll44 which consisted of 10 characters.
-
2.
In the second case, the users had to type the phrase the quick brown fox jumped over the lazy ghost. Each user had to type the phrase 12 times.
They used four touchstroke features.
-
1.
Hold-time: time between a key press and key release,
-
2.
Inter-time: time between a key release and the next key press,
-
3.
Distance: the distance in pixels between two successively pressed virtual keys,
-
4.
Speed: the quotient of the distance divided by the inter-time.
20 users participated in the data collection between the ages of 19 and 21 years old. All users had a touchscreen based Android smartphone. Each user provided the data 12 times repeatedly for both cases (password and phrase). The researchers used two different data analysis procedures for the evaluation.
-
1.
For the first procedure, the classifier analyzed all the pairs of successively pressed keys. The final decision was given after the full password was entered.
-
2.
For the second procedure, the average values of all the pressed keys were considered.
20 data files were generated per scenario (password and phrase) per data analysis procedure resulting in 80 files in total. In each file, there were the data of one legal user and 17 potential intruders.
Kambourakis et al. implemented a prototype of their proposed touchstroke based authentication system in Google’s Android OS. In order to generate the typing behavioral profile of the user and authenticate the user, Kambourakis et al. implemented Waikato Environment for Knowledge Analysis (Weka) as the classification engine. There were two main analysis sub-systems in their mechanism. 1) Enrollment Process: here the typing profile of a user was created and used to train the classifiers, 2) Authentication Process: here the legitimacy of a user was checked. The typing profile of a user was saved in a database. They considered three machine learning algorithms for their experiment - Random Forest, k-NN and MLP. However, MLP was rejected due to memory limitation of smartphone.
For the password scenario, Kambourakis et al. achieved the best results using the Random Forest classifier and first data analysis procedure. For the passphrase scenario, k-NN performed better using the second data analysis procedure. For the password scenario, the average FAR%, FRR% and EER% values were 12.5, 39.4 and 26 respectively. For the passphrase scenario, the average FAR%, FRR% and EER% were 23.7, 3.5 and 13.6 respectively. They performed their experiment on a Sony Ericsson Xperia ray. The device had 1 GHz CPU processor, 512 MB RAM, 3.3 inches touchscreen and the Ice Cream Sandwich Android OS. During the classification, 100% of CPU was occupied by the machine learning algorithms. This percentage varied between 91% and 100% at the time of training. The results showed that the first data analysis procedure needed more memory to perform as it generated more data than the second one. Both algorithms were able to perform directly on the device and it took less than one second to authenticate the user.
6.7 Sensor-Enhanced Keystroke Dynamics
Giuffrida et al. [49] proposed a novel keystroke authentication system enhanced with sensor data for authentication of mobile devices. They used novel sensor features to analyze the typing behavior of a user. Machine learning techniques were used to authenticate users and to associate the timing-based keystroke features with movement sensors information. Giuffrida et al. developed UNAGI, a fixed-text authentication system for Android. Their current prototype modified the traditional Android software keyboardand leveraged a number of modules e.g. feature extraction, training and detection. The sensor-enhanced keystroke dynamics techniques were implemented through these support modules. The user had to type a fixed-text password during an authentication session. Their authentication system processed this password for analysis. When the user typed, UNAGI recorded the key-press events and also sampled movement sensor data periodically. They used two Android sensor sampling interfaces: TYPE_LINEAR_ACCELERATION and TYPE_GYROSCOPE. Sensor values were collected at a high sampling frequency. In order to accomplish this, the SENSOR_DELAY_FASTEST flag was specified at sensor listener registration time. The feature extraction module of UNAGI processed the collected data and extracted suitable features. Feaures from the training sessions were fed to the training module to develop a user profile. The detection module compared the features of a testing session against the user profiles for authentication of genuine users. Different techniques were required by sensor-enhanced keystroke dynamics in order to collect keystroke and sensor data. The timestamps of KD and KU events were recorded as keystroke data. Three distinct distributions from the accelerometer and sensor data were sampled to collect sensor data. They recorded KD and KU events only for alphanumeric characters. The keystroke events for all the other characters were ignored. The Android API provided instantaneous sensor values which were used for sampling sensor distributions. For every collected sample, there was a timestamp associated to it.
In UNAGI, a sliding window of specific size was used to compute features from a typed word. Standard statistical metrics were used to select suitable features from the sampled sensor distributions. The movement sensor features considered by UNAGI were - root mean square, number of local maxima and minima, minimal and maximal value, mean delta, sum of negative values, sum of positive values, mean value, mean value during KD and KU events, standard deviation. The keytroke features considered by UNAGI were - KD-KD time, KD-KU time, KU-KD time, KU-KU time. After the feature extraction phase, the output was a vector which consisted of all the features - both keystroke and movement sensor features. In their experiment, threshold-based binary classification algorithms were suitable. Giuffrida et al. used one-class SVM, Naive Bayes, k-Nearest Neighbours (kNN), the "mean algorithm". They also used several distance metrics - Euclidean, Euclidean normed, Manhattan, Manhattan scaled and Mahalanobis. They used their own weighted metrics for their experiment. For testing, the leave-one-out cross validation technique was used. The dataset contained about 40 samples per user. The accuracy for each user was computed separately in the testing phase. The results were summed up at the end of the process. For each user, thresholds of classification were chosen separately based on the training data in order to improve the final accuracy. They tested each classifier on 370 valid user samples and 130000 impostor user samples. Only valid user training samples were used for training. 20 students participated in their experiment. The subjects had to type fixed passwords - 40 times each. A Samsung Nexus S was used for their experiments. For each axis, the sensor sampling frequency was 17Hz. They used two passwords - internet and satellite in order to evaluate UNAGI. If there was any error during the experiments, the current sample was discarded and the subject had to type again. They used three different configurations for evaluation purpose: keystroke data only, sensor data only, and combination of both. Results showed better accuracy with sensor-based features rather than keystroke timing features- i.e., an EER of 0.08% for sensor-based features vs. an EER of 4.97% for keystroke timing features.
6.8 Keystroke Dynamics on Smartphones
In [68], Lee et al. tried to analyze smartphone based keystroke dynamics using a 6-digit pin. Lee et al. used distance-based classification algorithm and extracted two types of smartphone data - motion and keystroke data. The extracted keystroke features included time of events, size of the fingertip, coordinates of the touch point etc. The extracted motion features included accelerometer, rotation, gravity etc. The raw data was collected by typing the 6-digit PIN - "766420". The app was installed on a Nexus 5X. Data was collected from 22 users with 100 samples from each user. One sample contained one time input of 6-digit PIN. They used two algorithms for their experiments - distance-based classification and OCSVM (one-class SVM). In the case of distance-based classification, two scaling methods were used - MinMax scaling and standard scaling. Two distance metrics were used - Euclidean distance and Manhattan distance. The distance-based classification had two results.
-
1.
Adding features from motion data: Lee et al. used five different formulas featuring motion data for their experiment. The best result was achieved using standard scaling and Manhattan distance. The lowest EER was 12.63%. The best result was achieved using only "mean" formula. Lee et al. obtained an EER of 8.94% using only the keystroke data. The EER was decreased by 1.05% to 7.89% when the motion information was introduced.
-
2.
FAR by Gender Match: It was observed from the result that opposite gender’s match had an impact on FAR. Lower FAR was obtained if the gender of a genuine user and the gender of an impostor were different. For male genuine users, the FAR decreased by 4.07% in case of different gender. For female genuine users, the FAR decreased by 0.64% in the case of male impostors.
In the case of one-class support vector machines (OCSVMs), they computed the results for keystroke samples only and after adding motion data. For OCSVM, the EER decreased by 1.24% adding the motion data. In the case of the experiment about gender match using the OCSVM, FAR decreased by 8% for male genuine users and FAR decreased by 6% for the other cases.
6.9 Mobile Keystroke Biometrics
In [23], Buschek, De Luca, and Alt proposed a experiment investigating mobile keystroke biometrics. They compared touch-based features in consideration with three distinct hand postures and tried to evaluate touch-specific features for user authentication. They used two types of typing features.
-
1.
Temporal features: hole time, flight time, up-up times, down-down times etc.
-
2.
Spatial touch-specific features: exact touch locations, offsets, touch jumps, drag, touch area sizes, ellipses axes, touch pressure etc.
They used two types of models - 1) anomaly detectors, 2) classification methods. For this study, data was collected in two sessions with a one week gap between sessions. There were two independent variables - hand posture and password. The dependent variables were keystroke timestamps and touch locations. Three common postures were analyzed in portrait orientation: 1) THUMB - touching the device with the right thumb while holding it in the right hand, 2) TWO-THUMBS - touching the device with both thumbs while holding it in both hands, 3) INDEX FINGER - touching the device with the right index finger while holding it in the left hand. The users were instructed to enter six passwords. The passwords were of two different lengths: 1) 6 characters - monkey, Igur39, 12hsVi; 2) 8 characters - password, Bedufo20, s5mqde3A. The passwords were of three styles: 1) Dictionary word - monkey, password; 2) Pronounceable - Igur39, Bedufo20; 3) Random - 12hsVi, s5mqde3A. A total of 28 users participated in the data collection and the average age of the users was 25.
The users consisted of 20 male and 8 female university students. A Nexus 5 phone was utilized for the data collection. A unique software based keyboard was used to extract the features. Each user participated in two sessions. Each session included data collection from three seperate hand orientations. The participants were instructed to type 6 distinct passwords 20 times using each hand posture. From their analysis it was observed that models achieved better results on data of a single session - the EERs were less than half of the values obtained for data across sessions. In the case of evaluation, classifiers performed better than anomaly detectors (11.7-31.1% lower EERs). EERs increased by 86.3% for different hand postures. Regarding the features, the best spatial feature sets performed better than the best temporal sets. EERs were reduced by 14.3 - 23.5% using the spatial touch features relative to the traditional temporal features. Also EERs were reduced by using spatial touch features instead of pressure features. The combination of spatial and temporal features provided the best results - EERs were reduced by 8.5 - 26.3% relative to the best spatial features, and by 26.4 - 36.8% relative to the best temporal features.
7 Applications of Keystroke Dynamics
Keystroke dynamics research has been ongoing for decades and the main intended application has been security and authentication. The number of applications that rely on input from a computer keyboard is increasing. Computers have become more commonplace in the home, workplace, and academia. People are have become more comfortable with typing on keyboards. In fact, today’s self-taught typists type almost as fast as touch typists [73]. This increase in the number of people that are typing on a keyboard creates additional opportunities to apply keystroke dynamics to domains not previously envisioned. Two publicly available websites for implementing keystroke dynamics are-
-
•
KeyTrac https://www.keytrac.net/en/
- •
The examples mentioned in the following section are examples of domains where fixed-text and free-text Keystroke Dynamic analysis can be applied.
7.1 Security and Authentication
Modern computer systems contain vital user information making it important to ensure the cyber security of computer systems. Authentication via something a user knows (i.e. a password) is no longer to guarantee the secuirty of sensitive data. Sridhar, Vaidya and Yawalkar [106] proposed a keystroke authentication system for intruder detection in secure virtual environments. For this purpose, authentication data from login attempts were stored. Feature sets were extracted from 200 samples of username and password data. Fuzzy Logic algorithms were used in order to develop signatures for each participant. The typing pattern of each participant was compared to the respective signature in order to authenticate the participants. Membership functions of fuzzy logic were implemented for authenticating a participant. For 200 samples, they achieved a FAR of 0.0% and a FRR 0f 0.0% for both Bell MF and Gaussian MF.
7.2 Educational Level Classification
Tsimperidis et al. [117] used keystroke dynamics for the detection of ones level of education. They proposed the randomized radial basis function network which was a novel machine learning model. Their model was capable of identifying the educational level of the user of the keyboard. Their proposed model was the first model leveraging keystroke biometrics for detection of ones education level. Their experiment was performed in two steps. First, free text unrestricted data was collected from the participants for ten months. The second step was developing the R2BN model. The computational time of the R2BN model was much higher. In order to reduce that time, they decreased the size of the dataset without degrading the performance of the model. A filter-based random subfield data condensation approach was proposed. 242 log files were collected from five educational level classes. There were 2800 to 4500 keystrokes in each log file. 162 features were extracted from the data. The data was fed into the R2BN model. This model was developed by the randomized modification of a popular radial basis function neural network (RBFN) proposed by Broomhead and Lowe [22]. The advantage of R2BN model was its speedy convergence and smaller extrapolation errors due to a shallow-learning architecture. This model achieved more than 85% accuracy in the educational level classification task using keystroke dynamics.
7.3 Emotion Detection
Detecting emotions from your counterpart during electronic communications such as email, or chat is often difficult. Written words can be misinterpreted into thinking the other side is angry, or conversely saddened, when in reality, the real emotion behind the discussion is unknown. Determining the emotion associated with the text can lead to improved communications. Feelings such as anger, sadness, disgust, fatigue, joy, fear and indifferent can be assumed from the way a user types [85]. Associating emotions based on the way an individual types can reduce guesswork on the emotional state of the author, and reduce confusion. Such a system can also serve as a warning for users to rethink or delay impulsively sending emails or other messages when angry, preventing regret.
Qi, Jia, and Gao [91] proposed an emotion recognition system based on piezoelectric keystroke dynamics. Piezoelectric materials are able to reflect the force detection sensitivity. Their experiment was simply password entry. They used time and pressure dimension features. For emotion recognition, they utilized the discrete PAD 3dimensional-model. International Affective Digitized Sounds (IADS) (a standardized set of 110 digitalized sounds) was implemented to reveal emotions. In order to measure the amount of emotion induction, they implemented a PAD emotion scale. Their target was to classify 4 emotions - happiness, fear, sadness, disgust. They obtained an accuracy of 78.31% using the Random Forest Classifier. Their proposed approach proved to be a pragmatic one for emotion classification in practical applications.
Nahin et al. [85] tried to identify the emotions of users by analyzing textual patterns of the user’s keystroke dynamics. They considered seven basic emotional classes - anger, guilt, disgust, joy, fear, shame and sadness. They used the categories from the International Survey on Emotion Antecedents and Reactions (ISEAR) [100]. There were two steps in their data collection process. 1) They used Java-based software to collect fixed-text data, 2) An app written in C# was used to collect free-text data. 25 users whose ages were between 15 and 40 years participated in the fixed-text data collection. 45% of the users were female. The users were university students, university teachers and other computer users. They created a log file for each user using their Java-based software. The log file contained all the timing information of key press and key release. Every user had access to the software and was asked to provide data at least once a day for 7 weeks. The users had to type two paragraphs from the novel Alice’s Adventures in Wonderland. The users had to select one of seven emotional states according to their emotional condition at that time after typing the paragraphs. In the case of free-text data collection, the C# based software ran in the background and collected the data. The users did not know about the software and were not disturbed by it. Users were asked to enter their emotional state by the software in every 30 minutes. After data collection, a software program written in C was used for keystroke feature extraction from the log files in order to separate feature files. 19 keystroke features were extracted from the collected data. Nahin et al. used the best seven features for analysis. Weka 3.6.6 was used for training. Nahin et al. developed different models for fixed-text and free-text data. Testing was done using these models. For text pattern analysis, ISEAR dataset was used [99]. In order to determine emotion class from raw text, they used VSM or term vector model [97]. For fixed-text analysis, Weka tool was used [122]. Their collected data were used in order to train and develop models. These models were used to evaluate test datasets. They used these algorithms - simple logistics, SMO, Multilayer Perceptron, Random Tree, J48 and BF Tree. Nahin et al. used these same methods for free-text analysis. They calculated the accuracies of emotion class recognition for both fixed-text and free-text. In the case of VSM, the raw data were used as input. VSM identified the emotional state of a sentence by analyzing the text. In the case of the final result, only those results were considered right which were same for both keystroke dynamics and text pattern analysis. The combined results showed better accuracies than separate results.
7.4 Age, Gender and Demographics Prediction
7.4.1 Predicting Age and Gender
In [89], Pentel used keystroke dynamics and mouse patterns to predict characteristics of the user including gender and age. Pentel collected data from six sources for this study between 2011-2017. To collect mouse movement events, a website that recorded mouse events was leveraged. To collect keystroke data, a key logging system was used which was written in Javascript. On each keypress event three values were recorded -
-
1.
KeyCode,
-
2.
Key press time,
-
3.
Key release time.
The extracted keystroke features were -
-
•
Hold time - mean time between key press and key release of a key,
-
•
Seek time - mean time between previous key release and recent key press,
-
•
n-graph latency - mean time of n consecutive key presses for n-graph,
-
•
Feature Std - standard deviation for the previous features,
-
•
DEL - frequency of corrective keys,
-
•
Correct - number of keystrokes divided by number of characters in final text,
-
•
Time - mean time of all keys.
Pentel used five machine-learning algorithms implemented in java - Logistic regression, Nearest Neighbor, Support Vector Machine, Random Forest, C4.5. In the experiment, Pentel performed the classification of 10-15 years old seperate from the other users in order to - 1) In order to balance groups with less under-sampling, 2) To compare n-graph features based on time with features based on frequency, 3) For juridical purpose. For evaluation 10 fold cross validation was used on all models. Pentel performed the training and validation 10 times. A single f-score value was used to present their results which was calculated by taking the weighted average of both classes’ f-score values. Two sample T-tests were performed between each age group to determine the variation between groups in typing speeds. They computed the results of gender and age based classification. For each classification, the baseline was 0.5. All the results were over baseline. For keyboard features, the best f-score for gender based classification was 0.73 and the best f-score for age based classification was also 0.73. Pentel achieved the best results using Random Forest for keyboard features. However, models trained on mouse features showed better results due to more mouse instances. Significant differences in typing speed were found between different age groups. T-test results showed that typing of the age group 16-29 was faster than other groups. Pentel compared the best time based features with frequency based features of previous studies and there was some overlap between the two sets.
7.4.2 Gender Recognition
Tsimperidis, Arampatzis, and Karakos [116] used keystroke dynamics to determine the gender of a user. They created a new dataset to identify the most useful features for gender recognition. There were three phases in their experiments. During the first phase participants provided free-text data. In the second phase features were selected via a selection algorithm. The features were sorted based on the information they contained. In the third phase, the results obtained by using different algorithms were compared. A free-text keylogger, called "IRecU", was created for data collection. This keylogger was suitable for any Microsoft Windows based devices. The participants had to install "IRecU" on their devices and use the keylogger during their daily activities without any restriction. 75 volunteers provided the log files containing the data. Data was collected over a period of 10 months. The dataset consisted of 248 log files - 125 labeled as "male" and 123 labeled as "female". The size of the log files varied from 170 KB to 271 KB. There was data from 2800 to 4500 keystrokes in the log files. A software application named "ISqueezeU" was developed for feature extraction from the log files. The software application read the text files of the keylogger then computed the average number of keystroke timings - keystroke durations, down-down digraph latencies. Tsimperidis, Arampatzis, and Karakos only considered the keys that appeared at least 5 times and the digraphs that appeared at least 3 times. Over 10000 features were extracted. Due to the number of features an automated selection method was required. The models that they used were - SVM, RF, NB, RBFN, and MLP. In their experiments, they tried to determine the gender of a user only by typing speed. The mean of all digram latencies in each log file was computed as it represented the typing speed of a user. Then they calculated and compared the male and female average values. For males, the average value of all digraph latencies was 373.04 ms and the standard deviation was 135.26 ms. For females, the average value was 375.71 ms and the standard deviation was 116.86 ms. As the values were very close for males and females, recognizing the gender of a user using typing speed was not possible. Keystroke dynamics dataset and several different sets of features were used in order to evaluate the performance of the macine-learning models, namely random forest (RF), support vector machine (SVM), naive Bayes (NB) classifier, multi-layer perceptron (MLP), and radial basis function network (RBFN). The calculated metrics were - 1) the model accuracy (Acc.) , 2) the time complexity (TBM), 3) the F1-score (F1), 4) the ROC index (AUC). The goal was to find out the optimal set of features. They performed numerous experiments on the five models mentioned earlier. Each time they used a variable number of keystroke features. In every case, they used the polynomial kernel as kernel type because of its better performance. Neural networks and SVMs performed better for gender recognition using features of keystroke dynamics. However, RBFN performed even better. They drew three conclusions based on their experimental results.
-
1.
For all models, the highest accuracy was achieved before using the highest number of keystroke dynamics features.
-
2.
In the range of 150-350 features, the five tested models achieved almost constant accuracy.
-
3.
The RBFN model achieved 95.6% prediction accuracy for 350 features which was the highest gender prediction rate using keystroke dynamics.
7.4.3 Predicting Typist Cognition and Demographics
Brizan et al. [21] used stylometry, and "language production" which are features keystroke dynamics in order to recognize the cognition and demographics of a typist. For their task, Brizan et al. used a dataset consisting of 350 users. The dataset contained free-text data. 1013 participants were included in data collection phase for a total of two phases. 838 users participated in a first session, 491 users participated in a second session and 486 users attended both sessions. Each user was provided a unique ID in order to identify them. Demographics of age range, native language, gender, typing style and handedness were collected. Among the users, 41.3% were female and 56.4% were male. English was the native language for 79.7% of users, 17% of users were not native English speakers, 88.3% of users were right-handed and 9.1% of users were left-handed. Brizan et al. also considered whether the users used visual typing (looking at their hands while typing) or touch typing (look at the screen while typing). It was found that 64.7% of users utilized touch typing, while 31.3% of users utilized visual typing. These reports were self-provided, that’s why they were not entirely reliable. A QWERTY keyboard on a Dell desktop was used in each session for data collection. A number of prompts were presented in United States English. In response to each prompt, the user had to type minimum 300 characters. Users responded to between 10 and 12 prompts which were completely different between the two sessions. On average the response of a user consisted of 921 keystrokes. No outlier removal was performed for any valid response. The features that they used were split into 3 categories: stylometry, language production and keystroke dynamics leading to a total of 2381 features. The kesytroke dynamics features that they analyzed were user typing speed, durations and frequency of pauses, pauses before specific keys, the average latency between any two keystrokes, key hold etc. The analyzed stylometric features were linguistic unit lengths, character type, consonant frequency, lexical diversity, lexical density etc. The language production features were - part-of-speech pauses, punctuation pauses, misspelling pauses, revision features, typing burst features etc.
Brizan et al. performed two sets of experiments.
-
•
Cognative Task Prediction - four experiments were performed in order to identify the cognitive task. In experiment 1, the users were divided between training and test sets. In each set, there were 352 distinct users. The training data was provided from the session 1 prompts and the testing data was taken from the session 2. Four classifiers were used to predict the task type - SVM with a Linear Kernel, SVM with an RBF Kernel, Naive Bayes and AdaBoost with single split decision trees Ten-fold cross validation was used on the training data. Different approaches were applied to present cognitive task. Each task was classified individually. Broader classifications were also implemented by splitting the tasks in groups of 2 and groups of 3. Finally a linear regression was implemented. They were able to predict the type of the task for each case. The results showed that the SVM classifier performed better than other classifiers in predicting cognitive task. There was no significant difference due to the selection of kernel - RBF or Linear. From the results, it could be suggested that it was possible to predict the type of the task that a user was performing based on the short analysis of the typing behaviour of that user. The results of the binary classification showed some minor differences between the low cognitive demand versus the high cognative demand.
-
•
Prediction of demography - they performed several experiments in order to predict handedness, gender and native language. They extracted the demographic labels based on self-reports of the users. The experiments were performed on training and test data. They used four classifiers for their experiments - LogicBoost, Naive Bayes, SMO (RBFKernel) and SimpleLogistic. Ten-fold cross validation was used on the training data for tuning hyper-parameters. Unbalanced data was used for one set of experiments - the number of labels of the majority set was much higher. Balanced data was used for another pair of experiments - the number of labels of the majority set was same as that of the minority set. The Simple Logistic classifier performed better than other classifiers for gender classification. The Naive Bayes classifier generated the most promising results for native language and handedness prediction. The demographic prediction results did not vary due to cognitive tasks, the results were consistent across tasks. Prediction results were computed for each answer. They were able to accurately predict all 3 demographics for 55% of the answers. Minimum 2 of the 3 demographics were correctly predicted for 95% of the answers. Among the features, three features were very helpful for gender classification - 1) the timing between punctuation and hitting the spacebar, 2) the timing prior to after function keys, 3) the timing before and after common digraphs. It was observed that non-native English speakers typed slower than native English speakers. Mainly three features were important for primary language prediction - 1) the timing before and after function keys, 2) the timing before and after the "." key, 3) the timing prior and after common digraphs.
7.5 Person Identification and Forensic Investigation
Mondal and Bours [82] proposed three methods in order to identify a person from his/her typing behavior. They proposed pairwise user coupling technique along with different machine learning algorithms. They also tried to analyze person identification via an optimized feature set. For their experiment, they used a novel keystroke dataset. The dataset was gathered from three online exams. There were five essay questions in each exam. The subjects were PACE University undergraduates. They instructed the subjects to type with both hands for the first exam, only the left hand for the second exam, and only the right hand for typing for the third exam. 64 students participated in the data collection. The subjects typed minimum 500 keystrokes on each of the three exams. Mondal and Bours used a subset of data from the first exam as a training set. The remaining data was used for testing. They implemented Pairwise User Coupling (PUC) technique on their dataset using the machine learning classifiers. From their analysis it was observed that PUC with bottom-up tree structure based scheme was the most reliable. Among the classifiers, Decision Tree (DT) was the most reliable one in combination with PUC. The identification accuracy could be improved using Multi-Classifier Fusion (MCF). They achieved an accuracy of 89.7% for normal both hands typing, an accuracy of 36.6% for only left hand typing and an identification accuracy of 50.4% for only right hand typing. They used another dataset [112], [80] in order to validate their keystroke dynamics based method of person identification using PUC. In this dataset there were both free-text and fixed-text data. There were 111 subjects and each participant provided 11 samples on average. There were around 724 keystrokes in each sample. One sample from each subject were used for training and the remaining samples were used for testing. The best accuracy achieved was 78.7%.
Mohlala, Ikuesan, and Venter [79] proposed a method based on keystroke dynamics in order to collect evidence for digital forensic readiness. The main goal was to collect solid keystroke evidence for forensic investigations. Their proposed model consisted of two phases - 1) the pattern development phase and 2) the pattern testing/validation phase. In the development phase, input was collected from the user. The data pre-processing and pattern extraction techniques were applied on the data for the purpose of data development. In the pre-processing phase, input data was collected from a known user. Then data cleaning, feature extraction, class assignment and dataset preparation were performed. They used the output of this phase as the input for the next phase which was the pattern identification phase. In the pattern identification phase, various algorithms were analyzed for the generation of behavioral signatures. In the pattern extraction phase, they extracted a unique behavioral pattern of a user. In the data storage and preservation phase, they stored the extracted pattern in the database. A simple regression model decision process was used for user attribution process. In the application development phase, WEKA machine learning libraries were used for feature classification. The extracted features were - key hold time, down-down time, up-down time, key press pressure, finger area, average hold time, average finger area and average pressure. They used an Android application with a software keyboard for recording raw data. The dataset consisted of 42 users. The users typed fixed password with 51 samples per user. For the experiment process, Mohlala, Ikuesan, and Venter implemented their developed tool on the benchmark dataset [14]. In the pattern development process, 1574 rules were extracted. Each user’s pattern was accurately attributed to the respective user on the test set, except for one user. However, all users were accurately attributed using the attribution mechanism. Based on the results, it was clear that this study could achieve reliable accuracy for user attribution in digital forensics.
7.6 User Authentication for Online Assesments and Examinations
In [29], Chen et al. designed a keystroke dynamics based user authentication system for online assesments and examinations. Their proposed framework was based on edge computing architecture. There were keystroke profiles of the users in the framework. In this study, Chen et al. used four features - hold time (HT), press flight time (FT), HT proportion (HTP) and FT proportion (FTP). There were two parts in the profile for static authentication and continuous authentication respectively. There were four fixed length vector for HT, HTP, FT, FTP in the first part of the profile for static authentication. In the second part of the profile, HT and FT features with corresponding key information were recorded for continuous authentication. In order to perform static keystroke authentication, they used an anomaly detector based on Gaussian model. In the case of continuous keystroke authentication, keystroke events were collected continuously by the framework in order to form a continuous data stream of extracted keystroke timing features. They used sliding window mechanism to process the data stream. For the evaluation purpose, three public datasets were used ([65], [48], [109]). In order to investigate the effectiveness of the framework, Chen et al. used a real-world case of an online examination. In order to verify their basic detector, they used this dataset [65]. Distribution histograms of every dimension of timing features were generated for each user. The results showed that the authentication accuracy could be improved using HTP and FTP features. Also their similarity fusion method performed better than other fusion methods. Chen et al. achieved an EER of 6.62%. In order to evaluate the performance of keystroke static authentication, they used dataset [48] and achieved an EER of 5.71%. EER could be decreased to 4.03% using dynamic user profiles mechanism. In order to evaluate the performance of keystroke continuous authentication, they used dataset [109]. Chen et al. achieved an average EER of 2%. The edge computing architecture was implemented to develop a prototype of online examination system. There were three phases in the online examination system - registration phase, login phase and testing phase. In order to simulate possible security related situations, 27 users participated in the case study. The obtained results for this case study were promising.
7.7 Disease Detection
It is desirable to use Keystroke Dynamics for self-reporting, and self-monitoring for conditions outside of authentication, to include capturing indicators of declining heath. The purpose is to identify and detect changes in typing behavior believed to be the same user, but changes in typing patterns suggest testing for health risks. Parkinson’s Disease is a highly mis-diagnosed, progressing neurodegenerative movement disease, that exhibits a change in motor function over time, which can be measured in the fingers. Research has been conducted for early detection of Parkinson’s Disease by detecting changes in the characteristics of finger movements typed on a keyboard to classify people with Parkinson’s from those without the disease. Patients without Parkinson’s disease were distinguished from those who were diagnosed [4]. It was also theorized that a simpler model to classify keystroke variances can be effective while reducing computing resources and less keystrokes for training, making such detection systems practicable [78].
7.8 Mental Fatigue Detection
Conducting intricate tasks requires attentiveness. Fatigue contributes to errors and mistakes. Long haul truck drivers that have worked long hours, often suffer from an increase in fatigue related accidents. Drivers are now required to comply with Electronic Logging Devices, or ELD, to limit the time on the road in an attempt to reduce accidents. Electronic Log Books is congressionally mandated, and intended to help create a safer work environment for drivers. An ELD synchronizes with a vehicle engine to automatically record driving time, for easier and more accurate hours of service recording. Similar to driving risks, other professions such as surgeons, first responders, and pilots, can also benefit from fatigue detection. However in this case, instead of limiting productivity by time, dangerous levels of fatigue can be detected by the way a user types using Keystroke Dynamics [3].
8 Conclusion
Keystroke dynamics is a very effective form of behavioral biometrics. As its application is still limited, keystroke dynamics is a potential research area. In this paper, we describe about different aspects of keystroke dynamics which can be very helpful for future research on keystroke dynamics. Keystroke dynamics can be a very powerful tool for security and authentication in the current world. The application of kestroke dynamics is cost effective and user friendly. In this survey paper, we mention the latest research works on keystroke dynamics, the advantages and flaws. We describe the benchmark keystroke datasets, the size of the datasets and the results obtainded using those datasets. The state-of-the-art keystroke authentication algorithms are explained with their results. Mainly we focus on three types of algorithms - statistical, machine learning based and deep learning based. We describe the significance of different keystroke data processing techniques like text filtering, data size variation, removing faulty data etc. People are being more used to touch screen and mobile devices, therefore we explain different aspects of keystroke authentication on touch screen and mobile devices. Keystroke dynamics has various applications which are mentioned in this paper. Future researchers can use this paper as a reference for their work on keystroke dynamics.
References
- [1] Alejandro Acien, Aythami Morales, John V Monaco, Ruben Vera-Rodriguez, and Julian Fierrez. Typenet: Deep learning keystroke biometrics. IEEE Transactions on Biometrics, Behavior, and Identity Science, 4(1):57–70, 2021.
- [2] Alejandro Acien, Aythami Morales, Ruben Vera-Rodriguez, and Julian Fierrez. Keystroke mobile authentication: Performance of long-term approaches and fusion with behavioral profiling. In Iberian Conference on Pattern Recognition and Image Analysis, pages 12–24. Springer, 2019.
- [3] Alejandro Acien, Aythami Morales, Ruben Vera-Rodriguez, Julian Fierrez, Ijah Mondesire-Crump, Teresa Arroyo-Gallego, et al. Detection of mental fatigue in the general population: Feasibility study of keystroke dynamics as a real-world biomarker. JMIR Biomedical Engineering, 7(2):e41003, 2022.
- [4] Warwick R Adams. High-accuracy detection of early parkinson’s disease using multiple characteristics of finger movement while typing. PloS one, 12(11):e0188226, 2017.
- [5] Ahmed A Ahmed and Issa Traore. Biometric recognition based on free-text keystroke dynamics. IEEE transactions on cybernetics, 44(4):458–472, 2013.
- [6] Mudhafar M Al-Jarrah. An anomaly detector for keystroke dynamics based on medians vector proximity. Journal of Emerging Trends in Computing and Information Sciences, 3(6):988–993, 2012.
- [7] Noor Mahmood Al-Obaidi and Mudhafar M Al-Jarrah. Statistical keystroke dynamics system on mobile devices for experimental data collection and user authentication. In 2016 9th International Conference on Developments in eSystems Engineering (DeSE), pages 123–129. IEEE, 2016.
- [8] Noor Mahmood Al-Obaidi and Mudhafar M Al-Jarrah. Statistical median-based classifier model for keystroke dynamics on mobile devices. In 2016 Sixth International Conference on Digital Information Processing and Communications (ICDIPC), pages 186–191. IEEE, 2016.
- [9] Md Liakat Ali, John V Monaco, Charles C Tappert, and Meikang Qiu. Keystroke biometric systems for user authentication. Journal of Signal Processing Systems, 86(2):175–190, 2017.
- [10] Md Liakat Ali, Charles C Tappert, Meikang Qiu, and John V Monaco. Authentication and identification methods used in keystroke biometric systems. In 2015 IEEE 17th International Conference on High Performance Computing and Communications, 2015 IEEE 7th International Symposium on Cyberspace Safety and Security, and 2015 IEEE 12th International Conference on Embedded Software and Systems, pages 1424–1429. IEEE, 2015.
- [11] Faisal Alshanketi, Issa Traore, and Ahmed Awad Ahmed. Improving performance and usability in mobile keystroke dynamic biometric authentication. In 2016 IEEE security and privacy workshops (SPW), pages 66–73. IEEE, 2016.
- [12] Arwa Alsultan and Kevin Warwick. Keystroke dynamics authentication: a survey of free-text methods. International Journal of Computer Science Issues (IJCSI), 10(4):1, 2013.
- [13] Arwa Alsultan, Kevin Warwick, and Hong Wei. Non-conventional keystroke dynamics for user authentication. Pattern Recognition Letters, 89:53–59, 2017.
- [14] Margit Antal and László Zsolt Szabó. An evaluation of one-class and two-class classification algorithms for keystroke dynamics authentication on mobile devices. In 2015 20th International Conference on Control Systems and Computer Science, pages 343–350. IEEE, 2015.
- [15] Margit Antal, László Zsolt Szabó, and Izabella László. Keystroke dynamics on android platform. Procedia Technology, 19:820–826, 2015.
- [16] Tanapat Anusas-Amornkul. Strengthening password authentication using keystroke dynamics and smartphone sensors. In Proceedings of the 9th International Conference on Information Communication and Management, pages 70–74, 2019.
- [17] Blaine Ayotte, Mahesh Banavar, Daqing Hou, and Stephanie Schuckers. Fast free-text authentication via instance-based keystroke dynamics. IEEE Transactions on Biometrics, Behavior, and Identity Science, 2(4):377–387, 2020.
- [18] Ned Bakelman, John V Monaco, Sung-Hyuk Cha, and Charles C Tappert. Keystroke biometric studies on password and numeric keypad input. In 2013 European Intelligence and Security Informatics Conference, pages 204–207. IEEE, 2013.
- [19] Yoshua Bengio, Patrice Simard, and Paolo Frasconi. Learning long-term dependencies with gradient descent is difficult. IEEE transactions on neural networks, 5(2):157–166, 1994.
- [20] Paul E. Black. Manhattan distance. Available online at: https://www.nist.gov/dads/HTML/ manhattanDistance.html. Last Accessed: 2019-06-15, 2019.
- [21] David Guy Brizan, Adam Goodkind, Patrick Koch, Kiran Balagani, Vir V Phoha, and Andrew Rosenberg. Utilizing linguistically enhanced keystroke dynamics to predict typist cognition and demographics. International Journal of Human-Computer Studies, 82:57–68, 2015.
- [22] D Broomhead and D Lowe. Multivariable functional interpolation and adaptive networks, complex systems, vol. 2, 1988.
- [23] Daniel Buschek, Alexander De Luca, and Florian Alt. Improving accuracy, applicability and usability of keystroke biometrics on mobile touchscreen devices. In proceedings of the 33rd annual ACM conference on human factors in computing systems, pages 1393–1402, 2015.
- [24] Hayreddin Ceker and Shambhu Upadhyaya. Enhanced recognition of keystroke dynamics using gaussian mixture models. In MILCOM 2015-2015 IEEE Military Communications Conference, pages 1305–1310. IEEE, 2015.
- [25] Hayreddin Çeker and Shambhu Upadhyaya. User authentication with keystroke dynamics in long-text data. In 2016 IEEE 8th International Conference on Biometrics Theory, Applications and Systems (BTAS), pages 1–6. IEEE, 2016.
- [26] Hayreddin Çeker and Shambhu Upadhyaya. Sensitivity analysis in keystroke dynamics using convolutional neural networks. In 2017 IEEE workshop on information forensics and security (WIFS), pages 1–6. IEEE, 2017.
- [27] Hayreddin Çeker and Shambhu Upadhyaya. Transfer learning in long-text keystroke dynamics. In 2017 IEEE International Conference on Identity, Security and Behavior Analysis (ISBA), pages 1–6. IEEE, 2017.
- [28] Han-Chih Chang, Jianwei Li, Ching-Seh Wu, and Mark Stamp. Machine learning and deep learning for fixed-text keystroke dynamics. In Cybersecurity for Artificial Intelligence, pages 309–329. Springer, 2022.
- [29] Zhaohang Chen, Hongming Cai, Lihong Jiang, WenYun Zou, Wendong Zhu, and Xiang Fei. Keystroke dynamics based user authentication and its application in online examination. In 2021 IEEE 24th International Conference on Computer Supported Cooperative Work in Design (CSCWD), pages 649–654. IEEE, 2021.
- [30] Kyunghyun Cho, Bart Van Merriënboer, Caglar Gulcehre, Dzmitry Bahdanau, Fethi Bougares, Holger Schwenk, and Yoshua Bengio. Learning phrase representations using rnn encoder-decoder for statistical machine translation. arXiv preprint arXiv:1406.1078, 2014.
- [31] Kyle R Corpus, Ralph Joseph DL Gonzales, Alvin Scott Morada, and Larry A Vea. Mobile user identification through authentication using keystroke dynamics and accelerometer biometrics. In Proceedings of the International Conference on Mobile Software Engineering and Systems, pages 11–12, 2016.
- [32] Alaa Darabseh and Akbar Siami Namin. Effective user authentications using keystroke dynamics based on feature selections. In 2015 IEEE 14th International Conference on Machine Learning and Applications (ICMLA), pages 307–312. IEEE, 2015.
- [33] Debayan Deb, Arun Ross, Anil K Jain, Kwaku Prakah-Asante, and K Venkatesh Prasad. Actions speak louder than (pass) words: Passive authentication of smartphone* users via deep temporal features. In 2019 international conference on biometrics (ICB), pages 1–8. IEEE, 2019.
- [34] Arthur P Dempster, Nan M Laird, and Donald B Rubin. Maximum likelihood from incomplete data via the em algorithm. Journal of the Royal Statistical Society: Series B (Methodological), 39(1):1–22, 1977.
- [35] Yunbin Deng and Yu Zhong. Keystroke dynamics user authentication based on gaussian mixture model and deep belief nets. International Scholarly Research Notices, 2013, 2013.
- [36] Vivek Dhakal, Anna Maria Feit, Per Ola Kristensson, and Antti Oulasvirta. Observations on typing from 136 million keystrokes. In Proceedings of the 2018 CHI Conference on Human Factors in Computing Systems, pages 1–12, 2018.
- [37] Aleix Dorca Josa. Identifying users using Keystroke Dynamics and contextual information. PhD thesis, Universitat d’Andorra, 2017.
- [38] Mohamad El-Abed, Mostafa Dafer, and Ramzi El Khayat. Rhu keystroke: A mobile-based benchmark for keystroke dynamics systems. In 2014 international carnahan conference on security technology (ICCST), pages 1–4. IEEE, 2014.
- [39] Mohamad El-Abed, Mostafa Dafer, and Christophe Rosenberger. Rhu keystroke touchscreen benchmark. In 2018 international conference on Cyberworlds (CW), pages 363–368. IEEE, 2018.
- [40] Andrew Foresi and Reza Samavi. User authentication using keystroke dynamics via crowdsourcing. In 2019 17th International Conference on Privacy, Security and Trust (PST), pages 1–3. IEEE, 2019.
- [41] Kunihiko Fukushima and Sei Miyake. Neocognitron: A self-organizing neural network model for a mechanism of visual pattern recognition. In Competition and cooperation in neural nets, pages 267–285. Springer, 1982.
- [42] Ashish Garg, Shambhu Upadhyaya, and Kevin Kwiat. A user behavior monitoring and profiling scheme for masquerade detection. In Handbook of Statistics, volume 31, pages 353–379. Elsevier, 2013.
- [43] Prakash Gautam and Pankaj Raj Dawadi. Keystroke biometric system for touch screen text input on android devices optimization of equal error rate based on medians vector proximity. In 2017 11th International Conference on Software, Knowledge, Information Management and Applications (SKIMA), pages 1–7. IEEE, 2017.
- [44] Romain Giot, Bernadette Dorizzi, and Christophe Rosenberger. A review on the public benchmark databases for static keystroke dynamics. Computers & Security, 55:46–61, 2015.
- [45] Romain Giot, Mohamad El-Abed, Baptiste Hemery, and Christophe Rosenberger. Unconstrained keystroke dynamics authentication with shared secret. Computers & security, 30(6-7):427–445, 2011.
- [46] Romain Giot, Mohamad El-Abed, and Christophe Rosenberger. Greyc keystroke: a benchmark for keystroke dynamics biometric systems. In 2009 IEEE 3rd International Conference on Biometrics: Theory, Applications, and Systems, pages 1–6. IEEE, 2009.
- [47] Romain Giot, Mohamad El-Abed, and Christophe Rosenberger. Keystroke dynamics with low constraints svm based passphrase enrollment. In 2009 IEEE 3rd International Conference on Biometrics: Theory, Applications, and Systems, pages 1–6. IEEE, 2009.
- [48] Romain Giot, Mohamad El-Abed, and Christophe Rosenberger. Web-based benchmark for keystroke dynamics biometric systems: A statistical analysis. In 2012 Eighth International Conference on Intelligent Information Hiding and Multimedia Signal Processing, pages 11–15. IEEE, 2012.
- [49] Cristiano Giuffrida, Kamil Majdanik, Mauro Conti, and Herbert Bos. I sensed it was you: authenticating mobile users with sensor-enhanced keystroke dynamics. In International Conference on Detection of Intrusions and Malware, and Vulnerability Assessment, pages 92–111. Springer, 2014.
- [50] Jiuxiang Gu, Zhenhua Wang, Jason Kuen, Lianyang Ma, Amir Shahroudy, Bing Shuai, Ting Liu, Xingxing Wang, Gang Wang, Jianfei Cai, et al. Recent advances in convolutional neural networks. Pattern recognition, 77:354–377, 2018.
- [51] Daniele Gunetti and Claudia Picardi. Keystroke analysis of free text. ACM Transactions on Information and System Security (TISSEC), 8(3):312–347, 2005.
- [52] Norhaslinda Harun, Satnam Singh Dlay, and Wai Lok Woo. Performance of keystroke biometrics authentication system using multilayer perceptron neural network (mlp nn). In 2010 7th International Symposium on Communication Systems, Networks & Digital Signal Processing (CSNDSP 2010), pages 711–714. IEEE, 2010.
- [53] Trevor Hastie and Robert Tibshirani. Classification by pairwise coupling. Advances in neural information processing systems, 10, 1997.
- [54] James J Higgins. An introduction to modern nonparametric statistics. Brooks/Cole Pacific Grove, CA, 2004.
- [55] Jiacang Ho and Dae-Ki Kang. One-class naïve bayes with duration feature ranking for accurate user authentication using keystroke dynamics. Applied Intelligence, 48(6):1547–1564, 2018.
- [56] Sepp Hochreiter and Jürgen Schmidhuber. Long short-term memory. Neural computation, 9(8):1735–1780, 1997.
- [57] Jiankun Hu, Don Gingrich, and Andy Sentosa. A k-nearest neighbor approach for user authentication through biometric keystroke dynamics. In 2008 IEEE International Conference on Communications, pages 1556–1560. IEEE, 2008.
- [58] Jiaju Huang, Daqing Hou, Stephanie Schuckers, and Zhenhao Hou. Effect of data size on performance of free-text keystroke authentication. In IEEE International Conference on Identity, Security and Behavior Analysis (ISBA 2015), pages 1–7. IEEE, 2015.
- [59] Jiaju Huang, Daqing Hou, Stephanie Schuckers, Timothy Law, and Adam Sherwin. Benchmarking keystroke authentication algorithms. In 2017 IEEE Workshop on Information Forensics and Security (WIFS), pages 1–6. IEEE, 2017.
- [60] Jiaju Huang, Daqing Hou, Stephanie Schuckers, and Shambhu Upadhyaya. Effects of text filtering on authentication performance of keystroke biometrics. In 2016 IEEE International Workshop on Information Forensics and Security (WIFS), pages 1–6. IEEE, 2016.
- [61] Elena Ivannikova, Gil David, and Timo Hämäläinen. Anomaly detection approach to keystroke dynamics based user authentication. In 2017 IEEE Symposium on Computers and Communications (ISCC), pages 885–889. IEEE, 2017.
- [62] Georgios Kambourakis, Dimitrios Damopoulos, Dimitrios Papamartzivanos, and Emmanouil Pavlidakis. Introducing touchstroke: keystroke-based authentication system for smartphones. Security and Communication Networks, 9(6):542–554, 2016.
- [63] Kevin Killourhy and Roy Maxion. Keystroke dynamics-benchmark data set. Carnegie-MellonUniversity, http://www. cs. cmu. edu/~ keystroke/# sec2, 2009.
- [64] Kevin Killourhy and Roy Maxion. Why did my detector do that?! In International Workshop on Recent Advances in Intrusion Detection, pages 256–276. Springer, 2010.
- [65] Kevin S Killourhy and Roy A Maxion. Comparing anomaly-detection algorithms for keystroke dynamics. In 2009 IEEE/IFIP International Conference on Dependable Systems & Networks, pages 125–134. IEEE, 2009.
- [66] Paweł Kobojek and Khalid Saeed. Application of recurrent neural networks for user verification based on keystroke dynamics. Journal of telecommunications and information technology, (3):80–90, 2016.
- [67] Sowndarya Krishnamoorthy, Luis Rueda, Sherif Saad, and Haytham Elmiligi. Identification of user behavioral biometrics for authentication using keystroke dynamics and machine learning. In Proceedings of the 2018 2nd International Conference on Biometric Engineering and Applications, pages 50–57, 2018.
- [68] Hyungu Lee, Jung Yeon Hwang, Dong In Kim, Shincheol Lee, Sung-Hoon Lee, and Ji Sun Shin. Understanding keystroke dynamics for smartphone users authentication and keystroke dynamics on smartphones built-in motion sensors. Security and Communication Networks, 2018, 2018.
- [69] John Leggett and Glen Williams. Verifying identity via keystroke characterstics. International Journal of Man-Machine Studies, 28(1):67–76, 1988.
- [70] John Leggett, Glen Williams, Mark Usnick, and Mike Longnecker. Dynamic identity verification via keystroke characteristics. International Journal of Man-Machine Studies, 35(6):859–870, 1991.
- [71] Jianwei Li, Han-Chih Chang, and Mark Stamp. Free-text keystroke dynamics for user authentication. In Cybersecurity for Artificial Intelligence, pages 357–380. Springer, 2022.
- [72] Chu-Hsing Lin, Jung-Chun Liu, and Ken-Yu Lee. On neural networks for biometric authentication based on keystroke dynamics. Sensors and materials, 30(3):385–396, 2018.
- [73] Gordon D Logan, Jana E Ulrich, and Dakota RB Lindsey. Different (key) strokes for different folks: How standard and nonstandard typists balance fitts’ law and hick’s law. Journal of Experimental Psychology: Human Perception and Performance, 42(12):2084, 2016.
- [74] Xiaofeng Lu, Shengfei Zhang, Pan Hui, and Pietro Lio. Continuous authentication by free-text keystroke based on cnn and rnn. Computers & Security, 96:101861, 2020.
- [75] Emanuele Maiorana, Himanka Kalita, and Patrizio Campisi. Mobile keystroke dynamics for biometric recognition: An overview. IET Biometrics, 10(1):1–23, 2021.
- [76] Danilo Mandic and Jonathon Chambers. Recurrent neural networks for prediction: learning algorithms, architectures and stability. Wiley, 2001.
- [77] Denis Migdal and Christophe Rosenberger. Analysis of keystroke dynamics for the generation of synthetic datasets. In 2018 International Conference on Cyberworlds (CW), pages 339–344. IEEE, 2018.
- [78] Antony Milne, Katayoun Farrahi, and Mihalis A Nicolaou. Less is more: Univariate modelling to detect early parkinson’s disease from keystroke dynamics. In International Conference on Discovery Science, pages 435–446. Springer, 2018.
- [79] Martha Mohlala, Adeyemi R Ikuesan, and Hein S Venter. User attribution based on keystroke dynamics in digital forensic readiness process. In 2017 IEEE Conference on Application, Information and Network Security (AINS), pages 124–129. IEEE, 2017.
- [80] John V Monaco, Ned Bakelman, Sung-Hyuk Cha, and Charles C Tappert. Developing a keystroke biometric system for continual authentication of computer users. In 2012 European Intelligence and Security Informatics Conference, pages 210–216. IEEE, 2012.
- [81] John V Monaco, Gonzalo Perez, Charles C Tappert, Patrick Bours, Soumik Mondal, Sudalai Rajkumar, Aythami Morales, Julian Fierrez, and Javier Ortega-Garcia. One-handed keystroke biometric identification competition. In 2015 International Conference on Biometrics (ICB), pages 58–64. IEEE, 2015.
- [82] Soumik Mondal and Patrick Bours. Person identification by keystroke dynamics using pairwise user coupling. IEEE Transactions on Information Forensics and Security, 12(6):1319–1329, 2017.
- [83] Soumik Mondal and Patrick Bours. A study on continuous authentication using a combination of keystroke and mouse biometrics. Neurocomputing, 230:1–22, 2017.
- [84] Christopher Murphy, Jiaju Huang, Daqing Hou, and Stephanie Schuckers. Shared dataset on natural human-computer interaction to support continuous authentication research. In 2017 IEEE International Joint Conference on Biometrics (IJCB), pages 525–530. IEEE, 2017.
- [85] AFM Nazmul Haque Nahin, Jawad Mohammad Alam, Hasan Mahmud, and Kamrul Hasan. Identifying emotion by keystroke dynamics and text pattern analysis. Behaviour & Information Technology, 33(9):987–996, 2014.
- [86] Terry Ngo. Data mining: practical machine learning tools and technique, by ian h. witten, eibe frank, mark a. hell. ACM SIGSOFT Software Engineering Notes, 36(5):51–52, 2011.
- [87] Mehmet Erdal ÖZBEK. Classification performance improvement of keystroke data. In 2019 Innovations in Intelligent Systems and Applications Conference (ASYU), pages 1–4. IEEE, 2019.
- [88] Kseniia Palin, Anna Maria Feit, Sunjun Kim, Per Ola Kristensson, and Antti Oulasvirta. How do people type on mobile devices? observations from a study with 37,000 volunteers. In Proceedings of the 21st International Conference on Human-Computer Interaction with Mobile Devices and Services, pages 1–12, 2019.
- [89] Avar Pentel. Predicting age and gender by keystroke dynamics and mouse patterns. In Adjunct Publication of the 25th Conference on User Modeling, Adaptation and Personalization, pages 381–385, 2017.
- [90] Eduard C Popovici, Liviu A Stancu, Ovidiu G Guta, Stefan C Arseni, and Octavian Fratu. Combined use of pattern recognition algorithms for keystroke-based continuous authentication system. In 2014 10th International Conference on Communications (COMM), pages 1–4. IEEE, 2014.
- [91] Yuqing Qi, Weichen Jia, and Shuo Gao. Emotion recognition based on piezoelectric keystroke dynamics and machine learning. In 2021 IEEE International Conference on Flexible and Printable Sensors and Systems (FLEPS), pages 1–4. IEEE, 2021.
- [92] Sriram Ravindran, Chandan Gautam, and Aruna Tiwari. Keystroke user recognition through extreme learning machine and evolving cluster method. In 2015 IEEE International Conference on Computational Intelligence and Computing Research (ICCIC), pages 1–5. IEEE, 2015.
- [93] Siti Fairuz Nurr Sadikan, Azizul Azhar Ramli, and Mohd Farhan Md Fudzee. A survey paper on keystroke dynamics authentication for current applications. In AIP Conference Proceedings, volume 2173, page 020010. AIP Publishing LLC, 2019.
- [94] Napa Sae-Bae and Nasir Memon. Distinguishability of keystroke dynamic template. PloS one, 17(1):e0261291, 2022.
- [95] Ramzi Saifan, Asma Salem, Dema Zaidan, Andraws Swidan, et al. A survey of behavioral authentication using keystroke dynamics: Touch screens and mobile devices. Journal of Social Sciences (COES&RJ-JSS), 5(1):29–41, 2016.
- [96] Baljit Singh Saini, Navdeep Kaur, and Kamaljit Singh Bhatia. Keystroke dynamics for mobile phones: A survey. Indian Journal of Science and Technology, 9(6):1–8, 2016.
- [97] Gerard Salton, Anita Wong, and Chung-Shu Yang. A vector space model for automatic indexing. Communications of the ACM, 18(11):613–620, 1975.
- [98] Akash Sanghi and YDS Arya. Survey, applications and security of keystroke dynamics for user authentication. International Journal of Computer & Mathematical Sciences (IJCMS), ISSN, pages 2347–8527, 2017.
- [99] Klaus R Scherer and Harald G Wallbott. Evidence for universality and cultural variation of differential emotion response patterning. Journal of personality and social psychology, 66(2):310, 1994.
- [100] KR Scherer and H Wallbott. International survey on emotion antecedents and reactions (isear), 1990.
- [101] Chao Shen, Zhongmin Cai, Xiaohong Guan, Youtian Du, and Roy A Maxion. User authentication through mouse dynamics. IEEE Transactions on Information Forensics and Security, 8(1):16–30, 2012.
- [102] Yong Sheng, Vir V Phoha, and Steven M Rovnyak. A parallel decision tree-based method for user authentication based on keystroke patterns. IEEE Transactions on Systems, Man, and Cybernetics, Part B (Cybernetics), 35(4):826–833, 2005.
- [103] Pranit Shinde, Saideep Shetty, and Mahendra Mehra. Survey of keystroke dynamics as a biometric for static authentication. International Journal of Computer Science and Information Security, 14(4):203, 2016.
- [104] Saurabh Singh et al. Keystroke dynamics for continuous authentication. In 2018 8th International Conference on Cloud Computing, Data Science & Engineering (Confluence), pages 205–208. IEEE, 2018.
- [105] Shivshakti Singh, Aditi Inamdar, Aishwarya Kore, and Aprupa Pawar. Analysis of algorithms for user authentication using keystroke dynamics. In 2020 International Conference on Communication and Signal Processing (ICCSP), pages 0337–0341. IEEE, 2020.
- [106] Mahalaxmi Sridhar, Siddhesh Vaidya, and Piyush Yawalkar. Intrusion detection using keystroke dynamics & fuzzy logic membership functions. In 2015 International Conference on Technologies for Sustainable Development (ICTSD), pages 1–10. IEEE, 2015.
- [107] Valeriu-Daniel Stanciu, Riccardo Spolaor, Mauro Conti, and Cristiano Giuffrida. On the effectiveness of sensor-enhanced keystroke dynamics against statistical attacks. In proceedings of the sixth ACM conference on data and application security and privacy, pages 105–112, 2016.
- [108] Ioannis Stylios, Andreas Skalkos, Spyros Kokolakis, and Maria Karyda. Bioprivacy: Development of a keystroke dynamics continuous authentication system. In European Symposium on Research in Computer Security, pages 158–170. Springer, 2021.
- [109] Yan Sun, Hayreddin Ceker, and Shambhu Upadhyaya. Shared keystroke dataset for continuous authentication. In 2016 IEEE International Workshop on Information Forensics and Security (WIFS), pages 1–6. IEEE, 2016.
- [110] Yan Sun and Shambhu Upadhyaya. Secure and privacy preserving data processing support for active authentication. Information Systems Frontiers, 17(5):1007–1015, 2015.
- [111] Zahid Syed, Sean Banerjee, and Bojan Cukic. Leveraging variations in event sequences in keystroke-dynamics authentication systems. In 2014 IEEE 15th International Symposium on High-Assurance Systems Engineering, pages 9–16. IEEE, 2014.
- [112] Charles C Tappert, Mary Villani, and Sung-Hyuk Cha. Keystroke biometric identification and authentication on long-text input. In Behavioral biometrics for human identification: Intelligent applications, pages 342–367. IGI global, 2010.
- [113] Pin Shen Teh, Andrew Beng Jin Teoh, and Shigang Yue. A survey of keystroke dynamics biometrics. The Scientific World Journal, 2013, 2013.
- [114] Anurag Tewari. Keystroke dynamics based recognition systems using deep learning: A survey. 2022.
- [115] Chee Meng Tey, Payas Gupta, and Debin Gao. I can be you: Questioning the use of keystroke dynamics as biometrics. 2013.
- [116] Ioannis Tsimperidis, Avi Arampatzis, and Alexandros Karakos. Keystroke dynamics features for gender recognition. Digital Investigation, 24:4–10, 2018.
- [117] Ioannis Tsimperidis, Paul D Yoo, Kamal Taha, Alexios Mylonas, and Vasilis Katos. R 2 bn: An adaptive model for keystroke-dynamics-based educational level classification. IEEE Transactions on Cybernetics, 50(2):525–535, 2018.
- [118] Esra Vural, Jiaju Huang, Daqing Hou, and Stephanie Schuckers. Shared research dataset to support development of keystroke authentication. In IEEE International joint conference on biometrics, pages 1–8. IEEE, 2014.
- [119] Ahmed Anu Wahab and Daqing Hou. A user study of keystroke dynamics as second factor in web mfa. In Proceedings of the Thirteenth ACM Conference on Data and Application Security and Privacy, pages 236–241, 2023.
- [120] Ahmed Anu Wahab, Daqing Hou, Mahesh Banavar, Stephanie Schuckers, Kenneth Eaton, Jacob Baldwin, and Robert Wright. Shared multi-keyboard and bilingual datasets to support keystroke dynamics research. In Proceedings of the Twelveth ACM Conference on Data and Application Security and Privacy, pages 236–241, 2022.
- [121] Ahmed Anu Wahab, Daqing Hou, Stephanie Schuckers, and Abbie Barbir. Utilizing keystroke dynamics as additional security measure to protect account recovery mechanism. In ICISSP, pages 33–42, 2021.
- [122] Ian H Witten, Eibe Frank, Mark A Hall, Christopher J Pal, and MINING DATA. Practical machine learning tools and techniques. In DATA MINING, volume 2, page 4, 2005.
- [123] Changsheng Wu, Wenbo Ding, Ruiyuan Liu, Jiyu Wang, Aurelia C Wang, Jie Wang, Shengming Li, Yunlong Zi, and Zhong Lin Wang. Keystroke dynamics enabled authentication and identification using triboelectric nanogenerator array. Materials Today, 21(3):216–222, 2018.
- [124] Lu Xiaofeng, Zhang Shengfei, and Yi Shengwei. Continuous authentication by free-text keystroke based on cnn plus rnn. Procedia computer science, 147:314–318, 2019.
- [125] Nan Zheng, Aaron Paloski, and Haining Wang. An efficient user verification system via mouse movements. In Proceedings of the 18th ACM conference on Computer and communications security, pages 139–150, 2011.
- [126] Yu Zhong and Yunbin Deng. A survey on keystroke dynamics biometrics: approaches, advances, and evaluations. Recent Advances in User Authentication Using Keystroke Dynamics Biometrics, (1):1–22, 2015.
- [127] Yu Zhong, Yunbin Deng, and Anil K Jain. Keystroke dynamics for user authentication. In 2012 IEEE computer society conference on computer vision and pattern recognition workshops, pages 117–123. IEEE, 2012.