Modulation of the Blazhko Cycle in LS Her
Abstract
We present analysis of the RR Lyrae star, LS Her and confirm the previously reported modulation to its Blazhko cycles. We performed Fourier analysis on two sectors (Sector 24 & 25) of data from the Transiting Exoplanet Survey Satellite (TESS) spanning 53 days. We find LS Her to have a primary pulsation period of 0.2308 d and a Blazhko period of 12.7 d in keeping with previously reported results. We also identified side-band frequencies around the Blazhko multiplets suggesting the Blazhko cycle is modulated on a time scale of 112 days. Analysis of the Blazhko effect using the TESS data clearly shows a changing amplitude and phase throughout the four Blazhko cycles. We compared our modeled results, which were based on our TESS frequency analysis, to TESS data (Sector 51) taken 700 days later and found our modulation model was not a good representation of the data. We then coupled our TESS analysis with the modulation frequency results from Wils et al. (2008) and found excellent agreement with the Sector 51 data. To further test this result we obtained ground-based, V-magnitude observations of LS Her in the summer of 2022. This data also showed excellent agreement with our coupled modulation model. We have verified that LS Her is a Blazhko star with a modulated Blazhko period of 109 days, stability over the 862 days of observations, and possible stability lasting over 15 years. We discuss the ramifications of the modulation for other Blazhko stars that show Blazhko effect changes over time.
1 Introduction
The Blazhko effect (BE) in the radial pulsating RR Lyrae (RRL) stars was first recognized over a century ago by Sergey Blazhko (1907). The effect can often be seen in lightcurve data as a cyclic variation in the amplitude and/or phase of the radial pulsation. It can also be detected in the frequency spectrum as multiplet peaks on either side of the primary pulsation frequency peak as well as the lower order harmonics. The frequency separation between these side-bands and the primary frequency is the Blazhko frequency, which can have periods as small as a few days or as long as several years. The beating between the primary and Blazhko frequencies results in a modulation of the lightcurve, which causes cyclic changes to the pulsation amplitude and/or phase.
The cause of the BE remains unknown, although the non-linear mode resonance model (Buchler & Kolláth, 2011; Kolláth, 2018) is seen as a current, favored hypothesis. There remains no hydrodynamic simulation that can successfully model this effect.
In recent years, instability in the BE has been identified in some Blazhko stars, which result in changes to the Blazhko period (BP) and amplitude over time. For these stars, the BE modulates the individual radial pulsations, but the BE itself is not always stable across many Blazhko cycles. It is currently unclear whether the BE changes are irregular or periodically modulated by an even longer modulation period (MP). Understanding these changes to the BE is important to help constrain both internal and external effects that may play a role in the BE phenomenon.
In the past, there have been a number of Blazhko stars found to change their Blazhko period and amplitude over time spans much longer than their BPs. Detre & Szeidl (1973) found that the star, RR Lyrae, has a changing Blazhko period and amplitude that seems to occur on a 4 year cycle. Further research by Kolenberg et al. (2006) also found changes in RR Lyrae’s BP, suggesting that the BE is possibly being modulated on this 4 year cycle. However, Le Borgne et al. (2014) found the 4-year modulation is not consistent with changes seen from Kepler data. The authors find a decline in the BE over 5 years but not the 4-year modulation.
The RRc variable, TV Boo, was found to have modulated Blazhko changes with a period of 21.5 days (Skarka & Zejda, 2013) while XZ Cyg was found to have Blazhko period and amplitude changes on the order of a decade (LaCluyzé et al., 2004). There are also clear Blazhko changes found in RRL stars in the globular cluster M3 (Jurcsik et al., 2012), where previously known Blazhko stars have become non-Blazhko variables.
Wils et al. (2008) discovered a modulated BE in a first over-tone pulsating, RRc star, LS Herculis. The authors found LS Her to be a very short period variable star (P = 0.232 d) with a short BP = 12.75 days. Wils et al. observed this star for 63 nights over a span of six months in 2007. Their analysis found equally spaced side-bands around the Blazhko side-bands, indicating that the BE itself was being modulated. This modulation period was found to be MP = 109 d.
Note that many papers exploring the BE use the term “modulated Blazhko effect” to clarify that the BE is modulating the primary pulsation. For the rest of this paper we will refer to modulation in terms of changes to the BE itself.
In Section 2 we present the frequency analysis of two Transiting Exoplanet Survey Satellite (TESS, Ricker et al., 2015) sectors for LS Her. In Section 3 we construct a model lightcurve using the modulation frequencies from Wils et al. and compare this model to the TESS data from Sector 51. Section 4 compares our recent ground-based observations from the Silesian University Technology Observatories (SUTO) to that of our modeled lightcurve and Section 5 is a discussion on ramifications of our findings.
2 TESS data analysis
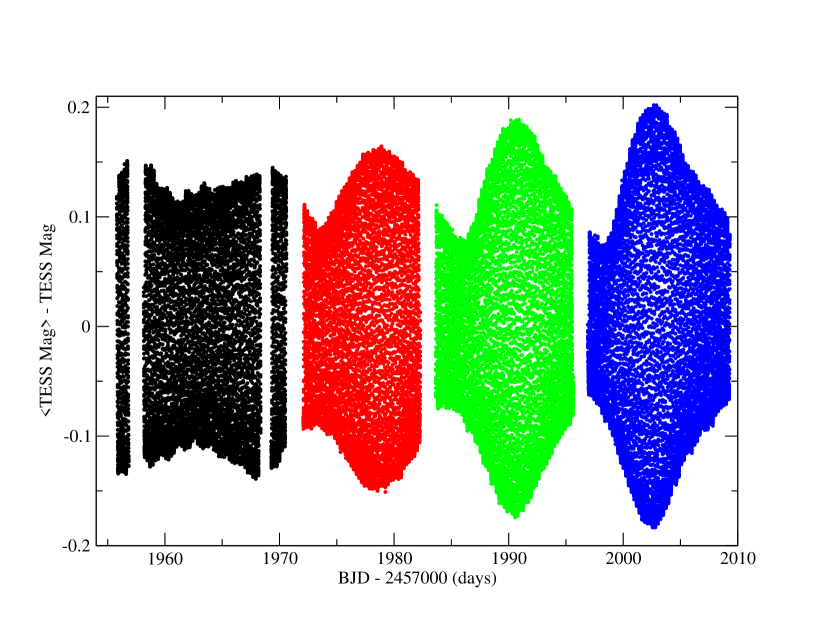
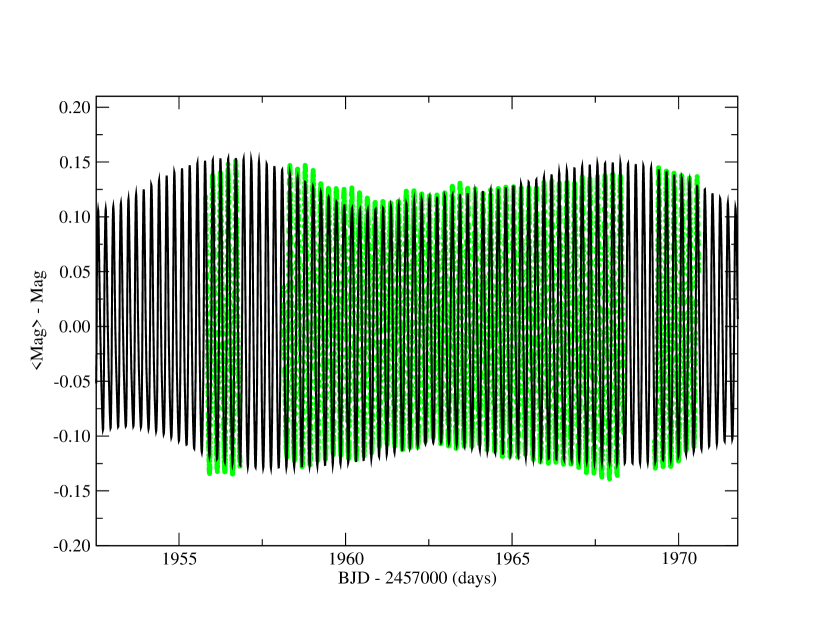
LS Her has been observed three times with the TESS 2-minute integration program. TESS Sectors 24 (April 16, 2020 to May 13, 2020) and 25 (May 13, 2020 to June 8, 2020) were observed back-to-back giving nearly continuous observations for a time span of 53 days. It was later observed in Sector 51 (April 22, 2022 to May 18, 2022) as part of the approved Guest Investigator Program #G04184 (submitted by Carrell). All the TESS data used in this paper can be found in MAST: http://dx.doi.org/10.17909/svrw-cn60 (catalog 10.17909/svrw-cn60). The lightcurve for Sectors 24 & 25 can be seen in Figure 1, where the time axis is in TESS Barycentric Julian Date (BJD). There are several clearly recognizable characteristics of this data. First, cyclic changes in the pulsation amplitude as a function of time validates the classification of LS Her as a Blazhko variable. Second, the Blazhko amplitude appears to grow as a function of time, corroborating the findings of Wils et al. (2008), that this star experiences a BE which itself is being modulated. Finally, from the first orbit data (black) of Sector 24 it appears that during some portions of the modulation, the Blazhko amplitude is severely damped, with the difference between B and B becoming only a small fraction of what is seen in later Blazhko cycles.
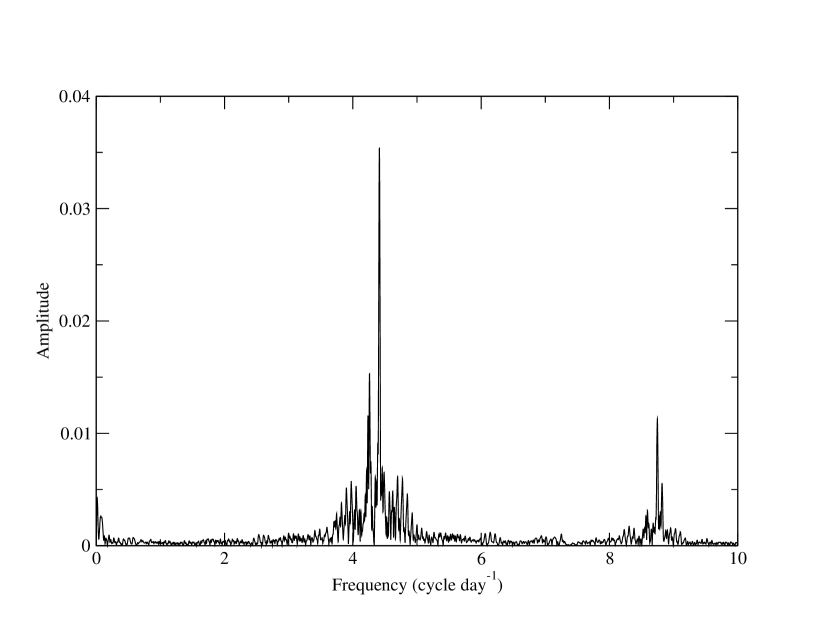
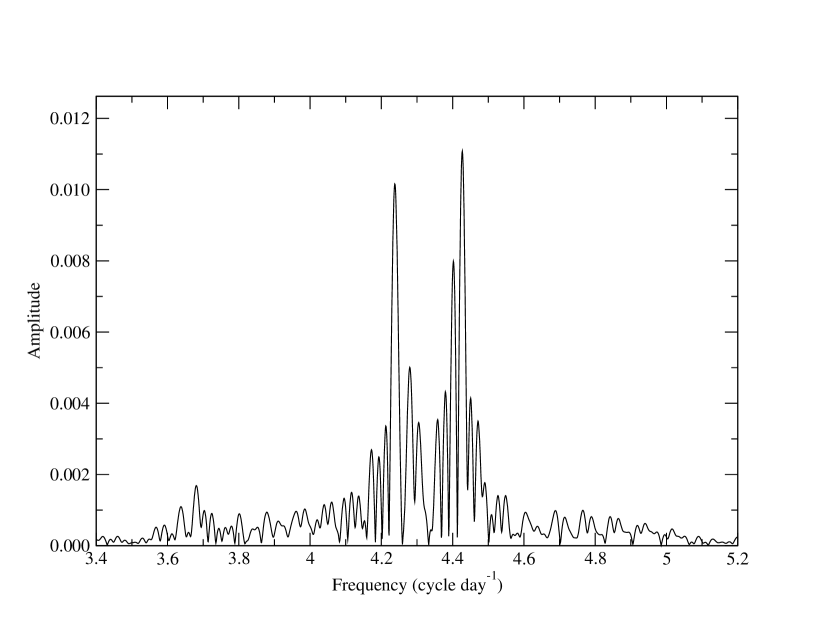
We used Period04 (Lenz & Breger, 2005) to analyze the Sector 24 & 25 data. In order to place all the data on a consistent scale, we normalized on a by-orbit basis to the overall flux average. After converting the normalized flux values to magnitudes, we subtract the mean magnitude to put the average magnitude at zero. Using Period04, we find the primary pulsation frequency to be virtually the same as Wils et al. with F0 = 4.3326 c d-1. The left panel in Figure 2 shows the Fourier spectrum after pre-whitening the primary and significant harmonics. Side-bands are clearly present around the primary frequency and the 2nd harmonic. The right panel shows the frequencies remaining after pre-whittening the primary Blazhko frequencies. These peaks correspond to the modulation peaks found by Wils et al. Table 1 lists the frequencies, amplitudes and phases we found for all peaks with S/N 8. Although there are still some frequency peaks remaining that would be considered significant, beyond the lines in the table, Period04 was not able to converge on a solution. We note that the F frequencies are significant but of unknown origin.
Along with our agreement for the primary pulsation frequency, the next three harmonics also agree with Wils et al. to within the uncertainty. Wils et al. found Blazhko triplets around the primary and 2nd harmonic and one side-band around the 3rd harmonic. From these, they find a BP of 12.75 0.02 d. We identified triplets around the first four harmonics (F) which gave us a BP of 12.69 0.30 d, very close to their determination. We were unable to clearly identify the modulation triplets from the TESS data but we were able to identify several modulation peaks (F) that are very close to the Wils et al. values. Our determination of the MP was 112.3 5.6 d, compared to their value of 109 4 d. We expect that our much shorter baseline of 53 days results in blending of the frequency peaks making the TESS data results more uncertain, particularly since our data covers less than 50% of the MP.
| Identification | Frequency | Amplitude | ||
|---|---|---|---|---|
| (c d-1) | (mmag) | |||
| F0 | 4\@alignment@align.3326 | 116.11 | 0\@alignment@align.435 | |
| 2F0 | 8\@alignment@align.6653 | 12.57 | 0\@alignment@align.119 | |
| 3F0 | 12\@alignment@align.9980 | 4.55 | 0\@alignment@align.235 | |
| 4F0 | 17\@alignment@align.3306 | 2.49 | 0\@alignment@align.931 | |
| 5F0 | 21\@alignment@align.6632 | 1.27 | 0\@alignment@align.913 | |
| F0 + F | 4\@alignment@align.4126 | 40.53 | 0\@alignment@align.259 | |
| F0 - F | 4\@alignment@align.2544 | 26.57 | 0\@alignment@align.891 | |
| F0 + F + F | 4\@alignment@align.4198 | 21.01 | 0\@alignment@align.763 | |
| F0 - F - F | 4\@alignment@align.2446 | 20.11 | 0\@alignment@align.676 | |
| F0 - F + F | 4\@alignment@align.2645 | 6.78 | 0\@alignment@align.127 | |
| 2F0 + F | 8\@alignment@align.7452 | 9.54 | 0\@alignment@align.532 | |
| 2F0 - F | 8\@alignment@align.5910 | 3.91 | 0\@alignment@align.353 | |
| 2F0 + F + F | 8\@alignment@align.7537 | 4.59 | 0\@alignment@align.409 | |
| 2F0 + 2F | 8\@alignment@align.8223 | 4.06 | 0\@alignment@align.097 | |
| 2F0 - F - 2F | 8\@alignment@align.5716 | 2.30 | 0\@alignment@align.193 | |
| 3F0 + F | 13\@alignment@align.0794 | 2.34 | 0\@alignment@align.736 | |
| 3F0 - F | 12\@alignment@align.9007 | 0.96 | 0\@alignment@align.922 | |
| 3F0 - 2F | 12\@alignment@align.8423 | 1.36 | 0\@alignment@align.342 | |
| 3F0 + 2F | 13\@alignment@align.1545 | 0.81 | 0\@alignment@align.131 | |
| 4F0 + F | 17\@alignment@align.4115 | 1.34 | 0\@alignment@align.439 | |
| 4F0 - 2F | 17\@alignment@align.1741 | 1.55 | 0\@alignment@align.518 | |
| F | 0\@alignment@align.0830 | 4.80 | 0\@alignment@align.527 | |
| 2F | 0\@alignment@align.1617 | 1.21 | 0\@alignment@align.942 | |
| F | 0\@alignment@align.1504 | 1.74 | 0\@alignment@align.692 | |
| F | 3\@alignment@align.6780 | 1.40 | 0\@alignment@align.647 | |
| F | 3\@alignment@align.6389 | 0.97 | 0\@alignment@align.450 | |
| 2F | 7\@alignment@align.2517 | 0.87 | 0\@alignment@align.879 | |
To test our results, we made use of the more recent TESS data from Sector 51. This data was taken approximately 700 days after the end of our modeled TESS data. A comparison of the extrapolated model and the Sector 51 data can be seen in Figure 3. The comparison is less than satisfactory with the Sector 51 data being shifted by several days compared to the model lightcurve. Also, the modulation envelope shape is very different from the TESS data, particularly for orbit 2, where the data shows a declining Blazhko amplitude instead of the increase seen in the model. Under the assumption that the MP has been constant over the 700 days, we conclude that our model is not able to fully capture the modulation effect. This is likely caused by the blending of some frequency peaks due to the relatively short baseline of observations. In the upcoming sections we will show that the Wils et al. modulation measurements are superior to the measurements of our TESS data sample.
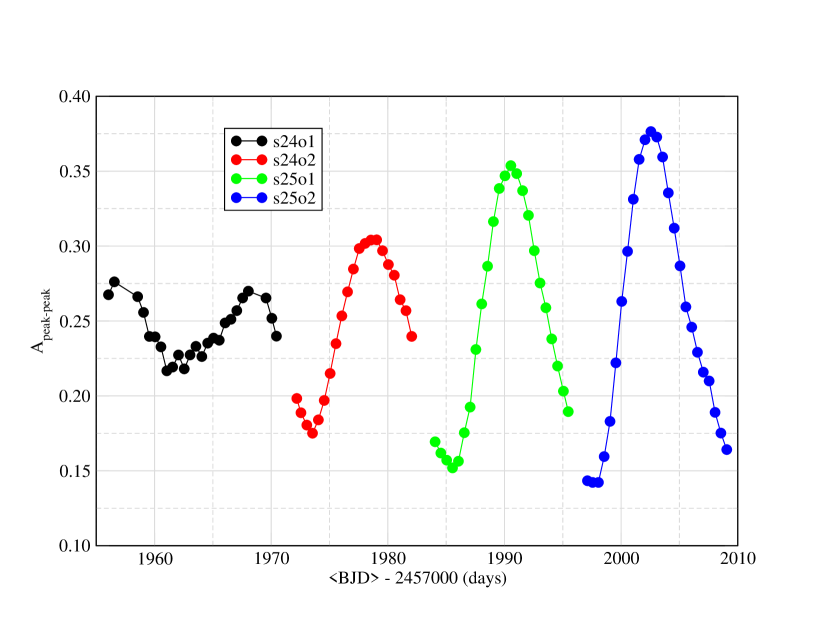
To further analyze the LS Her lightcurve, we used the results from Sectors 24 & 25 to produce a phased lightcurve. The final phased data was then divided into time segments of 0.5 d. Given that the pulsation period of LS Her is P 0.231 d, each sub-group contained just over two full pulsation cycles. We used the Period04 average data binning feature to fit a curve to the phase data for each of these sub-groups. We set the binning to 20 ( = 0.05), which was able to represent the light curve well and still provide 18 data points per bin over which to average. Although LS Her is a Blazhko star with changing amplitude, the combining of consecutive pulsation cycles resulted in an insignificant scatter of a few millimags to the fit. We determined the value of maximum and minimum from the fit of each sub-group and produced a corresponding peak-to-peak amplitude. The result can be seen in Figure 4 where the data are color coded by sector and orbit. The BP is very similar to the TESS orbital period, resulting in nearly four full Blazhko cycles. It is clear in the figure that the Blazhko amplitude is changing from one Blazhko cycle to the next. The difference between Blazhko maximum and minimum in the Sector 24, orbit 1 (s24o1) data is only about 5% while four cycles later the change is closer to 22%. The shape of each Blazhko cycle is also changing as the amplitude grows, going from a shallow to much steeper slope from s24o1 to s25o2.
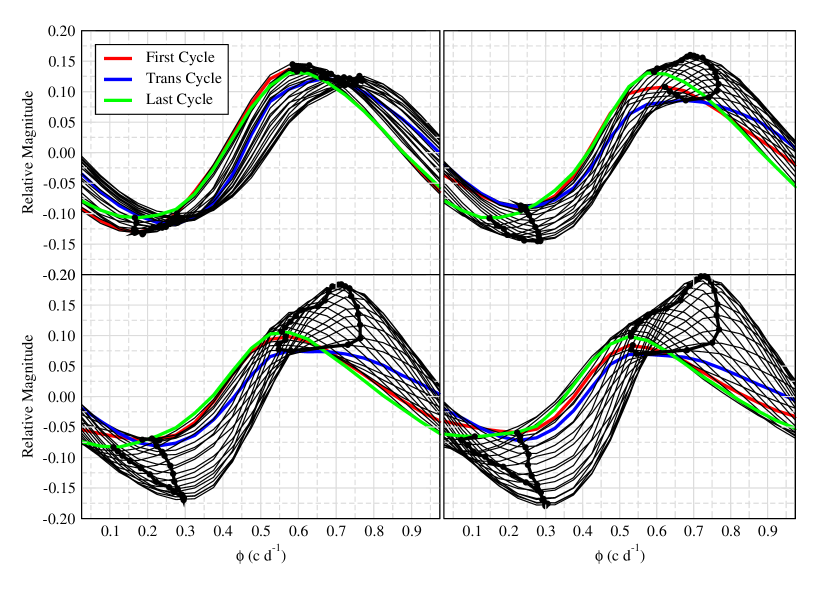
Figure 5 shows the pulsation phase for the sub-group fits from each orbit. The red line represents the first sub-group and the green line the final for each orbit. The maximum and minimum values are plotted and the looping black line shows the variation in amplitude as a function of phase. Comparing the graphs in Figure 5 it is easy to see a transition in lightcurve shape from one Blazhko cycle to the next. In particular, we see that the Sector 25 sub-groups are nearly sinusoidal at Blazhko minimum with a much steeper rise at Blazhko maximum.
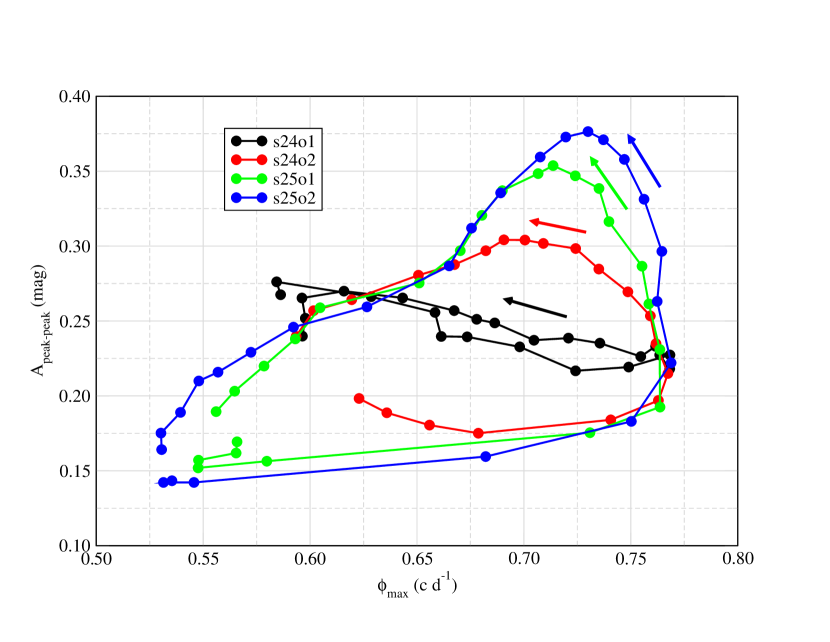
Figure 6 is the corresponding phase-amplitude plot. For all orbits the circulation is found to be counter-clockwise. The changing shape of the phase-amplitude plot is driven primarily by the shifting of the maximum from the hump at = 0.55 to the new peak near = 0.75. This occurs very rapidly during the build-up to Blazhko maximum but much more slowly during the decline. This effect can be seen in the Sector 25 data in Figure 5, where the blue line indicates the final sub-group before the occurrence of the peak shift. We note that the amount of phase shift for s24o1 and s24o2 is nearly the same, although the amplitude changes are quite different. It seems that the modulation of s24o1 has suppressed the peak at = 0.75 throughout the Blazhko cycle.
The overall changes seen in Figures 5 and 6 show characteristics that are very similar to Figures 3 and 4 from the Skarka & Zejda (2013) paper on the changing BE of the RRc variable, TV Boo. Although TV Boo has much smaller amplitude changes than LS Her, the same type of shift in phase, due to shifting maximum peaks, can be seen. TV Boo also has a very short BP of 9.7 d and an MP = 21.5 d, with possibly other, longer modulations that may be on the order of years. These shared characteristics suggest that LS Her is not an anomaly, but may represent one of a class of modulated Blazhko stars.
3 Comparison to Wils et al. results
Due to our inability to fully measure the modulation frequencies in the TESS data, we decided instead to model the frequency results measured by Wils et al. to see if we could validate their results.
To build a model using the frequencies of Wils et al., we analyzed the TESS lightcurves from s24o2 and the full Sector 25, using Period04. The data was pre-whitened by removing the primary frequency and its significant harmonics. We then used the Blazhko and modulation triplet frequencies reported by Wils in Table 3 of that paper for the primary and second harmonics. The Fourier series was computed and improved by fitting the amplitude and phase values while holding the frequencies constant. We then output the resultant Fourier series to serve as our comparison model.
We excluded s24o1 in making our model in order to use it to test if the Wils et al. modulation frequencies would be able to reproduce the severely damped Blazhko amplitude found in s24o1.
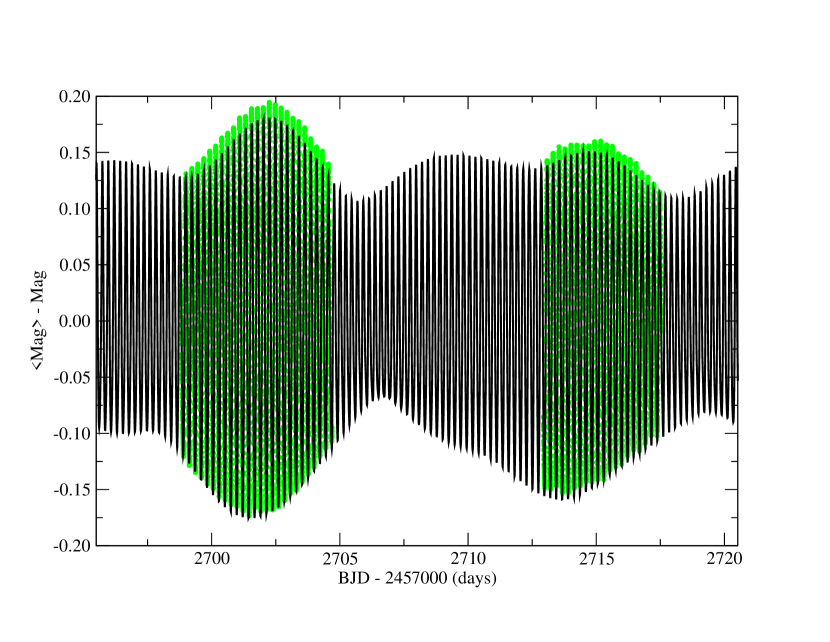
The upper panel of Figure 7 shows the model fit compared to the lightcurve data. Although there are a few small departures of about 2%, overall the model is a good representation of the data. In the lower panel of Figure 7, we compare our model data to s24o1, which was not fit to produce the model. We see that the model predicts a very damped BE, as seen in the data, again with a few small departures. Finally, we extrapolated the model data to Sector 51, which was taken approximately 700 days later. Figure 8 shows that the TESS data (green) is well represented by the Wils modeled data (black). The small variation at maximum light is only a few percent departure from the model data. Figure 8 is in striking contrast to the model comparison in Figure 3. Not only does the Blazhko maximum occur at the correct time, but the overall shape of the modulation matches the Sector 51 data remarkably well. We find this match to be strong evidence that the modulation frequencies and overall MP, as found in Wils et al., to be both accurate and stable over nearly 7 modulation cycles.
4 Ground-based Observations
In July and August of 2022 we conducted additional ground based observations of LS Her in the Johnson-Cousins V-band. The initial goal of these observations was to verify the damped nature of the Blazhko cycle as seen in s24o1. The observations also provided further testing of the modulation effect by extending an additional 100 days beyond TESS Sector 51.
Four nights of observations were conducted in July 2022 at the MacAdam Student Observatory located on the campus of the University of Kentucky. The data were taken with the 0.5-meter PlaneWave telescope and SBIG STXL-6303 research-grade CCD camera with Johnson-Cousins V and I filters. Reduction and differential photometry was completed using the software package AstroImageJ (Collins et al., 2017), and five reference stars with published V and I photometry.
A total of 18 nights of observations were taken in August 2022 using the robotic telescope of the SUTO research group111www.suto.aei.polsl.pl located in Otivar, Spain (36∘48’59.99” N 3∘40’59.99” W). The Newtonian ASA 12” optical tube, mounted on a Paramount ME, and installed in a ScopeDome 3m automatic dome, is operated remotely from the Silesian University of Technology (Gliwice, Poland). The observations were made using a ZWO ASI1600MM cooled CMOS camera (46563520 pixels, 3.8m pixel), which covers a field of view of 53’40’ at a pixel scale of 0.685”. The standard image calibration, dark, and flat corrections were made using AstroImageJ. The custom photometric pipeline developed by the SUTO group implements classic aperture photometry using publicly available Python libraries, mainly astropy (Astropy Collaboration et al., 2022) and PhotometryPipeline222https://github.com/mommermi/photometrypipeline/blob/master/doc/index.rst.
To test the modulation model from the TESS data it was necessary to scale the model from the TESS magnitude system to that of the V-magnitudes. We made use of the I observations from MacAdam Observatory to set the scale between the V and I measurements. We found throughout the pulsation period that I = 0.561V. The TESS filter is broader than I, but is centered on this wavelength region. We decided to use the above factor to scale the TESS model data.
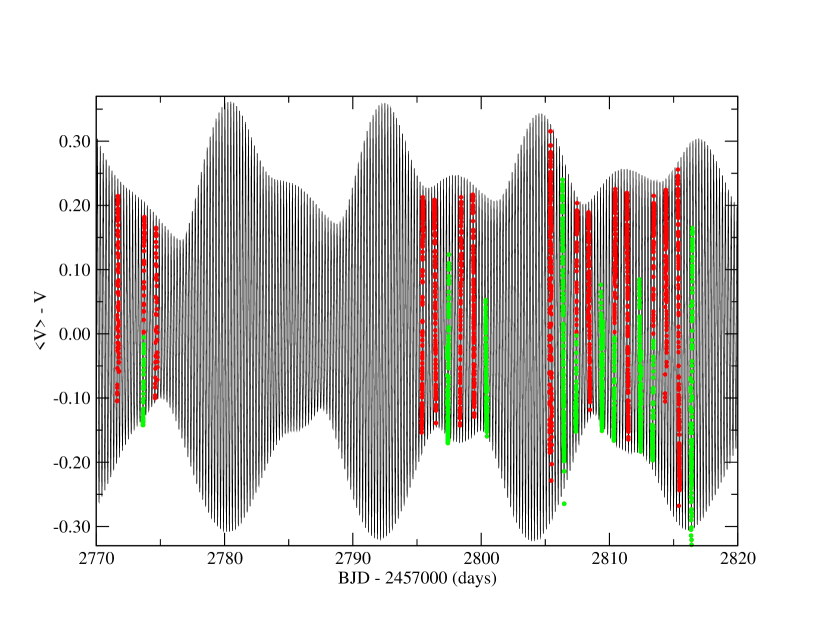
Figure 9 shows the comparison of the scaled model to the V-band data. The red data shows pulsation cycles that include the pulsation maximum while the green includes the pulsation minimum. The data which covered the minimum pulsation phase match the model data very well. We see a few percent difference between the model and data maximum, which we expect is related to our scale factor. In general, however, the V-band data does appear to change in accordance with the modulation model. Our data did not fully cover a Blazhko maximum, but for the most part fell in between the maximum peaks as indicated by the model data. This illustrates the difficulty in establishing a good representation of the modulated BE from a limited ground-based data set. Although we observed for a time span that is greater than the Blazhko period, the combination of declining Blazhko amplitude and increasing secondary maximum mediates the overall amplitude change. Taken alone, the result from our V-data shows a very limited BE that does not fully represent the range of Blazhko cycles. We will discuss the possible ramifications of this in the following section.
5 Discussion
From our analysis we can conclude that the findings of Wils et al. (2008) have been validated. We find close agreement on the primary frequency and the BP for LS Her. The MP of 109 d is also confirmed by our comparison to TESS and V-magnitude data, spanning 862 days. Because we used the frequencies that Wils et al. found in their data from 2007, we can also conclude that the modulation to the BE has very likely been stable over a period of 15 years. This indicates that the modulation of the BE can, at least in some stars, be surprisingly stable.
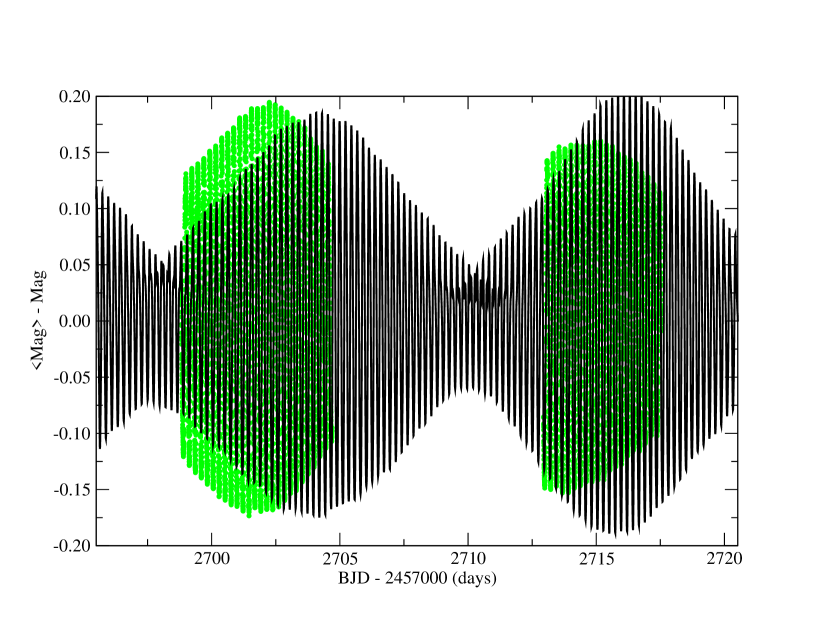
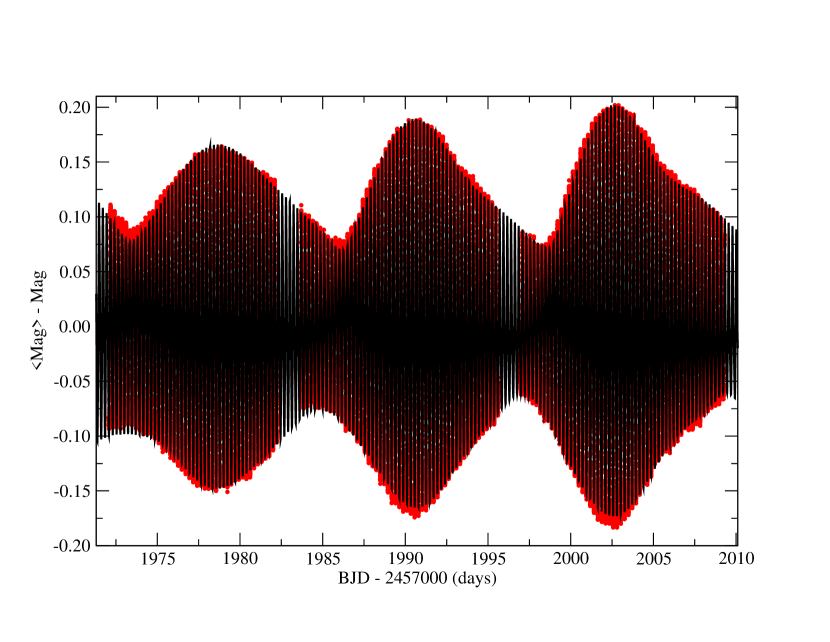
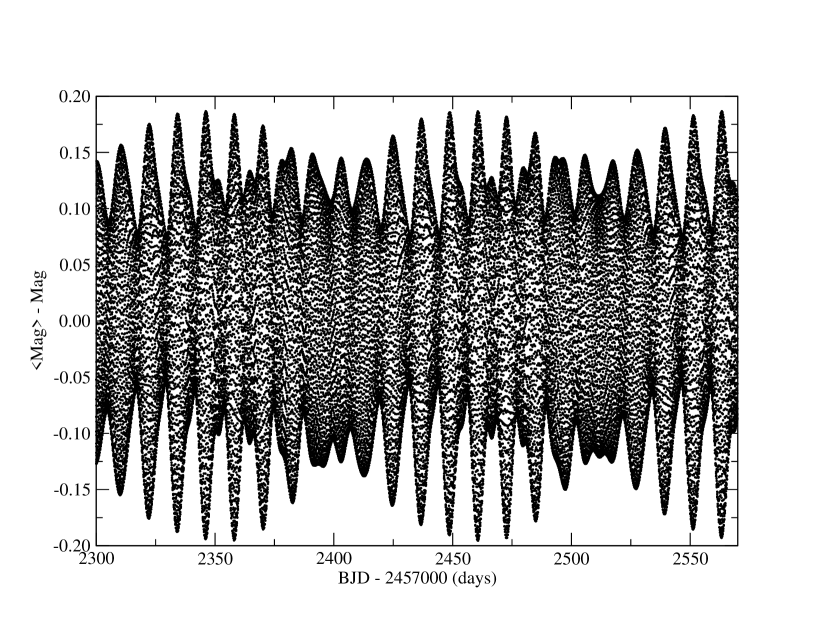
The exceptionally good representation of the model data allows us to examine the modulation effect in more detail. The BE goes through large and repeated variations across the time span of our data. Figure 10 shows how the modeled Blazhko cycles can look fairly normal with a growing amplitude for several Blazhko cycles followed by a span of 3 Blazhko cycles where destructive interference minimizes the BE. During the destructive interference phase, the difference between the maximum Blazhko amplitude and minimum Blazhko amplitude is decreased by as much as 80% of the constructive phase. This effect can be readily seen in the TESS s24o1 data (Figure 1) where the destructive phase is ending and leading into a new rising constructive phase. In the V-data of Figure 9, we see the declining BE with the final observations close to the destructive phase. Depending on the time period of observation, it is possible to obtain greatly reduced amplitude variations, a more normal BE, or a confused pattern of nearly constant amplitudes mixed with large amplitudes. This can particularly affect sparse, ground-based observations that have not fully sampled the modulation cycle.
It is known that some RRLs which have strong amplitude BEs can be observed in other years to be normal RRL pulsators (e.g., Jurcsik et al., 2012). If observations happen to be conducted during a destructive Blazhko modulation phase, then it would be expected that changes in amplitude will be minimized. This modulation effect might be difficult to detect in many Blazhko stars, particularly the longer period RRab stars. LS Her has a very short BP of 12.75 d, and this is only about 12% of the modulation period of 109 d. If we scale the LS Her data to a star with a BP = 50 d, the MP is of order 400 days with the destructive phase lasting 150 days. This amounts to an entire observing season over which time the BE could be greatly suppressed. For data sets that may be taken years to decades apart, it becomes virtually impossible to detect a very long modulation effect. We therefore suspect that of the sample of Blazhko stars that show Blazhko variations, at least some have a stable modulation like that seen in LS Her. Currently, the short BP stars like LS Her and TV Boo are the best probes of the modulated Blazhko effect.
As we previously noted, the MP of LS Her has likely remained constant for the past 15 years, spanning 440 BPs and 52 MPs. This type of stability makes us wonder about its nature. It appears LS Her is a fairly normal, short period, Blazhko star which undergoes stable modulation on a time scale of 109 d. Although a stellar magnetic cycle has been previously proposed to explain the 4-year modulation of the star RR Lyrae (Detre & Szeidl, 1973), it does not seem likely that a magnetic cycle is the cause of LS Her’s modulation, given the relatively short MP and the extreme stability.
This stability suggests that the modulation may be driven by an external source, such as a binary partner. The effects of binary tidal interactions has been studied recently, through the analysis of “heartbeat” variables from the Kepler mission (Shporer et al., 2016). These variables are caused by tidal interactions between stars on eccentric binary orbits. This type of dynamic tide does not seem likely for LS Her since RRLs are ancient, evolved, horizontal branch stars. It would be expected that a binary companion would be in a circular, possibly synchronous, orbit. If we assume an equilibrium tidal effect then the companion would be expected to have an orbital period of P = 2MP = 218 d and distance of order 1 A.U. At such a separation tidal effects should be inconsequential.
In a recent paper by Jurcsik et al. (2018), the authors modeled K-magnitude observations of a sample of Blazhko stars, to show that the variation in amplitude during the Blazhko cycle is due primarily to changes in the changing surface temperature of the stars, rather than the effect of variations in the changing radius. In the case of LS Her, we might expect that temperature variations will be observed during a Blazhko cycle but that variations in the changing radius are responsible for the modulation effect. Given that LS Her is a relatively bright variable with V = 10.8, it is a prime candidate for follow-up, high-resolution spectroscopic observations. We intend to obtain spectral observations of LS Her in the coming year. These observations will provide the kinematics to test for binarity and to test for variations in the changing radius as a function of Blazhko and modulation cycle.
Finally, the first-overtone, RRc, Blazhko variables seem to be, in general, good probes of the modulated BE. The short BPs and MPs, compared to the RRab Blazhko stars, allows a much shorter time span to constrain the modulation effect. Future detailed studies should include the RRc variables as test beds of the Blazhko effect.
R.W. would like to acknowledge funding from the National Science Foundation, REU program (#1950795) at University of Kentucky. The work of H.H.M. was also funded through this program.
K.C. would like to acknowledge funding from the National Science Foundation LEAPS-MPS program through Award #2137787. The work of J.L., J.T., and S.Y. was also supported through this award.
References
- Astropy Collaboration et al. (2022) Astropy Collaboration, Price-Whelan, A. M., Lim, P. L., et al. 2022, ApJ, 935, 167, doi: 10.3847/1538-4357/ac7c74
- Blažko (1907) Blažko, S. 1907, Astronomische Nachrichten, 175, 325, doi: 10.1002/asna.19071752002
- Buchler & Kolláth (2011) Buchler, J. R., & Kolláth, Z. 2011, ApJ, 731, 24, doi: 10.1088/0004-637X/731/1/24
- Collins et al. (2017) Collins, K. A., Kielkopf, J. F., Stassun, K. G., & Hessman, F. V. 2017, AJ, 153, 77, doi: 10.3847/1538-3881/153/2/77
- Detre & Szeidl (1973) Detre, L., & Szeidl, B. 1973, in Astrophysics and Space Science Library, Vol. 36, IAU Colloq. 21: Variable Stars in Globular Clusters and in Related Systems, ed. J. D. Fernie, 31, doi: 10.1007/978-94-010-2590-4_6
- Jurcsik et al. (2018) Jurcsik, J., Hajdu, G., Dékány, I., et al. 2018, MNRAS, 475, 4208, doi: 10.1093/mnras/sty112
- Jurcsik et al. (2012) Jurcsik, J., Hajdu, G., Szeidl, B., et al. 2012, MNRAS, 419, 2173, doi: 10.1111/j.1365-2966.2011.19868.x
- Kolenberg et al. (2006) Kolenberg, K., Smith, H. A., Gazeas, K. D., et al. 2006, A&A, 459, 577, doi: 10.1051/0004-6361:20054415
- Kolláth (2018) Kolláth, Z. 2018, in The RR Lyrae 2017 Conference. Revival of the Classical Pulsators: from Galactic Structure to Stellar Interior Diagnostics, ed. R. Smolec, K. Kinemuchi, & R. I. Anderson, Vol. 6, 137–145
- LaCluyzé et al. (2004) LaCluyzé, A., Smith, H. A., Gill, E. M., et al. 2004, AJ, 127, 1653, doi: 10.1086/382101
- Le Borgne et al. (2014) Le Borgne, J. F., Poretti, E., Klotz, A., et al. 2014, MNRAS, 441, 1435, doi: 10.1093/mnras/stu671
- Lenz & Breger (2005) Lenz, P., & Breger, M. 2005, Communications in Asteroseismology, 146, 53, doi: 10.1553/cia146s53
- Ricker et al. (2015) Ricker, G. R., Winn, J. N., Vanderspek, R., et al. 2015, Journal of Astronomical Telescopes, Instruments, and Systems, 1, 014003, doi: 10.1117/1.JATIS.1.1.014003
- Shporer et al. (2016) Shporer, A., Fuller, J., Isaacson, H., et al. 2016, ApJ, 829, 34, doi: 10.3847/0004-637X/829/1/34
- Skarka & Zejda (2013) Skarka, M., & Zejda, M. 2013, MNRAS, 428, 1442, doi: 10.1093/mnras/sts135
- Wils et al. (2008) Wils, P., Kleidis, S., & Broens, E. 2008, MNRAS, 387, 783, doi: 10.1111/j.1365-2966.2008.13269.x