Imbalanced Turbulence Modified by Large-scale Velocity Shears in the Solar Wind
Abstract
We have investigated how the degree of imbalance in solar wind turbulence is modified by large-scale velocity shears in the solar wind plasma. The balance between counterpropagating Alfvénic fluctuations, which interact nonlinearly to generate the turbulence, has been quantified by the cross helicity and Elsasser ratio. Velocity shears at a 30-min timescale were identified, with the shear amplitude defined in terms of the linear Kelvin–Helmholtz (KH) instability threshold. The shears were associated with 74 interplanetary coronal mass ejection (ICME) sheaths observed by the Wind spacecraft at between 1997 and 2018. Typically weaker shears upstream of the sheaths and downstream in the ICME ejecta were also analyzed. In shears below the KH threshold, imbalance was approximately invariant or weakly rising with shear amplitude. Above the KH threshold, fluctuations tended toward a balanced state with increasing shear amplitude. Magnetic compressibility was also found to increase above the KH threshold. These findings are consistent with velocity shears being local sources of sunward fluctuations that act to reduce net imbalances in the antisunward direction, and suggest that the KH instability plays a role in this process.
1 Introduction
Properties of fluctuations at magnetohydrodynamic (MHD) scales in the solar wind are consistent with the presence of a turbulent cascade (e.g., Bruno & Carbone, 2016; Chen, 2016; Kiyani et al., 2015). Solar wind turbulence is primarily Alfvénic in nature, and typically displays a predominance of antisunward-directed fluctuations (Belcher & Davis, 1971; Goldstein & Roberts, 1999). This antisunward imbalance decreases with radial distance (e.g., Roberts et al., 1987a, b; Marsch & Tu, 1990; Bavassano et al., 2000) and also varies with solar wind type (Borovsky, 2012; Borovsky et al., 2019). At low frequencies, in the energy-containing range, the Alfvénic fluctuations are largely noninteracting, while at higher frequencies, in the inertial range, the counterpropagating fluctuations interact nonlinearly and drive a turbulent cascade (e.g., Bruno & Carbone, 2016; Chen, 2016).
The minority sunward component of the fluctuations is thought to be generated locally in interplanetary space (e.g., Goldstein et al., 1995; Bavassano, 1996; Petrosyan et al., 2010). Possible generation mechanisms include the parametric decay instability (e.g., Bowen et al., 2018; Réville et al., 2018; Malara et al., 2022; Sishtla et al., 2022), reflection off the radial gradient in the Alfvén speed (e.g., Chandran et al., 2011), and velocity shear (e.g., Roberts et al., 1992; Goldstein et al., 1999; Stawarz et al., 2011). It should be noted that effects such as velocity shear and reflection from gradients are well-known features of the non-WKB transport of Alfvén waves that occurs in the solar wind (Heinemann & Olbert, 1980; Zhou & Matthaeus, 1989, 1990), and they have been shown to contribute to the driving of turbulence in both simulations (e.g., Zank et al., 1996; Breech et al., 2008) and in situ studies (e.g., Roberts et al., 1987a, b; Bavassano et al., 1998). Multiple effects can be present at the same time and contribute to the generation of sunward fluctuations. Out of the effects mentioned above, we focus here on the role of large-scale velocity shear.
Driving effects such as velocity shear are necessary, because as suggested by Dobrowolny et al. (1980), the imbalance between the counterpropagating Alfvénic fluctuations tends to increase in their absence. This was shown to be the case in MHD simulations by Pouquet et al. (1996). This, however, is in contrast with the observed decrease of imbalance with distance from the Sun. Velocity shear was advanced as a possible candidate to explain the observed behavior of the fluctuations (Roberts et al., 1992). Subsequent studies by Matthaeus et al. (2004) and Breech et al. (2005) showed that introducing shear as a driver of turbulence could explain the observed radial evolution of the balance between fluctuations in the ecliptic as well as at higher latitudes. The connection between velocity shear and the local generation of fluctuations is still an open question, with some finding a link between the two (e.g., Smith et al., 2011) and others not (e.g., Borovsky & Denton, 2010).
Just as with hydrodynamic fluids (e.g., Rogers & Moser, 1992), a shear interface in an MHD fluid can develop a Kelvin–Helmholtz (KH) instability, which can evolve into a vortex rollup. In the solar wind, a magnetized KH instability is suppressed when the magnetic field parallel to the bulk motion of the plasma acts as a resisting force against the formation of vortices that would occur at the boundary of the shear layer (for a recent review, see Faganello & Califano, 2017). If, however, the difference in speed across the interface is greater than the local Alfvén speed, i.e., if , where and is the ion mass density, then the magnetic field can no longer suppress the instability and vortex rollup may occur (Chandrasekhar, 1981; Ruffolo et al., 2020).
In this Letter, we directly examine for the first time the relationship between imbalance in the solar wind turbulence and large-scale shear amplitudes in terms of the KH instability, via a statistical study of 74 sheath regions driven by interplanetary coronal mass ejections (ICMEs; Kilpua et al., 2017; Luhmann et al., 2020) observed by the Wind spacecraft at . The regions upstream and downstream of each sheath have also been examined. Besides ICME sheaths being of general interest for studies of solar wind turbulence, the prevalence of strong shears that we have found in sheaths makes them a particularly useful environment for the present study.
This Letter is organized as follows: In Section 2, the spacecraft data are described and key parameters are defined. In Section 3, the analysis is presented, with Section 3.1 presenting an example event that highlights some of the key parameters that are later studied in more detail. Sections 3.2 and 3.3 present the statistical analysis of the full 74 sheath set, and finally in Section 4 the results of the analysis are discussed in detail and conclusions are presented.
2 Data and Methods
Magnetic field data from MFI (Lepping et al., 1995), and ion moments from the 3DP/PESA-L (Lin et al., 1995), both on board the Wind spacecraft, were analyzed. The event list consists of 74 sheath regions identified and studied earlier by Kilpua et al. (2021). The sheaths occurred between 1997 January and 2018 March, which approximately covers solar cycles 23 and 24. The data were resampled to the same resolution (on average about ), and any small data gaps were closed using linear interpolation.
Using measurements of the magnetic field, , proton velocity, , and proton number density, , a number of parameters were calculated. These include the linear KH instability parameter, , used as a measure of velocity shear in the solar wind plasma. In the numerator of ,
| (1) |
where is the timescale over which velocity shear is taken to occur. Only changes in the components perpendicular to the radial direction, i.e., GSE , are taken to contribute to velocity shear. This is done to distinguish velocity shear from any radial compression of the plasma. Here we investigate the possible link between large-scale velocity shear and turbulence at smaller scales, with chosen to be ().
The Elsasser (1950) variables, , were also calculated. They are defined as , where is the magnetic field in Alfvén units. The solar wind was taken to consist entirely of protons, such that , where is the mass of a proton. Fluctuations in the Elsasser variables correspond to Alfvénic wave packets propagating parallel (i.e., fluctuations) or antiparallel (i.e., fluctuations) to the background magnetic field (e.g., Goldstein & Roberts, 1999).
The power spectral densities (PSDs) of , , and , denoted , , and , respectively, were determined using wavelet analysis (Torrence & Compo, 1998). Morlet wavelets were used in the wavelet transforms. Since , , and are vectors, wavelet transforms and PSDs of all three components of the vectors were calculated and summed together to obtain the PSDs of the full vector quantities. For example, is given by
| (2) |
where are the wavelet transforms of the velocity components, and give their PSDs. The wavelet transforms were performed over the frequency range to , equivalent to wave periods ranging from to . This frequency range is in the inertial range of MHD turbulence at (e.g., Kiyani et al., 2015).
Using the PSDs, four turbulence parameters were calculated: the normalized cross helicity, , the Elsasser ratio, , the normalized residual energy, , and the Alfvén ratio, . They are defined as (e.g., Bavassano et al., 1998; Chen et al., 2013)
| (3) | ||||||
| (4) |
Cross helicity and the Elsasser ratio quantify the balance of power between parallel and antiparallel fluctuations, while residual energy and the Alfvén ratio quantify the balance of power between velocity and magnetic field fluctuations. In the following, cross helicity and residual energy always refer to the normalized quantities.
When calculating the statistical distributions of and , the direction of the magnetic field was rectified (Bruno et al., 1985; Roberts et al., 1987b) such that always corresponds to Alfvénic fluctuations propagating in the antisunward direction, and to Alfvénic fluctuations propagating in the sunward direction. In rectification the magnetic field sign is flipped when its direction is outward from the Sun. The boundaries between the outward and inward sectors are defined in relation to the nominal Parker spiral angle, , which was assumed to be at , where Wind is located. The rectified quantities are denoted by asterisks, e.g., refers to rectified cross helicity. In practice rectification means that in the outward sector , which implies that and .
Also considered is the magnetic compressibility, (e.g., Chen et al., 2015; Good et al., 2020a), defined as
| (5) |
where is the fluctuation timescale. Compressibility quantifies the degree to which magnetic fluctuations involve compression, i.e., a change in the magnitude of the magnetic field rather than a rotation of the magnetic field vector. Here (), which is near the middle of the studied fluctuations’ period scale. This allows for comparison of compressibility with other turbulence properties at a similar scale.
3 Analysis
3.1 An Example Event
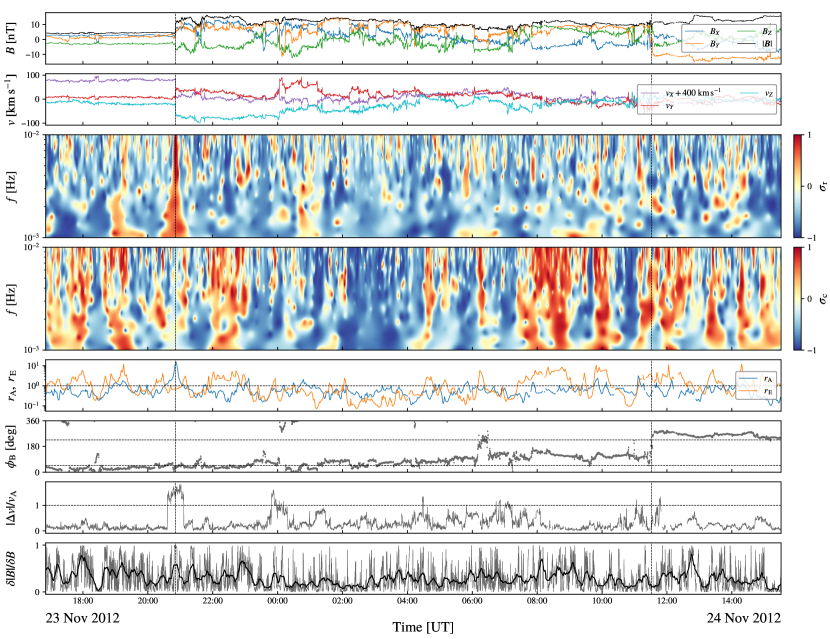
Figure 1 shows an example ICME observed by Wind in 2012 November. The sheath is between the shock and the ejecta leading edge, which are indicated by dashed vertical lines. The top two panels show the magnetic field and velocity components, respectively, and the third and fourth panels show the wavelet power spectra of residual energy, , and cross helicity, , respectively.
The third panel shows that in all three intervals (upstream wind, sheath, and ICME ejecta), is overall negative, with low . This is reflected in the fifth panel, which shows that the Alfvén ratio , averaged across frequency, is mostly below one. Negative (or ) indicate a dominance of magnetic fluctuations over velocity fluctuations, and low (or ) indicates that the flow is highly Alfvénic (Bavassano et al., 1998). There is a clear positive peak in spanning the entire frequency range at the shock. A similar feature is evident in the residual energy spectra of the majority of the sheaths studied. In the fifth panel also peaks sharply at the shock.
The third panel from the bottom shows the magnetic field longitude, . The outward/inward sector boundaries are denoted by the horizontal dashed lines, the outward sector being between the lines and the inward sector outside them.
The cross helicity, , shown in the fourth panel indicates that in the upstream solar wind and the early part of the sheath there is no clear tendency for it being dominantly positive or negative. Note that here and have not been rectified to avoid discontinuities in the plots. Before 11/24 00:00 UT the magnetic field is mostly in the inward sector, as seen in the longitude panel, which means that positive corresponds to antisunward fluctuations dominating. This flips when the magnetic field drifts from the inward to the outward sector sometime after 23:00 UT and stays there for the rest of the duration of the sheath. Most of the middle part of the sheath has overall negative (and as seen in the fifth panel), which now implies more antisunward fluctuations. There is a patch of sunward fluctuations at the end of the sheath, from before 08:00 UT until after 10:00 UT. In the ejecta the magnetic field again points toward the Sun and the profile looks similar to the upstream profile.
The second panel from the bottom shows the velocity shear amplitude in terms of the linear KH instability parameter, . Here and in the subsequent analysis, and are calculated at the base data resolution (). Across the time interval shown, it can be seen that most shear amplitudes approaching or exceeding the KH threshold were located in the sheath.
The bottom panel of Figure 1 shows the magnetic compressibility, . It fluctuated rapidly between high and low values, so a 10-min running average was calculated (black curve) to show its overall variation. This average line also shows significant variability, but without any strong systematic differences between the sheath interval and upstream or downstream.
Overall the example event shows that individual sheaths have a lot of variability, which necessitates the use of statistical analysis to find general trends in the behavior of the different parameters.
3.2 Parameter Distributions
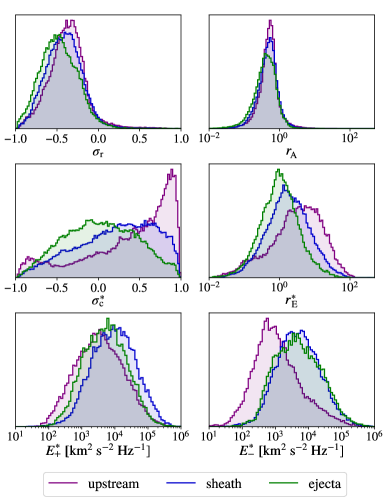
Figure 2 shows the distributions of the residual energy, , the Alfvén ratio, , rectified cross helicity, , rectified Elsasser ratio, , and the PSDs, , of the Elsasser variables upstream of the shock, inside the sheath, and in the ejecta, summed across all 74 sheaths. Both the upstream and ejecta intervals are in duration. In calculating these distributions the corresponding wavelet spectra were averaged across frequency, such that , , , and were calculated first and then averaged over frequency, rather than using the averaged PSDs to calculate the turbulence parameters.
In the top panels of Figure 2 the and distributions slightly shift to lower values, i.e., greater dominance of energy in fluctuations, when moving from the upstream wind into the sheath and from there to the ICME ejecta. The average values of of the three distributions are , , and , respectively. The upstream and sheath values line up well with earlier findings by Chen et al. (2013) and Good et al. (2022), but the ejecta value is lower than the one found by Good et al. (2022), possibly due to the different choice of normalization.
The middle left panel of Figure 2 shows that is mostly positive in the upstream solar wind, with a sharp peak near . This corresponds to the undisturbed solar wind at containing Alfvénic fluctuations propagating dominantly antisunward, which is consistent with earlier findings (e.g., Roberts et al., 1987a; Chen et al., 2013). The distributions for the sheath and ejecta intervals are flatter, with considerably more negative values than in the upstream distribution. The ejecta distribution is symmetric and has a peak around , indicating an overall tendency for a balance of sunward and antisunward fluctuations in the ICME ejecta. This is consistent with Good et al. (2020b). The sheath distribution, while more balanced than the upstream, is tipped toward positive values. In the middle right panel, the distributions mirror the behavior. The upstream distribution is clearly weighted to the right, with a majority of points having , indicating a dominance of antisunward fluctuations, while the ejecta distribution peaks at , indicating sunward–antisunward balance.
In the bottom left panel, the three distributions for are relatively similar, with the sheath distribution having the highest mean value. Greater differences are seen in , with the upstream wind distribution having a significantly lower mean value than the sheath and ejecta distributions. While both and increase from the upstream wind to the sheath, it can be seen that the more balanced values of and in the sheaths are caused by a relatively greater increase in .
3.3 Velocity Shear Dependence
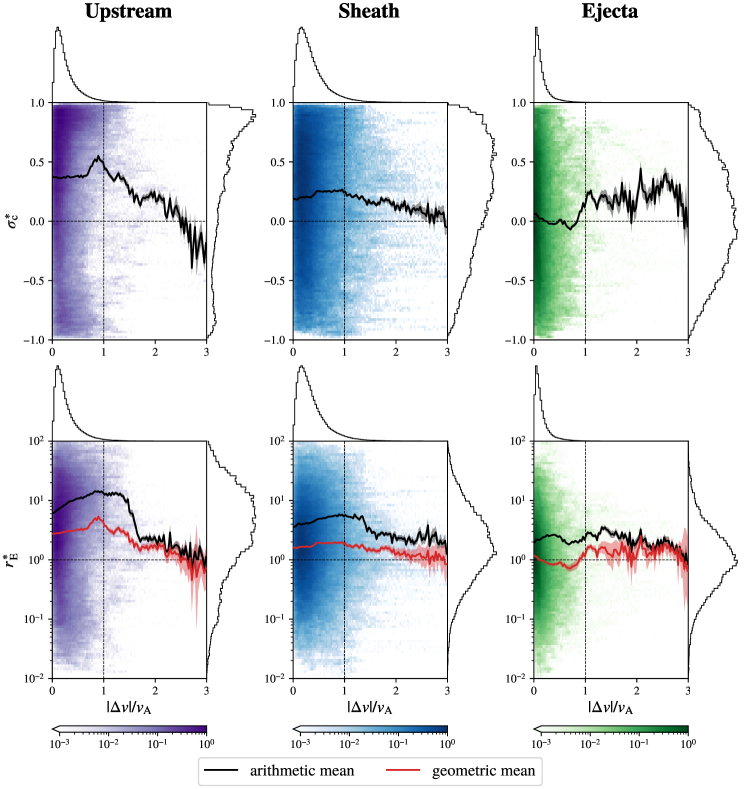
To investigate the possible link between velocity shear and the generation of sunward fluctuations, 2D histograms of and versus the KH instability parameter, , were calculated for the upstream solar wind, the sheath, and the ICME ejecta, with binning across all 74 events studied. Figure 3 shows these distributions, along with 1D histograms of the variables on the top and right-hand side adjoining axes. The distributions were calculated using a bin width of . In addition to the 2D histograms, average values across the and bins spanning each bin were calculated. These averages are shown as black and red lines on top of the 2D histograms in Figure 3, with black and red lines being arithmetic and geometric means, respectively. The geometric mean of is mathematically similar to the arithmetic mean of .
While containing fewer points than the parts of the distributions, there are sufficient data points at ( in the upstream, in the sheath, and in the ejecta) for robust statistical trends to be determined. It is notable that velocity shears exceeding the linear KH instability occur relatively more frequently in sheaths than in the solar wind or ICME ejecta. In the upstream wind, when , with a small increase in seen just below the KH threshold, while the arithmetic mean of increases more smoothly across the interval (cf. the weaker rise in the geometric mean). The behavior of the average and lines changes when moving from the region of the distribution to the region. At , and show a decreasing trend with increasing , with and tending toward greater balance, i.e., values of zero and one, respectively. The general behavior of the average and inside the sheaths follows the same trend as in the upstream wind, i.e., invariance or relatively weak increase as grows in the part of the distribution, and decrease toward balance when .
In the ICME ejecta, the average values of and stay approximately constant and near balance when . When in the ejecta, uncertainties become more significant, such that is positive but highly variable, and the geometric mean of is close to one but also varies significantly.
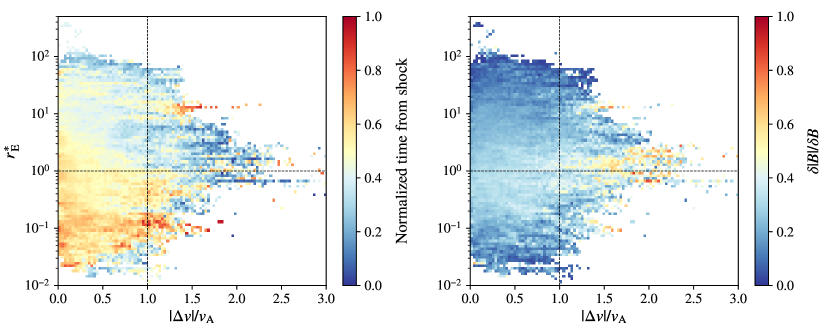
We also investigated the relationship between and inside the sheaths in terms of location within the sheath, as well as the link between shear and . The sheaths have been chosen for this analysis because, of the three interval types, they contained a greater abundance of large-amplitude shears. In Figure 4, the bottom middle distribution from Figure 3 is reproduced, but here with color-coding by the average time from the shock (left panel) and average (right panel) of points in each bin; since the sheaths ranged in duration from to , the sheath durations were normalized such that zero refers to the shock time and one to the ICME leading edge time in the left panel.
At in the left panel, there appears to be some correlation between and location in the sheath: fluctuations with the largest antisunward (sunward) imbalance tend to be located at the front (back) of the sheath, with the most balanced fluctuations tending to be found near the sheath midpoint. This correlation is also present at to a somewhat lesser degree. Some of the largest shears () are located near the front of the sheath, and are possibly generated by strong amplification of the nonradial velocity components by the shock (e.g., as seen in the Figure 1 example).
In the right panel the and parts of the distribution are associated with very low , with , while the middle part of the distribution is associated with somewhat higher . The highest values of are seen in the and part of the distribution, but there are no significant regions with .
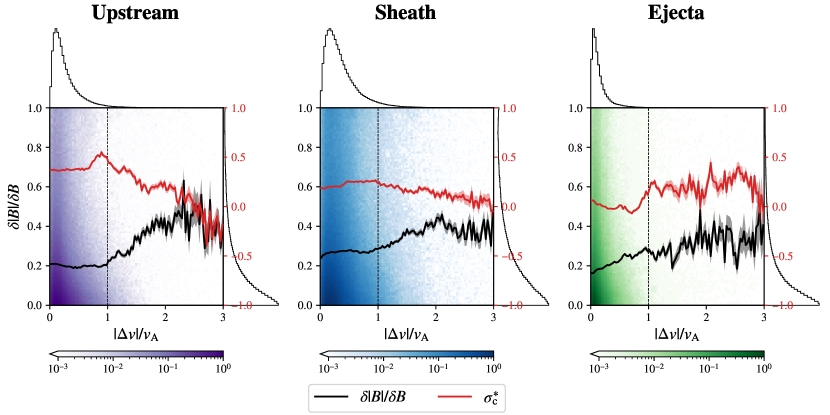
To investigate how behaves with increasing , 2D histograms of against , similar to the ones in Figure 3, were calculated. These are shown in Figure 5, with accompanying mean lines for as well as mean lines for added on top to compare the behavior of the two parameters. In both the upstream solar wind and the sheath, remains fairly constant in the part of the distribution, having a mean value of in the upstream wind and in the sheath. At around the threshold, starts increasing in both distributions. Above , plateaus at around to , with increased uncertainty in the values.
4 Discussion and Conclusion
In this Letter, we have presented a statistical analysis of the relation between turbulent imbalance and large-scale velocity shear in 74 ICME sheaths and their surroundings as observed by the Wind spacecraft at . When compared to upstream solar wind and downstream ejecta intervals, we found that sheaths contain significantly more large-amplitude shears exceeding the KH instability threshold, making sheaths particularly useful for studying the imbalance vs. shear relationship.
Firstly, there are clear differences in the overall distributions of the Elsasser ratio, , and cross helicity, , between the three types of solar wind analyzed (Figure 2). Moving from the upstream wind into the sheath and then into the ICME ejecta, the mean of the distribution approaches one, and the mean of the distribution approaches zero: these trends indicate a tendency toward balance between the sunward and antisunward Alfvénic fluctuations present in the plasma.
The observed shift toward higher combined with more balanced and could be due to two mechanisms. The first possibility is that, when swept into sheaths from the upstream wind, preexisting fluctuations are amplified without any significant generation of new fluctuations inside the sheaths. However, this would require significantly stronger amplification of sunward than antisunward fluctuations to produce a reduction of . Alternatively, and perhaps more likely, new fluctuations are generated inside sheaths, with equal generation of that over time acts to shift the overall and distributions toward balance (Smith et al., 2011) and away from the imbalance of the amplified, preexisting fluctuations that originated in the upstream wind.
In the upstream wind and sheaths, there is a clear association between velocity shear amplitudes at a 30-min timescale that exceed the KH instability threshold and more balanced fluctuations. The fact that the behavior of the mean and in Figure 3 is different above and below the threshold (relative invariance below, tending toward balance with increasing shear amplitude above) suggests that the KH instability can directly affect the balance of the turbulence. The velocity shear vs. imbalance relationship is less clear inside the ejecta, possibly due to a combination of the ejecta plasma being intrinsically more balanced (Good et al., 2020b, 2022) and a relative scarcity of shears.
We speculate that the shift toward balance at in the distributions moving from upstream to sheath could be due to the prior action of velocity shears that are no longer present at , to some spreading of locally generated fluctuations outside of the regions, or to the whole of the sheath intervals acting as velocity shears with equal to the sheath duration. Near-Sun observations by Parker Solar Probe and Solar Orbiter could shed light on the first of these possibilities.
It should be expected that the dynamics of the velocity shear interface are nonlinear in nature, but the threshold of the magnetized KH instability is a linear criterion. This is still valid as an identifier of the onset of KH instability, as the early part of the dynamics can resemble a linear instability, which then evolves into a nonlinear instability with the associated vortex rollup (Ruffolo et al., 2020).
There is also an association between velocity shear and magnetic compressibility that is clearly present in the upstream wind and sheath distributions. Similar to the bimodal behavior of and , is flat below and increases with shear amplitude above it. This suggests that the KH instability also plays a role in generating compressive as well as Alfvénic fluctuations.
References
- Bavassano (1996) Bavassano, B. 1996, SSRv, 78, 29, doi: 10.1007/BF00170789
- Bavassano et al. (1998) Bavassano, B., Pietropaolo, E., & Bruno, R. 1998, JGR, 103, 6521, doi: 10.1029/97JA03029
- Bavassano et al. (2000) Bavassano, B., Pietropaolo, E., & Bruno, R. 2000, JGR, 105, 12 697, doi: 10.1029/2000JA900004
- Belcher & Davis (1971) Belcher, J. W., & Davis, Jr., L. 1971, JGR, 76, 3534, doi: 10.1029/JA076i016p03534
- Borovsky (2012) Borovsky, J. E. 2012, JGR, 117, A05104, doi: 10.1029/2011JA017499
- Borovsky & Denton (2010) Borovsky, J. E., & Denton, M. H. 2010, JGR, 115, A10101, doi: 10.1029/2009JA014966
- Borovsky et al. (2019) Borovsky, J. E., Denton, M. H., & Smith, C. W. 2019, JGRA, 124, 2406, doi: 10.1029/2019JA026580
- Bowen et al. (2018) Bowen, T. A., Badman, S., Hellinger, P., & Bale, S. D. 2018, ApJL, 854, L33, doi: 10.3847/2041-8213/aaabbe
- Breech et al. (2008) Breech, B., Matthaeus, W. H., Minnie, J., et al. 2008, JGR, 113, A08105, doi: 10.1029/2007JA012711
- Breech et al. (2005) Breech, B., Matthaeus, W. H., Minnie, J., et al. 2005, GeoRL, 32, L06103, doi: 10.1029/2004GL022321
- Bruno et al. (1985) Bruno, R., Bavassano, B., & Villante, U. 1985, JGR, 90, 4373, doi: 10.1029/JA090iA05p04373
- Bruno & Carbone (2016) Bruno, R., & Carbone, V. 2016, Turbulence in the Solar Wind (Springer, Cham), doi: 10.1007/978-3-319-43440-7
- Chandran et al. (2011) Chandran, B. D. G., Dennis, T. J., Quataert, E., & Bale, S. D. 2011, ApJ, 743, 197, doi: 10.1088/0004-637X/743/2/197
- Chandrasekhar (1981) Chandrasekhar, S. 1981, Hydrodynamic and Hydromagnetic Stability (Dover Publications, New York)
- Chen (2016) Chen, C. H. K. 2016, JPlPh, 82, 535820602, doi: 10.1017/S0022377816001124
- Chen et al. (2013) Chen, C. H. K., Bale, S. D., Salem, C. S., & Maruca, B. A. 2013, ApJ, 770, 125, doi: 10.1088/0004-637X/770/2/125
- Chen et al. (2015) Chen, C. H. K., Matteini, L., Burgess, D., & Horbury, T. S. 2015, MNRAS, 453, L64, doi: 10.1093/mnrasl/slv107
- Dobrowolny et al. (1980) Dobrowolny, M., Mangeney, A., & Veltri, P. 1980, PhRvL, 45, 144, doi: 10.1103/PhysRevLett.45.144
- Elsasser (1950) Elsasser, W. M. 1950, PhRv, 79, 183, doi: 10.1103/PhysRev.79.183
- Faganello & Califano (2017) Faganello, M., & Califano, F. 2017, JPlPh, 83, 535830601, doi: 10.1017/S0022377817000770
- Goldstein & Roberts (1999) Goldstein, M. L., & Roberts, D. A. 1999, PhPl, 6, 4154, doi: 10.1063/1.873680
- Goldstein et al. (1999) Goldstein, M. L., Roberts, D. A., Deane, A. E., Ghosh, S., & Wong, H. K. 1999, JGR, 104, 14 437, doi: 10.1029/1998JA900128
- Goldstein et al. (1995) Goldstein, M. L., Roberts, D. A., & Matthaeus, W. H. 1995, ARA&A, 33, 283, doi: 10.1146/annurev.aa.33.090195.001435
- Good et al. (2020a) Good, S. W., Ala-Lahti, M., Palmerio, E., Kilpua, E. K. J., & Osmane, A. 2020a, ApJ, 893, 110, doi: 10.3847/1538-4357/ab7fa2
- Good et al. (2022) Good, S. W., Hatakka, L. M., Ala-Lahti, M., et al. 2022, MNRAS, 514, 2425, doi: 10.1093/mnras/stac1388
- Good et al. (2020b) Good, S. W., Kilpua, E. K. J., Ala-Lahti, M., et al. 2020b, ApJL, 900, L32, doi: 10.3847/2041-8213/abb021
- Heinemann & Olbert (1980) Heinemann, M., & Olbert, S. 1980, JGR, 85, 1311, doi: 10.1029/JA085iA03p01311
- Kilpua et al. (2017) Kilpua, E., Koskinen, H. E. J., & Pulkkinen, T. I. 2017, LRSP, 14, 5, doi: 10.1007/s41116-017-0009-6
- Kilpua et al. (2021) Kilpua, E. K. J., Good, S. W., Ala-Lahti, M., et al. 2021, FrASS, 7, 610278, doi: 10.3389/fspas.2020.610278
- Kiyani et al. (2015) Kiyani, K. H., Osman, K. T., & Chapman, S. C. 2015, RSPTA, 373, 20140155, doi: 10.1098/rsta.2014.0155
- Lepping et al. (1995) Lepping, R. P., Acuña, M. H., Burlaga, L. F., et al. 1995, SSRv, 71, 207, doi: 10.1007/BF00751330
- Lin et al. (1995) Lin, R. P., Anderson, K. A., Ashford, S., et al. 1995, SSRv, 71, 125, doi: 10.1007/BF00751328
- Luhmann et al. (2020) Luhmann, J. G., Gopalswamy, N., Jian, L. K., & Lugaz, N. 2020, SoPh, 295, 61, doi: 10.1007/s11207-020-01624-0
- Malara et al. (2022) Malara, F., Primavera, L., & Veltri, P. 2022, Univ, 8, 391, doi: 10.3390/universe8080391
- Marsch & Tu (1990) Marsch, E., & Tu, C.-Y. 1990, JGR, 95, 8211, doi: 10.1029/JA095iA06p08211
- Matthaeus et al. (2004) Matthaeus, W. H., Minnie, J., Breech, B., et al. 2004, GeoRL, 31, L12803, doi: 10.1029/2004GL019645
- Petrosyan et al. (2010) Petrosyan, A., Balogh, A., Goldstein, M. L., et al. 2010, SSRv, 156, 135, doi: 10.1007/s11214-010-9694-3
- Pouquet et al. (1996) Pouquet, A., Meneguzzi, M., & Frisch, U. 1996, PhRvA, 33, 4266, doi: 10.1103/PhysRevA.33.4266
- Réville et al. (2018) Réville, V., Tenerani, A., & Velli, M. 2018, ApJ, 866, 38, doi: 10.3847/1538-4357/aadb8f
- Roberts et al. (1987a) Roberts, D. A., Goldstein, M. L., Klein, L. W., & Matthaeus, W. H. 1987a, JGR, 92, 12 023, doi: 10.1029/JA092iA11p12023
- Roberts et al. (1992) Roberts, D. A., Goldstein, M. L., Matthaeus, W. H., & Ghosh, S. 1992, JGR, 97, 17 115, doi: 10.1029/92JA01144
- Roberts et al. (1987b) Roberts, D. A., Klein, L. W., Goldstein, M. L., & Matthaeus, W. H. 1987b, JGR, 92, 11 021, doi: 10.1029/JA092iA10p11021
- Rogers & Moser (1992) Rogers, M. M., & Moser, R. D. 1992, JFM, 243, 183, doi: 10.1017/S0022112092002696
- Ruffolo et al. (2020) Ruffolo, D., Matthaeus, W. H., Chibber, R., et al. 2020, ApJ, 902, 94, doi: 10.3847/1538-4357/abb594
- Sishtla et al. (2022) Sishtla, C. P., Pomoell, J., Kilpua, E., et al. 2022, A&A, 661, A58, doi: 10.1051/0004-6361/202142999
- Smith et al. (2011) Smith, C. W., Tessein, J. A., Vasquez, B. J., & Skoug, R. M. 2011, JGR, 116, A10103, doi: 10.1029/2011JA016645
- Stansby et al. (2019) Stansby, D., Horbury, T. S., & Matteini, L. 2019, MNRAS, 482, 1706, doi: 10.1093/mnras/sty2814
- Stawarz et al. (2011) Stawarz, J. E., Vasquez, B. J., Smith, C. W., Forman, M. A., & Klewicki, J. 2011, ApJ, 736, 44, doi: 10.1088/0004-637X/736/1/44
- Torrence & Compo (1998) Torrence, C., & Compo, G. P. 1998, BAMS, 79, 61, doi: 10.1175/1520-0477(1998)079<0061:APGTWA>2.0.CO;2
- Zank et al. (1996) Zank, G. P., Matthaeus, W. H., & Smith, C. W. 1996, JGR, 101, 17 093, doi: 10.1029/96JA01275
- Zhou & Matthaeus (1989) Zhou, Y., & Matthaeus, W. H. 1989, GeoRL, 16, 755, doi: 10.1029/GL016i007p00755
- Zhou & Matthaeus (1990) Zhou, Y., & Matthaeus, W. H. 1990, JGR, 95, 10 291, doi: 10.1029/JA095iA07p10291