GRB 221009A, its precursor and two afterglows in the Fermi data
Abstract
We study GRB 221009A, the brightest gamma-ray burst in the history of observations, using Fermi data. To calibrate them for large inclination angles, we use the Vela X gamma-ray source. Light curves in different spectral ranges demonstrate a 300 s overlap of afterglow and delayed episodes of soft prompt emission. We demonstrate that a relatively weak burst precursor that occurs 3 minutes before the main episode has its own afterglow, i.e., presumably, its own external shock. The main afterglow is the brightest one, includes a photon with an energy of 400 GeV 9 hours after the burst, and is visible in the LAT data for up to two days.
keywords:
gamma-ray burst: individual, methods: data analysis1 Introduction
The recent and brightest gamma-ray burst, GRB 221009A, has been detected by many space X-ray – -ray observatories, including Fermi (Veres et al., 2022; Lesage et al., 2022), Swift (for more detailed analysis see Williams et al. (2023)), SRG/ART-XC (Lapshov et al., 2022), Konus-Wind (Frederiks et al., 2022) and others. The burst and its afterglow were also registered by LHAASO on Earth in the range of hundreds GeV to several TeV (Huang et al., 2022). Carpet-2 on Baksan Neutruno Observatory has detected an atmospheric shower 250 TeV photon from the location of GRB 221009A (Dzhappuev et al., 2022). On the other hand HAWC collaboration reports no detection of photons from the afterglow in TeV range beyond 8 hours after the trigger (Ayala et al., 2022) and claim the upper limit on the energy flux TeV cm-2 s-1.
The burst was intrinsically strong and relatively nearby, z = 0.151. The apparent brightness of GRB 221009A is exceptional. In Fermi GBM burst catalog it exceeds the next brightest by factor 15 in energy fluence. However the strongest impact of this event is due to claims of two photons 18 GeV (LHAASO) and 250 TeV (Carpet 2) which cannot come from z = 0.15 because of the absorption on extragalactic background light. There already have appeared numerous e-prints suggesting new physics to explain these photons.
Taking advantage of the brightness of GRB 221009A we try to find something new about GRBs themselves in publicly available Fermi data. Namely:
– Is there anything interesting between the precursor of the burst and its main emission three minutes later.
– What does the transition from the prompt phase of gamma-ray bursts to afterglow look like?
– How bright is the afterglow and how long can it be traced in the GeV range.
2 Data and their calibration
Some raw Fermi data for GRB 221009A are shown in Fig. 1. Large Area Telescope (LAT) and NaI detectors of Gamma Burst Monitor (GBM) were oversaturated while Bismuth Germanate (BGO) scintillation detectors satisfactory reproduce the peak flux in energy channels above 1 MeV. There are no LAT data in the most interesting intervals 220 – 240 and 260 – 270 seconds (photon detections lack not only from the GRB direction but from the whole sky).
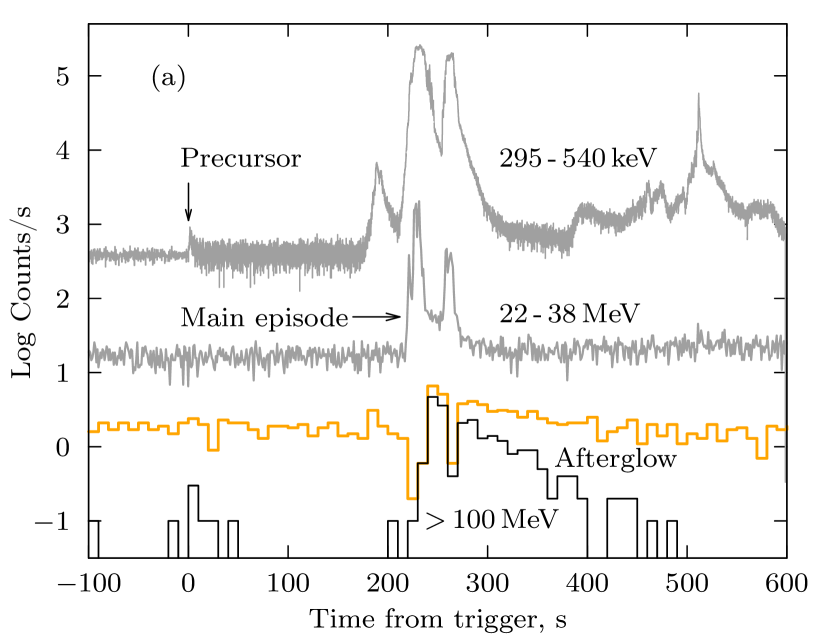
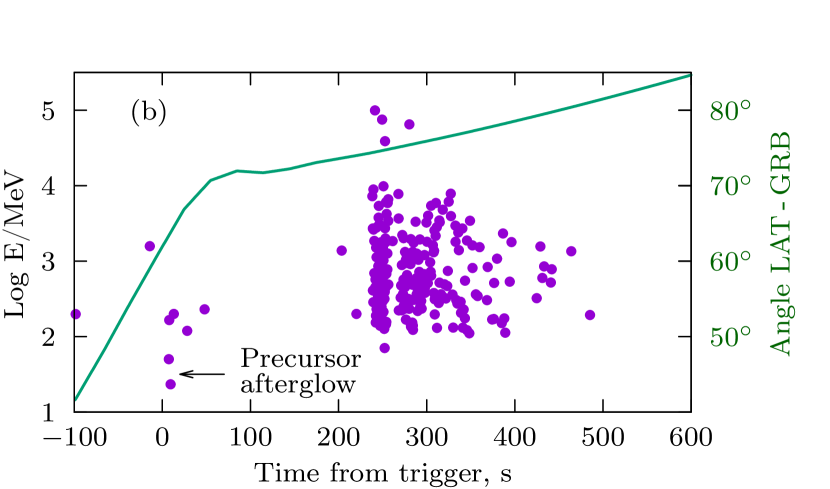
The next circumstance that makes the direct interpretation of LAT data problematic is a large angle between the direction of LAT z-axis and the burst location. The burst has occurred at the very edge of the telescope field of view where the detection efficiency is low. Fig 1b shows time dependence of on time during the event. The inclination angle varied from to more than at s when the source leaved the field of view for an hour.
The angular dependence of LAT effective area is given in Ajello et al. (2021), see also Fermi LAT Performance. However these data have insufficient resolution for this specific problem, therefore we have performed a detailed calibration of LAT detection efficiency for large incident angles using the brightest GeV source Vela X (both the pulsar and the nebula). The same object was used by Fermi team for calibration of the point spread function (Ajello et al., 2021) .
We use photons in circle around Vela X location as the calibration sample. The size of this circle is a result of a trade-off between sufficient containment for MeV photons and the contamination of the sample with background photons. The result of our calibration is shown in Fig. 2.
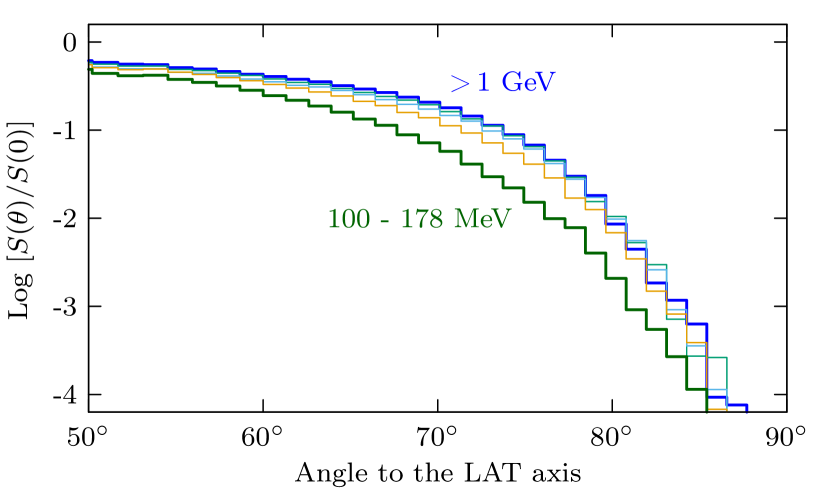
The number of photons in our calibration sample is while the number of background photons is as we have estimated from a neighbouring site of Milky Way. So, the background is considerable, but its effect should be moderate because the angular dispersion of background photons contributes the detection efficiency with different signs: the number of photons incident at is comparable with those arrived at . Neverphtheless wide angular cut in calibration sample mimics some extension of the field of view. We have checked the effect of the wide angular cut with the same calibration cutting the sample at . The difference at for photons with GeV is and factor 2.5 for MeV interval. The latter large value is certainly the effect of widening of point spread function at edge of the field of view. Therefore we prefer to use the calibration with calibration sample as it better reproduces the soft end of the spectrum and an extra background just slightly affects its hard range.
Except angular dependence of detection efficiency one should take into account the energy dependence. We use that described by Ajello et al. (2021). Note that for lowest energy bin 100 – 178 MeV that we use the efficiency is 0.45 of the maximal efficiency. Therefore a 100 MeV photon detected by LAT at 400 s after the trigger represents 300 photons of the same energy crossing the detector area (see Fig. 1b and Fig. 2). In our analysis and calibration we do not distinguish the conversion type and the quality class of photons, using total effective area for the "source" event class.
3 Main episode and onset of the afterglow
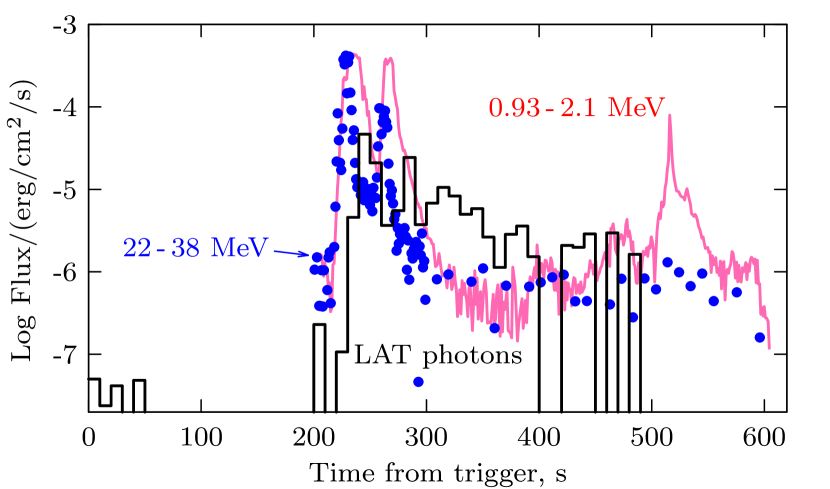
Normalized Fermi data for the first 600 seconds are shown in Fig. 3. LAT data were normalized using our Vela X calibration results (Fig. 2) and energy dependent effective area from Ajello et al. (2021). Total effective area of two BGO detectors was set to 200 cm2 independently on energy and incident angle as such assumption is sufficient for qualitative demonstration. For the energy and angular performance of BGO detectors see Meegan et al. (2009).
BGO 22 - 38 MeV energy flux in 300 - 600 s interval is very sensitive to the background model. We use three parametric description: constant plus one sinusoidal half period with fitting intervals 300 - 150 s and 600 - 1300 s. Resulting is good, however the error in energy fluence in BGO us large therefore we do not take BGO data into consideration when reconstructing photon spectra. We see a striking transition in time behaviour at 300 s: a sharp decline of main pulse changes to a flat smooth slope. The exception is another soft episode of prompt emission at 400 - 600 s which we discuss below. It would be reasonable to suggest then the high energy emission after 300 s can be considered as the main afterglow.
Phenomenologically, prompt emission usually undergoes a very fast variation of intensity and spectrum while afterglow has a smooth long decline with a stable wide spectral energy distribution. Prompt emission sometimes consists of multiple pulses of different duration and spectra, this pulses can overlap in time producing in some cases complex structures with a wide temporal Fourier power spectrum (Beloborodov et al., 2000). Their time behaviour is very diverse. On the contrary, all afterglows have typical time behaviour: a power law decline slightly faster than .
Theoretically, there exists a paradigm that the prompt emission arises from internal shocks (or magnetic reconnection or both) in the jet while the afterglow from external shock form collision of the jet with ambient medium (see e.g. Piran (2005)), dominated by the stellar wind of the GRB progenitor (Chevalier & Li, 1999). Physically, the prompt emission in many cases can be described as a radiation of an optically thick medium due to multiple Comptonization (e.g. Ito et al. (2018)), while afterglow better corresponds to synchrotron/Compton radiation of electrons accelerated in an optically thin environment, see Nava (2018) for a review.
In the case of GRB 221009A we can describe as the prompt emission the precursor, a soft pulse at s, two main hard pulses and a soft long structure in s interval. Photon flux detected by LAT since 250 s with its spectrum (see Fig. 4) and light curve resembles an afterglow rather than a prompt emission. The structure at 400 - 600 s is probably an independent prompt emission episode overlapping in time with the early afterglow.
Probably the afterglow mechanism (presumably the external shock) has turned on slightly earlier, e.g at 230 s. Thereafter we use this time as a reference point for a power law decline of the afterglow.
Our estimate of the energy fluence represented by 229 photons detected by LAT in the time interval 220 - 500 s is erg/cm2. Actual fluence could be several times higher since we don not know how many photons are lost in over-saturation gaps. The low energy fluence preliminary estimated by Lesage et al. (2022) is erg/cm2, the total energy fluence can be much higher, see Frederiks et al. (2023). The spectral energy distribution in 100 MeV - 100 GeV range is shown in Fig. 4. We made a forward-folding power law fit to the numbers of detected photons in energy bins. The resulting photon index for LAT photons in background-free 8∘ field is -1.92 which is consistent with estimate of Pillera et al. (2022)
4 The main afterglow
After 500 seconds since the trigger the GRB came out of LAT field. The next time window was open from to seconds. Then the location of GRB221009 periodically appeared in the field of view with duty cycle %.
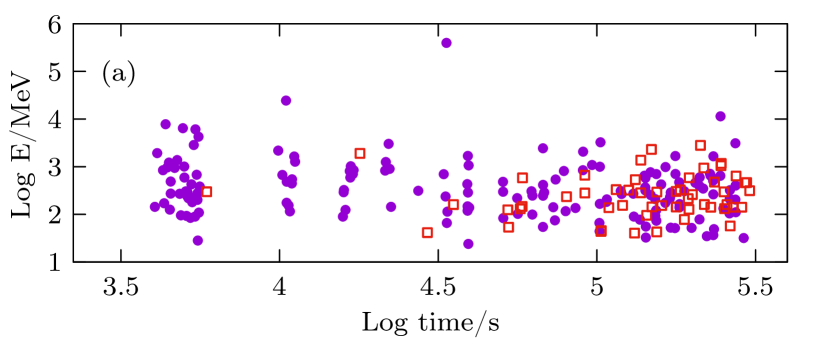
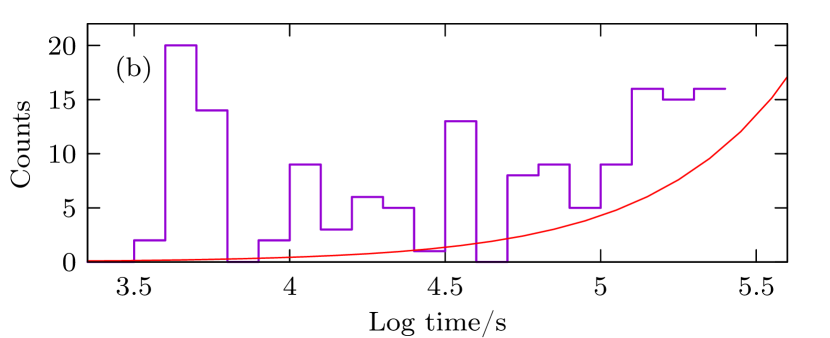
Fig. 5 shows counts of photons detected by LAT versus logarithm of time. Unlike the main episode which is essentially background free, the background during the late afterglow is considerable and is too large in field of view which we accepted for the description of the main episode. For this reason we analyse the afterglow using circle. The background estimated with photons detected from the same direction during 300 000 seconds prior the trigger is shown in Fig. 5. With this window the afterglow is significant up to two days (see Fig. 5b). Further contraction of the field of view does not improve the significance.
Fig. 5a shows LAT photons in log-log scale for field. It looks like the afterglow is getting softer with time, however note a 400 GeV photon at (33554 s). The angular deviation of this photon from the GRB location is , the probability of chance coincidence with such angular deviation during a day is . This photon is missing in the telegram of Fermi team, but was noticed by Xia et al. (2022). The impression of softening can result from the lack of soft photons in the main episode and their excess at s. The former can be explained by a stronger suppression of soft photons at large incident angles (see Fig. 2a) and the latter by the contribution of a softer background. The statistics is insufficient to reveal an evolution of the afterglow spectrum.
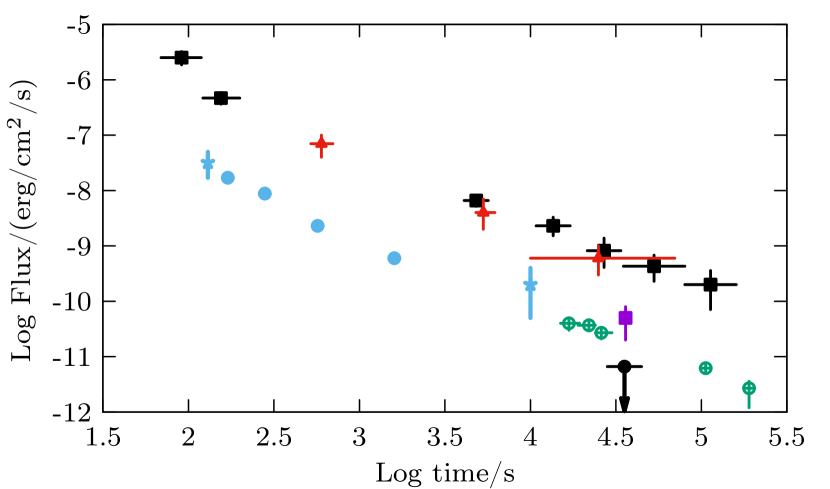
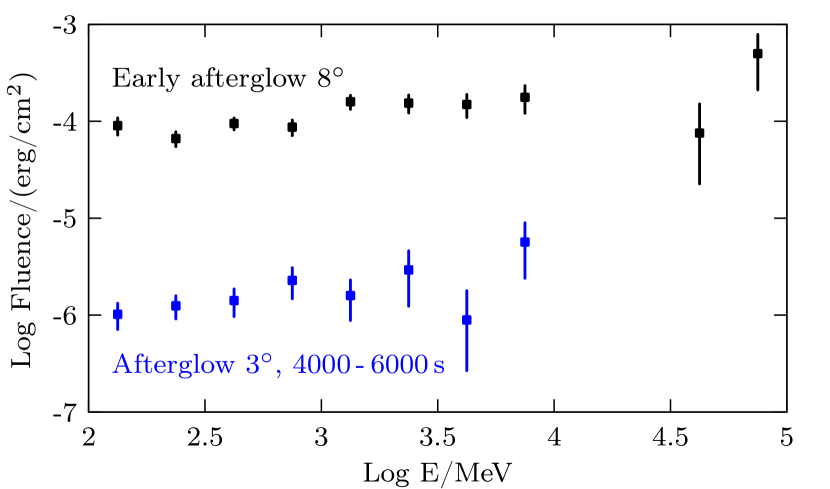
The spectral energy distributions for the beginning of the afterglow and for the second window are shown in Fig. 4. They are consistent with each other and just slightly differ from the "canonical" spectrum with flat SED (photon index ). We suggest that it would be reasonable to set the spectral index to -2 when fitting the afterglow energy flux. Fig. 6 shows the photon flux of the afterglow versus time. The flux is normalized to field of view using energy dependent relative containment in and circles averaged over spectrum with . We add for comparison some data points for high energy fluxes of other bright GRBs: GRB 130427SA, (Ackermann et al., 2014), GRB 180720B (Abdalla et al., 2019), GRB 190114C (Acciari et al., 2019) and GRB 190829 (Abdalla et al., 2021). These data are summarised and discussed by Miceli & Nava (2022). The afterglow of GRB is slightly brighter than afterglow of GRB 130427A and almost an order of magnitude brighter than GRB 18072B , 190114C and 190829 which were detected by Cherenkov telescopes. This is the first case when the afterglow is still visible in the Fermi range two days after the GRB. Intriguingly, it was not detected by the HAWC Collaboration (Ayala et al., 2022), see Fig. 6.
The afterglow is still significant in 100 000 – 200 000 s interval: the number of photons is 40 versus 23 photons in the "mirror" -100 000 – -200000 s interval. The afterglow light curve in 0.1 - 10 GeV range can be described as a power law , where .
5 The afterglow of the precursor
Fermi LAT detected 6 photons in the range 20 - 200 MeV in time interval 7 - 50 seconds after the trigger (Fig. 1b) when the angle varied from to and LAT effective area was several times less than for on-axis photons (see Fig. 2). Note that the prompt precursor emission already has relaxed when LAT has detected first of these photons. We estimate the energy fluence represented by these 6 photons as erg cm-2.
How significant is this "preafterglow"? We have counted photons from circle when the orientation of LAT z-axis to the GRB was during 30 000 seconds before the burst. The result is 302 photons for 23400 seconds which gives the expectation 0.64 photons for 50 s interval after the precursor. The probability to sample 6 photons by chance is (). Note that there is no "look elsewhere" effect in this case: the photons appear in a proper place with no sample manipulation. Therefore this significance is quite sufficient to claim that Fermi has detected an afterglow of a precursor. This is the first case of such detection. The idea that a GRB precursor could produce its own afterglow was suggested by Nappo et al. (2014).
The spectral fit to 6 photons is, of course, quite loose, the resulting spectral index is which is consistent with the spectrum of the main afterglow with .
6 Discussion and conclusions
Probably the most interesting fact that we see in Fermi data is the afterglow of the precursor. This is the first direct evidence of such phenomenon at least if we treat a precursor as a relatively weak event separated from the main episode by a long time interval.
A weak precursor that occurs long before (up to several minutes) the main GRB is a feature of many GRBs. The estimates of their occurrence varies from 3% GRBs (Koshut et al., 1995) up to 10% (Troja et al., 2010) or even 20% (Lazzati, 2005). A useful review of the phenomenon is given by Zhu (2015). In fact, this fraction may be even higher, since the precursor can be easily lost. The precursor of GRB 221009A has a few hundred times lower peak count rate and several thousand times lower energy fluence than the main emission episode. Such relatively weak precursor can by detected only in rare cases of very strong GRBs and one can not exclude that this phenomenon is common for the majority of GRBs and we observe just strongest precursors.
However this weak precursor has a bright afterglow. The energy fluence of the precursor and its afterglow is: erg cm-2 (0.1 - 4.8 MeV, BGO) and erg cm-2 correspondingly. The estimate by Minaev et al. (2022) of the precursor fluence is erg cm-2. Therefore, they are comparable, while the main afterglow is much weaker than the main prompt emission episode: erg cm-2 versus erg cm-2 (our estimate using BGO counts in 0.1 - 4.8 MeV range), or even 0.21 erg cm-2 in 0.02 - 10 MeV band according to estimate of Frederiks et al. (2023). The difference in this ratio is two orders of magnitude. This is a hint that the precursor could differ from the main GRB in its nature. If we follow the paradigm that the prompt emission originates from internal shocks in the jet and the afterglow comes from external shock in the ambient medium (see Piran (2005)), then we have to conclude that internal shock is pathologically weak in the case of the precursor. In principle, one cannot exclude that a precursor with its afterglow is an essentially different phenomenon preceding the main emission. Unfortunately, there is a very small chance to observe such afterglow directly in the nearest future, nevertheless it probably could be sensed statistically using existing data bases.
As for the main afterglow, this is the brightest one as well as the GRB 221009 itself. In other respects (relative energy flux, spectrum, decay law) it looks typical. The afterglow due to its brightness is visible in Fermi data during two days and could be visible even longer by Cherenkov telescopes unless bad observational conditions including bright moon.
HAWC collaboration has reported no detections beyond 8 hours after the event and set the upper limit erg cm-2 s-1 (Ayala et al., 2022). This upper limit is in apparent tension with Fermi data unless one implies a sharp spectral decline between GeV and TeV energy ranges. However other GRB do not have such decline in their afterglows which is supported by data of Cherenkov telescopes for other GRBs (cf. Fermi and MAGIC data in Fig. 6). Moreover, the 400 GeV photon detected at 9 hours is an argument against a spectral cutoff. The publication of LHAASO results may clarify this issue. Note that the second brightest afterglow of GRB 130427A also has not been detected above 100 GeV, the upper limit set by VERITAS (Aliu et al., 2014) erg cm-2 s-1 at the next day could be in some tension with Fermi data too.
Acknowledgements
We thank Fermi team for the excellent data base and NASA for the open data policy.
Data Availability
This work is based on publicly available Fermi database and the quantitative description of the Fermi Large Area Telescope performance. The work of I.T. was supported by the Russian Science Foundation grant 23-42-00066.
References
- Abdalla et al. (2019) Abdalla H., et al., 2019, Nature, 575, 464
- Abdalla et al. (2021) Abdalla H., et al., 2021, Science, 372, 1081
- Acciari et al. (2019) Acciari V. A., et al., 2019, Nature, 575, 459
- Ackermann et al. (2014) Ackermann M., et al., 2014, Science, 343, 42
- Ajello et al. (2021) Ajello M., et al., 2021, ApJS, 256, 12
- Aliu et al. (2014) Aliu E., et al., 2014, ApJ, 795, L3
- Ayala et al. (2022) Ayala H., et al., 2022, GRB Coordinates Network, 32683, 1
- Beloborodov et al. (2000) Beloborodov A. M., Stern B. E., Svensson R., 2000, ApJ, 535, 158
- Chevalier & Li (1999) Chevalier R. A., Li Z.-Y., 1999, ApJ, 520, L29
- Dzhappuev et al. (2022) Dzhappuev D. D., et al., 2022, The Astronomer’s Telegram, 15669, 1
- Frederiks et al. (2022) Frederiks D., Lysenko A., Ridnaia A., Svinkin D., Tsvetkova A., Ulanov M., Cline T., Konus-Wind Team 2022, GRB Coordinates Network, 32668, 1
- Frederiks et al. (2023) Frederiks D., et al., 2023, arXiv:2302.13383
- Huang et al. (2022) Huang Y., Hu S., Chen S., Zha M., Liu C., Yao Z., Cao Z., Experiment T. L., 2022, GRB Coordinates Network, 32677, 1
- Ito et al. (2018) Ito H., Levinson A., Stern B. E., Nagataki S., 2018, MNRAS, 474, 2828
- Koshut et al. (1995) Koshut T. M., Kouveliotou C., Paciesas W. S., van Paradijs J., Pendleton G. N., Briggs M. S., Fishman G. J., Meegan C. A., 1995, ApJ, 452, 145
- Lapshov et al. (2022) Lapshov I., Molkov S., Mereminsky I., Semena A., Arefiev V., Tkachenko A., Lutovinov A., SRG/ART-XC Team 2022, GRB Coordinates Network, 32663, 1
- Lazzati (2005) Lazzati D., 2005, MNRAS, 357, 722
- Lesage et al. (2022) Lesage S., Veres P., Roberts O. J., Burns E., Bissaldi E., Fermi GBM Team 2022, GRB Coordinates Network, 32642, 1
- Meegan et al. (2009) Meegan C., et al., 2009, ApJ, 702, 791
- Miceli & Nava (2022) Miceli D., Nava L., 2022, Galaxies, 10, 66
- Minaev et al. (2022) Minaev P., Pozanenko A., Chelovekov I., GRB IKI FuN 2022, GRB Coordinates Network, 32819, 1
- Nappo et al. (2014) Nappo F., Ghisellini G., Ghirlanda G., Melandri A., Nava L., Burlon D., 2014, MNRAS, 445, 1625
- Nava (2018) Nava L., 2018, Int. J. Mod. Phys. D, 27, 1842003
- Pillera et al. (2022) Pillera R., Bissaldi E., Omodei N., La Mura G., Longo F., 2022, The Astronomer’s Telegram, 15656, 1
- Piran (2005) Piran T., 2005, Rev. Mod. Phys., 76, 1143
- Troja et al. (2010) Troja E., Rosswog S., Gehrels N., 2010, ApJ, 723, 1711
- Veres et al. (2022) Veres P., Burns E., Bissaldi E., Lesage S., Roberts O., Fermi GBM Team 2022, GRB Coordinates Network, 32636, 1
- Williams et al. (2023) Williams M. A., et al., 2023, arXiv:2302.03642
- Xia et al. (2022) Xia Z.-Q., Wang Y., Yuan Q., Fan Y.-Z., 2022, arXiv:2210.13052
- Zhu (2015) Zhu S., 2015, PhD thesis, Univ. of Maryland