Towards Interpretable and Efficient Automatic Reference-Based Summarization Evaluation
Abstract
Interpretability and efficiency are two important considerations for the adoption of neural automatic metrics. In this work, we develop strong-performing automatic metrics for reference-based summarization evaluation, based on a two-stage evaluation pipeline that first extracts basic information units from one text sequence and then checks the extracted units in another sequence. The metrics we developed include two-stage metrics that can provide high interpretability at both the fine-grained unit level and summary level, and one-stage metrics that achieve a balance between efficiency and interpretability. We make the developed tools publicly available at https://github.com/Yale-LILY/AutoACU.
1 Introduction
Automatic evaluation is an integral part of scaling natural language generation (NLG) system development and evaluation. While neural models have seen great success in NLG systems, their adoption in automatic metric development has been much slower, and classic metrics such as ROUGE Lin (2004) and BLEU Papineni et al. (2002) are still used more often than neural ones Sellam et al. (2020); Zhang* et al. (2020); Yuan et al. (2021). Compared to neural systems, we argue that there are unique requirements for neural metrics to be adopted: (1) interpretability – the metric scores should be interpretable and provide intuitive insights into system performance and system output quality. (2) evaluation efficiency – ideally, the automatic metrics should only introduce a small computation overhead, since it should be possible to use them on the fly for system development and fine-tuning. In this work, we aim to design neural metrics that are more aligned with these requirements, which we believe will facilitate adoption.
Our method focuses on a two-step decomposition of text sequence comparison following related work Bhandari et al. (2020); Zhang and Bansal (2021); Liu et al. (2023) – first dissecting the information in one text sequence into multiple simple facts and then checking the presence of these facts in another text sequence. Specifically, our automatic evaluation pipeline mirrors the human evaluation protocol of Liu et al. (2023), which uses atomic content units, or ACUs, as the simple facts for comparing text sequences. We believe such a two-stage automatic evaluation can be more interpretable and transparent. Specifically, at the ACU level, the evaluation result indicates the presence or absence of an extracted information unit; at the summary level, the aggregated ACU score represents the percentage of information overlap from one text sequence to another. In contrast, it can be difficult to interpret the results of certain neural metrics such as BERTScore Zhang* et al. (2020) or BARTScore Yuan et al. (2021). For example, BARTScore assigns the normalized log-likelihood as the text similarity score, which is non-positive and non-linear, making it difficult to understand the system output quality based on its metric score.
Despite their advantages, such two-stage metrics Deutsch et al. (2021); Zhang and Bansal (2021); Fabbri et al. (2022) can be much slower to run, even slower than the evaluated systems. Therefore, apart from the two-stage evaluation method, we also propose a more efficient one-stage metric that directly predicts the aggregated summary-level scores by training on the recently proposed RoSE Liu et al. (2023) benchmark. The one-stage metric retains the summary-level interpretability as in the two-stage evaluation, striking a balance between efficiency and interpretability. We also explore using the two-stage evaluation as pre-training for the one-stage metric, which further improves performance.
Our contributions can be summarised as: (1) A fine-grained two-stage automatic metric for reference-based summarization evaluation, which provides high interpretability; (2) An efficient one-stage automatic metric, which offers a balance between interpretability and evaluation efficiency; (3) Both types of metrics we developed achieve state-of-the-art performance on summarization evaluation, and we make them publicly available and release them as an easy-to-use Python package.111We provide the metric training scripts and a Python package for trained metrics at https://github.com/Yale-LILY/AutoACU.
2 Preliminaries
Information Similarity for Summarization Evaluation
The most common and important evaluation method of summarization systems is assessing the similarity between system-generated summaries and reference summaries. Since there are no widely accepted definitions of such similarity among the related work Nenkova and Passonneau (2004); Lin (2004); Bhandari et al. (2020); Fabbri et al. (2021); Zhang and Bansal (2021), we refer it as the information similarity in this work – two completely similar text sequences should convey exactly the same information to the users, following the suggestion of Deutsch and Roth (2021).
Automatic Metrics of Information Similarity
Traditional automatic metrics of information similarity compare the lexical overlap of two text sequences, such as ROUGE Lin (2004), BLEU Papineni et al. (2002). In contrast, a family of neural automatic metrics (e.g., BERTScore Zhang* et al. (2020), MoverScore Zhao et al. (2019), BARTScore Yuan et al. (2021)) focus more on semantic similarity by leveraging the pre-trained language models. Neural metrics can also be pre-trained on pseudo training signals Sellam et al. (2020); Zhong et al. (2022) or related corpus Yuan et al. (2021); Gao et al. (2021), or be supervisedly fine-tuned Rei et al. (2020). Apart from the one-stage metrics, related work on two-stage metrics proposes methods of decomposing the evaluation process into finer-grained sub-tasks, such as the QA-based QAEval Deutsch et al. (2021) metric, and the Lite3Pyramid Zhang and Bansal (2021) metric, which automates the evaluation process of LitePyramid Shapira et al. (2019) protocol.
Evaluation of Automatic Metrics
To evaluate information similarity metrics for text summarization, a few human evaluation benchmarks Bhandari et al. (2020); Fabbri et al. (2021); Zhang and Bansal (2021); Liu et al. (2023) have been collected, which contain system-generated summaries and their human evaluation scores. Automatic metric performance is measured by the correlation between the automatic metric scores and human evaluation scores of the system-generated summaries. For text summarization metrics, such correlations can be calculated at the system level and the summary level. More specifically, given input articles and summarization systems, the human evaluation and an automatic metric result in two -row, -column score matrices , respectively. The summary-level correlation is an average of sample-wise correlations:
| (1) |
where , are the evaluation results on the -th data sample and is a function calculating a correlation coefficient (e.g., the Pearson’s correlation coefficient). In contrast, the system-level correlation is calculated on the aggregated system scores:
| (2) |
where and contain entries which are the average system scores across data samples, e.g., .
3 Methods
We first describe our approach of a two-stage decomposition of automatic information similarity evaluation – (1) extracting fine-grained content units from one text sequence; (2) checking the existence of the extracted units in another text sequence. Then we introduce methods of training a one-stage automatic metric for information similarity and using the two-stage decomposition for pre-training.
3.1 Two-Stage Evaluation
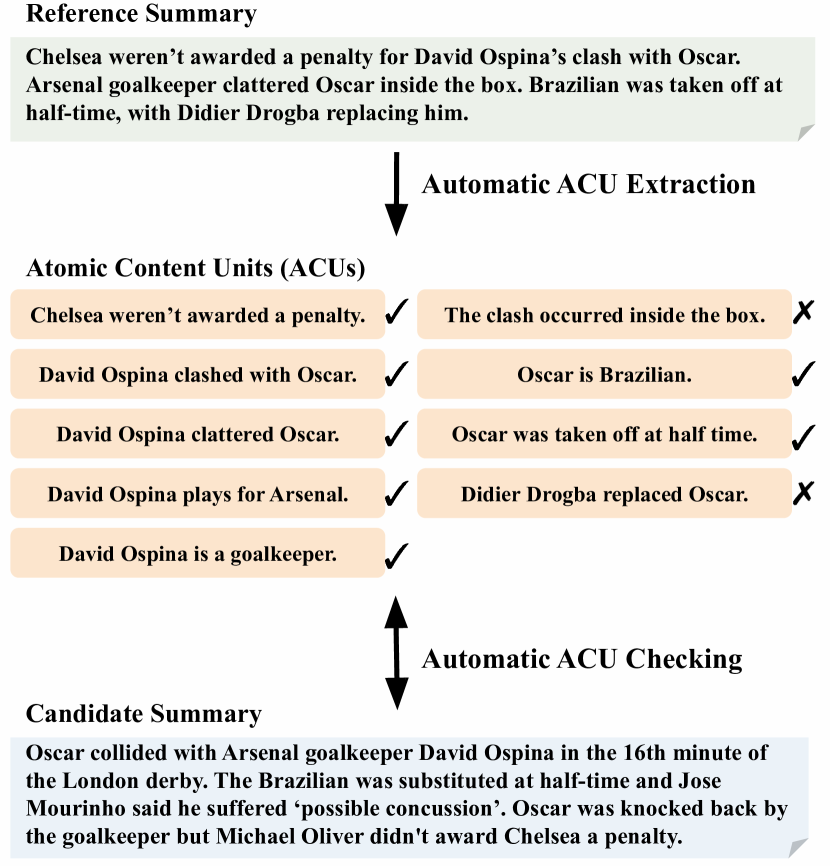
In Fig. 1, we provide an example of the two-stage automatic summarization evaluation process of calculating the recall score of a system-generated summary using the reference summary.
Content Unit Extraction A (long) text sequence can contain more than one fact, or simple information unit. Therefore, we follow Liu et al. (2023) by using Atomic Content Units (ACUs) to refer to the basic information units. We formulate automatic ACU extraction as a sequence-to-sequence (Seq2Seq) problem Sutskever et al. (2014): , where is the input text sequence, is a concatenation of a set of ACUs generated as a sequence, and is a Seq2Seq model.
Content Unit Checking Having extracted a set of ACUs from one text sequence , we use a Natural Langauge Inference (NLI) Gururangan et al. (2018) model to check if the information in an extracted ACU is conveyed by another text sequence :
| (3) |
where is the label of assigned by the model . In addition to this standard NLI setting of viewing as the premise and as the hypothesis, we also explore adding as part of the model input serving as context:
| (4) |
We use BERT Devlin et al. (2019) as the NLI model architecture and follow its input format for the standard setting (Eq. 3), which is a concatenation of and . For the extended setting (Eq. 4), we define the input as a concatenation of , , .
Based on these two stages, we can define a recall information similarity score of w.r.t. :
| (5) |
3.2 One-Stage Metric and Its Pre-Training
To improve evaluation efficiency, we propose using our two-stage approach to generate pre-training data for a more lightweight, one-stage metric. Specifically, we use BERT as the backbone for a scoring model to approximate the two-stage recall score (Eq. 5):
| (6) |
The model is trained with the mean squared error between the target score and the predicted score. The input format is “[CLS][SEP][SEP]” following Devlin et al. (2019), and a single linear layer is introduced to map the hidden representation of “[SEP]” into the predicted numeral score. We can also define an F1 score as
| (7) |
Pre-training Corpora As shown by Sellam et al. (2020), the robustness of automatic metrics can be improved by pre-training with synthetic pre-training data. We further extend this approach following the finding of related work Liu and Liu (2021); Liu et al. (2022), which shows that pre-trained summarization models such as BART can generate diverse and high-quality candidate summaries and summarization models can benefit from contrastive learning with the generated candidates. In a similar spirit, we construct the pre-training corpora on the existing summarization datasets such as CNN/DailyMail Nallapati et al. (2016), and for each data example we generate multiple candidate summaries using a fine-tuned summarization model. The generated summaries are then scored by the two-stage evaluation method (Eq. 5), which are used for the pre-training of one-stage model .
4 Experiments
4.1 Experimental Settings
Datasets
We mainly use a recently-introduced summarization evaluation benchmark, RoSE Liu et al. (2023), for automatic metric development and evaluation. It contains human evaluation recall scores of the system-generated summaries based on the reference summaries w.r.t. the information similarity on three summarization datasets, CNN/DailyMail (CNNDM) Nallapati et al. (2016), XSum Narayan et al. (2018), and SamSum Gliwa et al. (2019). The human evaluation is conducted following the ACU evaluation protocol Liu et al. (2023), and the dataset also provides human-written ACUs on the reference summaries and the associated results (ACU labels) of checking the ACUs against system-generated summaries. The statistics are in Tab. 1.
| Dataset | Split | #Doc. | #Sys. | #ACU | #Summ. |
| CNNDM | Test | 500 | 12 | 5.6k | 6k |
| CNNDM | Valid | 1,000 | 8 | 11.6k | 8k |
| XSum | Test | 500 | 8 | 2.3k | 4k |
| SamSum | Test | 500 | 8 | 2.3k | 4k |
Baseline Metrics
We compare our methods with related automatic metrics for text sequence comparison. Since the RoSE benchmark provides recall information similarity scores, only metrics with recall scores are compared.
ROUGE Lin (2004) compares two text sequences by the -grams overlap between them. We report the performance of its ROUGE-1/2/L variants.
BERTScore Zhang* et al. (2020) measures text sequence similarity using hidden representations computed by pre-trained language models such as BERT Devlin et al. (2019). We report its variants with RoBERTa Liu et al. (2019) (BERTScoreR) and DeBERTa He et al. (2021) (BERTScoreD).
BARTScore Yuan et al. (2021) interprets the similarity of text sequence to as the probability of given predicted by a pre-trained language model such as BART Lewis et al. (2020). We report its variants pre-trained on CNNDM (BARTScoreC) and ParaBank2 Hu et al. (2019) (BARTScoreP).
QAEval Deutsch et al. (2021) measures information similarity by question answering accuracy. We report both its exact match score (QAEvalEM) and F1 score (QAEvalF1).
Lite3Pyramid Zhang and Bansal (2021) introduces a similar approach as our two-stage evaluation but uses a semantic role labeling He et al. (2017) model to extract content units. We report its variants that use the predicted label (Lite3PyramidL) and probability (Lite3PyramidP) of the two-class NLI model.
| CNNDM | XSum | SamSum | ||||
| Sys. | Sum. | Sys. | Sum. | Sys. | Sum. | |
| ROUGE1 | .788 | .468 | .714 | .293 | .929 | .439 |
| ROUGE2 | .758 | .453 | .643 | .266 | 1.00 | .395 |
| ROUGEL | .879 | .454 | .643 | .258 | .929 | .415 |
| BERTScoreR | .515 | .448 | .571 | .277 | .857 | .417 |
| BERTScoreD | .424 | .424 | .571 | .262 | .857 | .409 |
| BARTScoreC | .727 | .435 | .643 | .260 | .929 | .438 |
| BARTScoreP | .727 | .453 | .714 | .282 | .929 | .430 |
| QAEvalEM | .515 | .296 | .357 | .149 | .857 | .352 |
| QAEvalF1 | .849 | .358 | .429 | .198 | .929 | .384 |
| Lite3PyramidL | .849 | .466 | .643 | .207 | 1.00 | .494 |
| Lite3PyramidP | .849 | .452 | .714 | .245 | 1.00 | .467 |
| A2CUP | .879 | .521† | .786 | .336† | 1.00 | .532† |
| A2CUF | .818 | .557† | .786 | .348† | 1.00 | .556† |
| A2CUFC | .879 | .555† | .214 | .202 | .571 | .275 |
| A3CUF | .909 | .493† | .786 | .299 | .929 | .445 |
| A3CUP | .879 | .558† | .786 | .307 | .929 | .472 |
| A3CUPF | .879 | .564† | .786 | .319† | .929 | .474 |
Implementation Details
For the two-stage evaluation, the ACU extraction model is based on a T0 Sanh et al. (2022) model222huggingface.co/bigscience/T0_3B fine-tuned on the human-written ACUs provided in RoSE. As for the NLI model for ACU checking (Eq. 3&4), we use a pre-trained DeBERTa He et al. (2021) NLI model333https://huggingface.co/microsoft/deberta-xlarge-mnli. as the start point and further fine-tune it on the RoSE dataset with the available gold standard ACU labels. We name the two-stage method A2CU (AutoACU), and it has three variants in total: A2CUP is with the pre-trained NLI model, A2CUF is with the fine-tuned NLI model (Eq. 3), A2CUFC is with the fine-tuned NLI model taking the source text as part of the input.
For the pre-training of one-stage metric, we use system-generated summaries generated by a pre-trained BART model on the CNNDM dataset. For each data example, 12 summaries are scored by the two-stage evaluation method and used to pre-train the one-stage metric. After the pre-training, the one-stage metric can be further fine-tuned on the gold-standard scores. We name the one-stage metric as A3CU (AcceleratedAutoACU), and it has three variants: A3CUF is directly fine-tuned on RoSE, A3CUP is pre-trained with A2CU only, A3CUPF is first pre-trained then fine-tuned. We note that the training on the RoSE dataset is performed on the validation split of CNNDM. Regarding metric efficiency, A3CU takes only 6% the inference time of A2CU, demonstrating its superior efficiency. More details are in Appendix A.
| CNNDM | XSum | SamSum | ||||
| Sys. | Sum. | Sys. | Sum. | Sys. | Sum. | |
| SemiA2CU | .849 | .647 | .786 | .450 | 1.00 | .621 |
| A2CUF | .818 | .557 | .786 | .348 | 1.00 | .556 |
4.2 Results
We report the results in Tab. 2. Kendall’s correlation coefficients are used to evaluate the metric performance at both the system and summary levels, which shows the following: (1) Both our two-stage and one-stage metrics can outperform the baseline methods across three datasets. (2) The improvement of our metrics is more significant at the summary level than at the system level. (3) Compared with the one-stage metrics, our two-stage metrics generalize better on XSum and SamSum datasets. (4) The pre-training is effective for the one-stage metric to achieve strong performance since A3CUP can outperform A3CUF at the summary level without fine-tuning on the RoSE dataset.
4.3 Analysis
| Dataset | Precision | Recall | F1 |
| CNNDM | 83.63 | 79.84 | 81.69 |
| XSum | 80.11 | 79.14 | 79.62 |
| SamSUM | 87.01 | 87.14 | 87.08 |
Performance Analysis of A2CU
We compare A2CU performance with SemiA2CU, a semi-automatic metric that follows the same scoring mechanism but uses the reference ACUs as the NLI model input (Eq. 3). Results in Tab. 3 show that using the reference ACUs yields better performance, suggesting that better generated ACU quality may lead to further improvement. To analyze this quality, we calculate its similarity with reference ACUs using ROUGE scores between them in a greedy-matching manner. Specifically, given a set of generated ACUs and reference ACUs , we calculate the example-level recall score as:
| (8) |
Similarly, we can define the precision score and F1 score. The results on three dataset splits are reported in Tab. 4, showing a high degree of similarity between the reference and generated ACUs.
Comparative Study of A3CU
| CNNDM | XSum | SamSum | ||||
| Sys. | Sum. | Sys. | Sum. | Sys. | Sum. | |
| A3CU-B | .879 | .558 | .786 | .315 | .929 | .467 |
| A3CU-R | .879 | .483 | .643 | .290 | .929 | .429 |
| A3CU | .879 | .564 | .786 | .319 | .929 | .474 |
We investigate the impact of two design decisions for the one-stage metric, the model size, and the supervision signal used in pre-training. To this end, we show metric performance with two model sizes and the metric performance when it is pre-trained to predict the average score of ROUGE-1/2/L. The results in Tab. 5 suggest that larger model sizes and more suitable pre-training can improve metric performance.
Evaluation on Other Related Benchmarks We provide additional evaluation results of our F1-based automatic metrics (e.g., Eq. 7) in Appendix B. Apart from RoSE, we evaluate the metrics on two related benchmarks, the STS (Semantic Textual Similarity) benchmark Cer et al. (2017) and WMT19 Metrics Shared Task daRR benchmark Ma et al. (2019), which provides a more comprehensive investigation of the generalization ability of our proposed metrics.
5 Conclusions
We develop high-performing reference-based summarization automatic metrics, including two-stage metrics providing fine-grained interpretability and one-stage metrics for a balance between efficiency and interpretability. Furthermore, we show that the two-stage metric can be used to effectively pre-train the one-stage metric, helping to mitigate the data scarcity in developing automatic metrics.
Acknowledgements
We are grateful to the anonymous reviewers for their constructive comments. We thank Arman Cohan for insightful discussions and suggestions.
Limitations
Our metrics are developed and evaluated on English corpora only, and it remains unclear whether the metrics can achieve consistent performance in other languages. The two-stage metrics we proposed are based on relatively large language models and it can be time-consuming and computationally expensive to use them, especially on large corpora.
References
- Bhandari et al. (2020) Manik Bhandari, Pranav Narayan Gour, Atabak Ashfaq, Pengfei Liu, and Graham Neubig. 2020. Re-evaluating evaluation in text summarization. In Proceedings of the 2020 Conference on Empirical Methods in Natural Language Processing (EMNLP), pages 9347–9359, Online. Association for Computational Linguistics.
- Cer et al. (2017) Daniel Cer, Mona Diab, Eneko Agirre, Iñigo Lopez-Gazpio, and Lucia Specia. 2017. SemEval-2017 task 1: Semantic textual similarity multilingual and crosslingual focused evaluation. In Proceedings of the 11th International Workshop on Semantic Evaluation (SemEval-2017), pages 1–14, Vancouver, Canada. Association for Computational Linguistics.
- Deutsch et al. (2021) Daniel Deutsch, Tania Bedrax-Weiss, and Dan Roth. 2021. Towards question-answering as an automatic metric for evaluating the content quality of a summary. Transactions of the Association for Computational Linguistics, 9:774–789.
- Deutsch and Roth (2021) Daniel Deutsch and Dan Roth. 2021. Understanding the extent to which content quality metrics measure the information quality of summaries. In Proceedings of the 25th Conference on Computational Natural Language Learning, pages 300–309, Online. Association for Computational Linguistics.
- Devlin et al. (2019) Jacob Devlin, Ming-Wei Chang, Kenton Lee, and Kristina Toutanova. 2019. BERT: Pre-training of deep bidirectional transformers for language understanding. In Proceedings of the 2019 Conference of the North American Chapter of the Association for Computational Linguistics: Human Language Technologies, Volume 1 (Long and Short Papers), pages 4171–4186, Minneapolis, Minnesota. Association for Computational Linguistics.
- Fabbri et al. (2022) Alexander Fabbri, Chien-Sheng Wu, Wenhao Liu, and Caiming Xiong. 2022. QAFactEval: Improved QA-based factual consistency evaluation for summarization. In Proceedings of the 2022 Conference of the North American Chapter of the Association for Computational Linguistics: Human Language Technologies, pages 2587–2601, Seattle, United States. Association for Computational Linguistics.
- Fabbri et al. (2021) Alexander R. Fabbri, Wojciech Kryściński, Bryan McCann, Caiming Xiong, Richard Socher, and Dragomir Radev. 2021. SummEval: Re-evaluating Summarization Evaluation. Transactions of the Association for Computational Linguistics, 9:391–409.
- Gao et al. (2021) Tianyu Gao, Xingcheng Yao, and Danqi Chen. 2021. SimCSE: Simple contrastive learning of sentence embeddings. In Proceedings of the 2021 Conference on Empirical Methods in Natural Language Processing, pages 6894–6910, Online and Punta Cana, Dominican Republic. Association for Computational Linguistics.
- Gliwa et al. (2019) Bogdan Gliwa, Iwona Mochol, Maciej Biesek, and Aleksander Wawer. 2019. SAMSum corpus: A human-annotated dialogue dataset for abstractive summarization. In Proceedings of the 2nd Workshop on New Frontiers in Summarization, pages 70–79, Hong Kong, China. Association for Computational Linguistics.
- Gururangan et al. (2018) Suchin Gururangan, Swabha Swayamdipta, Omer Levy, Roy Schwartz, Samuel Bowman, and Noah A. Smith. 2018. Annotation artifacts in natural language inference data. In Proceedings of the 2018 Conference of the North American Chapter of the Association for Computational Linguistics: Human Language Technologies, Volume 2 (Short Papers), pages 107–112, New Orleans, Louisiana. Association for Computational Linguistics.
- He et al. (2017) Luheng He, Kenton Lee, Mike Lewis, and Luke Zettlemoyer. 2017. Deep semantic role labeling: What works and what’s next. In Proceedings of the 55th Annual Meeting of the Association for Computational Linguistics (Volume 1: Long Papers), pages 473–483, Vancouver, Canada. Association for Computational Linguistics.
- He et al. (2021) Pengcheng He, Xiaodong Liu, Jianfeng Gao, and Weizhu Chen. 2021. Deberta: Decoding-enhanced bert with disentangled attention. In International Conference on Learning Representations.
- Hu et al. (2019) J. Edward Hu, Abhinav Singh, Nils Holzenberger, Matt Post, and Benjamin Van Durme. 2019. Large-scale, diverse, paraphrastic bitexts via sampling and clustering. In Proceedings of the 23rd Conference on Computational Natural Language Learning (CoNLL), pages 44–54, Hong Kong, China. Association for Computational Linguistics.
- Lewis et al. (2020) Mike Lewis, Yinhan Liu, Naman Goyal, Marjan Ghazvininejad, Abdelrahman Mohamed, Omer Levy, Veselin Stoyanov, and Luke Zettlemoyer. 2020. BART: Denoising sequence-to-sequence pre-training for natural language generation, translation, and comprehension. In Proceedings of the 58th Annual Meeting of the Association for Computational Linguistics, pages 7871–7880, Online. Association for Computational Linguistics.
- Lin (2004) Chin-Yew Lin. 2004. ROUGE: A package for automatic evaluation of summaries. In Text Summarization Branches Out, pages 74–81, Barcelona, Spain. Association for Computational Linguistics.
- Liu et al. (2019) Yinhan Liu, Myle Ott, Naman Goyal, Jingfei Du, Mandar Joshi, Danqi Chen, Omer Levy, Mike Lewis, Luke Zettlemoyer, and Veselin Stoyanov. 2019. Roberta: A robustly optimized bert pretraining approach. ArXiv, abs/1907.11692.
- Liu et al. (2023) Yixin Liu, Alexander R. Fabbri, Pengfei Liu, Yilun Zhao, Linyong Nan, Ruilin Han, Simeng Han, Shafiq R. Joty, Chien-Sheng Wu, Caiming Xiong, and Dragomir R. Radev. 2023. Revisiting the gold standard: Grounding summarization evaluation with robust human evaluation. In Proceedings of the 61th Annual Meeting of the Association for Computational Linguistics.
- Liu and Liu (2021) Yixin Liu and Pengfei Liu. 2021. SimCLS: A simple framework for contrastive learning of abstractive summarization. In Proceedings of the 59th Annual Meeting of the Association for Computational Linguistics and the 11th International Joint Conference on Natural Language Processing (Volume 2: Short Papers), pages 1065–1072, Online. Association for Computational Linguistics.
- Liu et al. (2022) Yixin Liu, Pengfei Liu, Dragomir Radev, and Graham Neubig. 2022. BRIO: Bringing order to abstractive summarization. In Proceedings of the 60th Annual Meeting of the Association for Computational Linguistics (Volume 1: Long Papers), pages 2890–2903, Dublin, Ireland. Association for Computational Linguistics.
- Ma et al. (2019) Qingsong Ma, Johnny Wei, Ondřej Bojar, and Yvette Graham. 2019. Results of the WMT19 metrics shared task: Segment-level and strong MT systems pose big challenges. In Proceedings of the Fourth Conference on Machine Translation (Volume 2: Shared Task Papers, Day 1), pages 62–90, Florence, Italy. Association for Computational Linguistics.
- Nallapati et al. (2016) Ramesh Nallapati, Bowen Zhou, Cicero dos Santos, Caglar Gulcehre, and Bing Xiang. 2016. Abstractive text summarization using sequence-to-sequence RNNs and beyond. In Proceedings of The 20th SIGNLL Conference on Computational Natural Language Learning, pages 280–290, Berlin, Germany. Association for Computational Linguistics.
- Narayan et al. (2018) Shashi Narayan, Shay B. Cohen, and Mirella Lapata. 2018. Don’t give me the details, just the summary! topic-aware convolutional neural networks for extreme summarization. In Proceedings of the 2018 Conference on Empirical Methods in Natural Language Processing, pages 1797–1807, Brussels, Belgium. Association for Computational Linguistics.
- Nenkova and Passonneau (2004) Ani Nenkova and Rebecca Passonneau. 2004. Evaluating content selection in summarization: The pyramid method. In Proceedings of the Human Language Technology Conference of the North American Chapter of the Association for Computational Linguistics: HLT-NAACL 2004, pages 145–152, Boston, Massachusetts, USA. Association for Computational Linguistics.
- Papineni et al. (2002) Kishore Papineni, Salim Roukos, Todd Ward, and Wei-Jing Zhu. 2002. Bleu: a method for automatic evaluation of machine translation. In Proceedings of the 40th Annual Meeting of the Association for Computational Linguistics, pages 311–318, Philadelphia, Pennsylvania, USA. Association for Computational Linguistics.
- Rei et al. (2020) Ricardo Rei, Craig Stewart, Ana C Farinha, and Alon Lavie. 2020. COMET: A neural framework for MT evaluation. In Proceedings of the 2020 Conference on Empirical Methods in Natural Language Processing (EMNLP), pages 2685–2702, Online. Association for Computational Linguistics.
- Reimers et al. (2016) Nils Reimers, Philip Beyer, and Iryna Gurevych. 2016. Task-oriented intrinsic evaluation of semantic textual similarity. In Proceedings of COLING 2016, the 26th International Conference on Computational Linguistics: Technical Papers, pages 87–96, Osaka, Japan. The COLING 2016 Organizing Committee.
- Sanh et al. (2022) Victor Sanh, Albert Webson, Colin Raffel, Stephen Bach, Lintang Sutawika, Zaid Alyafeai, Antoine Chaffin, Arnaud Stiegler, Arun Raja, Manan Dey, M Saiful Bari, Canwen Xu, Urmish Thakker, Shanya Sharma Sharma, Eliza Szczechla, Taewoon Kim, Gunjan Chhablani, Nihal Nayak, Debajyoti Datta, Jonathan Chang, Mike Tian-Jian Jiang, Han Wang, Matteo Manica, Sheng Shen, Zheng Xin Yong, Harshit Pandey, Rachel Bawden, Thomas Wang, Trishala Neeraj, Jos Rozen, Abheesht Sharma, Andrea Santilli, Thibault Fevry, Jason Alan Fries, Ryan Teehan, Teven Le Scao, Stella Biderman, Leo Gao, Thomas Wolf, and Alexander M Rush. 2022. Multitask prompted training enables zero-shot task generalization. In International Conference on Learning Representations.
- Sellam et al. (2020) Thibault Sellam, Dipanjan Das, and Ankur Parikh. 2020. BLEURT: Learning robust metrics for text generation. In Proceedings of the 58th Annual Meeting of the Association for Computational Linguistics, pages 7881–7892, Online. Association for Computational Linguistics.
- Shapira et al. (2019) Ori Shapira, David Gabay, Yang Gao, Hadar Ronen, Ramakanth Pasunuru, Mohit Bansal, Yael Amsterdamer, and Ido Dagan. 2019. Crowdsourcing lightweight pyramids for manual summary evaluation. In Proceedings of the 2019 Conference of the North American Chapter of the Association for Computational Linguistics: Human Language Technologies, Volume 1 (Long and Short Papers), pages 682–687, Minneapolis, Minnesota. Association for Computational Linguistics.
- Sutskever et al. (2014) Ilya Sutskever, Oriol Vinyals, and Quoc V. Le. 2014. Sequence to sequence learning with neural networks. In Proceedings of the 27th International Conference on Neural Information Processing Systems - Volume 2, NIPS’14, page 3104–3112, Cambridge, MA, USA. MIT Press.
- Yuan et al. (2021) Weizhe Yuan, Graham Neubig, and Pengfei Liu. 2021. BARTScore: Evaluating generated text as text generation. In Advances in Neural Information Processing Systems.
- Zhang and Bansal (2021) Shiyue Zhang and Mohit Bansal. 2021. Finding a balanced degree of automation for summary evaluation. In Proceedings of the 2021 Conference on Empirical Methods in Natural Language Processing, pages 6617–6632, Online and Punta Cana, Dominican Republic. Association for Computational Linguistics.
- Zhang* et al. (2020) Tianyi Zhang*, Varsha Kishore*, Felix Wu*, Kilian Q. Weinberger, and Yoav Artzi. 2020. Bertscore: Evaluating text generation with bert. In International Conference on Learning Representations.
- Zhao et al. (2019) Wei Zhao, Maxime Peyrard, Fei Liu, Yang Gao, Christian M. Meyer, and Steffen Eger. 2019. MoverScore: Text generation evaluating with contextualized embeddings and earth mover distance. In Proceedings of the 2019 Conference on Empirical Methods in Natural Language Processing and the 9th International Joint Conference on Natural Language Processing (EMNLP-IJCNLP), pages 563–578, Hong Kong, China. Association for Computational Linguistics.
- Zhong et al. (2022) Ming Zhong, Yang Liu, Da Yin, Yuning Mao, Yizhu Jiao, Pengfei Liu, Chenguang Zhu, Heng Ji, and Jiawei Han. 2022. Towards a unified multi-dimensional evaluator for text generation. In Proceedings of the 2022 Conference on Empirical Methods in Natural Language Processing, pages 2023–2038, Abu Dhabi, United Arab Emirates. Association for Computational Linguistics.
Appendix A Experiment Details
For the two-stage evaluation, the ACU extraction model is a T0 model containing 3 billion parameters, and the ACU checking model is a pre-trained DeBERTa model with 750 million parameters. Our one-stage metric is based on BERT, and its two variants have 340 and 110 million parameters respectively. We conduct experiments on NVIDIA RTX A6000 GPUs, and the experiments take around 30 GPU hours to finish.
Inference Efficiency
In Tab. 6 we compare the inference time of A3CU and A2CU. A3CU only takes around 6% of the inference time of A2CU.
| Dataset | A2CU-Stage1 | A2CU-Stage2 | A3CU |
| CNNDM | 21.3 | 14.7 | 2.34 |
| XSum | 9.4 | 1.9 | 0.56 |
| SamSUM | 9.3 | 1.9 | 0.69 |
Appendix B Evaluation on Related Information Similarity Benchmark
Apart from the RoSE benchmark, we evaluate metric performances on two related benchmarks for assessing the information similarity between two text sequences: the STS (Semantic Textual Similarity) benchmark Cer et al. (2017) and the human evaluation results from the WMT19 Metrics Shared Task Ma et al. (2019).
STS Benchmark
STS benchmark444The data is provided at http://ixa2.si.ehu.eus/stswiki/index.php/STSbenchmark. contains English sentence pairs and the associated human-annotated semantic similarity scores Cer et al. (2017), which has a similar evaluation target as the information similarity for text summarization evaluation. With this benchmark, the semantic similarity metrics are evaluated by the correlation between the predicted similarity scores and the reference scores. Following the previous work Gao et al. (2021); Reimers et al. (2016), we report Spearman’s correlation coefficients on the test split of the benchmark containing around 1.5k data examples. Since the metrics we evaluated previously are not designed specifically for the STS task, we compare another metric, SimCSE Gao et al. (2021), which achieves strong performance on this task.
WMT19 daRR Benchmark
This benchmark contains human-annotated scores of system-generated translations Ma et al. (2019). We use only the to-English part of the benchmark, which results from reference-based direct assessment (DA) of translation quality. The human-annotated DA scores are then transformed into relative rankings between two translations, i.e., the daRR scores.555We use the pre-processed data provided by Rei et al. (2020) at https://github.com/Unbabel/COMET/. We follow the evaluation setting of Ma et al. (2019) by using Kendall’s Tau-like correlation to evaluate the segement-level performance of automatic metrics. The benchmark contains the translations from seven languages to English and results in around 21k translated sentence pairs.
Apart from these two benchmarks, we also report the metric performance under normalized ACU scores in RoSE, which are decorrelated with summary lengths to evaluate F1-based metrics Liu et al. (2023). We note that unlike in §4.2, all the metrics compared here are F1-based. In particular, for A3CU we follow Eq. 7 to calculate the F1 scores. The two-stage metrics including A2CU are not reported because of their lower efficiency.
| STS | WMT | CNNDM | XSum | SamSum | |
| ROUGE1 | .578 | .105 | .403 | .278 | .399 |
| ROUGE2 | .452 | .071 | .375 | .253 | .343 |
| ROUGEL | .556 | .113 | .378 | .252 | .365 |
| BERTScoreR | .569 | .254 | .386 | .280 | .401 |
| BERTScoreD | .523 | .259 | .386 | .274 | .401 |
| BARTScoreC | .607 | .254 | .296 | .228 | .341 |
| BARTScoreP | .695 | .266 | .342 | .259 | .371 |
| SimCSE | .827 | .235 | .300 | .255 | .356 |
| A3CUP | .731 | .209 | .447 | .298 | .418 |
| A3CUPF | .787 | .220 | .463 | .316 | .427 |
The results in Tab. 7 show that:
(1) While the compared metrics have a similar evaluation target, i.e., information similarity between text sequences, their performance varies across different benchmarks and there is no single metric that can consistently outperform others. A similar finding in Ma et al. (2019) shows that Pearson’s correlation between human-annotated cross-lingual STS scores and machine translation quality estimation scores is only 0.41.
(2) On the STS benchmark, A3CU outperforms other metrics except for SimCSE which is specifically designed for the STS task, which we believe results from A3CU’s better interpretability thanks to its underlying evaluation process. Specifically, A3CU’s computed scores directly indicate the information overlap between text sequences, which is close to the definition of the STS task.
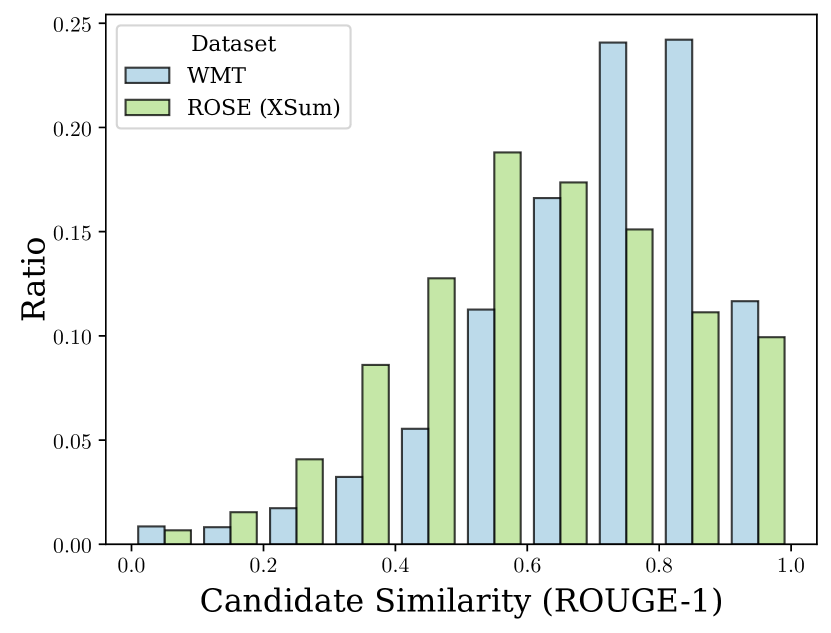
(3) On the WMT benchmark, A3CU fails to outperform BERTScore and BARTScore. We hypothesize this is because A3CU is relatively insensitive to the minor differences in candidate translations when implicitly comparing them based on the same reference translation as we found that the system-generated translations in the WMT benchmark have higher similarity than the system-generated summaries in the RoSE benchmark. Specifically, while both RoSE and WMT19 daRR benchmarks contain reference-based human annotations of candidate output quality, we note that they have different data distributions. In detail, the system-generated translations of the same source sentence in the WMT benchmark have higher similarities than the system-generated summaries of the same source articles. We visualize this discrepancy in Fig. 2, which shows the similarity (as evaluated by ROUGE-1) between different candidate outputs (of the same example) on WMT19 daRR benchmark and the XSum test split666We chose XSum split because it contains one-sentence news article summaries, which is similar to the data format of the WMT19 benchmark. of RoSE benchmark. As illustrated by the figure, candidates in WMT19 benchmark are more similar, which can lead to the performance difference when the same automatic metric is evaluated on these two benchmarks.