Long-term changes in solar activity and irradiance
The Sun is the main energy source to Earth, and understanding its variability is of direct relevance to climate studies. Measurements of total solar irradiance (TSI) exist since 1978, but this is too short compared to climate-relevant time scales. Coming from a number of different instruments, these measurements require a cross-calibration, which is not straightforward, and thus several composite records have been created. All of them suggest a marginally decreasing secular trend in solar minima levels since 1996. Most composites actually feature a weak decrease over the entire period of observations, which is also seen in observations of the solar surface magnetic field and is further supported by Ca ii K data. Some inconsistencies, however, remain and overall the magnitude and even the presence of the secular change over the satellite era remain uncertain. Different models have been developed, which are used to understand the irradiance variability over the satellite period and to extend the records of solar irradiance back in time. Differing in their methodologies, all models require proxies of solar magnetic activity as input. The most widely used proxies are sunspot records and cosmogenic isotope data on centennial and millennial time scale, respectively. None of this, however, offers a sufficiently good, independent description of the long-term evolution of faculae and network responsible for solar brightening. This leads to significant uncertainties in the amplitude of the changes in solar irradiance on time scales longer than the solar cycle. Here we review recent efforts and advances aiming at improving long-term irradiance reconstructions and to reduce the existing uncertainty in the magnitude of the long-term variability. In particular, by employing state-of-the-art 3D magnetohydrodynamical simulations, an upper limit of W m-2 was set on the possible increase of TSI since the end of the Maunder minimum as compared to the 2019 minimum level. Besides, significant progress has been made in collecting and processing historical solar observation in Ca ii K spectral line, which provide direct information on bright magnetic features on the Sun and can be used to improve the accuracy of past irradiance reconstructions, pending some remaining issues with the data.
Key Words.:
solar irradiance, solar activity1 Introduction
In view of the recent rapid global warming of Earth (IPCC, 2021), understanding mechanisms driving the climate variability is a challenging while pressing endeavour. Being the dominant supplier of energy to Earth (see, e.g., Kren et al., 2017), the Sun is also one of the main actors. Various mechanisms of solar influence on Earth’s climate have been proposed, which involve variability in the total and spectral solar irradiance, as well as fluctuations in the fluxes of the galactic cosmic rays (GCRs) and solar energetic particles (SEPs) (see, e.g., Haigh, 2007; Gray et al., 2010; Lockwood, 2012, for reviews).
The total solar irradiance (TSI) is the spectrally integrated radiative energy flux incident on the top of the Earth’s atmosphere at the mean Sun–Earth distance of 1 a.u., and it describes the total radiative energy of the Sun received by Earth’s system. TSI has been regularly monitored from space since the late 1970s and was found to vary on all time scales covered by direct measurements (e.g. Hickey et al., 1980; Willson & Hudson, 1988; Fröhlich, 2006, 2012; Kopp et al., 2016). It is also expected to vary on longer time scales. For example, from sunspot observations and cosmogenic isotope data we know that the Sun was in a state of enhanced activity (called Modern grand maximum) over the second half of the 20th century (Solanki et al., 2004; Chatzistergos et al., 2017; Usoskin, 2023), while solar activity was somewhat lower during the period called Dalton minimum (1790–-1820; Usoskin, 2023; Hayakawa et al., 2021b) and considerably lower during the Maunder minimum (1645–-1715; Eddy, 1976; Usoskin et al., 2015). The Maunder minimum and the Modern grand maximum are the only so-called grand extrema of solar activity, which are covered by direct solar observations, while concentrations of cosmogenic isotopes evidence the existence of other such events in the past (Usoskin et al., 2021b; Usoskin, 2023). On time scales relevant to climate studies, the driver of the irradiance variability is the solar surface magnetic field (Krivova et al., 2003; Domingo et al., 2009; Shapiro et al., 2017; Yeo et al., 2017).
The variability strongly depends on the wavelength, growing considerably towards the UV part of the spectrum (Rottman, 1988; Floyd et al., 2003). The solar radiative energy flux per unit wavelength or within a given spectral interval is called spectral solar irradiance (SSI). SSI has also been monitored over roughly the same period, although with significant gaps in the wavelength and temporal coverage (Ermolli et al., 2013; DeLand et al., 2019; Woods et al., 2021, and references therein). While the longwave (mainly visible and infrared, but also parts of UV above 320 nm) radiation penetrates down to the lower layers of the atmosphere and the surface, heating these directly, the UV irradiance heats the upper and middle terrestrial atmosphere and plays a critical role in chemical processes there. The signal penetrates down to the lower layers through dynamical coupling mechanisms (Haigh, 1994, 2007; Gray et al., 2010).
Not only solar radiation can influence the terrestrial atmosphere and climate. Also SEPs affect the ionisation state and thus the chemical processes in the upper and middle atmosphere (see, e.g., the reviews by Sinnhuber et al., 2012; Sinnhuber & Funke, 2020; Mironova et al., 2015, and references therein). Furthermore, yet more energetic GCR particles can penetrate down to the lower layers of the atmosphere (lower stratosphere and the troposphere). Although the link between the GCR-caused ionisation of the lower atmosphere and cloud formation has been speculated it has not been confirmed (Kulmala et al., 2010; Laken et al., 2009; Pierce & Adams, 2009; Laken et al., 2012; Čalogović et al., 2010), while results from the Cosmics Leaving OUtdoor Droplets (CLOUD) experiment in CERN (Dunne et al., 2016; Pierce, 2017) suggest that GCRs do not have any appreciable effect on cloud formation. The GCR flux at Earth is modulated by the solar magnetic field, being weaker at higher activity, in contrast to the flux of energetic particles originating from the Sun itself.
Whichever of these mechanisms or their combination are in play, the fundamental driver of all these changes is the solar magnetic field. Thus understanding the long-term changes of the solar surface magnetic field and solar magnetic activity is key to understanding the solar influence on Earth’s climate. This review provides a short update on the recent efforts to reconstruct past solar magnetic activity. We focus on the recovery and reconstructions of long-term solar activity proxies, such as sunspot and Ca ii K plage observations, as well as constraining the long-term changes in solar irradiance.
In Sect. 2 we discuss measurements of solar irradiance and solar surface magnetic field over the satellite era. We give an overview of the various irradiance reconstructions and proxies of past solar magnetic activity used by these reconstructions in Sect. 3, while in Sect. 4 we briefly describe the recent model constraining the possible range of solar irradiance variations. Finally, in Sect. 5 we summarise and draw our conclusions.
2 Satellite era
2.1 TSI measurements and their composites
While the links between solar activity and Earth’s climate have been speculated for a long time (Herschel, 1801; Eddy, 1976, cf. Love 2013; Chatzistergos 2023), quantitative studies have basically started with the realisation that the “solar constant”, as TSI was called at earlier times, was not constant. This only became possible with the start of space-borne monitoring of solar irradiance in 1978 (Hickey et al., 1980; Willson, 1981; Willson & Hudson, 1981). These measurements revealed variability on all observable time scales, most prominent being the short-term (time scales of days to weeks) fluctuations with amplitudes of up to 0.3% and the variability in phase with the solar activity cycle by roughly 0.1% during the last decades covered by satellite data (Willson & Hudson, 1991; Fröhlich, 2009, 2012; Kopp et al., 2016). Being nearly continuous since 1978, space-borne TSI measurements were not carried out by a single instrument, but by multiple partially overlapping experiments (see, e.g., Kopp, 2014, 2016; Montillet et al., 2022). Due to different absolute scales (Kopp et al., 2012), various instrument-specific degradations (Fröhlich et al., 1997; Fröhlich, 2000, 2006; Dewitte et al., 2004b; Kopp, 2021), or continuity issues (e.g., Lee III et al., 1995; Krivova et al., 2009a, see also the review by Zacharias 2014), cross-calibration of the individual data and construction of a continuous composite is non-trivial. A lot of effort went into this task, which are extensively discussed elsewhere (e.g., Willson & Mordvinov, 2003; Dewitte et al., 2004b; Fröhlich, 2006; Kopp, 2014; Zacharias, 2014; Dudok de Wit et al., 2017; Montillet et al., 2022). Here, we will only briefly summarise the current status.
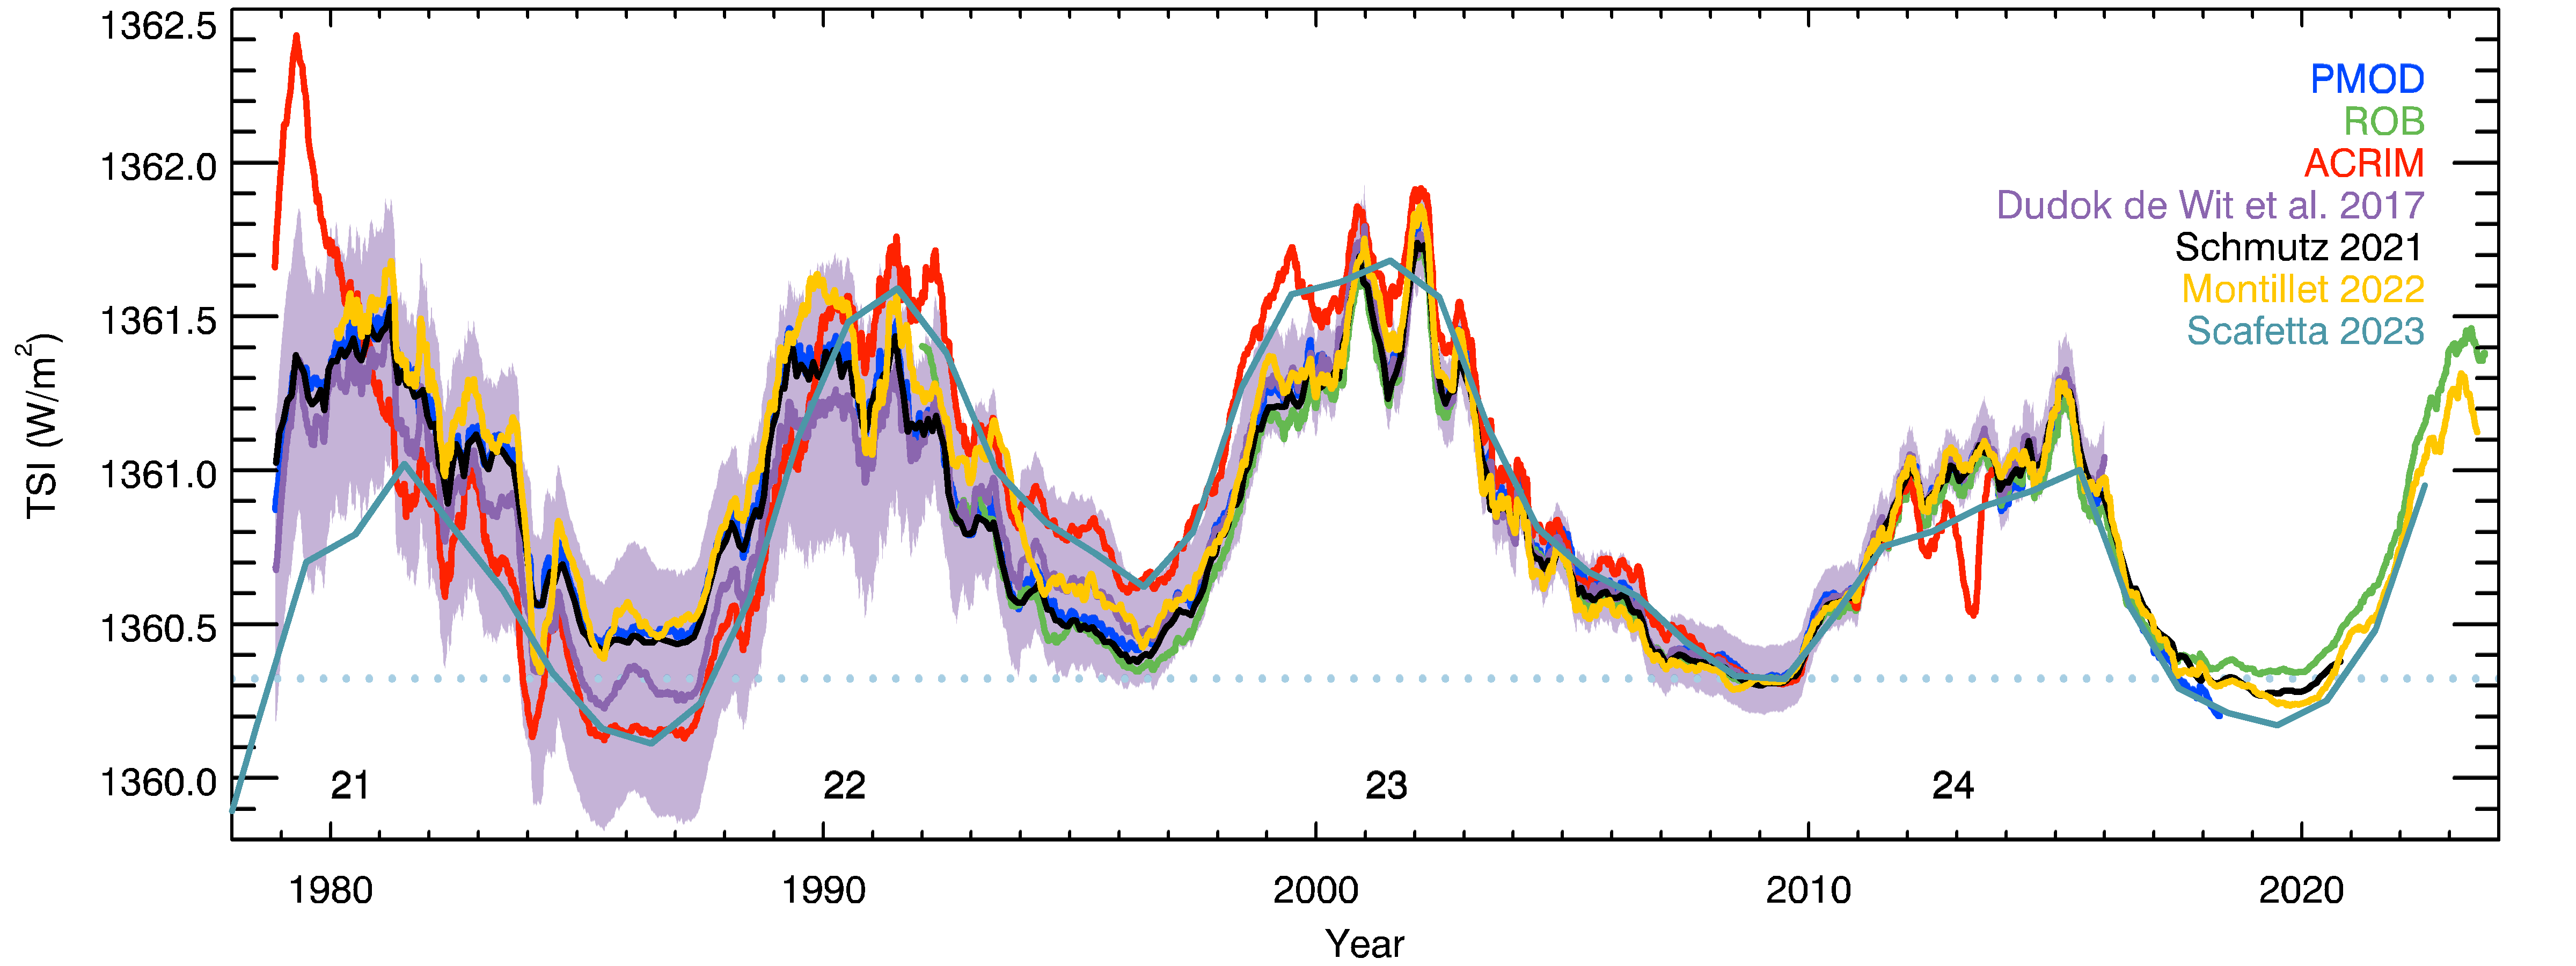
Three “classical” and most widely cited composites have been developed by the respective instrumental teams, these are: ACRIM111Available at https://web.archive.org/web/20170611210135/http://acrim.com/ (Active Cavity Radiometer Irradiance Monitor, which is the instrument taken as the reference by Willson, 1997; Willson & Mordvinov, 2003), PMOD222Available at https://www.pmodwrc.ch (named after Physikalisch-Meteorologisches Observatorium Davos; Fröhlich, 2006), and ROB333Available at https://www.sidc.be/observations/space-based-timelines/tsi (named after Royal Observatory of Belgium, previously referred to as RMIB, Royal Meteorological Institute of Belgium, or IRMB in French; Dewitte et al., 2004a; Dewitte & Nevens, 2016; Dewitte et al., 2022). Recently, Schmutz (2021) revised and updated the PMOD composite. In particular, he averaged the PMOD series with SORCE/TIM data over 2003–2017 and extended it with SORCE/TIM and TSIS/TIM data afterwards. PMOD and the series by Schmutz (2021) are identical prior to 2003, however the latter has only monthly values. Also, Scafetta (2023) have slightly revised the ACRIM composite, extending it until 2022 with the average values from the SOHO/VIRGO3 (Variability of solar IRadiance and Gravity Oscillations experiment on-board the SOlar and Heliospheric Observatory; Fröhlich et al., 1997), SORCE/TIM (Total Irradiance Monitor on-board the Solar Radiation and Climate Experiment mission; Kopp, 2021), and TSIS-1/TIM (Total and Spectral Solar Irradiance Sensor Pilewskie et al., 2018) TSI data.
More recently two new series have been presented by Dudok de Wit et al. (2017)444Update is available at https://spot.colorado.edu/~koppg/TSI/ and Montillet et al. (2022, Composite PMOD-Data Fusion, CPMDF, hereafter)555Available at ftp://ftp.pmodwrc.ch/pub/data/irradiance/virgo/TSI/TSIcomposite/. In contrast to the “classical” composites, which are based on the original TSI data and their degradation corrections including knowledge of specific instrumental issues, these new composites heavily rely on statistical analysis and modelling of the original instrumental records. These methods are good to close gaps in the data, whereas it is not clear to what extent such statistical modelling can recover hidden long-term variability (if any). One advantage is, however, that the composite by Dudok de Wit et al. (2017) was the first to supply uncertainty estimates (shown as shaded area in Fig. 1). Uncertainty is formally also provided by Montillet et al. (2022). However, it only includes the statistical and methodological errors and ignores the real uncertainty of the data, thus it does not represent the true uncertainty in the long-term TSI changes and cannot provide any additional information on the potential magnitude of such changes. One more composite was presented by Gueymard (2018), which however also relies on alternative activity proxies to combine individual instrumental series, as well as the PMOD and ACRIM composites. In this sense, this should rather be considered as a fusion of measurements and empirical modelling and cannot provide any independent information on the long-term variability.
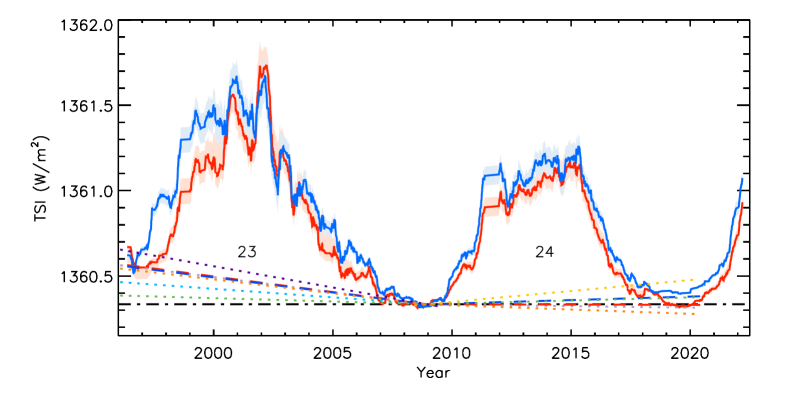
The TSI composites mentioned above are shown in Fig. 1, while Table 1 also lists periods covered by them and the minimum-to-minimum TSI change. To allow a direct comparison of the longer-term changes, we smoothed the daily values by roughly 6 months (see figure caption for details) and offset all series in Fig. 1 such as to match the PMOD composite during the 2009 activity minimum. The figure shows that whereas the variability on time scales up to the solar cycle is fairly consistent among the composites, on longer time scales, they clearly diverge. As has already been reported in earlier publications and reviews cited above, the PMOD composite and its update by Schmutz (2021, called PMOD-rev in Table 1) show a steady weak decrease in TSI from the minimum in 1986 to the most recent ones in 2009 and 2019. The ROB TSI first decreased between the minima in 1996 and 2009, and then slightly increased towards 2019. All changes are, however, statistically insignificant, being in the range of -3.9–2.6 Wm-2y-1 (see also Dewitte & Nevens, 2016). The ACRIM composite including the version by Scafetta (2023, called ACRIM-rev in Table 1) shows a significant increase from 1986 to 1996, which is attributed to the sudden change in the sensitivity of the Nimbus-7 Earth Radiation Budget (ERB) radiometer in 1989 (Hoyt et al., 1992; Lee III et al., 1995; Fröhlich, 2006; Krivova et al., 2009a). According to this composite, TSI then significantly decreased from 1996 to 2009 and then further to 2019 resulting overall in a very slightly increasing trend of 1.8 Wm-2y-1 over the entire period of direct measurements. The statistically-constructed composite by Dudok de Wit et al. (2017) assigns each instrument a weight based on a statistical estimate of its uncertainty. The authors apply some corrections to ACRIM1, ACRIM2, HF, and ERBE data following Fröhlich (2006) and then average the weighted data from the various instruments. Nevertheless, the Nimbus-7 ERB jump affects this composite as well, resulting in a TSI increase from 1986 to 1996, even though a roughly factor of three lower than in the ACRIM composite. Between 1996 and 2009, it shows a decrease, as all other series do. The new statistical composite by Montillet et al. (2022) using a data fusion approach (Cocchi, 2019) suggests a steady TSI decrease over the whole period covered by observations. Figure 1 also shows the uncertainty in the composites as estimated by Dudok de Wit et al. (2017). Unsurprisingly, the uncertainty rises when going back in time from about 0.1 Wm-2 after 2000 to about 0.5 Wm-2 towards the beginning of the monitoring. It is evident also that most of the differences between the various produced composites lie within the uncertainty as estimated by Dudok de Wit et al. (2017). Also, Montillet et al. (2022) conclude that the potential long-term change in TSI cannot be identified in the available data.
| Acronym | Reference | Years | Trend between indicated activity minima [Wm-2y-1] | ||||
|---|---|---|---|---|---|---|---|
| 22–23 | 23–24 | 24–25 | 22–24 | 22–25 | |||
| PMOD | Fröhlich (2006) | 1978–2018 | -1.6 | -10.0 | - | -6.5 | - |
| PMOD-rev | Schmutz (2021) | 1978–2020 | -3.3 | -8.5 | -2.9 | -6.4 | -5.2 |
| ROB | Dewitte et al. (2022) | 1991–2023 | - | -3.9 | 2.6 | - | - |
| ACRIM | Willson & Mordvinov (2003) | 1978–2013 | 48.0 | -24.9 | - | 7.6 | - |
| ACRIM-rev | Scafetta (2023) | 1981–2022 | 51.0 | -24.2 | -14.5 | 10 | 1.8 |
| Statistical models | |||||||
| Dudok de Wit et al. (2017) | 1978–2015 | 17.7 | -12.5 | - | 0.9 | - | |
| CPMDF | Montillet et al. (2022) | 1978–2023 | 1.0 | -15.9 | -5.9 | -8.4 | -7.6 |
2.2 Magnetic field
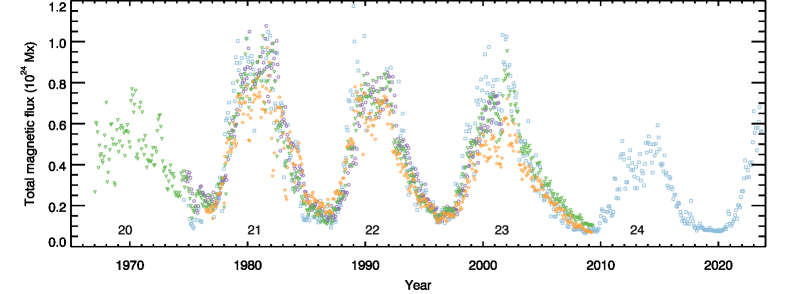
The variability of the solar quantities relevant to climate studies (see Sect. 1) is brought about by the Sun’s incessantly evolving surface magnetic field. It is therefore of interest to look at how the surface magnetic field has varied in the past. More or less regular observations are available since the late 1960s (Howard, 1976; Livingston et al., 1976), that is only slightly longer than irradiance measurements. The available ground- and space-based data are summarised in Fig. 2 and suggest a continuous downward trend in the total magnetic flux during quiet periods from cycle 20 to cycle 24. Also the amplitude of the solar cycle variability has been declining from cycle 21 to cycle 24. The overall trend is consistent with those in the PMOD, Schmutz (2021) and Montillet et al. (2022) TSI composites, while the disagreement with the increasing trend of ACRIM between 1986 and 1996 is remarkable.
Figure 2 also shows that solar cycle 25 is at a very similar level to or has surpassed the amplitude of cycle 24 even though cycle 25 is still in its ascending phase and has not yet reached its maximum. This is putting to rest claims about the Sun having entered a grand solar minimum state after cycles 23–24 (see also Fig. 1 for the measured TSI values over the same period and Clette et al., 2023; Peguero & Carrasco, 2023, for sunspot records).
3 Reconstructions of past solar activity and irradiance
Space-based measurements of TSI are invaluable for solar activity and irradiance studies. Nevertheless, covering just slightly over the four most recent decades, they are clearly insufficient to allow reliable inferences about solar influence on Earth’s climate over longer periods. More so, as the period covered by observations has been heavily affected by human activities (see IPCC, 2021; Richardson & Benestad, 2022). Reconstructions of past solar activity require suitable models and proxies.
3.1 Irradiance models and reconstructions
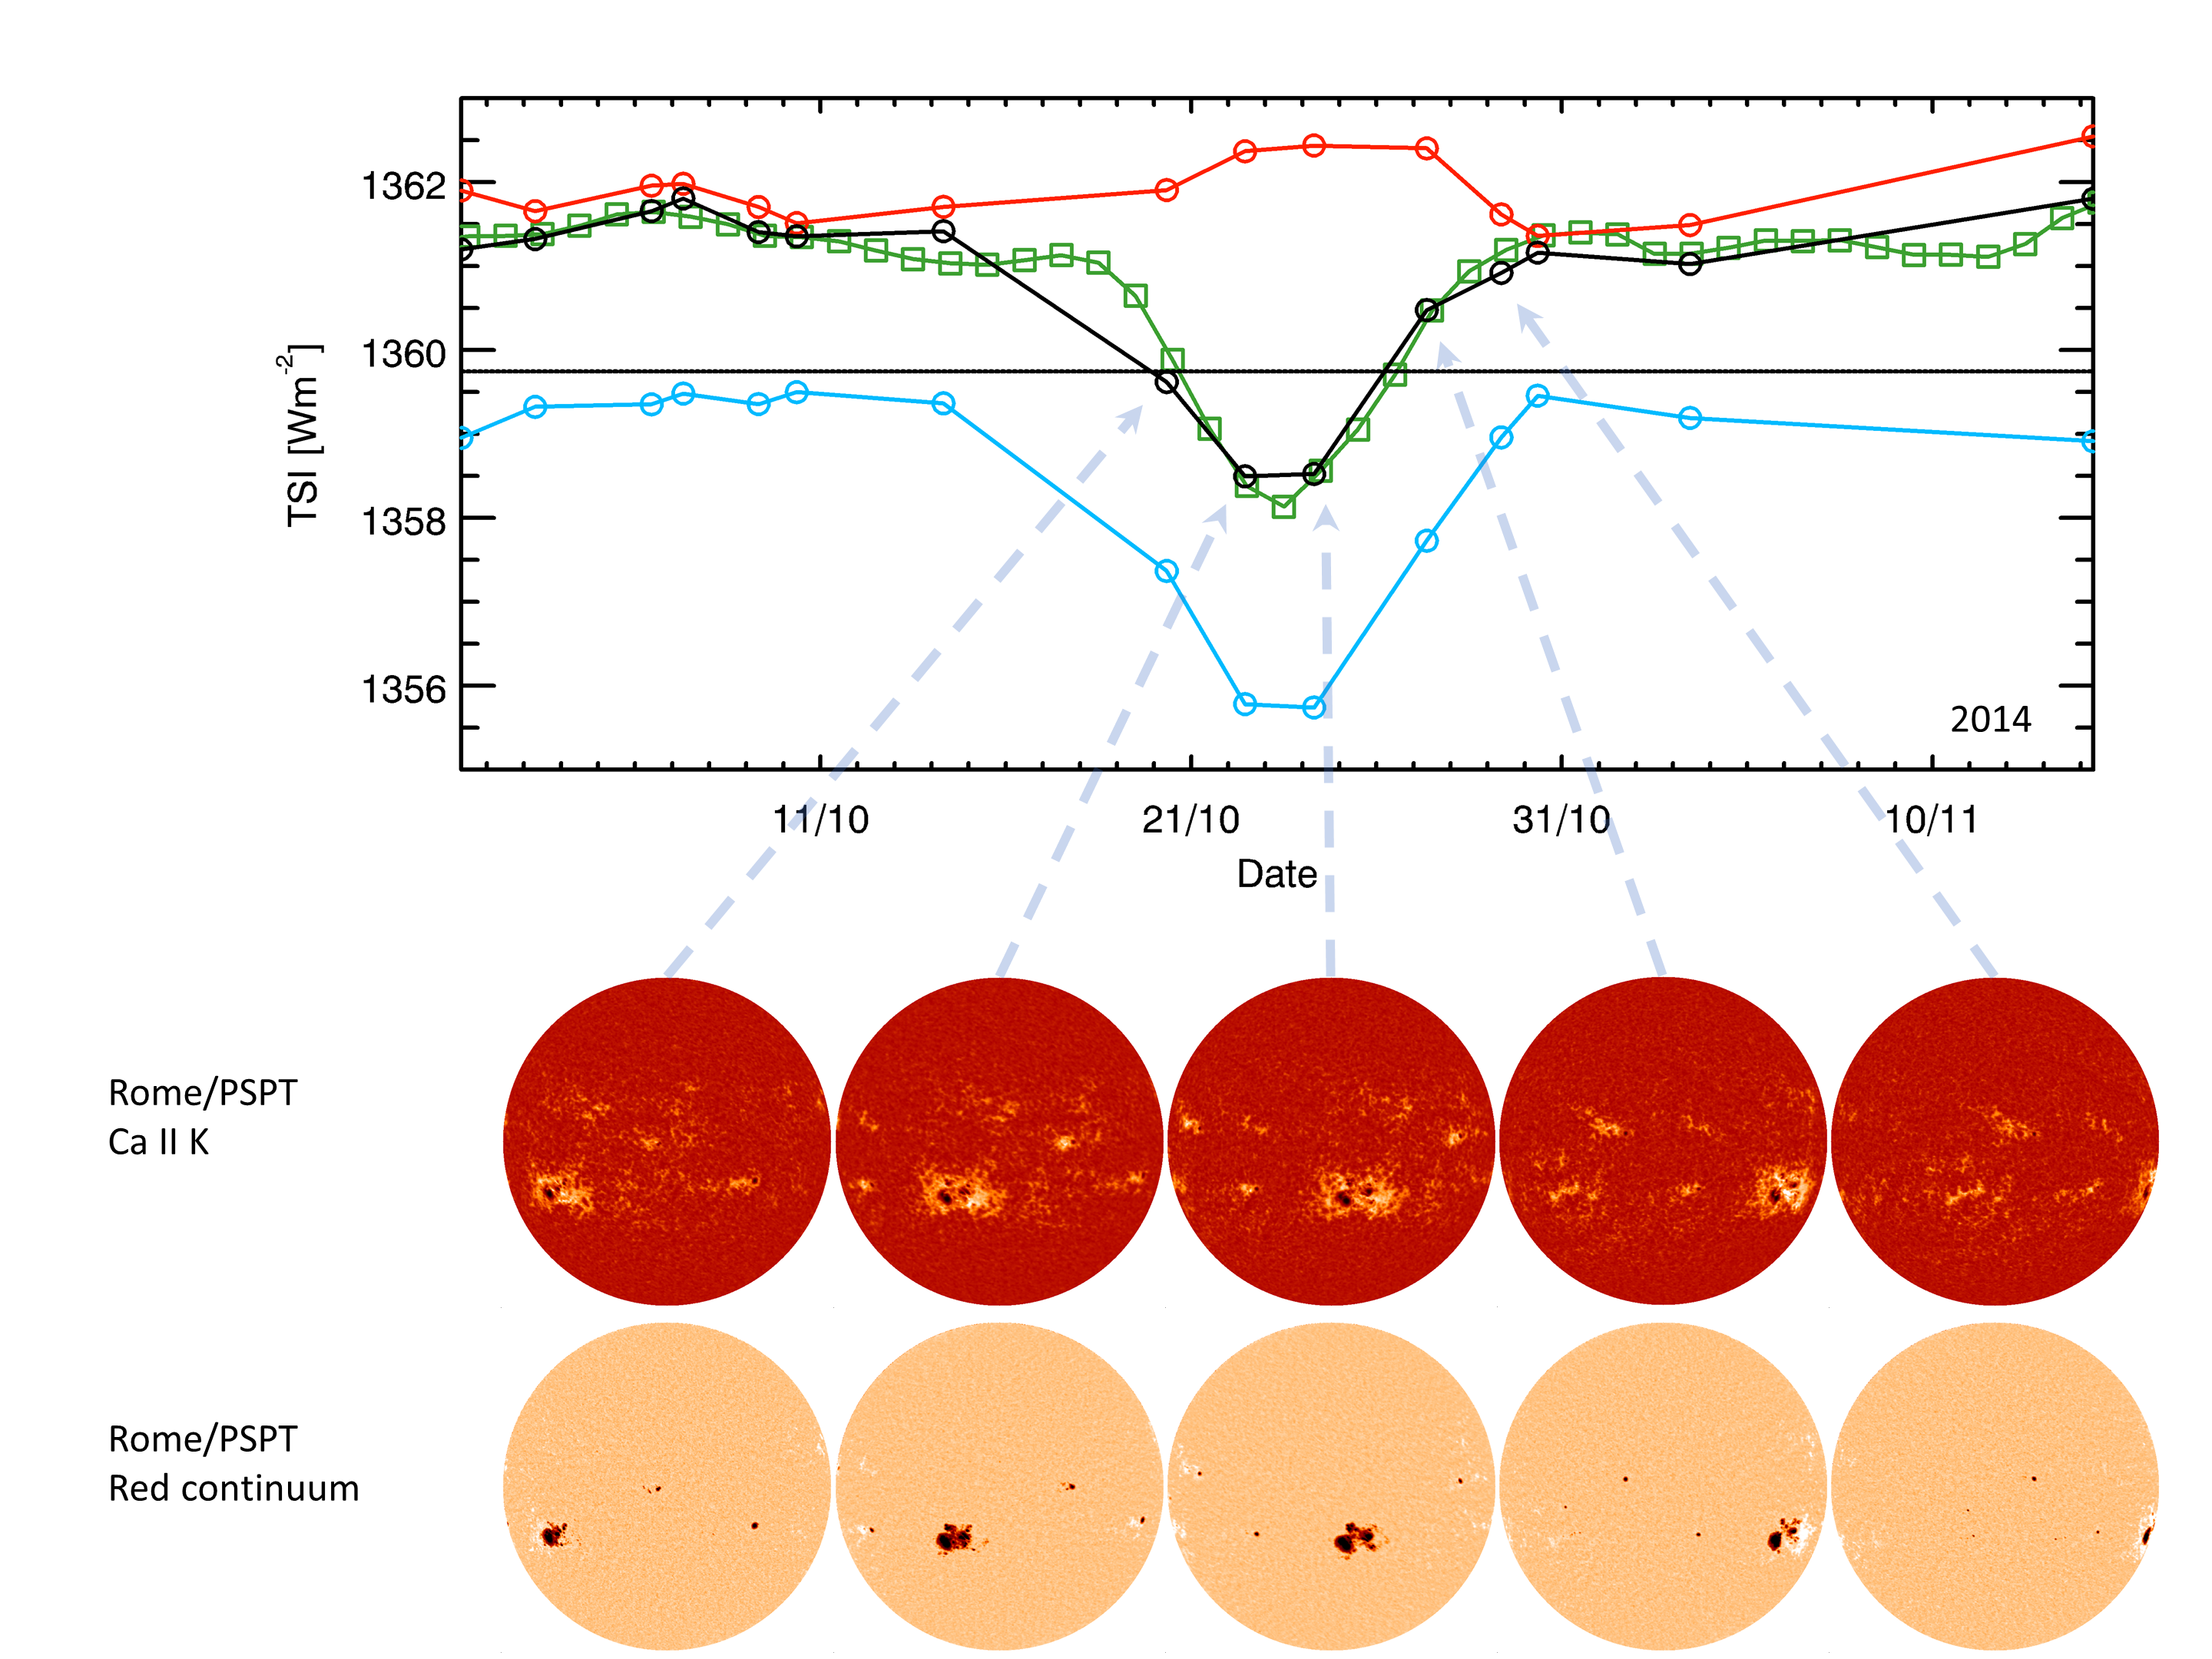
Already soon after the first space-based irradiance measurements revealed its variable nature, it was recognised that the solar surface magnetic field played an important role in this variability, with sunspots leading to depressions in TSI (e.g. Willson et al., 1981) and faculae together with network regions causing enhancements in TSI (e.g. Oster et al., 1982; Shapiro et al., 2016, and references therein). Figure 3 shows the TSI as well as individual contributions to its changes from sunspots and faculae computed with the Spectral And Total Irradiance REconstruction (SATIRE; Krivova et al., 2003) model employing Ca ii K observations (see Sect. 3.2.3, Chatzistergos et al., 2021a) over a 6-week interval around the maximum of solar activity of cycle 24. Subsequent progress in modelling techniques has confirmed this link and more recent studies have unambiguously shown that the evolution of the solar surface magnetic field accounts for basically all (within the uncertainties of measurements; see Fig. 1 and Dudok de Wit et al. 2017; Montillet et al. 2022) TSI variations on timescales of days to decades (Krivova et al., 2003; Shapiro et al., 2017; Yeo et al., 2017), thus leaving essentially no room for other mechanisms.
| Model | Study | Data | Years | TSI1986 - TSI1700 |
| [Wm-2] | ||||
| Empirical models | ||||
| Mordvinov et al. (2004) | HoSc98 GSN | 1610–2003 | 1.4 | |
| Svalgaard (2007) | SvSc16 GSN | 1610–2017 | -0.09 | |
| Foukal (2012) | HoSc98 GSN+Foukal (1996) Ca ii K plage areas | 1610–2009 | 0.09 | |
| Tapping et al. (2007) | ISNv1+ HoSc98 GSN | 1600–2006 | 1.00 | |
| Foster (2004) | ISNv1 | 1700–1996 | 1.23 | |
| Schatten & Orosz (1990) | ISNv1 | 1610–1993 | 0.14 | |
| Wang & Lean (2021) | ISNv2 | 1700–2019 | 0.2 | |
| Wang et al. (2005) | ||||
| Dewitte et al. (2022) | ISNv2 | 1700–2020 | 0.04 | |
| Privalsky (2018) | ISNv2 | 1750–1978 | - | |
| Penza et al. (2022) | MEA20+CEA20 | 1513–2001 | 2.2 | |
| Hoyt & Schatten (1993) | Sunspot indices | 1700–1992 | 4.0 | |
| Georgieva et al. (2015) | aa-index | 1699–2008 | 1.6 | |
| NRLTSI | Lean (2018) | Cosmogenic isotopes+GSN | 850–2016 | 0.5 |
| Coddington et al. (2016) | ||||
| Lean (2000); Lean et al. (1992, 1995) | ||||
| Mordvinov et al. (2004) | Cosmogenic isotopes | 850–2003 | 1.6–1.7 | |
| Delaygue & Bard (2011) | Cosmogenic isotopes | 850–1961 | - | |
| Bard et al. (2000, 2007) | ||||
| Steinhilber et al. (2012) | Cosmogenic isotopes | -7400–1988 | 1.2 | |
| Steinhilber et al. (2009) | ||||
| Roth & Joos (2013) | Cosmogenic isotopes | -8050–2005 | 0.96 | |
| Foster (2004) | Cosmogenic isotopes | 1424–1989 | 0.76 | |
| Fedorov et al. (2021) | Cosmogenic isotopes | -7290–2019a | 1.4 | |
| Velasco Herrera et al. (2015) | HoSc98 GSN + Machine learning extrapolation | 1000–2109 | 0.17–1 | |
| Abduallah et al. (2021) | Machine learning extrapolation | -6755–1885 | - | |
| Semi-empirical models | ||||
| Bolduc (2014) | RGO areas + HoSc98 GSN | 1610–2013 | 0.6 | |
| Fligge & Solanki (2000) | ISNv1 | 1700–1999 | 4.3 | |
| Solanki & Fligge (1999) | ||||
| SATIRE-T | Wu et al. (2018) | ISNv2+Vaquero et al. (2015) | 1639–2017 | 0.38 |
| Krivova et al. (2007, 2010) | ||||
| SATIRE-T2 | Dasi-Espuig et al. (2016) | ISNv1+RGO areas | 1700–2008 | 0.79 |
| Dasi-Espuig et al. (2014) | ||||
| SATIRE-M | Wu et al. (2018) | Cosmogenic isotopes | -6755–1885 | - |
| Vieira et al. (2011) | ||||
| CHRONOS | Egorova et al. (2018) | Cosmogenic isotopes | -6000–2015 | 3.5–5.5 |
| Shapiro et al. (2011) | ||||
.
All currently existing models can be split into three main groups: purely empirical, semi-empirical, and physical. Purely empirical models use indices of solar activity which are regressed to direct TSI measurements in order to reconstruct TSI variations (e.g. Hudson et al., 1982; Schatten et al., 1985; Foukal & Lean, 1988; Chapman et al., 1996, 2013; Preminger et al., 2002; Wang et al., 2005; Wang & Lean, 2021; Steinhilber et al., 2012; Delaygue & Bard, 2011; Zhao & Han, 2012; Coddington et al., 2016; Tebabal et al., 2015; Yeo et al., 2017; Privalsky, 2018; Mauceri et al., 2019; Chatzistergos et al., 2020a). Some empirical models also include machine learning extrapolations (e.g. Velasco Herrera et al., 2015; Abduallah et al., 2021), whose performance is, however, questioned by the stochastic nature of solar activity (see e.g. Cameron & Schüssler, 2019; Charbonneau, 2020; Petrovay, 2020, and references therein). Semi-empirical models rely on solar observations to determine the location and area covered by magnetic features, while solar model atmospheres and spectral synthesis codes are used to calculate the brightness spectra of these features (e.g. Fligge et al., 1998; Fligge & Solanki, 2000; Fligge et al., 2000; Solanki & Fligge, 1998, 1999; Ermolli, 2001; Ermolli et al., 2003, 2011; Krivova et al., 2003, 2007, 2009b, 2010, 2011; Penza et al., 2003; Fontenla et al., 2006, 2011; Wenzler et al., 2006; Crouch et al., 2008; Haberreiter et al., 2008, 2014; Shapiro et al., 2011; Vieira et al., 2011; Ball et al., 2012; Bolduc et al., 2014; Dasi-Espuig et al., 2014, 2016; Yeo et al., 2014; Wu et al., 2018; Chatzistergos et al., 2021a). Both empirical and semi-empirical models have free parameters that need to be set by comparison to direct TSI data. The number of free parameters varies among the models. Finally, physical models do not rely on TSI measurements for their reconstructions at all and compute the irradiance variations from 3D magnetohydrodynamics (MHD) simulations of the solar atmosphere (Yeo et al., 2017). The model by Yeo et al. (2017) is the first, and to the best of our knowledge the only to date, model of this type, see also Sect. 4.
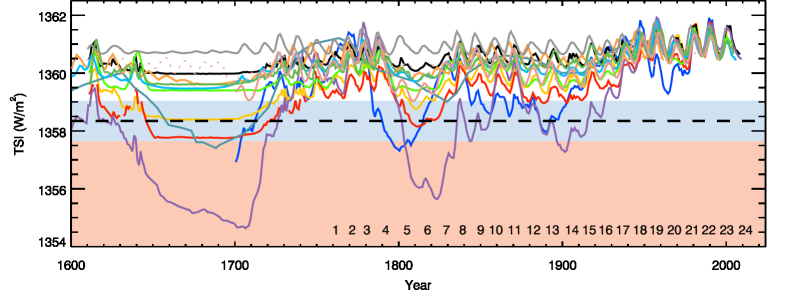
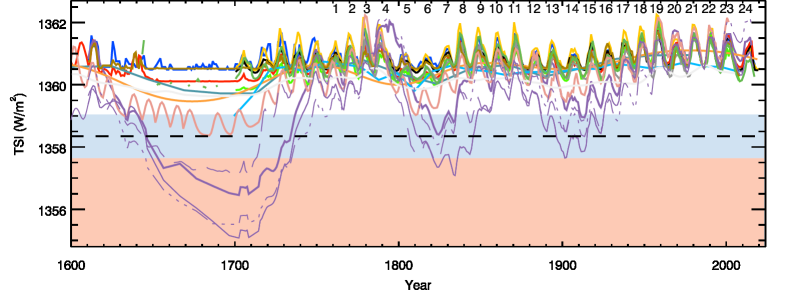
Figure 4 shows various TSI reconstructions extending back to at least 1700s. Some of these models have regularly been revised, refined, and updated. Nevertheless, often older versions are used in the literature ignoring the fact that newer versions, overriding the earlier ones, are available. We caution against using outdated reconstructions. In the top panel of the figure we show the older reconstructions (roughly older than 10 years), while the bottom panel shows more recent ones. Interestingly, the more recent reconstructions show a somewhat better consistency among them than the older ones. However, the disagreement remains. Thereby, various reconstructions show a lot of similarities on time scales of the solar cycle and less, while most of the disagreement now concerns the amplitude of the secular variability. Table 2 lists some key characteristics of TSI reconstructions that extend back to at least 1750. In this table we have grouped studies that used the same model together but provide a TSI difference between 1700 and 1986 only for the latest version of each model. Most series (21 out of 24 models from Table 2 covering 1700 to 1986) suggest a TSI difference between 1700 and 1986 of about -0.09–2.2 Wm-2, with only two older models by Hoyt & Schatten (1993) and Fligge & Solanki (2000, this model should be, however, considered replaced by the newer SATIRE-family models), as well as that by Egorova et al. (2018) favouring a higher level of variability (see also Sect. 4) of 3.5–5.5 Wm-2. However, we note that the secular trend is not an intrinsic characteristic of all of the TSI reconstructions listed in Table 2, since on many of them, especially the older ones (e.g. Lean et al., 1992, 1995; Hoyt & Schatten, 1993; Solanki & Fligge, 1999; Fligge & Solanki, 2000; Bard et al., 2000, 2007), it was rather imposed based on information on the magnitude of variability found for Sun-like stars. These old studies relied heavily on many assumptions which were shown to be incorrect (e.g., Hall & Lockwood, 2004; Hall et al., 2009; Wright, 2004) and thus old TSI reconstructions using them to impose the secular trend should not be used.
3.2 Past activity proxies
3.2.1 An overview
Despite the differences in the model methodologies, they all require appropriate data to describe emergence of the solar surface magnetic field in the past. Full-disc observations of magnetic regions generally return more accurate reconstructions than disc-integrated indices. This is because knowing the positions of the various surface on the visible disc allows taking the dependence of their brightness on the limb distance (centre-to-limb variation) into account (see, e.g., Ortiz et al., 2002; Yeo et al., 2013). Such data (magnetograms or images at various wavelengths), however, only exist over roughly the same period as the irradiance measurements. The only exceptions are areas and positions of sunspots (see Sect. 3.2.2) since 1874, often used in reconstructions, and Ca ii K observations since 1892 (Sect. 3.2.3), until now barely used for this purpose.
The longest direct and most widely used proxy of solar activity is that of sunspot counting, the sunspot number, going back, although with deteriorating quality, to early 17th century (see Sect. 3.2.2). Since 1874 also records of sunspot areas and positions are available.
Sunspots are the strongest concentrations of the surface magnetic field on the Sun. However, most of the magnetic flux emerges in smaller regions (see Harvey, 1993; Thornton & Parnell, 2011; Krivova et al., 2021), which appear bright. These smaller regions, called faculae (or plage if observed in the chromosphere, that is in the level of the solar atmosphere lying higher than the photosphere where spots are observed) and network, appear bright. These bright features are the main driver of changes in solar irradiance on time scales of years and longer. At the same time, their evolution with time is not perfectly represented by the evolution of sunspots. For example, over the solar cycle, the emergence rate of stronger magnetic features varies significantly more than that of weaker features (Harvey, 1993). More critically, during quiet periods, like solar activity minima, when no sunspots emerge on the surface of the Sun, the magnetic field continues emerging in smaller concentrations. However, while the number of observed sunspots is zero, their emergence does not carry information on the emergence of weaker regions during such periods. This becomes particularly critical (see Krivova et al., 2021) over extended periods of reduced solar activity, the so-called grand minima, such as the well-known Maunder minimum. Thus, the absence, until recently, of a reliable proxy of facular/plage emergence in the past is the main reason of the existing uncertainty in secular irradiance variability (see Sect. 3.1), since models had to rely on indirect proxies or involve questionable assumptions.
As already mentioned above, full disc magnetograms provide excellent and most straightforward information on facular regions. However, regular high-quality data exist since 1970s (Livingston et al., 1976) and thus cover essentially the same period as direct TSI measurements. Besides magnetograms, there are several disc-integrated chromospheric indices (Ermolli et al., 2015) that can provide information on facular regions and have been used by various models, such as the 10.7 cm radio flux (available since 1947; Tapping & Morton, 2013), Lyman emission (available since 1969; Woods et al., 2000), Mg II index (available since 1978; Heath & Schlesinger, 1986; Snow et al., 2014), He i (10830Å) equivalent width (since 1977); Ca ii (8542Å) central depth (since 1978), H central depth (since 1984), CN (3883 Å) bandhead index (since 1979; Livingston et al., 2007), and Ca ii K 1 Å disc-integrated emission index (since 1976; Bertello et al., 2017). All these disc-integrated series cover either shorter periods than the direct TSI measurements or marginally longer, with F10.7 being the longest one (since 1947). To address this problem, a lot of effort has been recently put into exploitation of the exclusive potential of historical solar Ca ii K observations (see e.g. Chatzistergos, 2017; Chatzistergos et al., 2022b, and Sect. 3.2.3).
Another proxy of solar magnetic activity, also used for irradiance reconstructions, in particular on time scales of millennia, is the concentration of cosmogenic isotopes in terrestrial archives, such as ice sheets or ancient plants. Cosmogenic isotopes are produced by the highly energetic particles of the GCRs (and also to a much lesser extent by SEPs, so that only a few most extreme solar events could be identified in radionucide data, Cliver et al. 2022). The flux of GCRs is modulated by the solar open magnetic flux, and so the production rates and eventually the concentrations of the cosmogenic isotopes in terrestrial archives (10Be in ice sheets and 14C in ancient plants) are linked to solar magnetic activity. More details can be found in Usoskin (2023).
Cosmogenic isotope data are, however, only an indirect proxy and do not allow distinguishing between sunspots and faculae without further assumptions or models. Reconstructions based on such data are thus either scaled to direct irradiance measurements, which as we showed in Sect. 2.1 do not provide a unique information on the secular trend, or to other, e.g., sunspot-based, reconstructions. Another limitation of radionuclide-driven reconstructions is their low temporal resolution. Typically only decadal data are available over the Holocene (although see Beer et al., 1990). Recently high-quality annual 14C data over the last Millennium became available (Brehm et al., 2021; Kaiser Kudsk et al., 2022). Usoskin et al. (2021b) have used these data to reconstruct the yearly sunspot number over the period 971–-1900, which covers 85 full solar cycles. The mean length of the cycles over this period was found to be 10.8 years. This reconstruction has significantly increased the number of known solar cycles, from 36 cycles since 1610 covered by direct observations (including four essentially unresolvable cycles during the Maunder minimum) to 96 cycles all together. The considered period covered five grand minima of solar activity, with a total duration of about 430 years. These include the Oort, Wolf, Spörer, Maunder and Dalton minima, although Oort and Dalton minima were short and not as deep as the other three grand minima.
3.2.2 Sunspot records
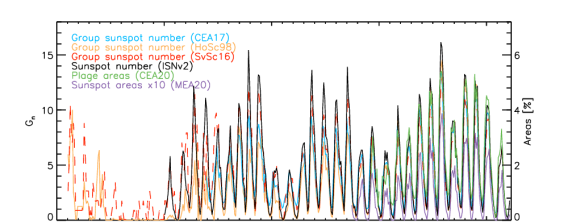
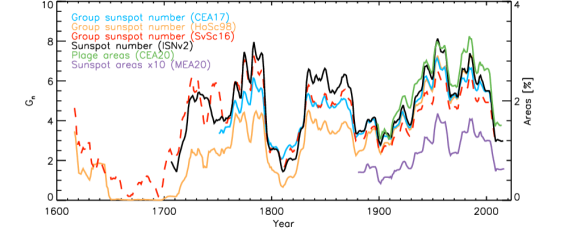
Direct data providing information on sunspots go back to the early 17th century. These are expressed as either combined countings of sunspots and sunspot groups, called the international sunspot number (ISNv1; Clette et al., 2007), or the number of sunspot groups (GSN) alone as introduced by Hoyt & Schatten (1998, HoSc98, hereafter). The last decade was marked by a rekindled interest in and extensive study of sunspot data, leading to a recovery of many new data, as well as corrections of existing records (e.g. Arlt et al., 2013, 2016; Vaquero et al., 2016; Carrasco et al., 2018, 2019, 2021a, 2021b; Hayakawa et al., 2021a, 2022; Vokhmyanin et al., 2020; Bhattacharya et al., 2021). Furthermore, various issues with the cross-calibration and compilation approaches of records of individual observers have been realised (Clette & Lefèvre, 2016, 2018; Lockwood et al., 2016; Usoskin et al., 2016b), leading to new techniques and several alternative GSN series (Usoskin et al., 2016c, 2021a; Willamo et al., 2017; Chatzistergos et al., 2017; Svalgaard & Schatten, 2016; Cliver & Ling, 2016) as well as new versions of ISN (ISNv2–ISNv2.3, Clette & Lefèvre, 2016; Bhattacharya et al., 2023a, b). Compared to HoSc98, the new GSN series have a higher amplitude prior to the 20th century, with the series by Svalgaard & Schatten (2016); Cliver & Ling (2016) being significantly higher and the series by Chatzistergos et al. (2017); Usoskin et al. (2021a) lying between the latter and HoSc98 (see Fig. 6). Comparisons to other proxies (such as, for example, 14C, Usoskin et al., 2021b, but also some other data, see Clette et al. 2023 for further details) support the new revisions showing moderate to high levels of activity over the 18th and 19th centuries (e.g. Chatzistergos et al., 2017; Usoskin et al., 2021a). A comparison to 44Ti (Asvestari et al., 2017) disfavours high levels of activity over 18th and 19th centuries, while moderate levels of activity are consistent with this proxy, too.
Since 1874 also other parameters of sunspots have been recorded, such as their areas and positions on the solar disc. These provide a more accurate information on solar activity, particularly important for irradiance reconstructions, as the amount of radiation blocked by sunspots depends on their size and heliospheric angle (sunspots closer to the disc centre are darker than those closer to the limb). Spatial patterns of sunspot emergence are also important for understanding the solar dynamo action. A record of sunspot area measurements has been kept at the Royal Greenwich Observatory between 1874 and 1976 (Willis et al., 2016). Due to systematic differences between the measurements by various other sites, a cross-calibration of the data is needed to avoid fake trends when using the data for understanding past solar activity. The most recent and accurate cross-calibration is offered by Mandal et al. (2020, shown in Fig. 6).
3.2.3 Ca ii K observations
Ca ii K data are full-disc observations of the Sun in the singly ionised Ca line at 393.37 nm (Chatzistergos, 2017; Chatzistergos et al., 2022b; Ermolli et al., 2018) (see Fig. 3 for some examples of modern Ca ii K observations). We note that historical full-disc photographic observations going back to 1874 are also available in white-light (Foukal, 1993). Their use is, however, restricted due to the fact that white-light data show facular regions essentially only near the limb, thus not describing accurately the entire facular contribution to TSI. The value of Ca ii K data for past solar activity and irradiance studies comes from their link to solar surface magnetism (Chatzistergos et al., 2019c, and references therein). The earliest Ca ii K observations were made in 1892, and monitoring of the Sun in Ca ii K line continues to this day at a number of sites around the globe (Chatzistergos et al., 2022b). These data are a real treasure trove for past solar activity studies since they can be used to recover information on solar surface magnetism over periods for which direct measurements do not exist.
Unfortunately, Ca ii K data suffer from various issues rendering their application not straightforward. A critical aspect is that historical data have been stored on photographic plates, which are not linear detectors. The images are also affected by various artefacts which have arisen at various stages of their life (see, e.g., Chatzistergos, 2017; Chatzistergos et al., 2022b). For instance, there are brightness variations across linear (or curved) segments due to problems during the observation, there are smudges due to the accumulation of dirt during the storage of the images, or artefacts introduced during the digitisation of the plates (see, e.g., Chatzistergos et al., 2022b). All of these issues need to be accounted for before using Ca ii K data for acquiring accurate results from them.
Because of the challenges of extracting accurate information from historical Ca ii K data, most irradiance reconstructions from Ca ii K data were restricted to using modern CCD-based images (Chapman et al., 1996, 2013; Walton et al., 2003; Ermolli et al., 2003, 2011; Penza et al., 2003; Fontenla & Landi, 2018; Puiu, 2019; Chatzistergos et al., 2020a, 2021b), which do not require photometric calibration and suffer from considerably fewer artefacts than the historical data. These studies are particularly important to ascertain the ability of Ca ii K data to be used for accurate irradiance reconstructions. Since some CCD-based Ca ii K archives, such as those from Rome/PSPT (Precision Solar Photometric Telescope; Ermolli et al., 2022) and San Fernando (Chapman et al., 1997), have long and consistent observations they can also be used to assess the cycle minimum to minimum trend in TSI, thus avoiding degradation effects of satellite measurements or cross-calibration issues of different direct TSI series. This is because the data used for these reconstructions are independent of the TSI measurements, while output of the models such as SATIRE or the one by Chatzistergos et al. (2020a) is only very little affected by the choice of the reference TSI record used to constrain the free parameters (e.g. Chatzistergos et al., 2021b). Chatzistergos et al. (2020a) used Rome/PSPT data to reconstruct solar irradiance variations back to 1996 with an empirical model based on the integrated intensity in Ca ii K and a continuum interval at the blue part of the spectrum (409.2 nm), following the approach by Chapman et al. (2012, 2013). They reported a generally decreasing TSI trend since 1996.
Figure 7 shows the activity minimum-to-minimum changes for various direct TSI series and reconstructions, including also the TSI reconstructions from Ca ii K data using the Chatzistergos et al. (2020a) and adapted SATIRE (Chatzistergos et al., 2021a, b) models. Both TSI reconstructions were updated with newer data from Rome/PSPT as well as considering some corrections for the early data, while the reconstruction following Chatzistergos et al. (2021a) shown here also used the latest version of the Mandal et al. (2020) database. Both models return qualitatively the same trends, with values of Wm-2y-1 and Wm-2y-1 between the 1996 and 2008 minima for the empirical reconstruction by Chatzistergos et al. (2020a) and the semi-empirical Ca II-driven SATIRE (Chatzistergos et al., 2021b), respectively. For the change between the 2008 and 2019 minima, we find Wm-2y-1 and Wm-2y-1 for the reconstruction by Chatzistergos et al. (2020a) and Chatzistergos et al. (2021a), respectively.
Use of photographic Ca ii K data for irradiance reconstructions has been significantly more limited than that of CCD-based ones. To our knowledge, the only TSI reconstructions from photographic Ca ii K data are those by Ambelu et al. (2011), Foukal (2012), Xu et al. (2021), Penza et al. (2022), and Chatzistergos et al. (2021a). Thereby, Ambelu et al. (2011), Foukal (2012), and Xu et al. (2021) used linear regression models to reconstruct TSI variations, which limits their reliability. Furthermore, these reconstructions were produced from photometrically uncalibrated Ca ii K data and used a single Ca ii K archive without assessing the consistency of the series. Thus they are prone to inhomogeneities of the data (Chatzistergos et al., 2022b, 2023). Penza et al. (2022) reconstructed TSI variations with an empirical model employing the plage area composite series by Chatzistergos et al. (2020c).
The only semi-empirical TSI reconstruction from photometrically calibrated historical Ca ii K data is the one by Chatzistergos et al. (2021a). Besides being able to photometrically calibrate the historical Ca ii K data, their analysis benefited from more accurate processing techniques (Chatzistergos et al., 2018, 2019a, 2019b, 2020c, 2020b) than in previous studies as well as from a considerably larger sample of Ca ii K datasets. The reconstruction by Chatzistergos et al. (2021a) is currently limited to the period covered by direct TSI measurements, since the main goal of this first study was to set up the model and assess its performance using diverse Ca ii K data. This study has highlighted the potential of using Ca ii K data to accurately recover TSI variations in the past provided the data are accurately and consistently processed (such as with the methods by Chatzistergos et al., 2018, 2019a, 2020c). It also emphasised the importance of understanding and accounting for the different characteristics of the various available Ca ii K data (Chatzistergos et al., 2022b; Murabito et al., 2023).
Ca ii K data have also been used to study the evolution of plage areas. The first composite of plage areas from 43 available datasets was presented by Chatzistergos et al. (2020c, shown in Fig. 6). Ca ii K data are available since the late 19th century, significantly extending and improving the available data on faculae and network regions, critical for an assessment of the long-term changes in solar activity and irradiance. To allow reconstructions yet further back in time, e.g., from sunspot records, understanding of the detailed relationship between sunspot and facular evolution is pivotal. Various studies have addressed this issue (e.g. Foukal, 1993; Shapiro et al., 2014; Yeo et al., 2020a; Chatzistergos et al., 2022a; Nèmec et al., 2022, and references therein), generally confirming its non-linearity. More recent results favour a power-law relationship between plage areas and the sunspot number as well as sunspot areas (Shapiro et al., 2014; Yeo et al., 2020a; Chatzistergos et al., 2022a). The relationship has also been found to exhibit a weak dependence on the activity level (Chatzistergos et al., 2022a). A direct consequence of the non-linearity of the relationship between plage areas and sunspot areas or numbers is the non-linearity of the relationship between the sunspot number or areas and the F10.7 radio flux (see, e.g., Yeo et al., 2020a). The latter has been often used by climate and atmosphere models and the question about the apparent divergence between sunspot records and F10.7 over the more recent period has been raised in the literature (see Clette, 2021, and references therein).
4 The dimmest state of the Sun
Current estimates of the change in the mean TSI since the Maunder minimum, listed in Table 2, range from a rise by to a drop by . This uncertainty also spreads to the longer-term reconstructions, see the discussion in Sect. 3.2.1. These current estimates are based on empirical or semi-empirical models of solar irradiance variability.
A different approach was taken by Yeo et al. (2017). This model employs three-dimensional (3D) solar model atmospheres based on realistic magnetohydrodynamic (MHD) simulations of the solar surface and atmosphere. As a result, this model, which we will refer to as SATIRE-3D, does not require any calibration to measured solar irradiance variability. This is currently the only model reported in the literature to achieve this. This unique feature of the model allows an estimate of the lowest possible TSI level during periods of extremely low solar activity, such as during grand minima. A comparison with the current TSI levels then allows setting an upper limit on the possible secular TSI change. Similarly to semi-empirical models, the Yeo et al. (2017) model has two components. The first component is the solar disc coverage by faculae and network, classed together and termed collectively as faculae, and by sunspots. This is derived by identifying these features in full-disc longitudinal magnetograms and continuum intensity images from the Helioseismic and Magnetic Imager onboard the Solar Dynamics Observatory (SDO/HMI; Scherrer et al., 2012) space telescope. The solar disc outside of sunspots and faculae (including network) is classified as internetwork. The second component of the model is the intensity of sunspots, faculae and the internetwork. Sunspot intensity is calculated from plane-parallel model atmospheres (Unruh et al., 1999). Indeed, sunspots can be reasonably well represented by plane-parallel model atmospheres such that their incorporation into the model reproduces sunspot darkening without issue. However, in contrast to semi-empirical models, facular and internetwork components are represented by state-of-the-art 3D model atmospheres, generated with MHD simulations of facular and internetwork regions using the MURaM code (MPS/University of Chicago Radiative MHD; Vögler et al., 2004, 2005; Vögler & Schüssler, 2007; Rempel, 2014, 2020). The latter allows a unique conversion of the magnetic field signal measured in a magnetogram into the brightness contrast of a given facular/network pixel (see Yeo et al., 2017, for details).
For a given time, the appropriate intensity is then assigned to each point on the solar disc depending on whether it is inside a sunspot, faculae or the internetwork, as determined from HMI observations, and the summation of the result yields the corresponding TSI level. Taking daily HMI observations from 30 April 2010, when the instrument started regular operation, to 31 December 2019 as input into the model, Yeo et al. (2020b) reconstructed TSI variability over the intervening period. This TSI reconstruction reproduces more than 97% of the observed TSI variability over the same period, as indicated by the coefficient of determination with the SORCE/TIM TSI record (see Fig. 8 comparing SATIRE-3D model extended until 2023 to SORCE/TIM and TSIS/TIM observations; note that only SORCE/TIM data were included for comparison in the original paper, as TSIS/TIM was not operating yet).
Making use of the state-of-the-art SDO/HMI data for computing the daily TSI values, this model cannot, unfortunately, be extended back to compute irradiance variations over the entire period since the Maunder minimum. Instead, by considering the Sun in its least possible active stage and comparing the TSI during such a state with the current levels, it sets a limit on the maximum possible TSI change between a grand minimum and now. The solar magnetic field is maintained by the global dynamo (Charbonneau, 2020) and the small-scale dynamo or SSD, which refers to the interaction between solar convection and magnetic flux that produces the ubiquitous internetwork magnetic field (Borrero et al., 2017). Based on the dearth of sunspots during the Maunder minimum and recent studies suggesting that the SSD is untethered to the global dynamo (Lites, 2011; Lites et al., 2014; Buehler et al., 2013; Rempel, 2014), Yeo et al. (2020b) argued that at the Maunder minimum, the global dynamo was unusually weak, while the SSD and the internetwork magnetic field it supports were likely to be in a similar state as they are today. The most inactive state the Sun can possibly be in during grand solar minima is therefore one where the global dynamo is completely dormant and the internetwork magnetic field, looking as it does today, extends the entire solar surface. Accordingly, by assuming the entire solar surface was covered by only the internetwork magnetic field (using the SSD model by Rempel, 2014) during a grand minimum, Yeo et al. (2020b) established the TSI level of the Sun in its least active state.
The resulting TSI level was found to be or below the 2019 level. For a more consistent comparison with the numbers for various reconstructions listed in Table 2, which refer to the difference between 1986 and 1700 (as some of the reconstructions do not cover the minimum in 2019), we convert this into the maximum increase from the Maunder minimum to 1986, using the estimate by Montillet et al. (2022) for the TSI change between 1986 and 2019 (see Table 1). Since the TSI level of the least active Sun corresponds to the lowest level possible during grand solar minima, the difference to the present level, represents the greatest rise in TSI since the Maunder minimum possible. We emphasise, however, that according to proxy data and other observations (e.g., cosmogenic isotope concentrations, sunspots seeings, auroral activity) the “dimmest Sun” condition was most likely not reached during the Maunder minimum (see Krivova et al., 2021, and references therein), and thus the TSI change since then is expected to be lower than this limit. The constraint is shown as horizontal black line in Fig. 4. Its uncertainty is marked by the blue shading, while the TSI levels clearly outside this constraint are shaded in red. This cap on the change in TSI since the Maunder minimum encloses all the current estimates except that reported by Egorova et al. (2018). The reasons why the approach by Shapiro et al. 2011 and Egorova et al. 2018 lead to a significantly higher estimates are discussed in Yeo et al. 2020b. This is a robust constraint on possible TSI variations, which is in agreement with, although less tight than, other such estimates from the literature (e.g. Schrijver et al., 2011; Feulner, 2011; Lockwood & Ball, 2020; Marchenko et al., 2022).
5 Summary and conclusions
Long and reliable records of solar activity and irradiance are of paramount importance for understanding the solar influence on Earth’s climate. The available direct TSI measurements only extend back to 1978 and come from a number of different instruments. The data exhibit non-negligible inconsistencies, and there is some vagueness in how they are put together into a continuous record. As a result, the magnitude of the secular change (if any at all) in the solar irradiance over the period of measurements remains unclear. The estimates of the activity minimum-to-minimum change from 1986 to 2009 in the available TSI composites range between -8.4 and 10 Wm-2y-1 (see Table 1 and Fig. 1). For the period since 1996 a marginally decreasing trend is reported, while most composites also evidence a marginally decreasing TSI over the entire satellite period. The latter is supported by observations of the solar surface magnetic field (Fig. 2) and Ca ii K data (Fig. 7).
Models are used to extend the TSI record into the past and reconcile the inconsistencies of the direct measurements. Models recover irradiance variations by accounting for the different contributions of solar surface magnetic regions, such as dark sunspots and bright faculae (plage) and network. The main source of the uncertainty in the long-term irradiance reconstructions is the absence, until recently, of a reliable proxy of facular brightening. Thus, the estimates of the TSI change between 1700 and 1986 by various models range between -0.09 and 5.5 Wm-2, although more recent reconstructions (roughly from the last decade) are in a better agreement with each other. In particular, Yeo et al. (2020b) used cutting-edge 3D MHD simulations of the solar atmosphere with the (only currently existing) physical model, SATIRE-3D, to estimate the minimum TSI level that can be reached when the Sun becomes extremely quiet, similarly to the state of the so-called grand minima (e.g., Maunder or Spörer minima, to name some of the most famous ones). Such a state could be reached if the global dynamo in the Sun became dormant, and only the small-scale dynamo driven by the interaction of the convection with the solar magnetic field and generating the ubiquitous internetwork magnetic field were acting. It is not possible to reconstruct the solar irradiance with this model over the period not covered by state-of-the-art high-resolution solar observations, but a comparison of the “dimmest” state of the Sun with current minima allows a constraint on the maximum possible change in TSI between such boundary conditions. In this way, Yeo et al. (2020b) estimated the difference in the TSI between 2019 and the dimmest state of the Sun to be 2.00.7 Wm-2. The Yeo et al. (2020b) constraint on the dimmest state of the Sun excludes “extreme” TSI reconstructions, such as those by Hoyt & Schatten (1993), Fligge & Solanki (2000), or Egorova et al. (2018). The reconstruction by Penza et al. (2022) lies just at the allowed limit.
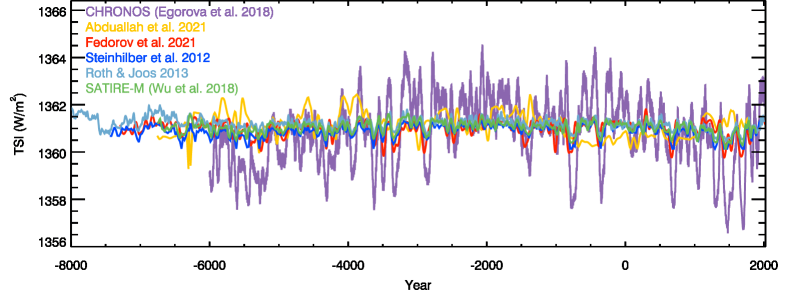
Reconstructions to yet earlier times, up to the entire Holocene, have also been done. They rely on cosmogenic radioisotope data, which are only an indirect proxy of solar activity. They thus require further assumptions and do not allow an independent estimate of the magnitude of the secular variability. Their temporal resolution is also lower, typically decadal, while the quality of the data worsens further back in time. Although, using the recent unique 14C data from Brehm et al. (2021), Usoskin et al. (2021b) have been able to reconstruct the annual sunspot number over the period 971–1900, which has increased the number of known solar cycle from 36 covered by telescopic observations to 96.
Huge efforts have also been invested into improving and extending the available historical proxies of solar magnetic activity, which is an ongoing process and will keep providing improved records for solar irradiance studies. This includes significant revisions and updates of the sunspot number records, and a great progress in exploiting the historical full-disc photographs of the Sun in the Ca ii K line, which offer unique information on faculae since the late 19th century.
In particular, significant efforts have been put over the last two decades into digitisation of the available historical archives and development of accurate techniques for their processing and analysis (Chatzistergos et al., 2022b). By now more than 43 archives have been analysed (Chatzistergos et al., 2020c), providing an excellent temporal coverage back to 1892. The potential of historical Ca ii K observations for irradiance reconstructions with a semi-empirical model was demonstrated by Chatzistergos et al. (2021a) paving the way for utilising these data for a more accurate TSI reconstruction back to 1892 than currently possible.
Some extra work to resolve remaining issues with Ca ii K data is, however, still needed on the way to this goal. One of the most critical challenges is to account for various inconsistencies in the Ca ii K archives, to avoid spurious trends in the outcome (Chatzistergos et al., 2022b).
Such a significantly refined reconstruction over the last century would also help to calibrate the magnitude of the secular variability and thus impose constraints on TSI reconstructions going yet further back in time. Extending reconstructions further back in time additionally requires a better understanding of the link between the evolution of sunspots and faculae. The latter can be done with modern high-resolution data, historical sunspot and facular observations, and simulations (see, e.g., Yeo et al., 2020a, 2021; Krivova et al., 2021; Chatzistergos et al., 2022a; Nèmec et al., 2022).
As a final note, in this review we have focused on the long-term changes in the TSI and did not discuss the SSI variability. While irradiance variability is strongly wavelength-dependent, recovering long-term trends, which are in the focus of this review, faces essentially the same problems for both the TSI and SSI. We note though that SSI measurements are even more challenging than TSI measurements (see, e.g,, Ermolli et al., 2013; Yeo et al., 2015; DeLand et al., 2019; Woods et al., 2021).
Acknowledgements.
The authors thank Yasser Abduallah, Francesco Berrilli, Steven Dewitte, Tatiana Egorova, Valeri Fedorov, Victor Privalsky, Werner K. Schmutz for providing their data. We thank the anonymous referees for the useful comments that helped improving this paper. The TSI reconstructions with SATIRE-3D, T, T2, M, and by Chatzistergos et al. (2020a) as well as the CEA20 plage area composite, the CEA17 group sunspot number series, and the MEA20 sunspot area composite are available at http://www2.mps.mpg.de/projects/sun-climate/data.html. ISNv2, HoSc98, and SvSc16 series are available at https://www.sidc.be/silso/datafiles. Bard et al. (2000, 2007); Lean (2000); Steinhilber et al. (2009, 2012) TSI series are available at https://www.ncei.noaa.gov/pub/data/paleo/climate_forcing/solar_variability/, while the Svalgaard (2007) one at https://web.archive.org/web/20230927071933/https://svalgaard.leif.org/research/Historical-TSI.xls. Wang et al. (2005), Vieira et al. (2011), and Delaygue & Bard (2011) TSI series are included in the supplementary material by Schmidt et al. (2011). This work was supported by the German Federal Ministry of Education and Research (Project No. 01LG1909C) and by the European Union’s Horizon 2020 research and Innovation program under grant agreement No 824135 (SOLARNET). TC thanks ISSI for supporting the International Team 417 ”Recalibration of the Sunspot Number Series”. This research has made use of NASA’s Astrophysics Data System.References
- Abduallah et al. (2021) Abduallah, Y., Wang, J. T. L., Shen, Y., et al. 2021, The International FLAIRS Conference Proceedings, 34
- Čalogović et al. (2010) Čalogović, J., Albert, C., Arnold, F., et al. 2010, Geophysical Research Letters, 37, L03802
- Ambelu et al. (2011) Ambelu, T., Falayi, E. O., Elemo, E. O., & Oladosu, O. 2011, Latin-American Journal of Physics Education, 5
- Arlt et al. (2013) Arlt, R., Leussu, R., Giese, N., Mursula, K., & Usoskin, I. G. 2013, Monthly Notices of the Royal Astronomical Society, 433, 3165
- Arlt et al. (2016) Arlt, R., Senthamizh Pavai, V., Schmiel, C., & Spada, F. 2016, Astronomy and Astrophysics, 595, A104
- Asvestari et al. (2017) Asvestari, E., Usoskin, I. G., Kovaltsov, G. A., et al. 2017, Monthly Notices of the Royal Astronomical Society, 467, 1608
- Ball et al. (2012) Ball, W. T., Unruh, Y. C., Krivova, N. A., et al. 2012, Astronomy and Astrophysics, 541, A27
- Bard et al. (2000) Bard, E., Raisbeck, G., Yiou, F., & Jouzel, J. 2000, Tellus Series B Chemical and Physical Meteorology B, 52, 985
- Bard et al. (2007) Bard, E., Raisbeck, G. M., Yiou, F., & Jouzel, J. 2007, Quaternary Science Reviews, 26, 2301
- Beer et al. (1990) Beer, J., Blinov, A., Bonani, G., et al. 1990, Nature, 347, 164, number: 6289
- Bertello et al. (2017) Bertello, L., Marble, A. R., & Pevtsov, A. A. 2017, ArXiv e-prints, 1702, arXiv:1702.00838
- Bhattacharya et al. (2023a) Bhattacharya, S., Lefèvre, L., Chatzistergos, T., et al. 2023a, Solar Physics
- Bhattacharya et al. (2023b) Bhattacharya, S., Lefèvre, L., Hayakawa, H., Jansen, M., & Clette, F. 2023b, Solar Physics, 298, 12
- Bhattacharya et al. (2021) Bhattacharya, S., Teague, E. T. H., Fay, S., et al. 2021, Solar Physics, 296, 118
- Bolduc (2014) Bolduc, C. 2014, PhD thesis, Université de Montréal, english title: Modeling of total and spectral solar irradiance and applications to terrestrial stratospheric chemistry;
- Bolduc et al. (2014) Bolduc, C., Charbonneau, P., Barnabé, R., & Bourqui, M. S. 2014, Solar Physics, 289, 2891
- Borrero et al. (2017) Borrero, J. M., Jafarzadeh, S., Schüssler, M., & Solanki, S. K. 2017, Space Sci. Rev., 210, 275
- Brehm et al. (2021) Brehm, N., Bayliss, A., Christl, M., et al. 2021, Nature Geoscience, 1
- Buehler et al. (2013) Buehler, D., Lagg, A., & Solanki, S. K. 2013, Astron. Astrophys., 555, A33
- Cameron & Schüssler (2019) Cameron, R. H. & Schüssler, M. 2019, Astronomy & Astrophysics, 625, A28
- Carrasco et al. (2021a) Carrasco, V. M. S., Nogales, J. M., Vaquero, J. M., Chatzistergos, T., & Ermolli, I. 2021a, Journal of Space Weather and Space Climate, 11, 51
- Carrasco et al. (2018) Carrasco, V. M. S., Vaquero, J. M., Arlt, R., & Gallego, M. C. 2018, Solar Physics, 293, 102
- Carrasco et al. (2021b) Carrasco, V. M. S., Vaquero, J. M., & Gallego, M. C. 2021b, Publications of the Astronomical Society of Japan, 73, 747
- Carrasco et al. (2019) Carrasco, V. M. S., Vaquero, J. M., Gallego, M. C., Villalba Álvarez, J., & Hayakawa, H. 2019, Monthly Notices of the Royal Astronomical Society: Letters, 485, L53
- Chapman et al. (1996) Chapman, G. A., Cookson, A. M., & Dobias, J. J. 1996, Journal of Geophysical Research, 101, 13541
- Chapman et al. (1997) Chapman, G. A., Cookson, A. M., & Dobias, J. J. 1997, The Astrophysical Journal, 482, 541
- Chapman et al. (2012) Chapman, G. A., Cookson, A. M., & Preminger, D. G. 2012, Solar Physics, 276, 35
- Chapman et al. (2013) Chapman, G. A., Cookson, A. M., & Preminger, D. G. 2013, Solar Physics, 283, 295
- Charbonneau (2020) Charbonneau, P. 2020, Living Rev. in Sol. Phys., 17, 4
- Chatzistergos (2017) Chatzistergos, T. 2017, Analysis of historical solar observations and long-term changes in solar irradiance, PhD thesis (Uni-edition)
- Chatzistergos (2023) Chatzistergos, T. 2023, Rendiconti Lincei. Scienze Fisiche e Naturali, 34, 11
- Chatzistergos et al. (2023) Chatzistergos, T., Ermolli, I., Banerjee, D., et al. 2023, Astronomy & Astrophysics, in press
- Chatzistergos et al. (2020a) Chatzistergos, T., Ermolli, I., Giorgi, F., Krivova, N. A., & Puiu, C. C. 2020a, Journal of Space Weather and Space Climate, 10, 45
- Chatzistergos et al. (2022a) Chatzistergos, T., Ermolli, I., Krivova, N. A., et al. 2022a, Astronomy & Astrophysics, 667, A167, publisher: EDP Sciences
- Chatzistergos et al. (2019a) Chatzistergos, T., Ermolli, I., Krivova, N. A., & Solanki, S. K. 2019a, Astronomy & Astrophysics, 625, A69
- Chatzistergos et al. (2020b) Chatzistergos, T., Ermolli, I., Krivova, N. A., & Solanki, S. K. 2020b, Journal of Physics: Conference Series, 1548, 012007
- Chatzistergos et al. (2020c) Chatzistergos, T., Ermolli, I., Krivova, N. A., et al. 2020c, Astronomy & Astrophysics, 639, A88
- Chatzistergos et al. (2018) Chatzistergos, T., Ermolli, I., Solanki, S. K., & Krivova, N. A. 2018, Astronomy & Astrophysics, 609, A92
- Chatzistergos et al. (2019b) Chatzistergos, T., Ermolli, I., Solanki, S. K., et al. 2019b, Solar Physics, 294, 145
- Chatzistergos et al. (2019c) Chatzistergos, T., Ermolli, Ilaria, Solanki, Sami K., et al. 2019c, Astronomy & Astrophysics, 626, A114
- Chatzistergos et al. (2022b) Chatzistergos, T., Krivova, N. A., & Ermolli, I. 2022b, Frontiers in Astronomy and Space Sciences, 9
- Chatzistergos et al. (2021a) Chatzistergos, T., Krivova, N. A., Ermolli, I., et al. 2021a, Astronomy & Astrophysics, 656, A104
- Chatzistergos et al. (2021b) Chatzistergos, T., Krivova, N. A., Ermolli, I., et al. 2021b, in Authorea, San Francisco, 3
- Chatzistergos et al. (2017) Chatzistergos, T., Usoskin, I. G., Kovaltsov, G. A., Krivova, N. A., & Solanki, S. K. 2017, Astronomy & Astrophysics, 602, A69
- Clette (2021) Clette, F. 2021, Journal of Space Weather and Space Climate, 11, 2
- Clette et al. (2007) Clette, F., Berghmans, D., Vanlommel, P., et al. 2007, Advances in Space Research, 40, 919
- Clette & Lefèvre (2016) Clette, F. & Lefèvre, L. 2016, Solar Physics, 291, 2629
- Clette & Lefèvre (2018) Clette, F. & Lefèvre, L. 2018, Proceedings of the International Astronomical Union, 13, 17
- Clette et al. (2023) Clette, F., Lefèvre, L., Chatzistergos, T., et al. 2023, Solar Physics, 298, 44
- Cliver & Ling (2016) Cliver, E. W. & Ling, A. G. 2016, Solar Physics, 291, 2763
- Cliver et al. (2022) Cliver, E. W., Schrijver, C. J., Shibata, K., & Usoskin, I. G. 2022, Living Reviews in Solar Physics, 19, 2
- Cocchi (2019) Cocchi, M., ed. 2019, Data Handling in Science and Technology, Vol. 31 (Elsevier)
- Coddington et al. (2016) Coddington, O., Lean, J. L., Pilewskie, P., Snow, M., & Lindholm, D. 2016, Bulletin of the American Meteorological Society, 97, 1265
- Crouch et al. (2008) Crouch, A. D., Charbonneau, P., Beaubien, G., & Paquin-Ricard, D. 2008, The Astrophysical Journal, 677, 723
- Dasi-Espuig et al. (2014) Dasi-Espuig, M., Jiang, J., Krivova, N. A., & Solanki, S. K. 2014, Astronomy and Astrophysics, 570, A23
- Dasi-Espuig et al. (2016) Dasi-Espuig, M., Jiang, J., Krivova, N. A., et al. 2016, Astronomy and Astrophysics, 590, A63
- DeLand et al. (2019) DeLand, M. T., Floyd, L. E., Marchenko, S., & Tiruchirapalli, R. 2019, Earth and Space Science, Volume 6, Issue 7, pp. 1284-1298, 6, 1284
- Delaygue & Bard (2011) Delaygue, G. & Bard, E. 2011, Climate Dynamics, 36, 2201
- Dewitte et al. (2022) Dewitte, S., Cornelis, J., & Meftah, M. 2022, Remote Sensing, 14, 1072, number: 5 Publisher: Multidisciplinary Digital Publishing Institute
- Dewitte et al. (2004a) Dewitte, S., Crommelynck, D., & Joukoff, A. 2004a, Journal of Geophysical Research (Space Physics), 109, A02102
- Dewitte et al. (2004b) Dewitte, S., Crommelynck, D., Mekaoui, S., & Joukoff, A. 2004b, Solar Physics, 224, 209
- Dewitte & Nevens (2016) Dewitte, S. & Nevens, S. 2016, The Astrophysical Journal, 830, 25
- Domingo et al. (2009) Domingo, V., Ermolli, I., Fox, P., et al. 2009, Space Science Reviews, 145, 337
- Dudok de Wit et al. (2017) Dudok de Wit, T., Kopp, G., Fröhlich, C., & Schöll, M. 2017, Geophysical Research Letters, 44, 1196, publisher: John Wiley & Sons, Ltd
- Dunne et al. (2016) Dunne, E. M., Gordon, H., Kürten, A., et al. 2016, Science, aaf2649
- Eddy (1976) Eddy, J. A. 1976, Science, 192, 1189
- Egorova et al. (2018) Egorova, T., Schmutz, W., Rozanov, E., et al. 2018, Astron. Astrophys., 615, A85
- Ermolli (2001) Ermolli, I. 2001, Memorie della Societa Astronomica Italiana, 72, 545
- Ermolli et al. (2003) Ermolli, I., Caccin, B., Centrone, M., & Penza, V. 2003, Memorie della Societa Astronomica Italiana, 74, 603
- Ermolli et al. (2018) Ermolli, I., Chatzistergos, T., Krivova, N. A., & Solanki, S. K. 2018, in IAU Symposium, Vol. 340, Long-term Datasets for the Understanding of Solar and Stellar Magnetic Cycles, ed. D. Banerjee, J. Jiang, K. Kusano, & S. Solanki (Cambridge, UK: Cambridge University Press), 115–120
- Ermolli et al. (2011) Ermolli, I., Criscuoli, S., & Giorgi, F. 2011, Contributions of the Astronomical Observatory Skalnate Pleso, 41, 73
- Ermolli et al. (2022) Ermolli, I., Giorgi, F., & Chatzistergos, T. 2022, Frontiers in Astronomy and Space Sciences, 9
- Ermolli et al. (2013) Ermolli, I., Matthes, K., Dudok de Wit, T., et al. 2013, Atmospheric Chemistry & Physics, 13, 3945
- Ermolli et al. (2015) Ermolli, I., Shibasaki, K., Tlatov, A., & van Driel-Gesztelyi, L. 2015, in The Solar Activity Cycle: Physical Causes and Consequences, ed. A. Balogh, H. Hudson, K. Petrovay, & R. von Steiger, Space Sciences Series of ISSI (New York, NY: Springer), 105–135
- Fedorov et al. (2021) Fedorov, V. M., Frolov, D. M., Velasco Herrera, V. M. N., Soon, W. W.-H., & Cionco, R. G. 2021, Izvestiya, Atmospheric and Oceanic Physics, 57, 1239
- Feulner (2011) Feulner, G. 2011, Geophysical Research Letters, 38
- Fligge & Solanki (2000) Fligge, M. & Solanki, S. K. 2000, Geophysical Research Letters, 27, 2157
- Fligge et al. (2000) Fligge, M., Solanki, S. K., & Unruh, Y. C. 2000, Astronomy and Astrophysics, 353, 380
- Fligge et al. (1998) Fligge, M., Solanki, S. K., Unruh, Y. C., Froehlich, C., & Wehrli, C. 1998, Astronomy and Astrophysics, 335, 709
- Floyd et al. (2003) Floyd, L., Rottman, G., Deland, M., & Pap, J. 2003, in Solar Variability as an Input to the Earth’s Environment, Vol. 535, 195–203
- Fontenla et al. (2006) Fontenla, J. M., Avrett, E., Thuillier, G., & Harder, J. 2006, The Astrophysical Journal, 639, 441
- Fontenla et al. (2011) Fontenla, J. M., Harder, J., Livingston, W., Snow, M., & Woods, T. 2011, Journal of Geophysical Research (Atmospheres), 116, 20108
- Fontenla & Landi (2018) Fontenla, J. M. & Landi, E. 2018, The Astrophysical Journal, 861, 120
- Foster (2004) Foster, S. S. 2004, PhD thesis, University of Southampton, pages: 430 Publication Title: Ph.D. Thesis ADS Bibcode: 2004PhDT………5F
- Foukal (1993) Foukal, P. 1993, Solar Physics, 148, 219
- Foukal (1996) Foukal, P. 1996, Geophysical Research Letters, 23, 2169
- Foukal (2012) Foukal, P. 2012, Solar Physics, 279, 365
- Foukal & Lean (1988) Foukal, P. & Lean, J. 1988, The Astrophysical Journal, 328, 347
- Fröhlich (2000) Fröhlich, C. 2000, Space Science Reviews, 94, 15
- Fröhlich (2006) Fröhlich, C. 2006, Space Science Reviews, 125, 53
- Fröhlich (2009) Fröhlich, C. 2009, Astronomy and Astrophysics, 501, L27
- Fröhlich (2012) Fröhlich, C. 2012, Surveys in Geophysics, 33, 453, aDS Bibcode: 2012SGeo…33..453F
- Fröhlich et al. (1997) Fröhlich, C., Crommelynck, D. A., Wehrli, C., et al. 1997, Solar Physics, 175, 267, number: 2
- Georgieva et al. (2015) Georgieva, K., Nagovitsyn, Y., & Kirov, B. 2015, Geomagnetism and Aeronomy, 55, 1026
- Gray et al. (2010) Gray, L. J., Beer, J., Geller, M., et al. 2010, Reviews of Geophysics, 48, 4001
- Gueymard (2018) Gueymard, C. A. 2018, Advances in Solar Resource Assessment and Forecasting, 168, 2
- Haberreiter et al. (2014) Haberreiter, M., Delouille, V., Mampaey, B., et al. 2014, Journal of Space Weather and Space Climate, 4, A30
- Haberreiter et al. (2008) Haberreiter, M., Schmutz, W., & Hubeny, I. 2008, Astronomy and Astrophysics, 492, 833
- Haigh (1994) Haigh, J. D. 1994, Nature, 370, 544
- Haigh (2007) Haigh, J. D. 2007, Living Reviews in Solar Physics, 4, 2
- Hall et al. (2009) Hall, J. C., Henry, G. W., Lockwood, G. W., Skiff, B. A., & Saar, S. H. 2009, The Astronomical Journal, 138, 312
- Hall & Lockwood (2004) Hall, J. C. & Lockwood, G. W. 2004, The Astrophysical Journal, 614, 942
- Harvey (1993) Harvey, K. L. 1993, PhD thesis, Utrecht University
- Hayakawa et al. (2022) Hayakawa, H., Hattori, K., Sôma, M., et al. 2022, The Astrophysical Journal, 941, 151, publisher: The American Astronomical Society
- Hayakawa et al. (2021a) Hayakawa, H., Iju, T., Murata, K., & Besser, B. P. 2021a, The Astrophysical Journal, 909, 194
- Hayakawa et al. (2021b) Hayakawa, H., Uneme, S., Besser, B. P., Iju, T., & Imada, S. 2021b, The Astrophysical Journal, 919, 1
- Heath & Schlesinger (1986) Heath, D. F. & Schlesinger, B. M. 1986, Journal of Geophysical Research, 91, 8672
- Herschel (1801) Herschel, W. 1801, Philosophical Transactions of the Royal Society of London, 91, 265
- Hickey et al. (1980) Hickey, J. R., Stowe, L. L., Jacobowitz, H., et al. 1980, Science, 208, 281
- Howard (1976) Howard, R. 1976, Solar Physics, 48, 411, aDS Bibcode: 1976SoPh…48..411H
- Hoyt et al. (1992) Hoyt, D. V., Kyle, H. L., Hickey, J. R., & Maschhoff, R. H. 1992, Journal of Geophysical Research, 97, 51, aDS Bibcode: 1992JGR….97…51H
- Hoyt & Schatten (1993) Hoyt, D. V. & Schatten, K. H. 1993, Journal of Geophysical Research, 98, 18
- Hoyt & Schatten (1998) Hoyt, D. V. & Schatten, K. H. 1998, Solar Physics, 179, 189
- Hudson et al. (1982) Hudson, H. S., Silva, S., Woodard, M., & Willson, R. C. 1982, Solar Physics, 76, 211
- IPCC (2021) IPCC. 2021, in Climate Change 2021: The Physical Science Basis. Contribution of Working Group I to the Sixth Assessment Report of the Intergovernmental Panel on Climate Change, ed. V. Masson-Delmotte, P. Zhai, A. Pirani, S. Connors, C. Péan, S. Berger, N. Caud, Y. Chen, L. Goldfarb, M. Gomis, M. Huang, K. Leitzell, E. Lonnoy, J. Matthews, T. Maycock, T. Waterfield, O. Yelekçi, R. Yu, & B. Zhou (Cambridge, United Kingdom and New York, NY, USA: Cambridge University Press), 2061–2086
- Kaiser Kudsk et al. (2022) Kaiser Kudsk, S. G., Knudsen, M. F., Karoff, C., et al. 2022, Quaternary Science Reviews, 292, 107617
- Kopp (2014) Kopp, G. 2014, Journal of Space Weather and Space Climate, 4, A14
- Kopp (2016) Kopp, G. 2016, Journal of Space Weather and Space Climate, 6, A30
- Kopp (2021) Kopp, G. 2021, Solar Physics, 296, 133
- Kopp et al. (2012) Kopp, G., Fehlmann, A., Finsterle, W., et al. 2012, Metrologia, 49, S29, aDS Bibcode: 2012Metro..49S..29K
- Kopp et al. (2016) Kopp, G., Krivova, N., Wu, C. J., & Lean, J. 2016, Solar Physics, 291, 2951
- Kren et al. (2017) Kren, A. C., Pilewskie, P., & Coddington, O. 2017, Journal of Space Weather and Space Climate, 7, A10
- Krivova et al. (2007) Krivova, N. A., Balmaceda, L., & Solanki, S. K. 2007, Astronomy and Astrophysics, 467, 335
- Krivova et al. (2003) Krivova, N. A., Solanki, S. K., Fligge, M., & Unruh, Y. C. 2003, Astronomy and Astrophysics, 399, L1
- Krivova et al. (2021) Krivova, N. A., Solanki, S. K., Hofer, B., et al. 2021, Astronomy & Astrophysics, 650, A70
- Krivova et al. (2011) Krivova, N. A., Solanki, S. K., & Schmutz, W. 2011, Astronomy and Astrophysics, 529, 81
- Krivova et al. (2009a) Krivova, N. A., Solanki, S. K., & Wenzler, T. 2009a, Geophysical Research Letters, 36, L20101
- Krivova et al. (2009b) Krivova, N. A., Solanki, S. K., Wenzler, T., & Podlipnik, B. 2009b, Journal of Geophysical Research (Atmospheres), 114
- Krivova et al. (2010) Krivova, N. A., Vieira, L. E. A., & Solanki, S. K. 2010, Journal of Geophysical Research (Space Physics), 115, 12112
- Kulmala et al. (2010) Kulmala, M., Riipinen, I., Nieminen, T., et al. 2010, Atmos. Chem. Phys., 10, 1885
- Laken et al. (2009) Laken, B., Wolfendale, A., & Kniveton, D. 2009, Geophysical Research Letters, 36, L23803, number: 23
- Laken et al. (2012) Laken, B. A., Pallé, E., Čalogović, J., & Dunne, E. M. 2012, Journal of Space Weather and Space Climate, 2, A18
- Lean (2000) Lean, J. 2000, Geophysical Research Letters, 27, 2425
- Lean et al. (1995) Lean, J., Beer, J., & Bradley, R. 1995, Geophysical Research Letters, 22, 3195
- Lean et al. (1992) Lean, J., Skumanich, A., & White, O. 1992, Geophysical Research Letters, 19, 1591
- Lean (2018) Lean, J. L. 2018, Earth and Space Science, 5, 133
- Lee III et al. (1995) Lee III, R. B., Gibson, M. A., Wilson, R. S., & Thomas, S. 1995, Journal of Geophysical Research: Space Physics, 100, 1667
- Lites (2011) Lites, B. W. 2011, Astrophys. J., 737, 52
- Lites et al. (2014) Lites, B. W., Centeno, R., & McIntosh, S. W. 2014, Publ. Astron. Sco. Japan, 66, S4
- Livingston et al. (2007) Livingston, W., Wallace, L., White, O. R., & Giampapa, M. S. 2007, The Astrophysical Journal, 657, 1137
- Livingston et al. (1976) Livingston, W. C., Harvey, J., Pierce, A. K., et al. 1976, Applied Optics, 15, 33
- Lockwood (2012) Lockwood, M. 2012, Surveys in Geophysics, 33, 503
- Lockwood & Ball (2020) Lockwood, M. & Ball, W. T. 2020, Proceedings of the Royal Society A: Mathematical, Physical and Engineering Sciences, 476, 20200077
- Lockwood et al. (2016) Lockwood, M., Owens, M. J., Barnard, L., & Usoskin, I. G. 2016, Solar Physics, 291, 2829
- Love (2013) Love, J. J. 2013, Geophysical Research Letters, 40, 4171, number: 16
- Mandal et al. (2020) Mandal, S., Krivova, N. A., Solanki, S. K., Sinha, N., & Banerjee, D. 2020, Astronomy & Astrophysics, 640, A78
- Marchenko et al. (2022) Marchenko, S. V., Lean, J. L., & DeLand, M. T. 2022, The Astrophysical Journal, 936, 158, publisher: American Astronomical Society
- Mauceri et al. (2019) Mauceri, S., Coddington, O., Lyles, D., & Pilewskie, P. 2019, Solar Physics, 294, 160
- Mironova et al. (2015) Mironova, I. A., Aplin, K. L., Arnold, F., et al. 2015, Space Science Reviews, 194, 1
- Montillet et al. (2022) Montillet, J.-P., Finsterle, W., Kermarrec, G., et al. 2022, Journal of Geophysical Research: Atmospheres, 127, e2021JD036146
- Mordvinov et al. (2004) Mordvinov, A. V., Makarenko, N. G., Ogurtsov, M. G., & Jungner, H. 2004, Solar Physics, 224, 247, aDS Bibcode: 2004SoPh..224..247M
- Murabito et al. (2023) Murabito, M., Ermolli, I., Chatzistergos, T., et al. 2023, The Astrophysical Journal, 947, 18, publisher: The American Astronomical Society
- Muscheler et al. (2016) Muscheler, R., Adolphi, F., Herbst, K., & Nilsson, A. 2016, Solar Physics, 291, 3025, number: 9-10
- Nèmec et al. (2022) Nèmec, N.-E., Shapiro, A. I., Işık, E., et al. 2022, The Astrophysical Journal Letters, 934, L23, publisher: American Astronomical Society
- Ortiz et al. (2002) Ortiz, A., Solanki, S. K., Domingo, V., Fligge, M., & Sanahuja, B. 2002, Astronomy and Astrophysics, 388, 1036
- Oster et al. (1982) Oster, L., Schatten, K. H., & Sofia, S. 1982, The Astrophysical Journal, 256, 768
- Peguero & Carrasco (2023) Peguero, J. C. & Carrasco, V. M. S. 2023, Solar Physics, 298, 48
- Penza et al. (2022) Penza, V., Berrilli, F., Bertello, L., et al. 2022, The Astrophysical Journal, 937, 84, publisher: American Astronomical Society
- Penza et al. (2003) Penza, V., Caccin, B., Ermolli, I., Centrone, M., & Gomez, M. T. 2003, in ESA Special Publication, Vol. 535, Solar Variability as an Input to the Earth’s Environment, 299–302
- Petrovay (2020) Petrovay, K. 2020, Living Reviews in Solar Physics, 17, 2
- Pierce (2017) Pierce, J. R. 2017, Journal of Geophysical Research: Atmospheres, 122, 8051
- Pierce & Adams (2009) Pierce, J. R. & Adams, P. J. 2009, Geophysical Research Letters, 36, L09820
- Pilewskie et al. (2018) Pilewskie, P., Kopp, G., Richard, E., et al. 2018, in Proceedings from the 20th EGU General Assembly held 4-13 April, 2018 in Vienna, Austria, Vol. 20, 5527
- Preminger et al. (2002) Preminger, D. G., Walton, S. R., & Chapman, G. A. 2002, Journal of Geophysical Research (Space Physics), 107, 1354
- Privalsky (2018) Privalsky, V. 2018, Journal of Atmospheric and Solar-Terrestrial Physics, 172, 138
- Puiu (2019) Puiu, C. C. 2019, Master’s thesis, Sapienza – University of Rome, Rome
- Rempel (2014) Rempel, M. 2014, Astrophys. J., 789, 132
- Rempel (2020) Rempel, M. 2020, Astrophys. J., 894, 140
- Richardson & Benestad (2022) Richardson, M. T. & Benestad, R. E. 2022, Research in Astronomy and Astrophysics, 22, 125008, publisher: National Astromonical Observatories, CAS and IOP Publishing
- Riley et al. (2014) Riley, P., Ben-Nun, M., Linker, J. A., et al. 2014, Solar Physics, 289, 769
- Roth & Joos (2013) Roth, R. & Joos, F. 2013, Climate of the Past, 9, 1879
- Rottman (1988) Rottman, G. J. 1988, Advances in Space Research, 8, 53, aDS Bibcode: 1988AdSpR…8g..53R
- Scafetta (2023) Scafetta, N. 2023, Geoscience Frontiers, 14, 101650
- Schatten et al. (1985) Schatten, K. H., Miller, N., Sofia, S., Endal, A. S., & Chapman, G. 1985, The Astrophysical Journal, 294, 689
- Schatten & Orosz (1990) Schatten, K. H. & Orosz, J. A. 1990, Solar Physics, 125, 179
- Scherrer et al. (2012) Scherrer, P. H., Schou, J., Bush, R. I., et al. 2012, Sol. Phys., 275, 207
- Schmidt et al. (2011) Schmidt, G. A., Jungclaus, J. H., Ammann, C. M., et al. 2011, Geoscientific Model Development, 4, 33
- Schmutz (2021) Schmutz, W. K. 2021, Journal of Space Weather and Space Climate, 11, 40
- Schrijver et al. (2011) Schrijver, C. J., Livingston, W. C., Woods, T. N., & Mewaldt, R. A. 2011, Geophysical Research Letters, 38, 6701
- Shapiro et al. (2011) Shapiro, A. I., Schmutz, W., Rozanov, E., et al. 2011, Astron. Astrophys., 529, A67
- Shapiro et al. (2017) Shapiro, A. I., Solanki, S. K., Krivova, N. A., et al. 2017, Nature Astronomy, 1, 612
- Shapiro et al. (2014) Shapiro, A. I., Solanki, S. K., Krivova, N. A., et al. 2014, Astronomy and Astrophysics, 569, A38
- Shapiro et al. (2016) Shapiro, A. I., Solanki, S. K., Krivova, N. A., Yeo, K. L., & Schmutz, W. K. 2016, Astronomy and Astrophysics, 589, A46
- Sinnhuber & Funke (2020) Sinnhuber, M. & Funke, B. 2020, in The Dynamic Loss of Earth’s Radiation Belts, ed. A. N. Jaynes & M. E. Usanova (Elsevier), 279–321, chapter 9, DOI: 10.1016/B978-0-12-813371-2.00009-3
- Sinnhuber et al. (2012) Sinnhuber, M., Nieder, H., & Wieters, N. 2012, Surveys in Geophysics, 33, 1281, aDS Bibcode: 2012SGeo…33.1281S
- Snow et al. (2014) Snow, M., Weber, M., Machol, J., Viereck, R., & Richard, E. 2014, Journal of Space Weather and Space Climate, 4, A04
- Solanki & Fligge (1998) Solanki, S. K. & Fligge, M. 1998, Geophysical Research Letters, 25
- Solanki & Fligge (1999) Solanki, S. K. & Fligge, M. 1999, Geophysical Research Letters, 26
- Solanki et al. (2000) Solanki, S. K., Schüssler, M., & Fligge, M. 2000, Nature, 408, 445
- Solanki et al. (2004) Solanki, S. K., Usoskin, I. G., Kromer, B., Schüssler, M., & Beer, J. 2004, Nature, 431, 1084
- Steinhilber et al. (2012) Steinhilber, F., Abreu, J. A., Beer, J., et al. 2012, Proceedings of the National Academy of Science, 109, 5967
- Steinhilber et al. (2009) Steinhilber, F., Beer, J., & Fröhlich, C. 2009, Geophysical Research Letters, 36, L19704
- Svalgaard (2007) Svalgaard, L. 2007, AGU Fall Meeting Abstracts, 2007, GC31B
- Svalgaard & Schatten (2016) Svalgaard, L. & Schatten, K. H. 2016, Solar Physics, 291, 2653
- Tapping et al. (2007) Tapping, K. F., Boteler, D., Charbonneau, P., et al. 2007, Solar Physics, 246, 309
- Tapping & Morton (2013) Tapping, K. F. & Morton, D. C. 2013, in Journal of Physics Conference Series, Vol. 440, 012039, aDS Bibcode: 2013JPhCS.440a2039T
- Tebabal et al. (2015) Tebabal, A., Damtie, B., Nigussie, M., Bires, A., & Yizengaw, E. 2015, Journal of Atmospheric and Solar-Terrestrial Physics, 135, 64
- Thornton & Parnell (2011) Thornton, L. M. & Parnell, C. E. 2011, Sol. Phys., 269, 13
- Unruh et al. (1999) Unruh, Y. C., Solanki, S. K., & Fligge, M. 1999, Astron. Astrophys., 345, 635
- Usoskin et al. (2021a) Usoskin, I., Kovaltsov, G., & Kiviaho, W. 2021a, Solar Physics, 296, 13
- Usoskin (2023) Usoskin, I. G. 2023, Living Reviews in Solar Physics, 20, 2
- Usoskin et al. (2015) Usoskin, I. G., Arlt, R., Asvestari, E., et al. 2015, Astronomy and Astrophysics, 581, A95
- Usoskin et al. (2016a) Usoskin, I. G., Gallet, Y., Lopes, F., Kovaltsov, G. A., & Hulot, G. 2016a, Astronomy and Astrophysics, 587, A150
- Usoskin et al. (2016b) Usoskin, I. G., Kovaltsov, G. A., & Chatzistergos, T. 2016b, Solar Physics, 291, 3793
- Usoskin et al. (2016c) Usoskin, I. G., Kovaltsov, G. A., Lockwood, M., et al. 2016c, Solar Physics, 291, 2685, number: 9-10
- Usoskin et al. (2021b) Usoskin, I. G., Solanki, S. K., Krivova, N. A., et al. 2021b, Astronomy & Astrophysics, 649, A141
- Vaquero et al. (2015) Vaquero, J. M., Kovaltsov, G. A., Usoskin, I. G., Carrasco, V. M. S., & Gallego, M. C. 2015, Astronomy and Astrophysics, 577, A71
- Vaquero et al. (2016) Vaquero, J. M., Svalgaard, L., Carrasco, V. M. S., et al. 2016, Solar Physics, 291, 3061
- Velasco Herrera et al. (2015) Velasco Herrera, V. M., Mendoza, B., & Velasco Herrera, G. 2015, New Astronomy, 34, 221
- Vieira et al. (2011) Vieira, L. E. A., Solanki, S. K., Krivova, N. A., & Usoskin, I. 2011, Astronomy and Astrophysics, 531, 6
- Vögler et al. (2004) Vögler, A., Bruls, J. H. M. J., & Schüssler, M. 2004, Astron. Astrophys., 421, 741
- Vögler & Schüssler (2007) Vögler, A. & Schüssler, M. 2007, Astron. Astrophys., 465, L43
- Vögler et al. (2005) Vögler, A., Shelyag, S., Schüssler, M., et al. 2005, Astron. Astrophys., 429, 335
- Vokhmyanin et al. (2020) Vokhmyanin, M., Arlt, R., & Zolotova, N. 2020, Solar Physics, 295, 39
- Walton et al. (2003) Walton, S. R., Preminger, D. G., & Chapman, G. A. 2003, The Astrophysical Journal, 590, 1088
- Wang & Lean (2021) Wang, Y. M. & Lean, J. L. 2021, The Astrophysical Journal, 920, 100
- Wang et al. (2005) Wang, Y.-M., Lean, J. L., & Sheeley, Jr., N. R. 2005, The Astrophysical Journal, 625, 522
- Wenzler et al. (2006) Wenzler, T., Solanki, S. K., Krivova, N. A., & Fröhlich, C. 2006, Astronomy and Astrophysics, 460, 583
- Willamo et al. (2017) Willamo, T., Usoskin, I. G., & Kovaltsov, G. A. 2017, Astronomy & Astrophysics, 601, A109
- Willis et al. (2016) Willis, D. M., Wild, M. N., Appleby, G. M., & Macdonald, L. T. 2016, Solar Physics, 291, 2553
- Willson (1981) Willson, R. C. 1981, Solar Physics, 74, 217
- Willson (1997) Willson, R. C. 1997, Science, 277, 1963
- Willson et al. (1981) Willson, R. C., Gulkis, S., Janssen, M., Hudson, H. S., & Chapman, G. A. 1981, Science, 211, 700
- Willson & Hudson (1981) Willson, R. C. & Hudson, H. S. 1981, The Astrophysical Journal, 244, L185, aDS Bibcode: 1981ApJ…244L.185W
- Willson & Hudson (1988) Willson, R. C. & Hudson, H. S. 1988, Nature, 332, 810
- Willson & Hudson (1991) Willson, R. C. & Hudson, H. S. 1991, Nature, 351, 42
- Willson & Mordvinov (2003) Willson, R. C. & Mordvinov, A. V. 2003, AGU Fall Meeting Abstracts, 31
- Woods et al. (2021) Woods, T. N., Harder, J. W., Kopp, G., et al. 2021, Solar Physics, 296, 127
- Woods et al. (2000) Woods, T. N., Tobiska, W. K., Rottman, G. J., & Worden, J. R. 2000, Journal of Geophysical Research, 105, 27195
- Wright (2004) Wright, J. T. 2004, The Astronomical Journal, 128, 1273
- Wu et al. (2018) Wu, C.-J., Krivova, N. A., Solanki, S. K., & Usoskin, I. G. 2018, Astronomy & Astrophysics, 620, A120
- Xu et al. (2021) Xu, H., Lei, B., & Li, Z. 2021, Earth and Space Science, 8, e2021EA001819
- Yeo (2014) Yeo, K. L. 2014, PhD thesis, Technischen Universität Carolo-Wilhelmina, Braunschweig
- Yeo et al. (2015) Yeo, K. L., Ball, W. T., Krivova, N. A., et al. 2015, Journal of Geophysical Research (Space Physics), 120, 6055
- Yeo et al. (2017) Yeo, K. L., Krivova, N. A., & Solanki, S. K. 2017, Journal of Geophysical Research: Space Physics, 122, 3888
- Yeo et al. (2014) Yeo, K. L., Krivova, N. A., Solanki, S. K., & Glassmeier, K. H. 2014, Astronomy and Astrophysics, 570, A85
- Yeo et al. (2013) Yeo, K. L., Solanki, S. K., & Krivova, N. A. 2013, Astronomy and Astrophysics, 550, 95
- Yeo et al. (2020a) Yeo, K. L., Solanki, S. K., & Krivova, N. A. 2020a, Astronomy & Astrophysics, 639
- Yeo et al. (2021) Yeo, K. L., Solanki, S. K., Krivova, N. A., & Jiang, J. 2021, Astronomy & Astrophysics, 654, A28
- Yeo et al. (2020b) Yeo, K. L., Solanki, S. K., Krivova, N. A., et al. 2020b, Geophys. Res. Lett., 47, e90243
- Yeo et al. (2017) Yeo, K. L., Solanki, S. K., Norris, C. M., et al. 2017, Phys. Rev. Lett., 119, 091102
- Yeo et al. (2017) Yeo, K. L., Solanki, S. K., Norris, C. M., et al. 2017, Physical Review Letters, 119
- Zacharias (2014) Zacharias, P. 2014, Surveys in Geophysics, 35, 897, number: 4
- Zhao & Han (2012) Zhao, J. & Han, Y. 2012, Science China Physics, Mechanics and Astronomy, 55, 179