LIDA: A Tool for Automatic Generation of Grammar-Agnostic Visualizations and Infographics using Large Language Models
Abstract
Systems that support users in the automatic creation of visualizations must address several subtasks - understand the semantics of data, enumerate relevant visualization goals and generate visualization specifications. In this work, we pose visualization generation as a multi-stage generation problem and argue that well-orchestrated pipelines based on large language models (llms) and image generation models (igms) are suitable to addressing these tasks. We present lida, a novel tool for generating grammar-agnostic visualizations and infographics. lida comprises of 4 modules - A summarizer that converts data into a rich but compact natural language summary, a goal explorer that enumerates visualization goals given the data, a visGenerator that generates, refines, executes and filters visualization code and an infographer module that yields data-faithful stylized graphics using igms. lida provides a python api, and a hybrid User Interface (direct manipulation and multilingual natural language) for interactive chart, infographics and data story generation. Code and demo are available at this url - https://microsoft.github.io/lida/
1 Introduction
Visualizations make data accessible by reducing the cognitive burden associated with extracting insights from large tabular datasets. However, visualization authoring is a complex creative task, involving multiple steps. First the user must build familiarity with the dataset (content and semantics) and enumerate a set of relevant goals or hypotheses that can be addressed using the data. Next, users must select the right visualization representation (marks, transformations and layout) for each goal. Finally, the user must implement the visualization either as code or using available direct manipulation interfaces. Each of these steps require expertise, and can be tedious as well as error prone for users with limited visualization experience (novices). Existing research has sought to address these challenges by automating the visualization (autoviz) creation process, given a dataset Podo et al. (2023). Automation may occur in two modes: i.) fully automated - the system automatically generates visualizations relevant to the data ii.) semi-automated - the user specifies their goals and the system generates visualizations that address these goals. The former mode is valuable for users unfamiliar with the data and the latter is valuable for users with some familiarity with the data and the visualization task.
Consequently, a successful autoviz tool must excel at each of several subtasks - understand the semantics of the data, enumerate relevant visualization goals and generate visualization specifications that meet syntax, design, task and perceptual requirements of these goals Podo et al. (2023). Furthermore, given the target demographic (novice users), such a tool must support the user by offering nl (nl) interaction modalities Mitra et al. (2022); Narechania et al. (2020); Chen et al. (2022), affordances to control system behavior and sense making tools to understand and debug/verify system behavior. While related work has addressed aspects of the autoviz task, there are several known limitations Podo et al. (2023) such as they: (i) rely on heuristics that are limited in coverage, challenging to craft and tedious to maintain Wongsuphasawat et al. (2017). (ii) require significant user interaction to generate visualizations Wongsuphasawat et al. (2017); Moritz et al. (2018). (iii) implement automated approaches that offer limited control over system input and output Dibia and Demiralp (2019) (iv) require grammar (or chart type) specific training data and model architectures Dibia and Demiralp (2019); Luo et al. (2018) for each sub task, (v) do not consider alternative chart representation formats such as infographics.
Concurrently, advances in large foundation models Bommasani et al. (2021) have shown state of the art performance on a variety of creative tasks such as multilingual text generation, code generation, image captioning, image generation, and image editing. In this work, we argue that the vast capabilities of these models can be assembled to address the autoviz task, whilst addressing the limitations of existing approaches. This work makes the following contributions:
-
•
We present a novel multi-stage, modular approach (Fig 1) for the automatic generation of data visualization and infographics using llms111This work primarily utilizes the OpenAI gpt-3.5-turbo-x line of models for text and code generation.. Specifically, we (i) Efficiently represent datasets as nl summaries, suitable as grounding context for an llm to address visualization tasks. (ii) Generate a set of visualization goals using llms. Importantly, we leverage prompt engineering to steer the model towards generating correct visualization that follow best practices (see Appendix C). (iii) Apply llms to generate grammar-agnostic visualization specification based on generated (or human provided) goals. (iv) Provide a hybrid interface that supports traditional direct manipulation controls (e.g., manually select which fields to explore) and a rich multilingual nl interface to support user’s with varied skill/experience. (v) Apply text-conditioned image generation models (igm) models in generating stylized infographics that are both informative (generally faithful to data), aesthetically pleasing, memorable and engaging (see section 2.3).
-
•
We introduce metrics for evaluating llm-enabled visualization tools, including a metric for pipeline reliability (visualization error rate - ver), and visualization quality (self-evaluated visualization quality - sevq) (see section 4).
-
•
We implement our approach in an Open Source library - lida222https://microsoft.github.io/lida/.. lida provides a python api, a web api and a rich web interface useful for research and practical applications.
Compared to existing autoviz approaches, lida proposes an implementation that is simplified (eliminates the need for subtask-specific models), general (can be adapted to generate visualizations in any programming language or grammar), flexible (individual modules can be optimized) and scalable (the system performance will improve with advances in the underlying llm). Taken together, these contributions provide building blocks towards complex workflows such as visualization translation, chart question answering (with applications in accessibility of charts), automated data exploration and automated data stories.
To the best of our knowledge, lida is the first tool to formulate visualization/infographic generation as a multi-step generation task and demonstrate an end-to-end pipeline that addresses a variety of subtasks.
2 Related Work
lida is informed by research on large foundation models applied to creative tasks across modalities such as text and images, and advances in automated generation of visualizations and infographics.
2.1 Foundation Models for Creative Tasks
Advances in large transformer-based Vaswani et al. (2017) models trained on massive amounts of data (terabytes of text and images) have led to a paradigm shift where a single model demonstrates state of the art task performance across multiple data modalities such as text, images, audio and video. These models, also known as foundation models Bommasani et al. (2021), have been shown to be effective for a variety of human creativity tasks. llms like the GPT3 series Brown et al. (2020), OPT Zhang et al. (2022), PALM Chowdhery et al. (2022), LAMBDA Cohen et al. (2022) learn complex semantics of language allowing them to be effective in tasks such as text summarization, question answering. Code llms such as Codex Chen et al. (2021), AlphaCode Li et al. (2022), InCoder Fried et al. (2022) show state of the art performance on a suite of code intelligence tasks. Finally, models such as CLIP Radford et al. (2021), DALLE Ramesh et al. (2022, 2021) and Latent Diffusion Rombach et al. (2022) have shown state of the art capabilities on image generation tasks such as image captioning, image editing, and image generation.
In this work, we adopt insights from Program-Aided Language models Gao et al. (2022) - a setup where llms generate programs as the intermediate reasoning steps, but offload the solution step to a runtime such as a python interpreter. We leverage the language modeling capabilities of llms in generating semantically meaningful visualization goals, and their code writing capabilities in generating visualization code which is compiled to yield visualizations. These visualizations (images) are then used as input to image generation models in generating stylized infographics.
2.2 Automated Visualization (autoviz)
Extant autoviz research have explored multiple approaches such as heuristics, task decomposition or learning based approaches. Heuristics-based approaches explore properties of data in generating a search space of potential visualizations Wongsuphasawat et al. (2017), ranking these visualizations based on quality attributes Luo et al. (2018); Moritz et al. (2018) and presenting them to the user. For example, DeepEye Luo et al. (2018) enumerates all possible visualizations and classifies/ranks them as “good” or “bad” using a binary decision tree classifier while Voyager Wongsuphasawat et al. (2017) uses heuristics to enumerate the space of visualizations. However, heuristics can be tedious to maintain, may have poor coverage of the visualization space and does not leverage information encoded in existing datasets. More recent work has explored a task decomposition approach where the autoviz process is decomposed into multiple tasks that are solved individually via specialized tools and aggregated to yield visualizations Narechania et al. (2020); Chen et al. (2022); Wang et al. (2022b). For example NL4DV Narechania et al. (2020) implements a custom query engine that parses natural language queries, identifies attributes/tasks and generates Vega-Lite specifications. A limitation of task decomposition approaches is that they are bottlenecked by the implementation performance for each step (e.g., limitations with models for disambiguating natural language queries as seen in NL4DV Narechania et al. (2020)). Finally, end-to-end learning-based approaches seek to automatically learn mappings from data directly to generated visualizations. For example, Data2Vis Dibia and Demiralp (2019) (the most relevant work to this study) uses a sequence to sequence model that implicitly addresses autoviz subtasks by learning a mapping from raw JSON data sampled from datasets to Vega-Lite Satyanarayan et al. (2017) specifications. Some limitations of current learning approaches is that they are limited to a single grammar, require custom models, custom paired training data and training objectives Dibia and Demiralp (2019); Luo et al. (2018); Chen et al. (2022) for each supported grammar, and do not provide a path to generating infographics. Furthermore, they do not provide mechanisms for fine-grained control of visualization output or provide robust error detection and recovery strategies.
lida addresses these limitations in several ways: (i) Leverages patterns learned by llms from massive language and code dataset, applying this knowledge to subtasks. (ii) Provides a single grammar-agnostic pipeline that generates visualization in multiple programming languages and visualization grammars. (iii) Supports natural language based control of generated visualizations. (iv) leverage emergent capabilities of large language models such chain of thought reasoning to improve reliability of generated text/code Kojima et al. (2022); Wei et al. (2022); Shi et al. (2022a), model calibration Kadavath et al. (2022) (predictions on correctness probabilities of visualizations) as well as self-consistency Wang et al. (2022a) in ranking/filtering results. (v) provides a mechanism for generating infographics that are data-faithful and aesthetically pleasing. (vi) supports a fully automatic mode where an llm is used to discover meaningful goals/hypotheses (fields to visualize, questions to ask) or a semi automatic mode where the user provides a hypothesis and it generates a visualization.
By choosing to cast visualization/infographic generation as generation tasks that offloads core problem solving to llms and igms, lida simplifies the design and maintenance of such systems.
2.3 Infographics Generation
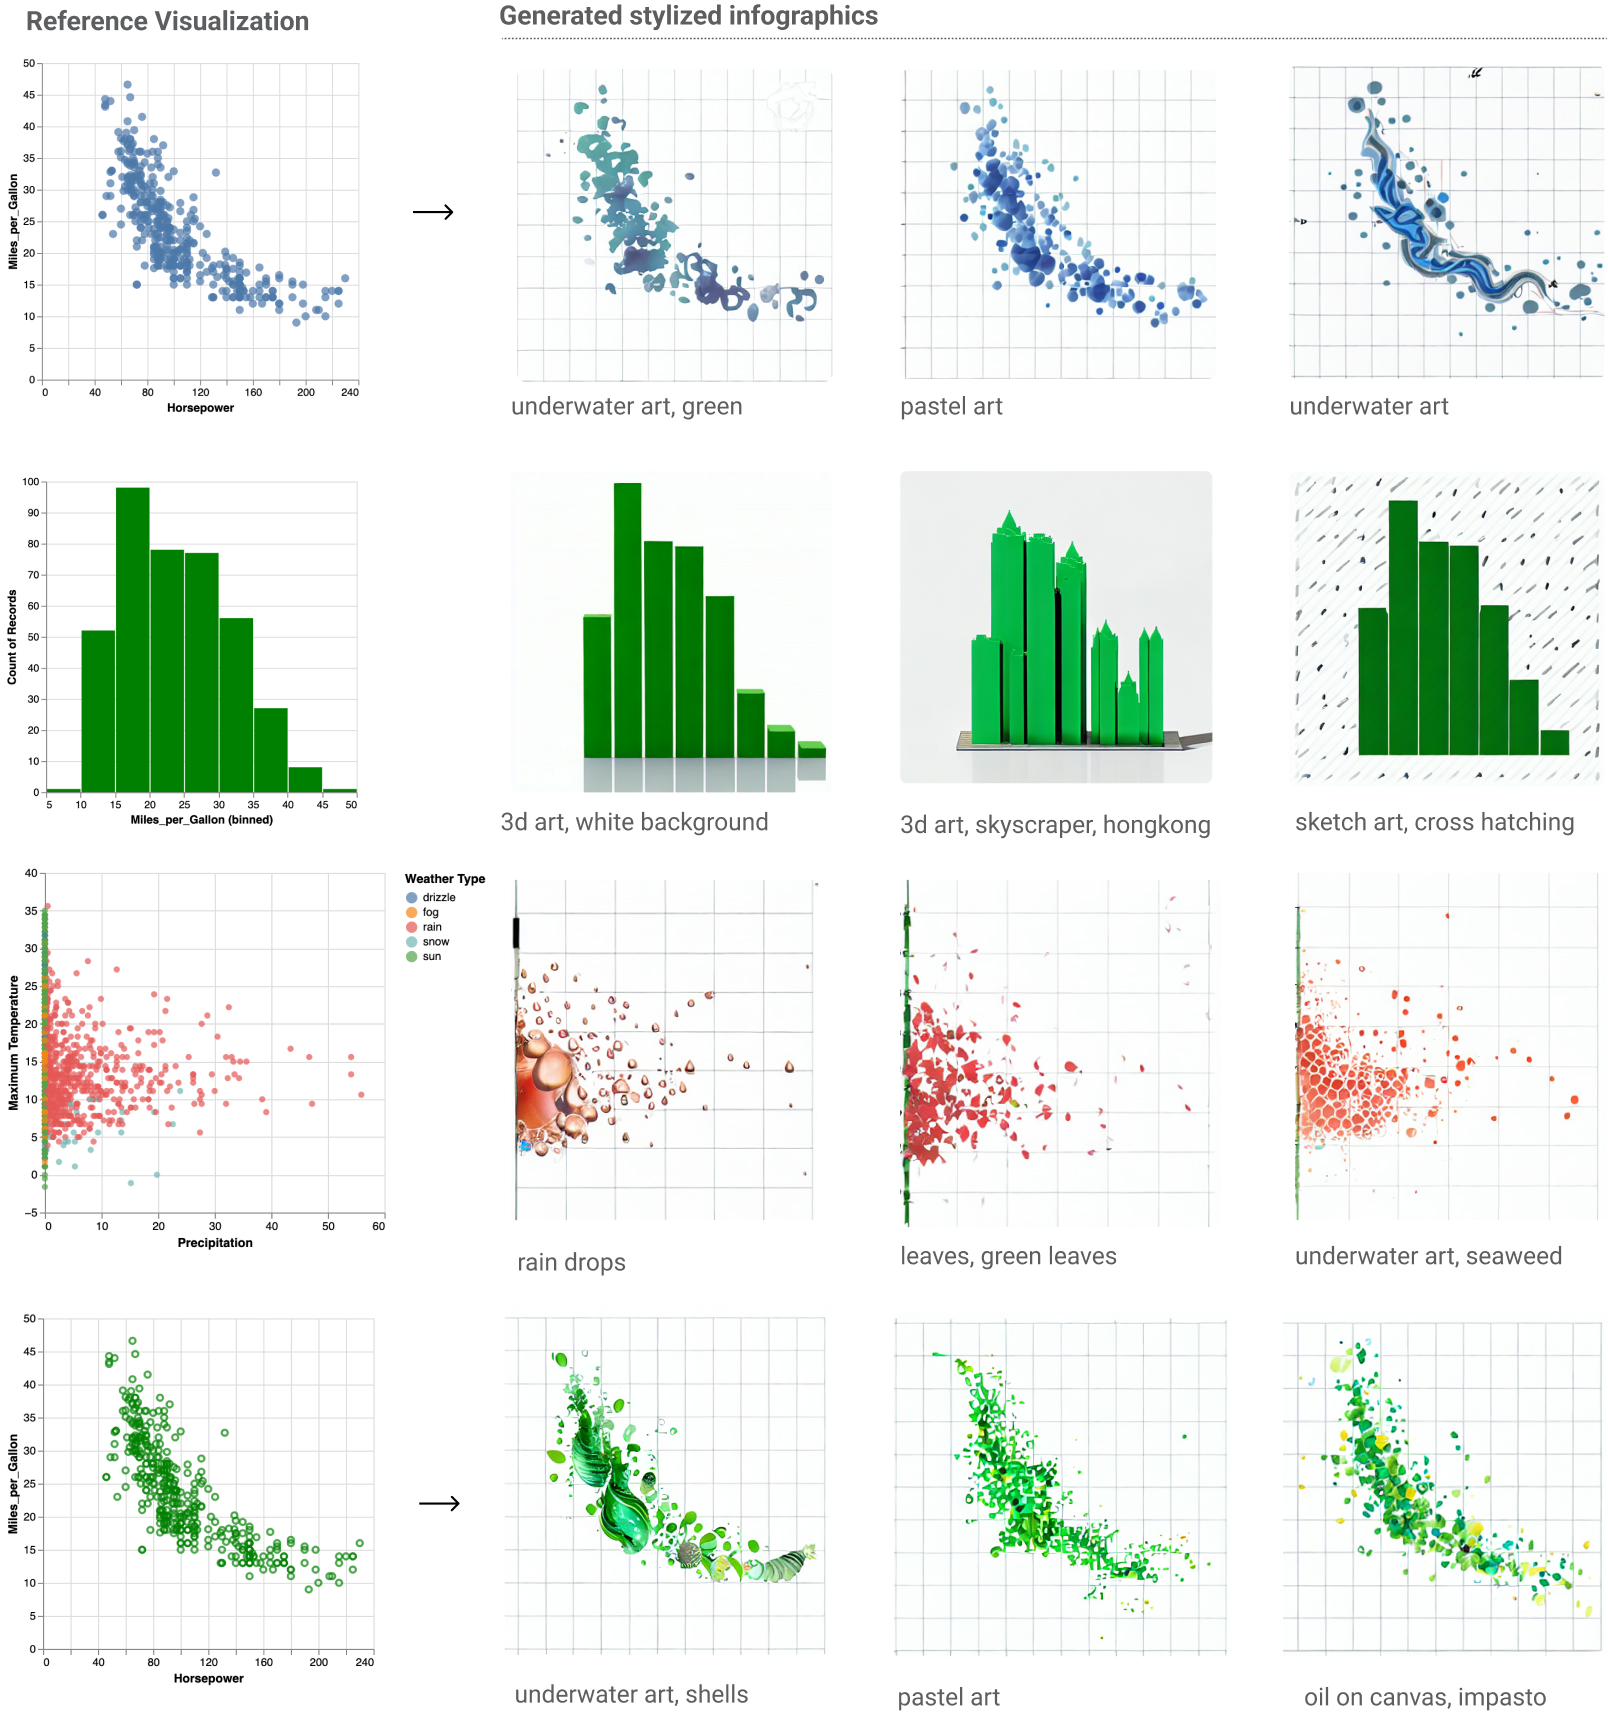
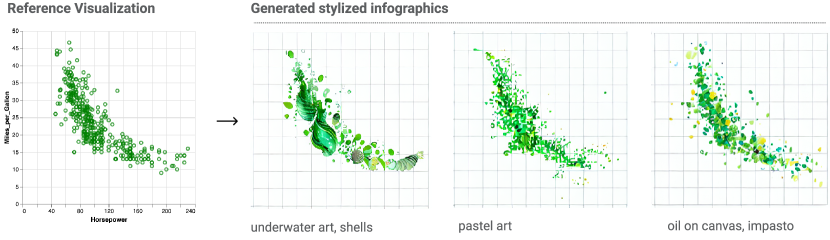
Infographics (information graphics) are visual artifacts that seek to convey complex data-driven narratives using visual imagery and embellishments Harrison et al. (2015). Existing research has shown that infographics are aesthetically pleasing, engaging and more memorable Tyagi et al. (2021); Harrison et al. (2015); Haroz et al. (2015), at no additional cost to the user Haroz et al. (2015). These properties have driven their applications in domains like fashion, advertisemnt, business and general communications. However, the creation of infographics that convey data insights can be a tedious process for content creators, often requiring skills across multiple tools and domains. Research on infographic generation have mainly explored the creation of pictographs Haroz et al. (2015) - replacing the marks on traditional charts with generated images and learning to extract/transfer styles from existing pictographs Shi et al. (2022b). In this work, we extend this domain to exploring the generation of both visual marks as well as generating the entire infographic based on natural language style descriptions using large image generation models such as DALLE Ramesh et al. (2022, 2021) and Latent Diffusion Rombach et al. (2022). This approach also enables user-generated visual styles and personalization of visualizations to fit user preferences such as color palettes, visual styles, fonts etc.
3 The lida System
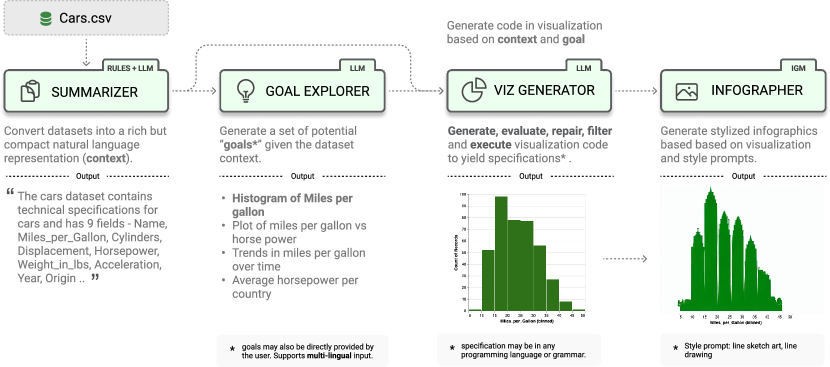
lida comprises of 4 core modules - a summarizer, a goal explorer, a visGenerator and an infographer (see Fig 1). Each module is implemented in the lida github repo as a python library with an optional user interface (see Appendix A).
3.1 summarizer
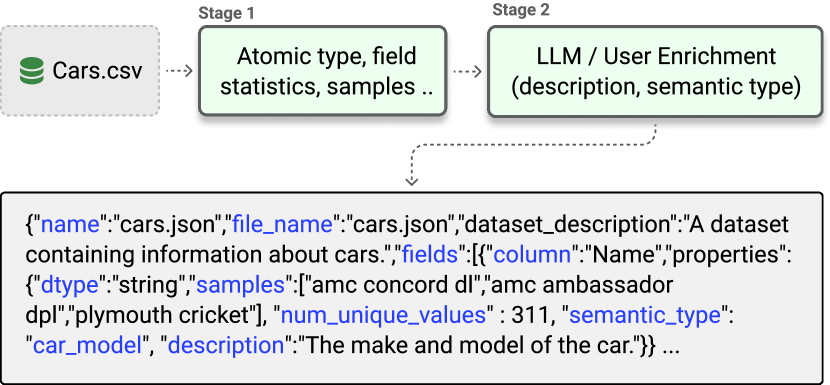
llms are capable zero shot predictors, able to solve multiple tasks with little or no guiding examples. However, they can suffer from hallucination e.g., generating text that is not grounded in training data or the current task. One way to address this is to augment Mialon et al. (2023) the llm with grounding context. Thus, the goal of the summarizer is to produce an information dense but compact 333 Note: the summary must be compact in order to maximize the limited context token budget of llms. summary for a given dataset that is useful as grounding context for visualization tasks. A useful context is defined as one that contains information an analyst would need to understand the dataset and the tasks that can be performed on it. The summary is implemented in two stages (see Fig 3)
Stage 1 - Base summary generation: We apply rules in extracting dataset properties including atomic types (e.g., integer, string, boolean) using the pandas library McKinney (2010), general statistics (min, max, # unique values) and a random non-null list of samples for each column.
Stage 2 - Summary enrichment: The base summary is optionally enriched by an llm or a user via the lida ui to include semantic description of the dataset (e.g., a dataset on the technical specification of cars), and fields (e.g., miles per gallon for each car) as well as field semantic type prediction Zhang et al. (2019).
3.2 goal explorer
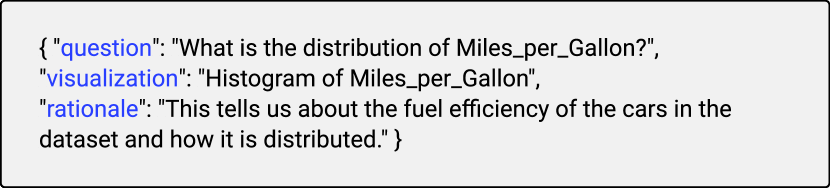
This module generates data exploration goals, given a summary generated by the summarizer. We express goal generation as a multitask generation problem where the llm must generate a question (hypothesis), a visualization that addresses the question and rationale (see Fig 4). We find that requiring the llm to produce a rationale leads to more semantically meaningful goals.
3.2.1 visGenerator
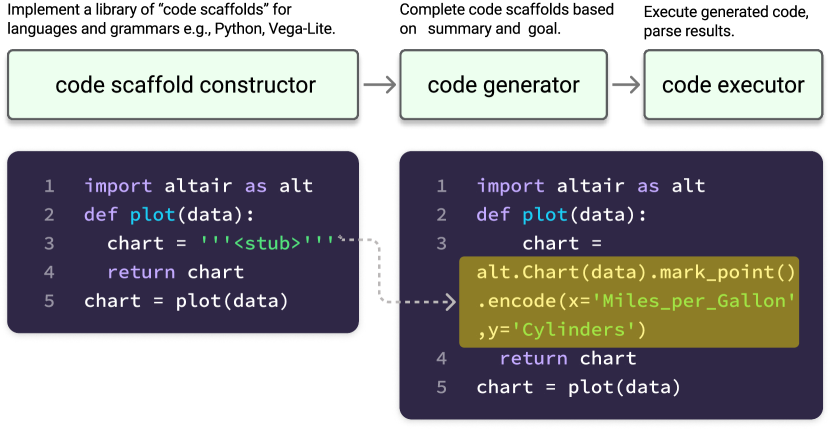
The visGenerator generates visualization specifications and is comprised of 3 submodules - a code scaffold constructor, a code generator and a code executor.
Code scaffold constructor: Implements a library of code scaffolds that correspond to programming languages and visualization grammars e.g., python scaffolds support grammars such as Matplotlib, GGPlot, Plotly, Altair, Seaborn, and Bokeh. Each scaffold is an executable program that i.) imports relevant dependencies ii.) defines an empty function stub which returns a visualization specification (see Fig 5a).
Code generator: Takes a scaffold, a dataset summary, a visualization goal, and builds a prompt. An llm (applied in fill-in-the-middle mode Bavarian et al. (2022)) is then used to generate candidate visualization code specifications.
Code executor: Post-processes and executes444Execution in a sandbox environment is recommended. the code specifications as well as filters the results. lida implements several filtering mechanisms to detect errors, each with latency tradeoffs: (i) generates a large sample for with high temperature, discard candidates that do not compile. (ii) apply self consistency Wang et al. (2022a) in llms where multiple candidates are generated and the solution with the highest consensus is selected. (iii) generate correctness probabilities Kadavath et al. (2022) for all candidates and selects the one with the highest probability. Note that the last two approaches are computationally expensive (require multiple forward passes through an llm) and are not suitable for real time applications. The final output is a list of visualization specifications (code) and associated raster images.
3.2.2 VizOps - Operations on Generated Visualizations
Given that lida represents visualizations as code, the visGenerator also implements submodules to perform operations on this representation.
Natural language based visualization refinement: Provides a conversational api to iteratively refine generated code (e.g., translate chart t hindi … zoom in by 50% etc) which can then be executed to generate new visualizations.
Visualization explanations and accessibility: Generates natural language explanations (valuable for debugging and sensemaking) as well as accessibility descriptions (valuable for supporting users with visual impairments).
Visualization code self-evaluation and repair: Applies an llm to self-evaluate generated code on multiple dimensions (see section 4.1.2).
Visualization recommendation: Given some context (goals, or an existing visualization), recommend additional visualizations to the user (e.g., for comparison, or to provide additional perspectives).
3.3 infographer
This module is tasked with generating stylized graphics based on output from the visGenerator module (see Fig 2). It implements a library of visual styles described in nl that are applied directly to visualization images. Note that the style library is editable by the user. These styles are applied in generating infographics using the text-conditioned image-to-image generation capabilities of diffusion models Rombach et al. (2022), implemented using the Peacasso library api Dibia (2022). An optional post processing step is then applied to improve the resulting image (e.g., replace axis with correct values from visualization, removing grid lines, and sharpening edges).
3.4 User Interface
lida implements a user interface that communicates with the core modules over a REST and Websocket api. The user interface implements several views.
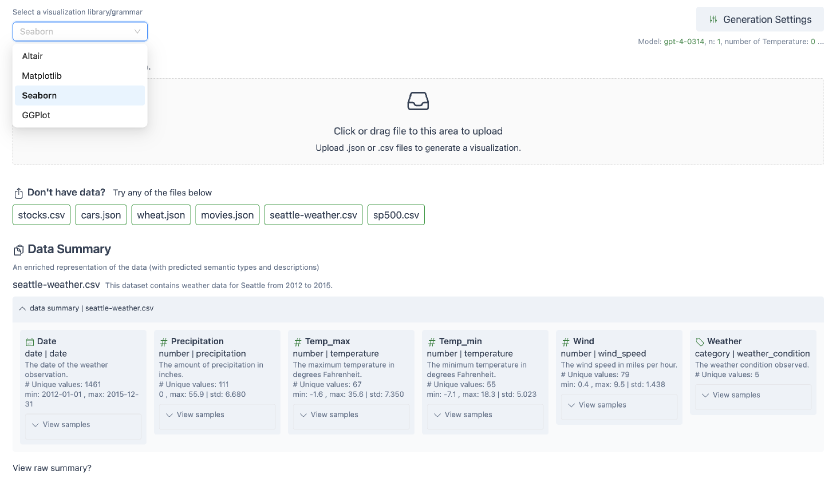
Data upload and summarization: This view allows the user to upload a dataset and explore a sample of rows in the dataset via a table view. A data upload event triggers a call to the summarizer and goal explorer module and displays a summary of the dataset and a list of potential goals. This view also allows the user to optionally annotate and refine the generated summary or curate fields used in the dataset.
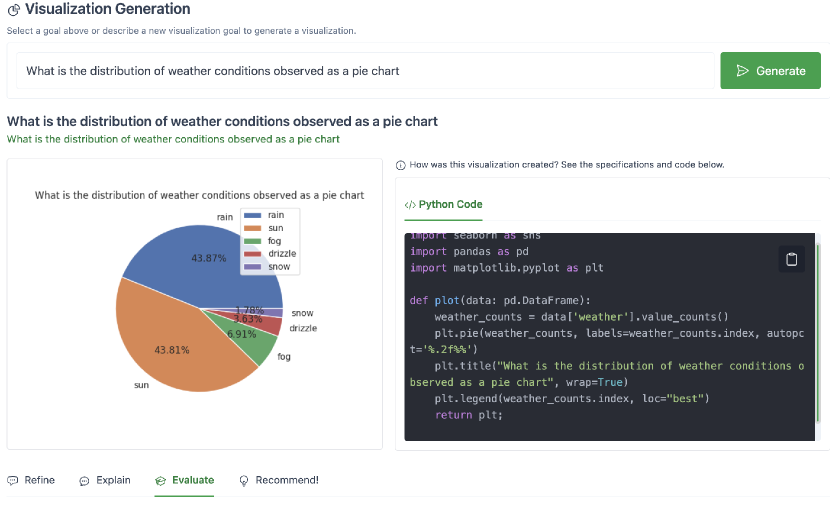
Visualization view: This view allows the user to optionally provide a visualization goal in nl (e.g., "what is the fuel efficiency per country?") or select a generated goal and then displays a generated visualization . For each visualization, intermediate output from the models (underlying data summary, visualization specification, code scaffold) are shown as explanations to aid in sensemaking, and debugging(see Fig 9). This view also implements the VizOps capabilities described in Section 3.2.2 (e.g., See the interface for visualization evaluation in Fig 10). Note that the nl interface inherits the multilingual language capabilities of the underlying llm, enabling multilingual nl interaction.
Overall, the combination of these modules result in a system that is able to implicitly address an array of data visualization operations such as data transformation, encoding, mark selection, styling, layout, and annotation Wang et al. (2022b).
4 Evaluation
4.1 Evaluation Metrics
Our initial evaluation of lida focuses on two high level metrics - visualization error rates (ver) to provide signals on the reliability of the lida pipeline, and self-evaluated visualization quality (sevq) to assess the quality of generated visualizations.
4.1.1 Visualization Error Rate (ver)
Visualization error rate is computed as the percentage of generated visualizations that result in code compilation errors. This metric provides critical insights into the reliability of the lida pipeline and impact of changes to the system (e.g., prompt engineering or scaffold update).
Where: - = Number of generated visualizations with code compilation errors, and - = Total number of generated visualizations.
4.1.2 Self-Evaluated Visualization Quality (sevq)
Recent work shows llms like GPT-4 encode broad world knowledge OpenAI (2023), can assess the quality of their output Kadavath et al. (2022); Lin et al. (2022) and can approximate human judgements for tasks such as summarization Liu et al. (2023). Our observations applying GPT3.5/GPT-4 to visualization tasks suggest similar results. Specifically, GPT-4 has learned to encode some visualization best practices and can apply these in generating critiques of visualization code across multiple dimensions. Thus, to evaluate visualization quality, we compute an sevq metric by applying GPT-4 in assessing the quality of generated visualizations. Specifically, we task GPT-4 with scoring generated visualization code (a numeric value from 1-10 and a rationale) across 6 dimensions - code accuracy, data transformation, goal compliance, visualization type, data encoding, and aesthetics. These dimensions are informed by existing literature on visualization generation/recommendation e.g., Wang et al. (2022b) outline 6 visualization tasks including data transformation, encoding, marks, styling, layout and annotation, while Moritz et al. (2018) codify constraints for visualization quality across expressivity (does it convey the facts of the data) and effectiveness (is the information more readily perceived compared to other visualizations) criteria. Additional details on prompts used for each dimension are provided in Appendix B.
4.2 Evaluation Benchmark Settings
Our initial benchmark is based on 57 datasets sourced from the vega datasets repository555https://github.com/vega/vega-datasets. For each dataset, lida is tasked with generating 5 goals and 1 visualization per goal across multiple grammars666 lida is given a single try for each step. In theory, the error rates can be driven to zero, by recursively applying the visualization self-evaluation and self-repair modules.. For reproducibility, we set and number of samples for the llm. A gallery of the generated evaluation visualizations can be viewed on the lida project page.
4.3 Evaluation and Ablation Study Results
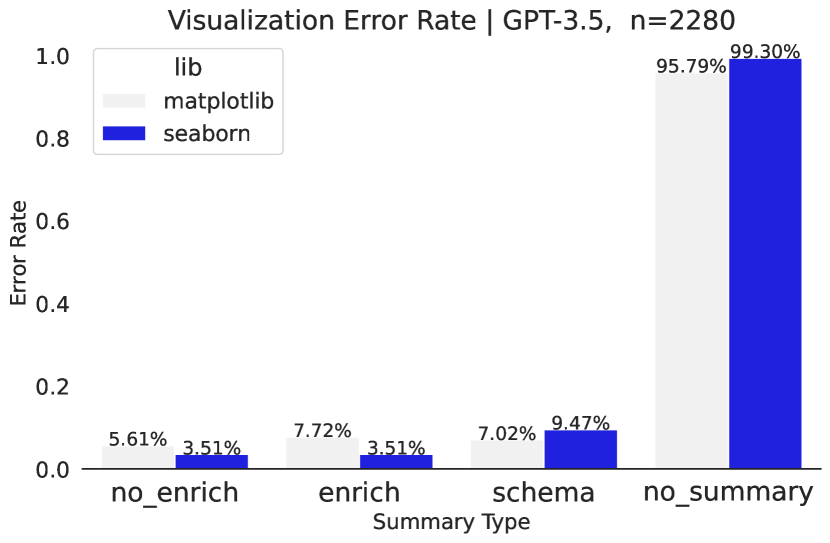
Overall, we find that lida is able to generate visualizations with a low error rate (ver = 3.5%). We also conduct an ablation study to inform on the impact of the summarizer across the following conditions - (i) no_enrich: a base summary with no enrichment (see Section 3.1), (ii) enrich: summary with llm enrichment, (iii) schema: only field names, i.e., schema as summary, and (iv) no_summary: no summary . Results show that including a summary leads to reduced error rate compared to simply adding field names (schema) as summary. We also find that enriching the base summary with an llm has less of an effect on ver (with variations across visualization grammar), and an expressive, well-represented grammar like Seaborn having lower ver. These results are summarized in Figure 6. We also find that the sevq metric is valuable in identifying semantic quality issues with generated visualizations. For example, Fig 10 shows an example where the user has requested a pie chart, and the lida self-evaluation module critiques this visualization using the sevq metric, providing a rationale for why a bar chart is more effective (see Fig 10), with the option to automatically repair the visualization.
5 Conclusion
In this work, we formulate visualization generation as a multi-stage text (and code) generation problem that can be addressed using large language models. We present lida - a tool for the automatic generation of grammar-agnostic visualizations and infographics. lida addresses limitations of current automatic visualization systems - automatic generation of hypothesis/goals given datasets, conversational interface for controllable visualization generation and refinement, support for multiple visualization grammars using the same pipeline and the ability to generate infographics. lida is effective compared to state of the art systems (see example gallery of generated visualizations); it offers a simplified system implementation and leverages the immense language modeling and code generation capabilities of llms in implicitly solving complex visualization subtasks. Finally, we introduce metrics for assessing reliability (visualization error rate - ver) and visualization quality (self-evaluated visualization quality -sevq) for llm-enabled visualization tools. We hope modules implemented in lida will serve as useful building blocks in enabling complex creative workflows such as visualization translation, chart question answering(with applications in accessibility of charts), automated data exploration and automated storytelling.
6 Limitations
While lida demonstrates clear advances in how we can support users in authoring visualizations and infographics, there are several limitations that offer a natural avenue for future research.
Low Resource Grammars: The problem formulation introduced in lida depends on the underlying llms having some knowledge of visualization grammars as represented in text and code in its training dataset (e.g., examples of Altair, Vega, Vega-Lite, GGPLot, Matplotlib, represented in Github, Stackoverflow, etc.). For visualization grammars not well represented in these datasets (e.g., tools like Tableau, PowerBI, etc., that have graphical user interfaces as opposed to code representations), the performance of lida may be limited without additional model fine-tuning or translation. Furthermore, performance may be limited for complex tasks (e.g., tasks requiring complex data transformations) beyond the expressive capabilities of specific grammars. Further research is needed to: i.) study effects of strategies like task disambiguation ii.) impact of task complexity and choice of programing language/grammar on performance.
Deployment and Latency: Large language models (e.g., GPT3.5 used in this work) are computationally expensive and require significant compute resources to deploy at low latency. These costs can prove to be impractical for real-world application. In addition, the current setup includes a code execution step which is valuable for verification but increases deployment complexity (requires a sandbox). Thus, there is opportunity to: i.) train smaller capable llms Touvron et al. (2023) finetuned on a curated dataset of programming languages and visualization grammars .ii) design vulnerability mitigation approaches such as limiting program scope or generating only input parameters for visualization grammar compilers.
Explaining System Behavior: The approach discussed in this paper simplifies the design of visualization authoring systems, but also inherits interpretability challenges associated with large language models. While lida offers intermediate outputs of the model (e.g., generated code and specifications) as explanations, as well as post-hoc explanations of generated code (see section 3.2.2), there is a need for further research in explaining system behavior (conditions when they are needed) and providing actionable feedback to the user.
System Evaluation: Benchmarking llm’s on creativity tasks can be challenging. While the current study introduces metrics for evaluating reliability (ver) and visualization quality (sevq) (see section 4), there is a need for more comprehensive benchmarks on a variety of datasets and visualization grammars. Furthermore, there are research opportunities to i.) study and quantify the capabilities of llms in encoding and applying visualization best practices ii.) conduct empirical studies that evaluate model behavior, mapping out failure cases and proposing mitigations iii.) qualitatively study the impact of tools like lida on user creativity while authoring visualizations.
Acknowledgements
This manuscript has benefited from comments and discussions with members of the HAX group (Saleema Amershi, Adam Fourney, Gagan Bansal), VIDA group (Steven Drucker, Dan Marshall), Bongshing Lee, Rick Barraza and others at Microsoft Research.
References
- Bavarian et al. (2022) Mohammad Bavarian, Heewoo Jun, Nikolas Tezak, John Schulman, Christine McLeavey, Jerry Tworek, and Mark Chen. 2022. Efficient training of language models to fill in the middle. arXiv preprint arXiv:2207.14255.
- Bommasani et al. (2021) Rishi Bommasani, Drew A Hudson, Ehsan Adeli, Russ Altman, Simran Arora, Sydney von Arx, Michael S Bernstein, Jeannette Bohg, Antoine Bosselut, Emma Brunskill, et al. 2021. On the opportunities and risks of foundation models. arXiv preprint arXiv:2108.07258.
- Brown et al. (2020) Tom Brown, Benjamin Mann, Nick Ryder, Melanie Subbiah, Jared D Kaplan, Prafulla Dhariwal, Arvind Neelakantan, Pranav Shyam, Girish Sastry, Amanda Askell, et al. 2020. Language models are few-shot learners. Advances in neural information processing systems, 33:1877–1901.
- Chen et al. (2021) Mark Chen, Jerry Tworek, Heewoo Jun, Qiming Yuan, Henrique Ponde de Oliveira Pinto, Jared Kaplan, Harri Edwards, Yuri Burda, Nicholas Joseph, Greg Brockman, et al. 2021. Evaluating large language models trained on code. arXiv preprint arXiv:2107.03374.
- Chen et al. (2022) Qiaochu Chen, Shankara Pailoor, Celeste Barnaby, Abby Criswell, Chenglong Wang, Greg Durrett, and Işil Dillig. 2022. Type-directed synthesis of visualizations from natural language queries. Proceedings of the ACM on Programming Languages, 6(OOPSLA2):532–559.
- Chowdhery et al. (2022) Aakanksha Chowdhery, Sharan Narang, Jacob Devlin, Maarten Bosma, Gaurav Mishra, Adam Roberts, Paul Barham, Hyung Won Chung, Charles Sutton, Sebastian Gehrmann, et al. 2022. Palm: Scaling language modeling with pathways. arXiv preprint arXiv:2204.02311.
- Cohen et al. (2022) Aaron Daniel Cohen, Adam Roberts, Alejandra Molina, Alena Butryna, Alicia Jin, Apoorv Kulshreshtha, Ben Hutchinson, Ben Zevenbergen, Blaise Hilary Aguera-Arcas, Chung ching Chang, Claire Cui, Cosmo Du, Daniel De Freitas Adiwardana, Dehao Chen, Dmitry (Dima) Lepikhin, Ed H. Chi, Erin Hoffman-John, Heng-Tze Cheng, Hongrae Lee, Igor Krivokon, James Qin, Jamie Hall, Joe Fenton, Johnny Soraker, Kathy Meier-Hellstern, Kristen Olson, Lora Mois Aroyo, Maarten Paul Bosma, Marc Joseph Pickett, Marcelo Amorim Menegali, Marian Croak, Mark Díaz, Matthew Lamm, Maxim Krikun, Meredith Ringel Morris, Noam Shazeer, Quoc V. Le, Rachel Bernstein, Ravi Rajakumar, Ray Kurzweil, Romal Thoppilan, Steven Zheng, Taylor Bos, Toju Duke, Tulsee Doshi, Vincent Y. Zhao, Vinodkumar Prabhakaran, Will Rusch, YaGuang Li, Yanping Huang, Yanqi Zhou, Yuanzhong Xu, and Zhifeng Chen. 2022. Lamda: Language models for dialog applications. In arXiv.
- Dibia (2022) Victor Dibia. 2022. Interaction design for systems that integrate image generation models: A case study with peacasso.
- Dibia and Demiralp (2019) Victor Dibia and Çağatay Demiralp. 2019. Data2vis: Automatic generation of data visualizations using sequence-to-sequence recurrent neural networks. IEEE computer graphics and applications, 39(5):33–46.
- Fried et al. (2022) Daniel Fried, Armen Aghajanyan, Jessy Lin, Sida Wang, Eric Wallace, Freda Shi, Ruiqi Zhong, Wen-tau Yih, Luke Zettlemoyer, and Mike Lewis. 2022. Incoder: A generative model for code infilling and synthesis. arXiv preprint arXiv:2204.05999.
- Gao et al. (2022) Luyu Gao, Aman Madaan, Shuyan Zhou, Uri Alon, Pengfei Liu, Yiming Yang, Jamie Callan, and Graham Neubig. 2022. Pal: Program-aided language models. arXiv preprint arXiv:2211.10435.
- Haroz et al. (2015) Steve Haroz, Robert Kosara, and Steven L Franconeri. 2015. Isotype visualization: Working memory, performance, and engagement with pictographs. In Proceedings of the 33rd annual ACM conference on human factors in computing systems, pages 1191–1200.
- Harrison et al. (2015) Lane Harrison, Katharina Reinecke, and Remco Chang. 2015. Infographic aesthetics: Designing for the first impression. In Proceedings of the 33rd Annual ACM conference on human factors in computing systems, pages 1187–1190.
- Kadavath et al. (2022) Saurav Kadavath, Tom Conerly, Amanda Askell, Tom Henighan, Dawn Drain, Ethan Perez, Nicholas Schiefer, Zac Hatfield Dodds, Nova DasSarma, Eli Tran-Johnson, et al. 2022. Language models (mostly) know what they know. arXiv preprint arXiv:2207.05221.
- Kojima et al. (2022) Takeshi Kojima, Shixiang Shane Gu, Machel Reid, Yutaka Matsuo, and Yusuke Iwasawa. 2022. Large language models are zero-shot reasoners. arXiv preprint arXiv:2205.11916.
- Li et al. (2022) Yujia Li, David Choi, Junyoung Chung, Nate Kushman, Julian Schrittwieser, Rémi Leblond, Tom Eccles, James Keeling, Felix Gimeno, Agustin Dal Lago, et al. 2022. Competition-level code generation with alphacode. arXiv preprint arXiv:2203.07814.
- Lin et al. (2022) Stephanie Lin, Jacob Hilton, and Owain Evans. 2022. Teaching models to express their uncertainty in words. arXiv preprint arXiv:2205.14334.
- Liu et al. (2023) Yang Liu, Dan Iter, Yichong Xu, Shuohang Wang, Ruochen Xu, and Chenguang Zhu. 2023. Gpteval: Nlg evaluation using gpt-4 with better human alignment. arXiv preprint arXiv:2303.16634.
- Luo et al. (2018) Yuyu Luo, Xuedi Qin, Nan Tang, Guoliang Li, and Xinran Wang. 2018. Deepeye: Creating good data visualizations by keyword search. In Proceedings of the 2018 International Conference on Management of Data, SIGMOD, pages 1733–1736.
- McKinney (2010) Wes McKinney. 2010. Data structures for statistical computing in python. In Proceedings of the 9th Python in Science Conference, pages 51 – 56.
- Mialon et al. (2023) Grégoire Mialon, Roberto Dessì, Maria Lomeli, Christoforos Nalmpantis, Ram Pasunuru, Roberta Raileanu, Baptiste Rozière, Timo Schick, Jane Dwivedi-Yu, Asli Celikyilmaz, et al. 2023. Augmented language models: a survey. arXiv preprint arXiv:2302.07842.
- Mitra et al. (2022) Rishab Mitra, Arpit Narechania, Alex Endert, and John Stasko. 2022. Facilitating conversational interaction in natural language interfaces for visualization. In 2022 IEEE Visualization and Visual Analytics (VIS), pages 6–10. IEEE.
- Moritz et al. (2018) Dominik Moritz, Chenglong Wang, Greg L Nelson, Halden Lin, Adam M Smith, Bill Howe, and Jeffrey Heer. 2018. Formalizing visualization design knowledge as constraints: Actionable and extensible models in draco. IEEE transactions on visualization and computer graphics, 25(1):438–448.
- Narechania et al. (2020) Arpit Narechania, Arjun Srinivasan, and John Stasko. 2020. Nl4dv: A toolkit for generating analytic specifications for data visualization from natural language queries. IEEE Transactions on Visualization and Computer Graphics, 27(2):369–379.
- OpenAI (2023) OpenAI. 2023. Gpt-4 technical report.
- Podo et al. (2023) Luca Podo, Bardh Prenkaj, and Paola Velardi. 2023. Machine learning for visualization recommendation systems: Open challenges and future directions. arXiv preprint arXiv:2302.00569.
- Radford et al. (2021) Alec Radford, Jong Wook Kim, Chris Hallacy, Aditya Ramesh, Gabriel Goh, Sandhini Agarwal, Girish Sastry, Amanda Askell, Pamela Mishkin, Jack Clark, et al. 2021. Learning transferable visual models from natural language supervision. In International conference on machine learning, pages 8748–8763. PMLR.
- Ramesh et al. (2022) Aditya Ramesh, Prafulla Dhariwal, Alex Nichol, Casey Chu, and Mark Chen. 2022. Hierarchical text-conditional image generation with clip latents. arXiv preprint arXiv:2204.06125.
- Ramesh et al. (2021) Aditya Ramesh, Mikhail Pavlov, Gabriel Goh, Scott Gray, Chelsea Voss, Alec Radford, Mark Chen, and Ilya Sutskever. 2021. Zero-shot text-to-image generation. In International Conference on Machine Learning, pages 8821–8831. PMLR.
- Rombach et al. (2022) Robin Rombach, Andreas Blattmann, Dominik Lorenz, Patrick Esser, and Björn Ommer. 2022. High-resolution image synthesis with latent diffusion models. 2022 ieee. In CVF Conference on Computer Vision and Pattern Recognition (CVPR), pages 10674–10685.
- Satyanarayan et al. (2017) Arvind Satyanarayan, Dominik Moritz, Kanit Wongsuphasawat, and Jeffrey Heer. 2017. Vega-lite: A grammar of interactive graphics. IEEE TVCG (Proc. InfoVis).
- Shi et al. (2022a) Freda Shi, Mirac Suzgun, Markus Freitag, Xuezhi Wang, Suraj Srivats, Soroush Vosoughi, Hyung Won Chung, Yi Tay, Sebastian Ruder, Denny Zhou, et al. 2022a. Language models are multilingual chain-of-thought reasoners. arXiv preprint arXiv:2210.03057.
- Shi et al. (2022b) Yang Shi, Pei Liu, Siji Chen, Mengdi Sun, and Nan Cao. 2022b. Supporting expressive and faithful pictorial visualization design with visual style transfer. IEEE Transactions on Visualization and Computer Graphics, 29(1):236–246.
- Touvron et al. (2023) Hugo Touvron, Thibaut Lavril, Gautier Izacard, Xavier Martinet, Marie-Anne Lachaux, Timothée Lacroix, Baptiste Rozière, Naman Goyal, Eric Hambro, Faisal Azhar, Aurelien Rodriguez, Armand Joulin, Edouard Grave, and Guillaume Lample. 2023. Llama: Open and efficient foundation language models.
- Tyagi et al. (2021) Anjul Tyagi, Jian Zhao, Pushkar Patel, Swasti Khurana, and Klaus Mueller. 2021. User-centric semi-automated infographics authoring and recommendation. arXiv preprint arXiv:2108.11914.
- Vaswani et al. (2017) Ashish Vaswani, Noam Shazeer, Niki Parmar, Jakob Uszkoreit, Llion Jones, Aidan N Gomez, Łukasz Kaiser, and Illia Polosukhin. 2017. Attention is all you need. Advances in neural information processing systems, 30.
- Wang et al. (2022a) Xuezhi Wang, Jason Wei, Dale Schuurmans, Quoc Le, Ed Chi, and Denny Zhou. 2022a. Self-consistency improves chain of thought reasoning in language models. arXiv preprint arXiv:2203.11171.
- Wang et al. (2022b) Yun Wang, Zhitao Hou, Leixian Shen, Tongshuang Wu, Jiaqi Wang, He Huang, Haidong Zhang, and Dongmei Zhang. 2022b. Towards natural language-based visualization authoring. IEEE Transactions on Visualization and Computer Graphics, 29(1):1222–1232.
- Wei et al. (2022) Jason Wei, Xuezhi Wang, Dale Schuurmans, Maarten Bosma, Ed Chi, Quoc Le, and Denny Zhou. 2022. Chain of thought prompting elicits reasoning in large language models. arXiv preprint arXiv:2201.11903.
- Wongsuphasawat et al. (2017) Kanit Wongsuphasawat, Zening Qu, Dominik Moritz, Riley Chang, Felix Ouk, Anushka Anand, Jock Mackinlay, Bill Howe, and Jeffrey Heer. 2017. Voyager 2: Augmenting visual analysis with partial view specifications. In ACM CHI.
- Zhang et al. (2019) Dan Zhang, Yoshihiko Suhara, Jinfeng Li, Madelon Hulsebos, Çağatay Demiralp, and Wang-Chiew Tan. 2019. Sato: Contextual semantic type detection in tables. arXiv preprint arXiv:1911.06311.
- Zhang et al. (2022) Susan Zhang, Stephen Roller, Naman Goyal, Mikel Artetxe, Moya Chen, Shuohui Chen, Christopher Dewan, Mona Diab, Xian Li, Xi Victoria Lin, et al. 2022. Opt: Open pre-trained transformer language models. arXiv preprint arXiv:2205.01068.
Appendix A The lida Library
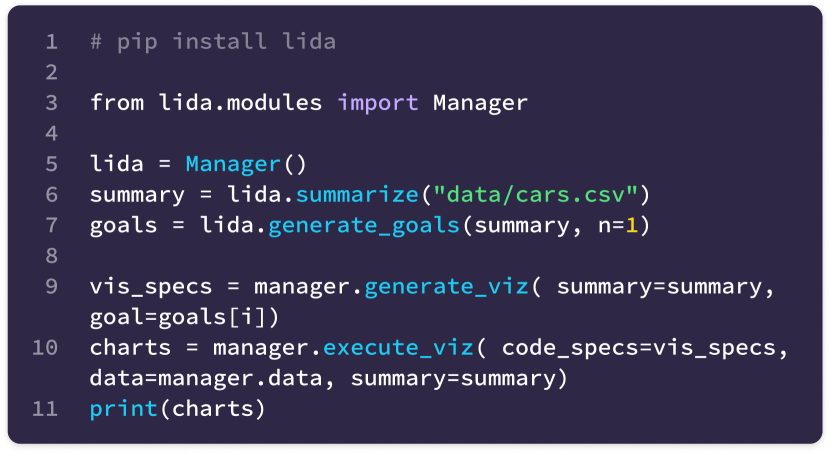
lida is implemented as a python library with modules for each of the components described in Section 3. The library is available on github777https://github.com/microsoft/lida and can be installed using pip - pip install lida. The library provides a python api, web api for integration into other applications, and a command line interface. It also provides a web-based user interface for users to interact with lida (Fig 10, 9).

Appendix B Self-Evaluated Visualization Quality (sevq) Prompts
For the sevq metric, we use GPT-4 to assess visualization quality by scoring generated visualization code across the 6 task dimensions - code accuracy, data transformation, goal compliance, visualization type, data encoding, and aesthetics. These dimensions are implemented as prompts to an LLM 888Exact prompts can be found at the project repository https://github.com/microsoft/lida., which then generates a score between 1-10 for each dimension. The final sevq score is the average of the 6 scores. A sketch of the prompts used for each dimension are enumerated in table 1.
| Dimension | Prompt |
|---|---|
| Code accuracy | Does the code contain bugs, logic errors, syntax error or typos? How serious are the bugs? How should it be fixed? |
| Data transformation | Is the data transformed appropriately for the visualization type? |
| Goal compliance | How well the code meets the specified visualization goals? |
| Visualization type | Considering best practices, is the visualization type appropriate for the data and intent? Is there a visualization type that would be more effective in conveying insights? |
| Data encoding | Is the data encoded appropriately for the visualization type? |
| Aesthetics | Are the aesthetics of the visualization appropriate and effective for the visualization type and the data? |
Appendix C Design Reflections
Building a system that leverages foundation models (text and images) involves engineering decisions across a wide design space. In this section, we briefly reflect on some of the design choices we made for lida components and the tradeoffs we considered.
C.1 Prompt Engineering
We explored multiple approaches to building prompts that maximized the probability of the llm solving each subtask.
-
•
summarizer: We found that improving the richness of the summary (qualitative nl description, including semantic types) was critical to improved quality of generated goals and visualization code. Implementation wise, we began with a manually crafted summary of the data (see Section 3.1), and then enriched it via calls to an LLM and optional user refinement of the summary.
-
•
goal explorer: Providing few shot examples in the prompts where fields and rationale are linked via symbols (e.g., plot a histogram of field X vs Y to show relationship between X and Y) nudges the model to use exact dataset field names, and minimizes the occurrence of hallucinated fields. Prompt engineering also provides mechanisms to bake in visualization best practices e.g. avoid pie charts, apply visualization best practices, Imagine you are a highly experienced visualization specialist and data analyst.
-
•
visGenerator: Casting visualization code generation as a fill-in-the-middle problem (as opposed to free-from completion) ensures the model to generates executable code focused on the task. For example, in Fig 5, the model is instructed to generate only the portion of the code scaffold. We also note that the degrees of freedom alloted to the model (e.g., specifying how much of the scaffold to complete) can influence its ability to add tasks with varied complexity. For example, a scaffold that allows the model generate data preprocessing code (and includes libraries like statsmodels etc) allows the model to address tasks that require steps such as data transformation, sampling and statistical analysis before generating visualizations etc.
-
•
Overall, we found that setting a low temperature (; generating the most likely visualization) coupled with a per-grammar code scaffold provided the best results in terms of yielding code that correctly compiles into visualization specifications and faithfully addresses the subtask. We also explored prompt formulations that addressed multiple tasks to minimize costs (latency and compute). For example, summary enrichment is a single call where the llm must generate dataset descriptions, field descriptions and semantic types.
C.2 Infographic Generation
We found that setting a low parameter () for the latent diffusion model (image-to-image mode) and using parsimonious style prompts resulted in stylized images that were faithful to the general structure of the original visualization, minimizing distorted or irrelevant imagery. This sort of controlled generation is necessary to avoid the distraction Haroz et al. (2015) that can arise from superfluous imagery in infographics.
C.3 Natural Language Interaction