Timing of Pulsars in the Globular Cluster Omega Centauri
Abstract
We present the timing of the first five millisecond pulsars discovered in the globular cluster Omega Centauri and the discovery of a pulsar with a spin period of 3.68 ms. With a timing baseline of 3.5 yr we are able to measure the derivative of the spin frequency () for the first five pulsars. Upper limits on the pulsar line-of-sight acceleration are estimated and compared with predictions based on analytical models of the cluster. We find that PSRs J13264728B and D show large negative accelerations, which are in tension with the minimum acceleration predicted by analytical models. We searched for pulsed -ray signals using 14.3 yr of data from the Fermi Large Area Telescope. Although we found no evidence for -ray pulsations, PSRs J13264728A, B, C and E are associated with X-ray sources. This suggests that the observed -ray emission from Omega Centauri is likely caused by the emission of the ensemble of MSPs. Finally, the linearly polarised emission from PSR J13264728A yields a rotation measure of rad m-2.
keywords:
pulsars: general1 Introduction
Long-term timing of radio pulsars in globular clusters (GCs) is a powerful tool to study properties of the core region of GCs which complements other techniques and observations at different wavelengths. This has been demonstrated for 47Tuc (e.g., Freire et al., 2001, 2003; Ridolfi et al., 2016; Freire et al., 2017), Terzan 5 (Prager et al., 2017) and NGC 6624 (Perera et al., 2017), where distances, proper motions and core densities of the GCs were obtained. Limits on the mass of possible black holes in the centre of these GCs have also been obtained using measurements of pulsar accelerations (Freire et al., 2017; Prager et al., 2017; Perera et al., 2017; Abbate et al., 2018), in combination with dynamical -body simulations (Kızıltan et al., 2017; Baumgardt et al., 2019).
Precise measurements of spin, binary and astrometric parameters of pulsars in GCs are also important for the understanding of the formation and evolution of compact objects and the dynamics in the core of GCs. It has been suggested that the number of millisecond pulsars (MSPs) in GCs is correlated with the stellar encounter rate (e.g., Hui et al., 2010; Bahramian et al., 2013). Observed pulsar populations vary amongst GCs, with some primarily comprising binary systems, while others contain more isolated and ‘exotic’ pulsars. Verbunt & Freire (2014) proposed that these differences are best explained not by the aggregate encounter rate but by the single-object encounter rate, i.e. the rate at which a specific binary system encounters other objects. This rate scales less strongly with the core density. More recently, large-scale -body simulations have been used to model the formation and evolution of compact objects in GCs and compared with observed pulsar populations (e.g., Ye et al., 2019; Kremer et al., 2020; Ye et al., 2022). The detection of a fast radio burst from a globular cluster in M81 (Kirsten et al., 2022) provides further observational evidence for the formation of unusual objects via many-body interactions.
A population of pulsars in the core of Omega Centauri ( or NGC 5139), the most massive and luminous GC in the Galaxy, was first discovered by Dai et al. (2020). Five MSPs were detected using the Ultra-Wideband Low receiver (UWL, Hobbs et al., 2020) of the 64-meter Parkes radio telescope (also known as Murriyang), including one pulsar in an eclipsing binary system with an orbital period of 2.1 hours. Recently, 13 new pulsars were discovered by the MeerKAT radio telescope, which increased the total number of known pulsars in this cluster to 18 (Chen et al., 2023). This opens up opportunities to explore the dynamics of the cluster through radio observations of these pulsars and test the hypothesis of an intermediate-mass black hole in the cluster centre (e.g., Baumgardt et al., 2019). Long-term timing of these pulsars allows us to fold 10 yr of -ray photons collected by the Fermi satellite, and thus probe the origin of -ray emission from the core of (4FGL J1326.64729, Abdo et al., 2010) and constrain dark matter annihilation models (Brown et al., 2019; Reynoso-Cordova et al., 2021; Wang et al., 2021; Staveley-Smith et al., 2022; Chan & Lee, 2022).
2 Observations and Data Reduction
A regular monitoring program of using the Parkes telescope started in 2019, and is currently being observed monthly as part of project P1041 (PI: S. Dai). In our timing analysis below we included observations up to August 2022. Observations were performed using a coherently de-dispersed search mode where data are recorded with 2-bit sampling every 64 s in each of the 1-MHz wide frequency channels covering a total bandwidth of 3328 MHz between 704 and 4032 MHz. Data were coherently de-dispersed at a DM of 100.3 . Full Stokes information was recorded and a pulsed noise signal with well-known properties injected into the signal path was observed before the observation for the purpose of calibration. For the known pulsars, the search-mode data were folded at the appropriate topocentric spin-period using the dspsr software package (van Straten & Bailes, 2011) with a sub-integration length of 30 seconds. We manually excised data affected by narrow-band and impulsive radio-frequency interference for each sub-integration using psrchive (Hotan et al., 2004). Polarisation and flux calibration were carried out for these search mode observations following Dai et al. (2019). The linear polarisation and the position angle (PA) of linear polarisation were calculated following Dai et al. (2015). Since only PSR J13264728B can be detected at above 2 GHz in our individual observations, we only folded search-mode data from 704 MHz to 2112 MHz, which corresponds to the lowest 11 subbands of UWL. Each folded file was then averaged in time to form an averaged pulse profile and the pulse time of arrivals (ToAs) was measured for each observation for each pulsar using the pat routine of psrchive. Timing analysis was carried out using the TEMPO2 software package (Hobbs et al., 2006). We fixed the parallax of at mas (Soltis et al., 2021) throughout our analysis and left spin, astrometric and binary parameters as free parameters.
Periodicity searches were carried out with the software package presto (Ransom, 2001). The DM range that we searched was . In order to account for possible orbital modulation of pulsar periodic signals, for each 1 hr segment, we searched for signals drifting by as much as bins in the Fourier domain by setting the zmax parameter of the accelsearch routine to be (Ransom et al., 2002), where is the largest harmonic at which a signal is detected (up to 8 harmonics were summed).
3 Results
3.1 Discovery of a new MSP
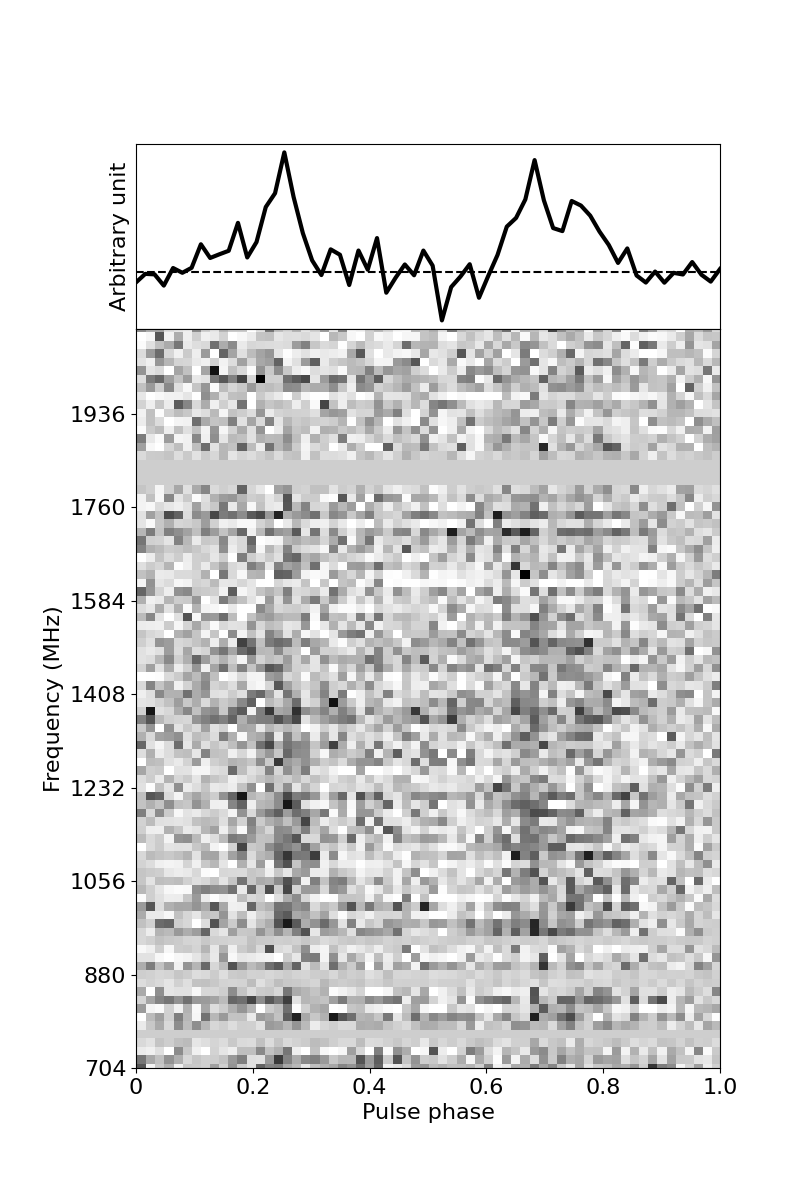
We discovered and confirmed a further millisecond pulsar at a DM of 97.3 with a spin period of 3.686 ms. In Fig. 1 we show the averaged pulse profile (top) and frequency spectrum (bottom) of the pulsar with an integration time of 3 hr. This pulsar shows a relatively wide profile with an inter-pulse and can only be detected below 2 GHz. Limited by the signal-to-noise ratio (S/N) we can achieve with our regular 2 hr observations, a coherent timing solution of this pulsar is yet to be obtained. Recently, Chen et al. (2023) published the discovery of 13 new pulsars with the MeerKAT radio telescope. One of their discoveries (J13264728J) has a spin period of 1.84 ms at a DM of 97.28 . While the S/N of the averaged pulse profile in Fig. 1 is not high, we can see differences in the width of the peaks, and therefore MeerKAT might have discovered J13264728J at its second harmonic. We suggest that further observations are required to determine the nature of this pulsar.
3.2 Coherent timing solutions for five pulsars
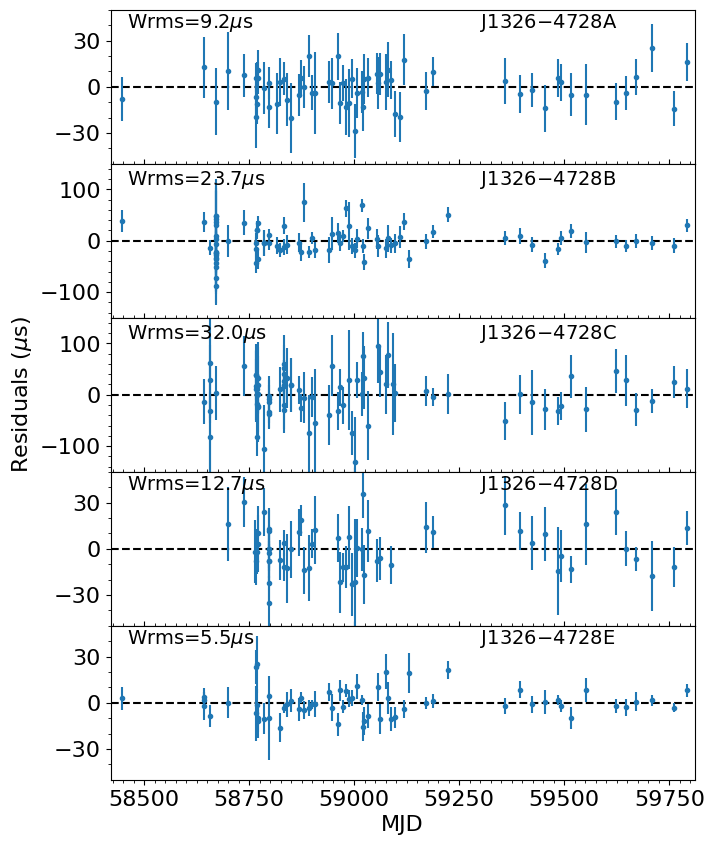
We obtained coherent timing solutions for all five pulsars published in Dai et al. (2020). Spin, astrometric and binary parameters of these pulsars are listed in Table 1. With a timing baseline of 3.5 yr, we measured the first spin frequency derivative () and proper motions for all five pulsars, although uncertainties of proper motions are large due to the limited timing baseline. In Fig. 2 we show the timing residuals for these pulsars. We achieved timing precision better than 10 s (weighted root-mean-square) for PSRs J13264728A and E.
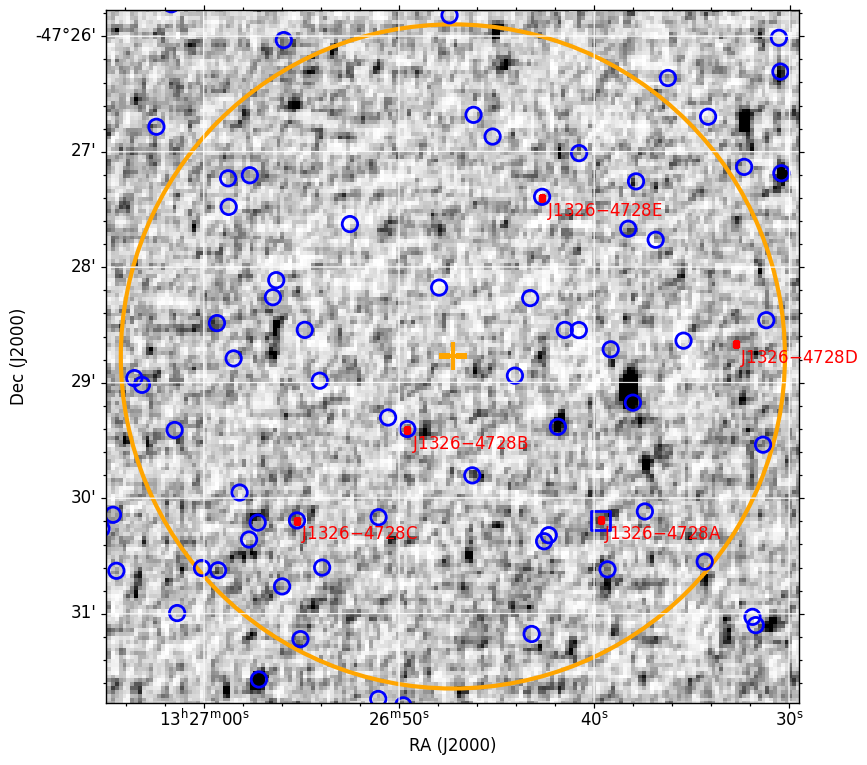
In Fig. 3 we show the timing positions of these five pulsars superposed on a 2.1-GHz radio continuum obtained with the Australia Telescope Compact Array (Dai et al., 2020). All five pulsars are within one core radius (155 arcsec) of . We also show unidentified X-ray sources (Henleywillis et al., 2018) in Fig. 3 as blue circles. Four pulsars, PSRs J13264728A B, C, and E are associated with X-ray sources. X-ray emission from PSR J13264728A was detected by Zhao & Heinke (2022) at its timing position (shown as a blue square in Fig. 3), while the other three pulsars are associated with unidentified X-ray sources published by Henleywillis et al. (2018). The properties of these X-ray sources are listed in Table 1. Compared with detected X-ray emission from MSPs in other GCs (e.g., Bhattacharya et al., 2017), these X-ray sources show much lower X-ray flux.
3.3 Polarisation, DM and spectral index
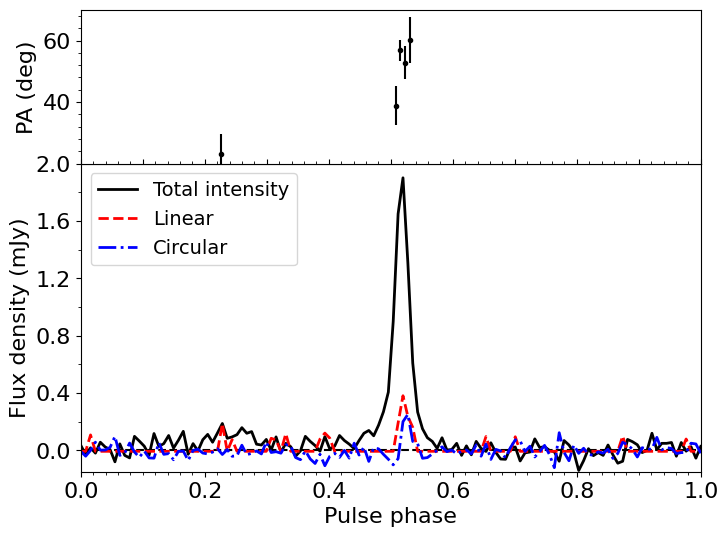
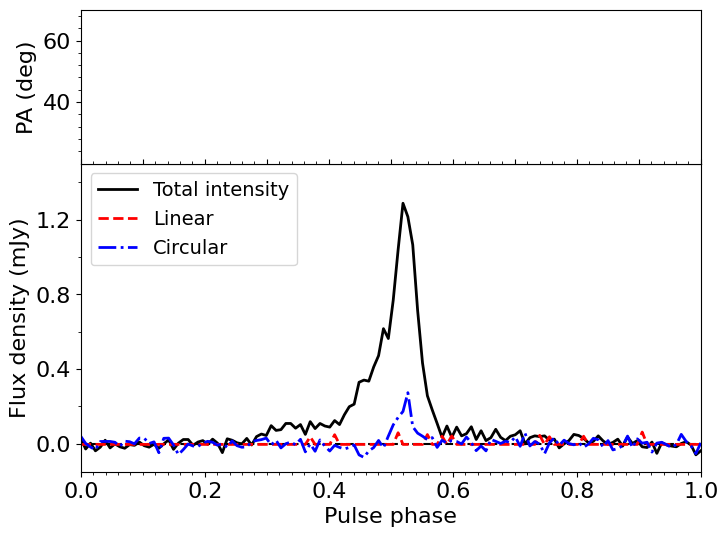
No linear or circular polarisation was detected in any of these pulsars at their discovery. With three years of observation, we summed all observations of each pulsar using their timing models and formed higher S/N Stokes-parameter profiles. Weak linearly polarised emission was detected in PSR J13264728A and we measured a Faraday rotation measure (RM) of rad m-2. In Fig. 4, we show the polarisation profiles of PSR J13264728A and B, in which circularly polarised emission can be observed.
We averaged these high S/N profiles into eight frequency channels (with a channel bandwidth of 176 MHz) and then measured the flux density () and ToA for each channel. We used TEMPO2 to fit the DM for each pulsar and also fitted the spectrum of each pulsar with a single power law (, where is the spectral index). The refined DM measurement, spectral index, and flux density (at a central frequency of 1489 MHz) of each pulsar are listed in Table 1.
3.4 -ray emission
To search for pulsed -ray signals, we used Pass 8 (Atwood et al., 2013; Bruel et al., 2018) data from the Fermi Large Area Telescope (Atwood et al., 2009) selected with energies 0.1–30 GeV within 3∘ of the cluster center and with a time range MJD 54682–59900, or 14.3 yr. With version 2.0.0 of the fermitools111https://fermi.gsfc.nasa.gov/ssc/data/analysis/software/, we computed photon weights (Kerr, 2011) using the 4FGL-DR3 (Abdollahi et al., 2022) model. We then assigned spin phase to (“folded”) each photon using the five timing solutions and the Fermi plugin (Ray et al., 2011) for Tempo2. We calculated the H-test (de Jager et al., 1989) statistic both with and without photon weights and in time ranges restricted to the ephemeris validity and for the full dataset. The largest observed value was 12, which has a chance probability of 0.01. Considering the number of combinations and pulsars tested, this outcome is consistent with a uniform distribution of pulse phases, i.e. there is no evidence for pulsations.
| J13264728A | J13264728B | J13264728C | J13264728D | J13264728E | |
| RAJ (J2000) | 13:26:39.6699(2) | 13:26:49.5688(3) | 13:26:55.2219(6) | 13:26:32.7130(2) | 13:26:42.67844(7) |
| DECJ (J2000) | 47:30:11.641(3) | 47:29:24.889(4) | 47:30:11.753(9) | 47:28:40.053(3) | 47:27:23.999(1) |
| (Hz) | 243.38088019784(7) | 208.68683313306(7) | 145.6057701815(1) | 218.39623714185(2) | 237.65856646672(2) |
| (Hz/s) | |||||
| PMRA (mas/yr) | -5(1) | -3(3) | -5(3) | -3(2) | -4.2(7) |
| PMDEC (mas/yr) | -7(2) | -8(4) | -4(5) | -6(3) | -6.9(9) |
| PEPOCH (MJD) | 58447.77 | 58768.0 | 58447.77 | 58797.01 | 58796.79 |
| Time span (MJD) | 58447.8059792.18 | 58447.7859792.18 | 58643.3359792.18 | 58700.2759792.18 | 58447.7959792.18 |
| DM (cm-3 pc) | 100.2899(7) | 100.250(1) | 100.640(5) | 96.518(2) | 94.3690(4) |
| RM (rad m-2) | -18(8) | ||||
| (mJy) | 54(5) | 88(4) | 31(3) | 38(4) | 33(2) |
| Binary parameters (ELL1 model, Hobbs et al., 2006) | |||||
| (days) | 0.0896112039(9) | ||||
| (ls) | 0.021450(4) | ||||
| (MJD) | 58768.037248(4) | ||||
| (10-3) | -0.6(4) | ||||
| (10-3) | -0.6(4) | ||||
| Derived parameters | |||||
| (ms) | 4.108786192190(1) | 4.791869161014(2) | 6.867859692327(6) | 4.578833468410(2) | 4.2077170407405(4) |
| (s s-1) | |||||
| Spectral index | |||||
| Companion mass (M⊙) | 0.013 < 0.016 < 0.031 | ||||
| Association with X-ray sources (Henleywillis et al., 2018; Zhao & Heinke, 2022) | |||||
| X-ray source ID | 13d | 23g | 11f | ||
| RAJ (J2000) | 13:26:39.670 | 13:26:49.574 | 13:26:55.231 | 13:26:42.670 | |
| DECJ (J2000) | 47:30:11.64 | 47:29:24.18 | 47:30:11.63 | 47:27:23.56 | |
| Flux ( erg cm-2 s-1) | 6.1 | 20.3 | 9.2 | 6.3 | |
4 Discussion and conclusion
The observed spin-down () of pulsars in GCs is the sum of several effects and is typically dominated by the dynamical effect caused by the cluster gravitational potential. Here we briefly discuss the contribution from these various effects for pulsars in . More details on these effects can be found in previous papers (e.g., Freire et al., 2017; Prager et al., 2017; Perera et al., 2017; Abbate et al., 2018). For pulsars located in the same GC, their are affected by two types of common line-of-sight accelerations:
- •
-
•
the apparent acceleration due to the proper motion of pulsars (), or the so-called Shklovskii effect (Shklovskii, 1970). The Shklovskii effect can be estimated as
(2) where is the distance to the cluster, is the proper motion. Since uncertainties of pulsar proper motions are large due to the limited timing baseline, we used the mean proper motion of , mas yr-1, mas yr-1 (Gaia Collaboration et al., 2018), and estimated the acceleration due to Shklovskii effect to be m s-2. The contribution to the Shklovskii effect from pulsar velocities relative to the GC should be negligible since the escape velocity in the core of is measured to be only km s-1 (Gnedin et al., 2002). At a distance of 5.43 kpc, this corresponds to a maximal projected proper motion of mas yr-1 with respect to the cluster centre, which is significantly smaller than the mean proper motion of .
In addition to those common effects, there are also pulsar-dependent contributions to , including:
-
•
the line-of-sight acceleration of the pulsar in the gravitational field of the GC (), which depends on the location of the pulsar with respect to the centre of the GC and is typically unknown.
-
•
the intrinsic pulsar spin-down (). For pulsars in GCs, can not be directly measured due to the dynamical effects caused by the gravitational potential and is therefore unknown. However, an order of magnitude estimate can be made by assuming a simple magnetic dipole emission model with a braking index of . With these assumptions, the apparent acceleration due to intrinsic spin-down can be estimated as
(3) where is the surface magnetic field strength of the pulsar.
-
•
the acceleration caused by individual objects near the pulsar, which may be appreciable due to the high stellar density in the core region of GCs. While it is difficult to estimate this acceleration for a given pulsar, the ratio of the characteristic nearest-neighbour acceleration, , to the mean cluster acceleration for a cluster of mass and radius and stars of mass can be estimated as
(4) where is the mean number density (Prager et al., 2017). For , the projected number density is stars in the central region, and therefore accelerations caused by nearby stars are negligible compared with the mean cluster acceleration and we will not include this term in the following discussions.
Taking all these effects into account, the observed spin-down of pulsars in GCs can be expressed as
| (5) |
where is the observed pulsar spin period and is the speed of light. Since and are unknown for most pulsars in GCs, we can only put an upper limit on the pulsar line-of-sight acceleration as
| (6) |
Upper limits on the pulsar line-of-sight acceleration can then be compared with the maximum and minimum accelerations along each line of sight predicted by GC density models. Following Freire et al. (2017) and assuming the King (1962) density profile, we calculated the maximum and minimum accelerations as,
| (7) |
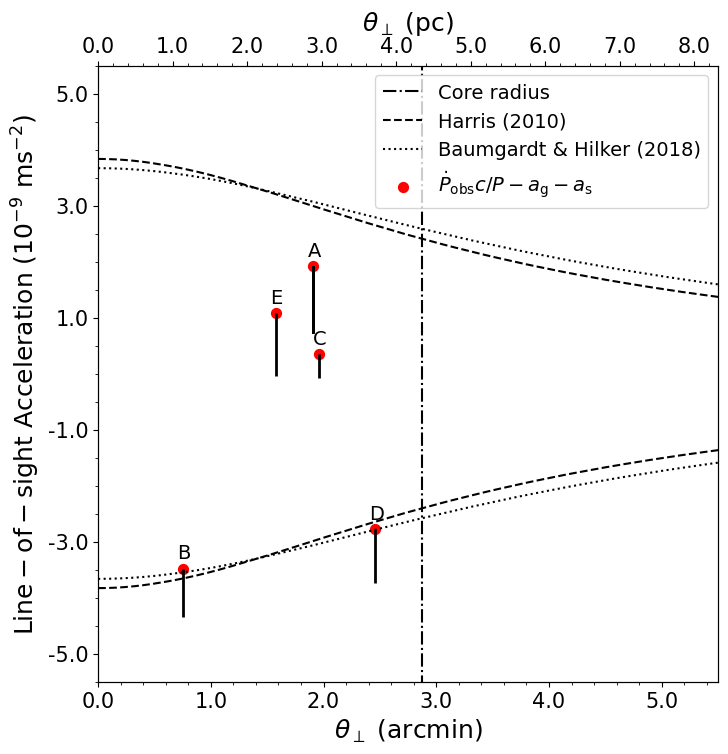
where is the distance to the centre divided by the core radius, is the central velocity dispersion and is the core radius in radian. The distance to the cluster is kpc (Baumgardt & Vasiliev, 2021). In Fig. 5 we show the line-of-sight acceleration for each pulsar as a function of their angular offset from the GC centre. Red points show accelerations after correcting for contributions from the Galactic potential (Eq. 1) and Shklovskii effect (Eq. 2) based on the mean proper motion of the cluster. The vertical solid line of each pulsar shows the contribution from the intrinsic spin-down assuming a surface magnetic field strength of G, a typical value for pulsars in GCs (e.g., Freire et al., 2003; Prager et al., 2017). The dashed and dotted lines show the maximum and minimum accelerations calculated using core radius and central velocity dispersion measurements from Harris (2010) and Baumgardt & Hilker (2018). Harris (2010) measured the core radius and central velocity dispersion to be ′ and km/s, respectively. More recently, Baumgardt & Hilker (2018) presented new measurements of 112 Galactic GCs by fitting a large set of -body simulations to their velocity dispersion and surface density profiles. They measured the core radius and central velocity dispersion of to be pc (or 2.88′) and km/s, respectively.
Fig. 5 shows that the line-of-sight acceleration of PSRs J13264728A, C and E are within the maximum and minimum acceleration predicted by the analytic model. Their positive accelerations suggest that they are located on the far side of the cluster centre. PSRs J13264728B and D show large negative accelerations, which are in tension with the minimum acceleration predicted by the analytical model. PSRs J13264728B is also the closest pulsar to the cluster centre with an angular offset 1 (or 1.1 pc). As shown in Fig. 5, even without considering the pulsar intrinsic spin-down, the line-of-sight acceleration of J13264728B and D are already close to the minimum acceleration predicted by the analytical model. Taking a moderate surface magnetic field of G into account, the line-of-sight acceleration of PSRs J13264728B and D significantly exceed minimum accelerations estimated using both Harris (2010) and Baumgardt & Hilker (2018). Recent inferences of the magnetic field configuration of some MSPs (Kalapotharakos et al., 2021) suggest the presence of asymmetric magnetic fields which can contribute acceleration through the “rocket effect” (Harrison & Tademaru, 1975). However, such acceleration is m s-2, which is again too low to contribute a dynamical effect for reasonable intrinsic spin-down rates.
The single-mass, non-rotating, isotropic King (1962) model is clearly oversimplified for considering its large and extended core. Recent work suggests the existence of a centrally concentrated cluster of stellar-mass black holes in to explain its surface brightness and velocity dispersion profile (e.g., Zocchi et al., 2019; Baumgardt et al., 2019). Using an axisymmetric dynamical model, Evans et al. (2022) found evidence for a centrally-concentrated distribution of matter that is distinct from the luminous component, with a mass of 104 to 106 M⊙. Whether the observed large line-of-sight accelerations of PSR J13264728B and D can be understood requires more realistic models of . Further studies of these pulsars, for example in combination with -body simulations (Baumgardt et al., 2019), could potentially provide new insights into the existence and properties of stellar-mass black holes and/or an intermediate-mass black hole in . Continued timing of these pulsars and precise measurements of their proper motions, higher order spin frequency derivatives and the orbital period derivative of J13264728B will be crucial for us to probe the dynamics in the core of .
So far, we have discovered five isolated pulsars and only one binary system in . Our Parkes survey is likely biased towards isolated pulsars due to limited sensitivity and relatively long integration time ( hr). With the more sensitive MeerKAT radio telescope, Chen et al. (2023) discovered four new pulsars in compact binary systems and another three pulsars in potentially wide binaries. Even considering these new discoveries, as discussed by Chen et al. (2023), the fraction of isolated pulsars in is surprisingly high considering its extended core and therefore low encounter rate for a single binary (Verbunt & Freire, 2014). Deeper surveys with sensitive telescopes are therefore necessary and could reveal if the pulsar population in has a different evolutionary history or significantly different properties.
Finally, PSR 13264728A, B, C and E are shown to be associated with X-ray sources (Henleywillis et al., 2018; Zhao & Heinke, 2022). Considering that no -ray pulsation has been detected, this strongly indicates that the observed -ray emission is the summed emission of the ensemble of MSPs. PSR J13264728B is the brightest in X-ray and Zhao & Heinke (2022) showed that its X-ray spectrum can be well fitted by a single power-law, which gives an unabsorbed X-ray flux of erg cm-2 s-1 and a photon index of . Using the -to-X flux relation presented by Berteaud et al. (2021), we estimated the -ray emission from PSR J13264728B to be erg cm-2 s-1 (0.1 to 100 GeV), about 30% of the observed -ray flux from ( erg cm-2 s-1, Abdollahi et al., 2022). A recent analysis by Song et al. (2021) suggested that inverse Compton emission from relativistic pairs launched by MSPs in could make a significant contribution to the observed -ray emission.
Acknowledgements
We thank A. Possenti, M. Burgay and V. Morello for helping with observations and data analysis. We thank H. Baumgardt for the useful discussions. The Parkes radio telescope is part of the Australia Telescope National Facility which is funded by the Commonwealth of Australia for operation as a National Facility managed by CSIRO. S.D. is the recipient of an Australian Research Council Discovery Early Career Award (DE210101738) funded by the Australian Government. J.B. acknowledges financial support from the Programme National des Hautes Energies of CNRS/INSU with INP and IN2P3, co-funded by CEA and CNES, from the “Agence Nationale de la Recherche”, grant n. ANR-19-CE31-0005-01 (PI: F. Calore), and from the Centre National d’Etudes Spatiales (CNES) B.B. acknowledges the Department of Atomic Energy, Government of India, under project no.12-R&D-TFR-5.02-0700 Work at NRL is supported by NASA.
The Fermi-LAT Collaboration acknowledges generous ongoing support from a number of agencies and institutes that have supported both the development and the operation of the LAT as well as scientific data analysis. These include the National Aeronautics and Space Administration and the Department of Energy in the United States, the Commissariat à l’Energie Atomique and the Centre National de la Recherche Scientifique / Institut National de Physique Nucléaire et de Physique des Particules in France, the Agenzia Spaziale Italiana and the Istituto Nazionale di Fisica Nucleare in Italy, the Ministry of Education, Culture, Sports, Science and Technology (MEXT), High Energy Accelerator Research Organization (KEK) and Japan Aerospace Exploration Agency (JAXA) in Japan, and the K. A. Wallenberg Foundation, the Swedish Research Council and the Swedish National Space Board in Sweden.
Additional support for science analysis during the operations phase is gratefully acknowledged from the Istituto Nazionale di Astrofisica in Italy and the Centre National d’Études Spatiales in France. This work was performed in part under DOE Contract DE-AC02-76SF00515.
Data availability
The observations from the Parkes radio telescope are publicly available from https://data.csiro.au/ after an 18-month embargo period. Pulse time of arrivals will be shared on reasonable request.
References
- Abbate et al. (2018) Abbate F., Possenti A., Ridolfi A., Freire P. C. C., Camilo F., Manchester R. N., D’Amico N., 2018, MNRAS, 481, 627
- Abdo et al. (2010) Abdo A. A., et al., 2010, A&A, 524, A75
- Abdollahi et al. (2022) Abdollahi S., et al., 2022, ApJS, 260, 53
- Atwood et al. (2009) Atwood W. B., et al., 2009, ApJ, 697, 1071
- Atwood et al. (2013) Atwood W., et al., 2013, arXiv e-prints, p. arXiv:1303.3514
- Bahramian et al. (2013) Bahramian A., Heinke C. O., Sivakoff G. R., Gladstone J. C., 2013, ApJ, 766, 136
- Baumgardt & Hilker (2018) Baumgardt H., Hilker M., 2018, MNRAS, 478, 1520
- Baumgardt & Vasiliev (2021) Baumgardt H., Vasiliev E., 2021, MNRAS, 505, 5957
- Baumgardt et al. (2019) Baumgardt H., et al., 2019, MNRAS, 488, 5340
- Berteaud et al. (2021) Berteaud J., Calore F., Clavel M., Serpico P. D., Dubus G., Petrucci P.-O., 2021, Phys. Rev. D, 104, 043007
- Bhattacharya et al. (2017) Bhattacharya S., Heinke C. O., Chugunov A. I., Freire P. C. C., Ridolfi A., Bogdanov S., 2017, MNRAS, 472, 3706
- Brown et al. (2019) Brown A. M., Massey R., Lacroix T., Strigari L. E., Fattahi A., Bœhm C., 2019, arXiv e-prints, p. arXiv:1907.08564
- Bruel et al. (2018) Bruel P., Burnett T. H., Digel S. W., Johannesson G., Omodei N., Wood M., 2018, 8th Internat’l Fermi Symposium, p. arXiv:1810.11394
- Chan & Lee (2022) Chan M. H., Lee C. M., 2022, Phys. Rev. D, 105, 123006
- Chen et al. (2023) Chen W., et al., 2023, arXiv e-prints, p. arXiv:2301.03864
- Dai et al. (2015) Dai S., et al., 2015, MNRAS, 449, 3223
- Dai et al. (2019) Dai S., et al., 2019, ApJ, 874, L14
- Dai et al. (2020) Dai S., Johnston S., Kerr M., Camilo F., Cameron A., Toomey L., Kumamoto H., 2020, ApJ, 888, L18
- Evans et al. (2022) Evans A. J., Strigari L. E., Zivick P., 2022, MNRAS, 511, 4251
- Freire et al. (2001) Freire P. C., Camilo F., Lorimer D. R., Lyne A. G., Manchester R. N., D’Amico N., 2001, MNRAS, 326, 901
- Freire et al. (2003) Freire P. C., Camilo F., Kramer M., Lorimer D. R., Lyne A. G., Manchester R. N., D’Amico N., 2003, MNRAS, 340, 1359
- Freire et al. (2017) Freire P. C. C., et al., 2017, MNRAS, 471, 857
- Gaia Collaboration et al. (2018) Gaia Collaboration et al., 2018, A&A, 616, A12
- Gnedin et al. (2002) Gnedin O. Y., Zhao H., Pringle J. E., Fall S. M., Livio M., Meylan G., 2002, ApJ, 568, L23
- Harris (2010) Harris W. E., 2010, arXiv e-prints, p. arXiv:1012.3224
- Harrison & Tademaru (1975) Harrison E. R., Tademaru E., 1975, ApJ, 201, 447
- Henleywillis et al. (2018) Henleywillis S., Cool A. M., Haggard D., Heinke C., Callanan P., Zhao Y., 2018, MNRAS, 479, 2834
- Hobbs et al. (2006) Hobbs G. B., Edwards R. T., Manchester R. N., 2006, MNRAS, 369, 655
- Hobbs et al. (2020) Hobbs G., et al., 2020, Publ. Astron. Soc. Australia, 37, e012
- Hotan et al. (2004) Hotan A. W., van Straten W., Manchester R. N., 2004, Publ. Astron. Soc. Australia, 21, 302
- Hui et al. (2010) Hui C. Y., Cheng K. S., Taam R. E., 2010, ApJ, 714, 1149
- Kalapotharakos et al. (2021) Kalapotharakos C., Wadiasingh Z., Harding A. K., Kazanas D., 2021, ApJ, 907, 63
- Kerr (2011) Kerr M., 2011, ApJ, 732, 38
- King (1962) King I., 1962, AJ, 67, 471
- Kirsten et al. (2022) Kirsten F., et al., 2022, Nature, 602, 585
- Kızıltan et al. (2017) Kızıltan B., Baumgardt H., Loeb A., 2017, Nature, 542, 203
- Kremer et al. (2020) Kremer K., et al., 2020, ApJS, 247, 48
- Perera et al. (2017) Perera B. B. P., et al., 2017, MNRAS, 468, 2114
- Prager et al. (2017) Prager B. J., Ransom S. M., Freire P. C. C., Hessels J. W. T., Stairs I. H., Arras P., Cadelano M., 2017, ApJ, 845, 148
- Ransom (2001) Ransom S. M., 2001, PhD thesis, Harvard University
- Ransom et al. (2002) Ransom S. M., Eikenberry S. S., Middleditch J., 2002, AJ, 124, 1788
- Ray et al. (2011) Ray P. S., et al., 2011, ApJS, 194, 17
- Reynoso-Cordova et al. (2021) Reynoso-Cordova J., Burgueño O., Geringer-Sameth A., González-Morales A. X., Profumo S., Valenzuela O., 2021, J. Cosmology Astropart. Phys., 2021, 010
- Ridolfi et al. (2016) Ridolfi A., et al., 2016, MNRAS, 462, 2918
- Shklovskii (1970) Shklovskii I. S., 1970, Soviet Ast., 13, 562
- Soltis et al. (2021) Soltis J., Casertano S., Riess A. G., 2021, ApJ, 908, L5
- Song et al. (2021) Song D., Macias O., Horiuchi S., Crocker R. M., Nataf D. M., 2021, MNRAS, 507, 5161
- Staveley-Smith et al. (2022) Staveley-Smith L., Bond E., Bekki K., Westmeier T., 2022, Publ. Astron. Soc. Australia, 39, e026
- Verbunt & Freire (2014) Verbunt F., Freire P. C. C., 2014, A&A, 561, A11
- Wang et al. (2021) Wang J.-W., Bi X.-J., Yin P.-F., 2021, Phys. Rev. D, 104, 103015
- Ye et al. (2019) Ye C. S., Kremer K., Chatterjee S., Rodriguez C. L., Rasio F. A., 2019, ApJ, 877, 122
- Ye et al. (2022) Ye C. S., Kremer K., Rodriguez C. L., Rui N. Z., Weatherford N. C., Chatterjee S., Fragione G., Rasio F. A., 2022, ApJ, 931, 84
- Zhao & Heinke (2022) Zhao J., Heinke C. O., 2022, MNRAS, 511, 5964
- Zocchi et al. (2019) Zocchi A., Gieles M., Hénault-Brunet V., 2019, MNRAS, 482, 4713
- de Jager et al. (1989) de Jager O. C., Raubenheimer B. C., Swanepoel J. W. H., 1989, A&A, 221, 180
- van Straten & Bailes (2011) van Straten W., Bailes M., 2011, Publ. Astron. Soc. Australia, 28, 1