Visualizing near-coexistence of massless Dirac electrons and ultra-massive saddle point electrons
2208-5800 Cooney Road, Richmond, British Columbia V6X3A8, Canada 3 Max Planck Institute for Chemical Physics of Solids, D-01187 Dresden, Germany.
4 Department of Physics, McGill University, Montréal, Québec H3A 2T8, Canada.
† Corresponding authors: abhaykumar.nayak@weizmann.ac.il, nurit.avraham@weizmann.ac.il, haim.beidenkopf@weizmann.ac.il)
Strong singularities in the electronic density of states amplify correlation effects and play a key role in determining the ordering instabilities in various materials. Recently high order van Hove singularities (VHSs) with diverging power-law scaling have been classified in single-band electron models. We show that the 110 surface of Bismuth exhibits high order VHS with an usually high density of states divergence . Detailed mapping of the surface band structure using scanning tunneling microscopy and spectroscopy combined with first-principles calculations show that this singularity occurs in close proximity to Dirac bands located at the center of the surface Brillouin zone. The enhanced power-law divergence is shown to originate from the anisotropic flattening of the Dirac band just above the Dirac node. Such near-coexistence of massless Dirac electrons and ultra-massive saddle points enables to study the interplay of high order VHS and Dirac fermions.
introduction
The energy dispersion of the Bloch states govern key physical properties of a given material while also regulating the density of states (DOS) which plays a pivotal role in determining the ground state of interacting particles. Several exotic quantum phases, such as, superconductivity [1, 2], charge density wave [3, 4], and magnetism [5, 6] may manifest due to an upsurge in the DOS. In two-dimensions, the vanishing electron velocity at a saddle point in the energy dispersion gives rise to a logarithmic divergence in the DOS [7], called van Hove singularity (VHS). These VHSs are usually accompanied by a topological transition (Lifshits transitions) in which the Fermi surface transforms between a hole-like and an electron-like form due to the appearance or collapsing of a pocket in the Fermi surface. When the Fermi level lies in the vicinity of such Van Hove points, electron-electron interactions are enhanced, promoting the formation of electronic instabilities and correlated states. In addition to ordinary VHS, two-dimensional systems can also host high-order VHS which is characterized by a power-law divergence of DOS in energy. Such high order singularities display more exotic Fermi surface topological transitions around which the dispersion is flatter than near a conventional van Hove point. These stronger divergences in DOS can further enhance the formation of complex quantum phases via interactions and can play important roles in transport phenomena[8, 9].
High order VHS have been proposed to exist in several electronic systems such as twisted bilayer graphene and trilayer graphene, as well as other Van der Waals compounds, where the band structure can be tuned by changing the twist angle, pressure, or interlayer bias voltage [10, 8, 11, 12, 13, 14]. They have been associated with the unusual Landau level structure in biased bilayer graphene [10], the nontrivial thermodynamic and transport properties in Sr3Ru2O7 [15], the so called supermetal with diverging susceptibilities in the absence of long-range order [16] and more recently with the electronic symmetry breaking in CsV3Sb5 [17]. The effect of a high order VHS on electron interaction has been studied theoretically [8, 16, 9] in a system with weak electron interactions. Further theoretical studies classified high-order critical points based on topology, scaling, and symmetry, showing that high order VHS can be realized at generic or symmetric momenta by tuning a few parameters such as twist angle, strain, pressure, and/or external fields[18, 19]. It has been shown that they can be obtained by tuning the parameters in the Hamiltonian, particularly at high symmetry points in the Brillouin zone. Nevertheless, the corresponding symmetries also restrict the type of singularities that can be achieved.
Bismuth (Bi) is an ideal material to explore the interplay of topological and correlated phases owing to its high spin-orbit coupling and long mean free path [20, 21, 22, 23]. Although Bi has been studied in various contexts, such as unconventional superconductivity [24], electron fractionalization [25] and quantum hall ferromagnetism [26, 27], its exact topological classification has been resolved only recently, as being on the verge of a phase transition between a high order topological insulator and a strong topological insulator [39, 29]. Here, we show that the (110) surface of Bi exhibits a remarkable power-law divergence of the DOS arising from high-order VHS presented on this surface. Spectroscopic mapping of the surface band structure at the corresponding energy range, using quasi particle interference (QPI) measurements, shows that this high-order VHS occurs in conjunction with a highly anisotropic Dirac band located at the center of the surface Brillouin zone. By directly visualizing the Dirac bands in QPI we observe a rapid anisotropic flattening of the upper Dirac band just above the Dirac node which leads to the sharp increase in the DOS. Calculated QPI using Green’s function approach exhibit excellent agreement with our QPI measurements. The near-coexistence of massless Dirac fermions and heavy saddle-point fermions is an interesting property of the (110) surface that enables to study the interplay and competing orders of high orders VHS and Dirac fermions.
Results
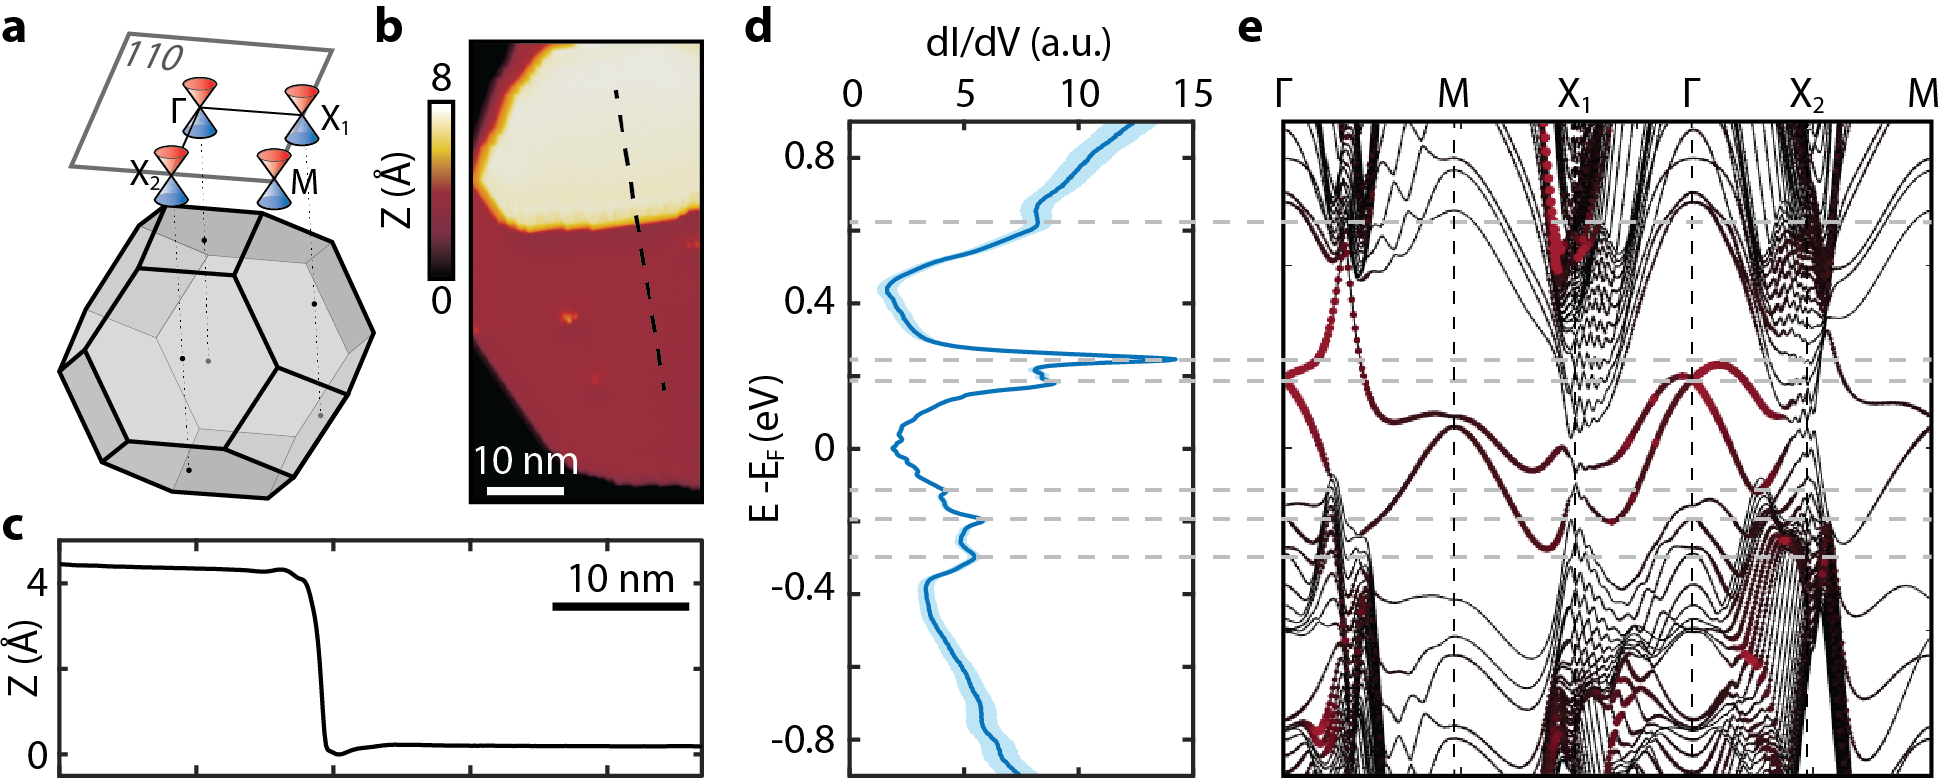
Fresh surfaces of Bi were exposed by cleaving GdPtBi crystals grown in Bi flux [30, 39]. Due to its anisotropic rhombohedral structure cleaving these crystals under ultrahigh vacuum conditions exposes surfaces of residual crystalline Bi inclusions in various orientations. Here, we measured the Bi(110) and Bi(111) surfaces (Fig.1a), at 4.2K in a low temperature Unisoku STM. A representative topography of pristine Bi(110) surface terraces is shown in Fig.1b and a height profile across a mono-atomic step edge in Fig.1c. A typical differential conductance () profile measured over the Bi(110) surface is shown in Fig.1d. The spectrum was measured on a clean terrace far from any impurities. Peaks in the spectrum (marked by dashed lines in Fig.1d) signify increased local density of states (DOS). Many of them correspond to band extrema shown in the density functional theory (DFT) calculation of the Bi(110) surface band structure (Fig.1e). We consider a crystal of hexagonal shape which preserves rotational and inversion symmetry. The (110) surface preserves only a mirror symmetry. Owing to the inverted bulk band structure of bismuth [39, 21], Dirac bands are realized on its various surfaces. While on the Bi(111) surface the Dirac bands are directly overlapping with bulk bands [39, 20, 21], on the (110) surface the Dirac bands at and (Fig.1e) are very well separated from the bulk projected bands, making it ideal to directly visualize their exact dispersion.
Visualizing a topological Dirac cone on Bi(110)
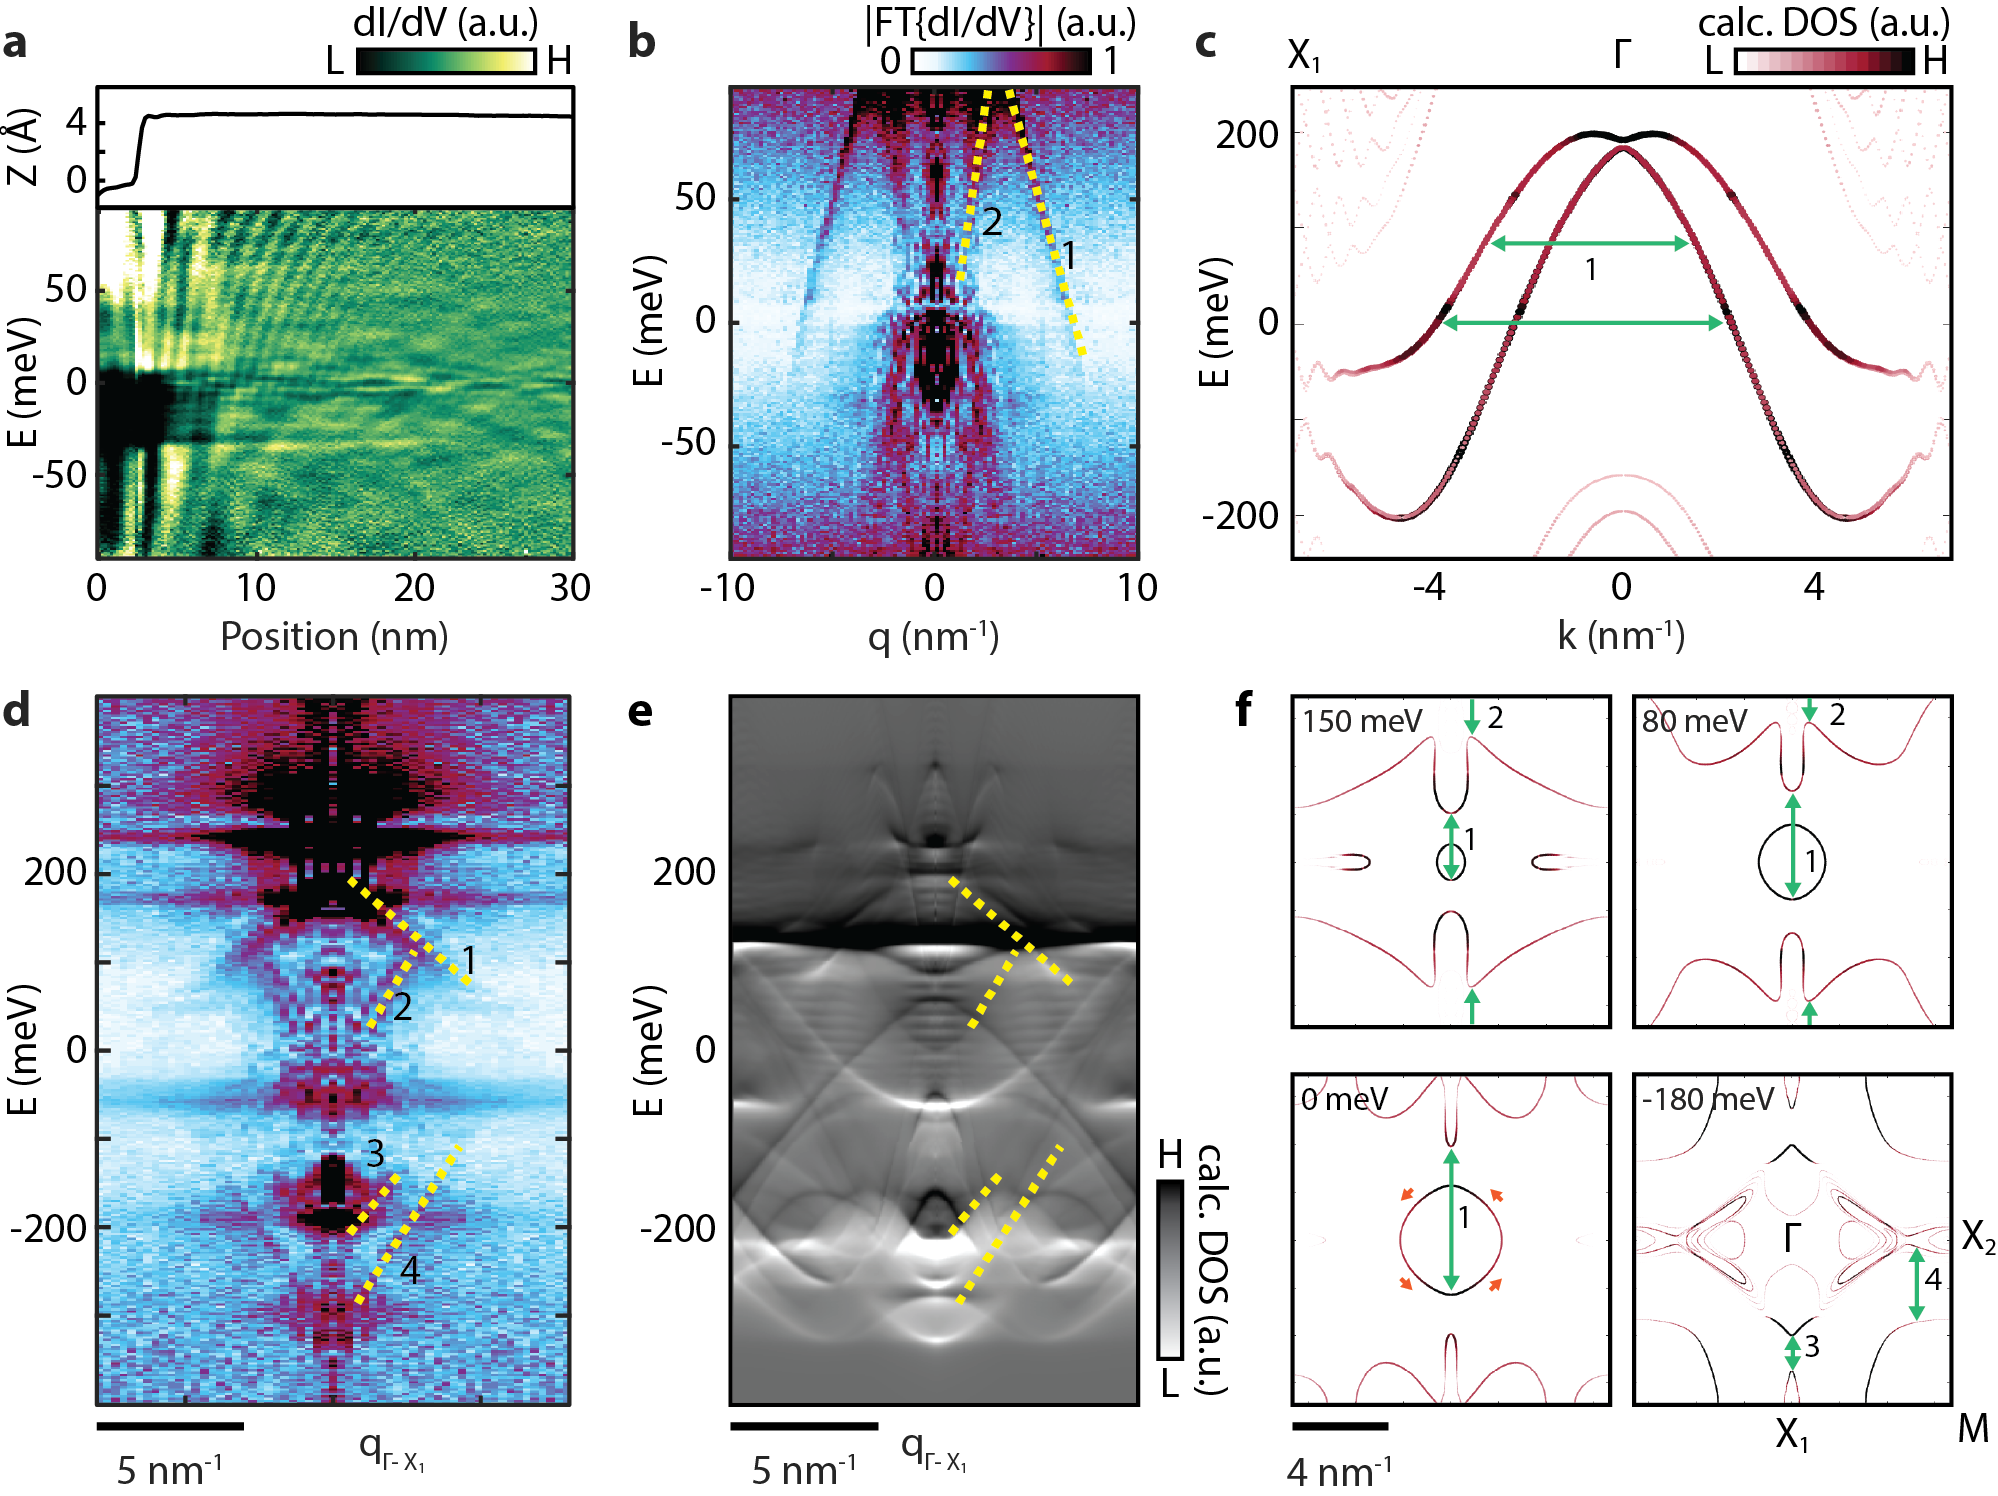
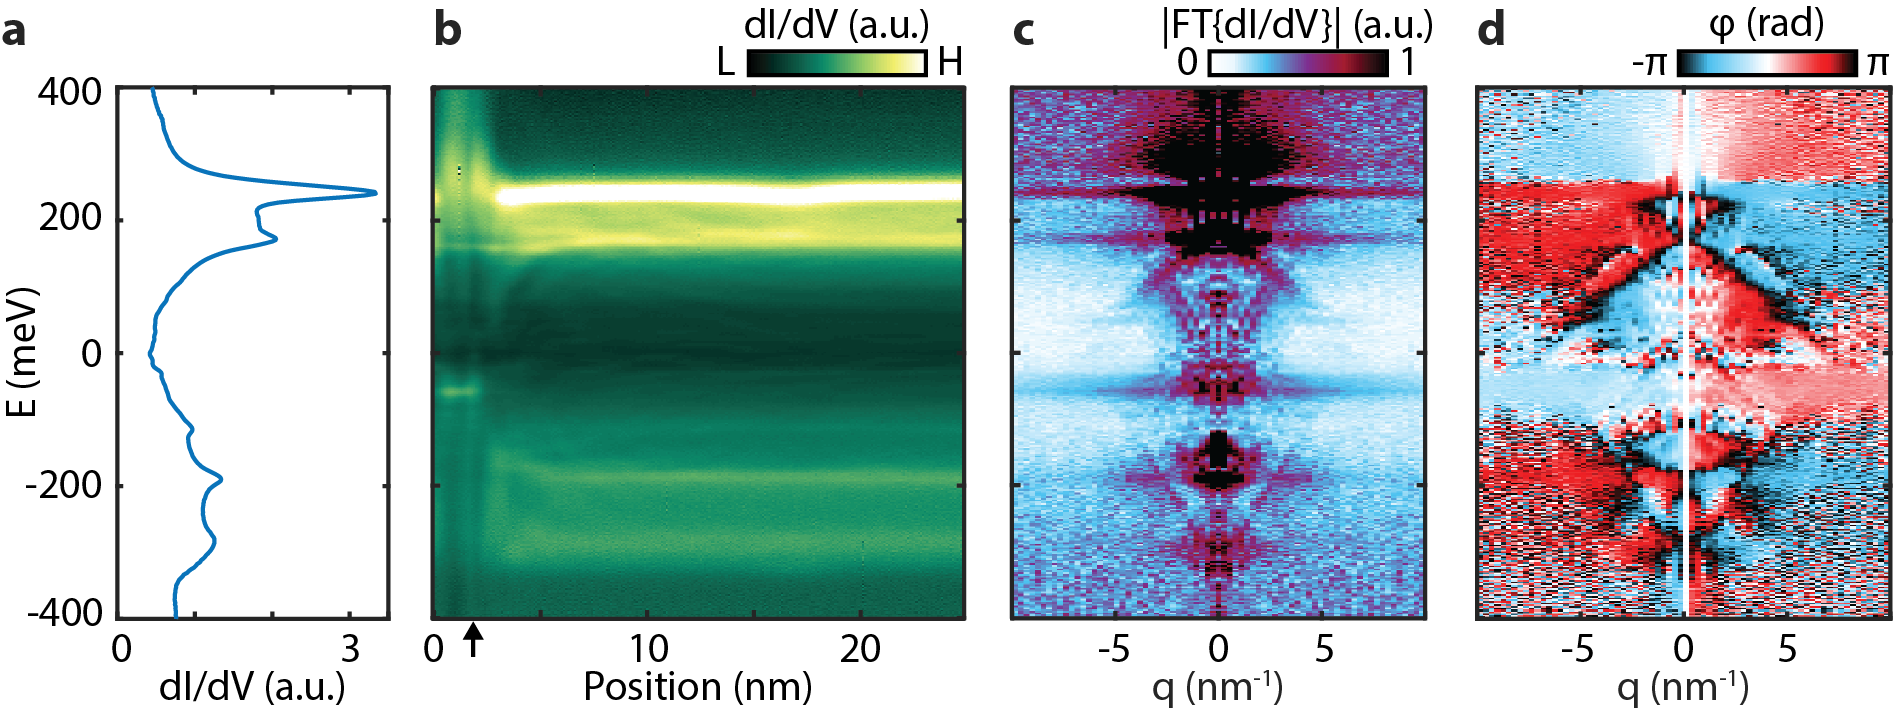
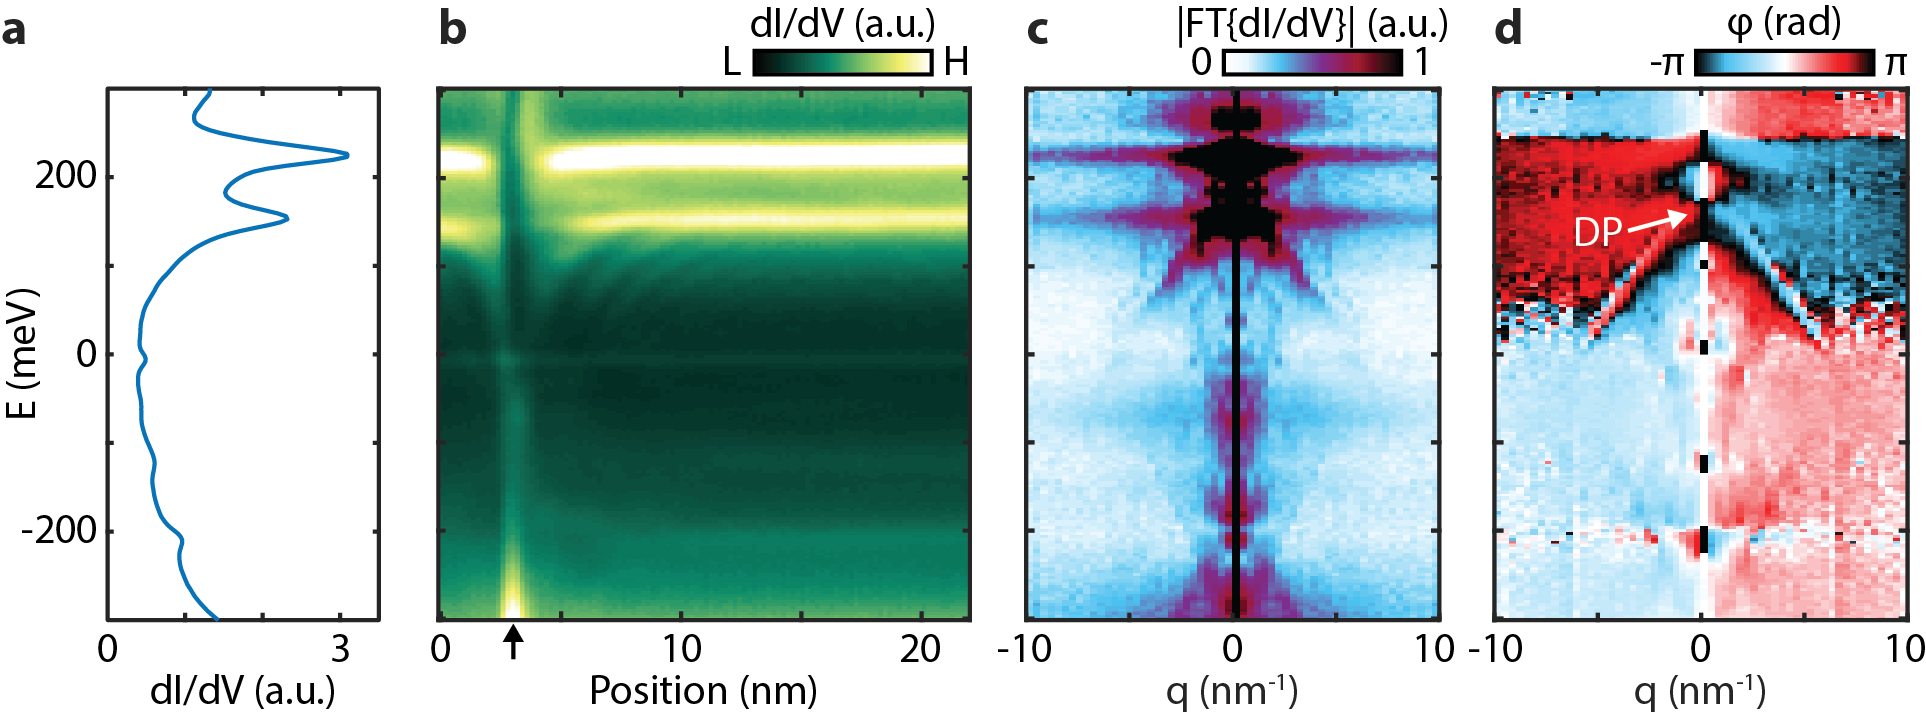
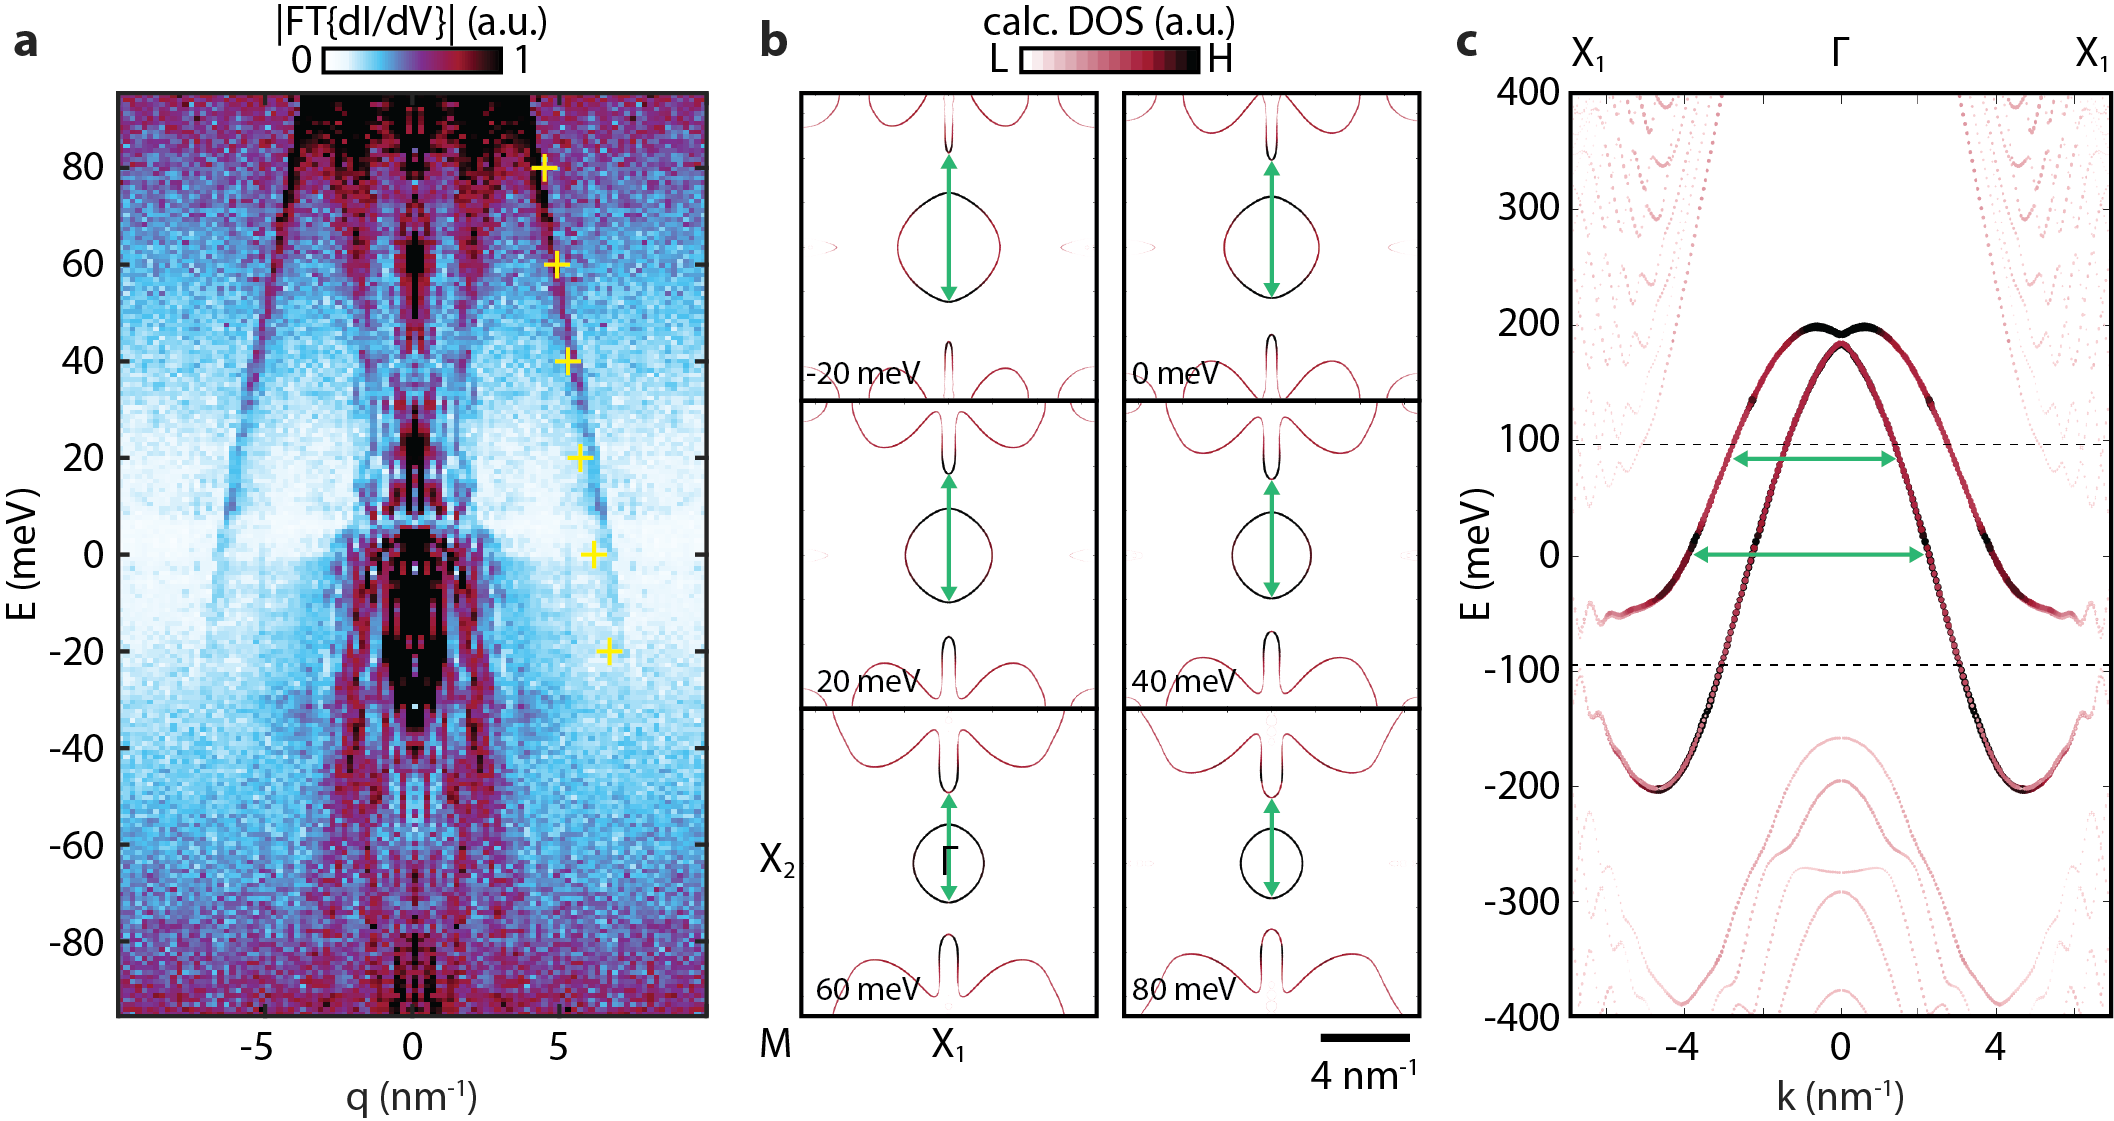
To resolve the topological Dirac bands and other surface bands on the Bi(110) surface we map the QPI patterns imprinted in the local DOS due to scattering off surface step edges [31]. A spatially resolved spectroscopic map measured across an atomic step-edge is shown in Fig.2a (see also Fig.S1 and S2). The momentum along the step edge is conserved and we only see scattering processes with momentum transfer in the direction perpendicular to the step edge. Strong spatial modulations emanating from the step edge and dispersing in energy are embedded in the local DOS. Fourier decomposition of these QPI patterns (Fig.2b) separates them according to the transferred momentum, q, between the scattered electronic states [31]. We identify two prominent scattering processes labeled and marked by yellow dashed lines in Fig.2b. Particularly interesting is the outer QPI pattern (process 1) that exhibits clear linear dispersion over more than a hundred meV, at energies just below the Dirac point at . This process provides a direct visualization of the topological Dirac band as it results from scattering between the lower part of the Dirac cone to its upper part that curves downwards in a Rashba like manner, as shown in Fig.2c. A similar larger energy window measured on different step-edge (Fig.2d) reproduces the scattering processes marked in Fig.2b along with other dispersing modes at lower energies (see also S3, S4 and S5). To fully associate the observed QPI patterns with particular scattering processes, we compare the data with Green’s function calculation of the QPI (Fig.2e; see also Fig.S6), based on ab initio calculation of the Bi(110) surface states. The four identified processes (yellow dashed lines) exhibit good agreement in q values as a function of energy with the corresponding calculated QPI patterns.
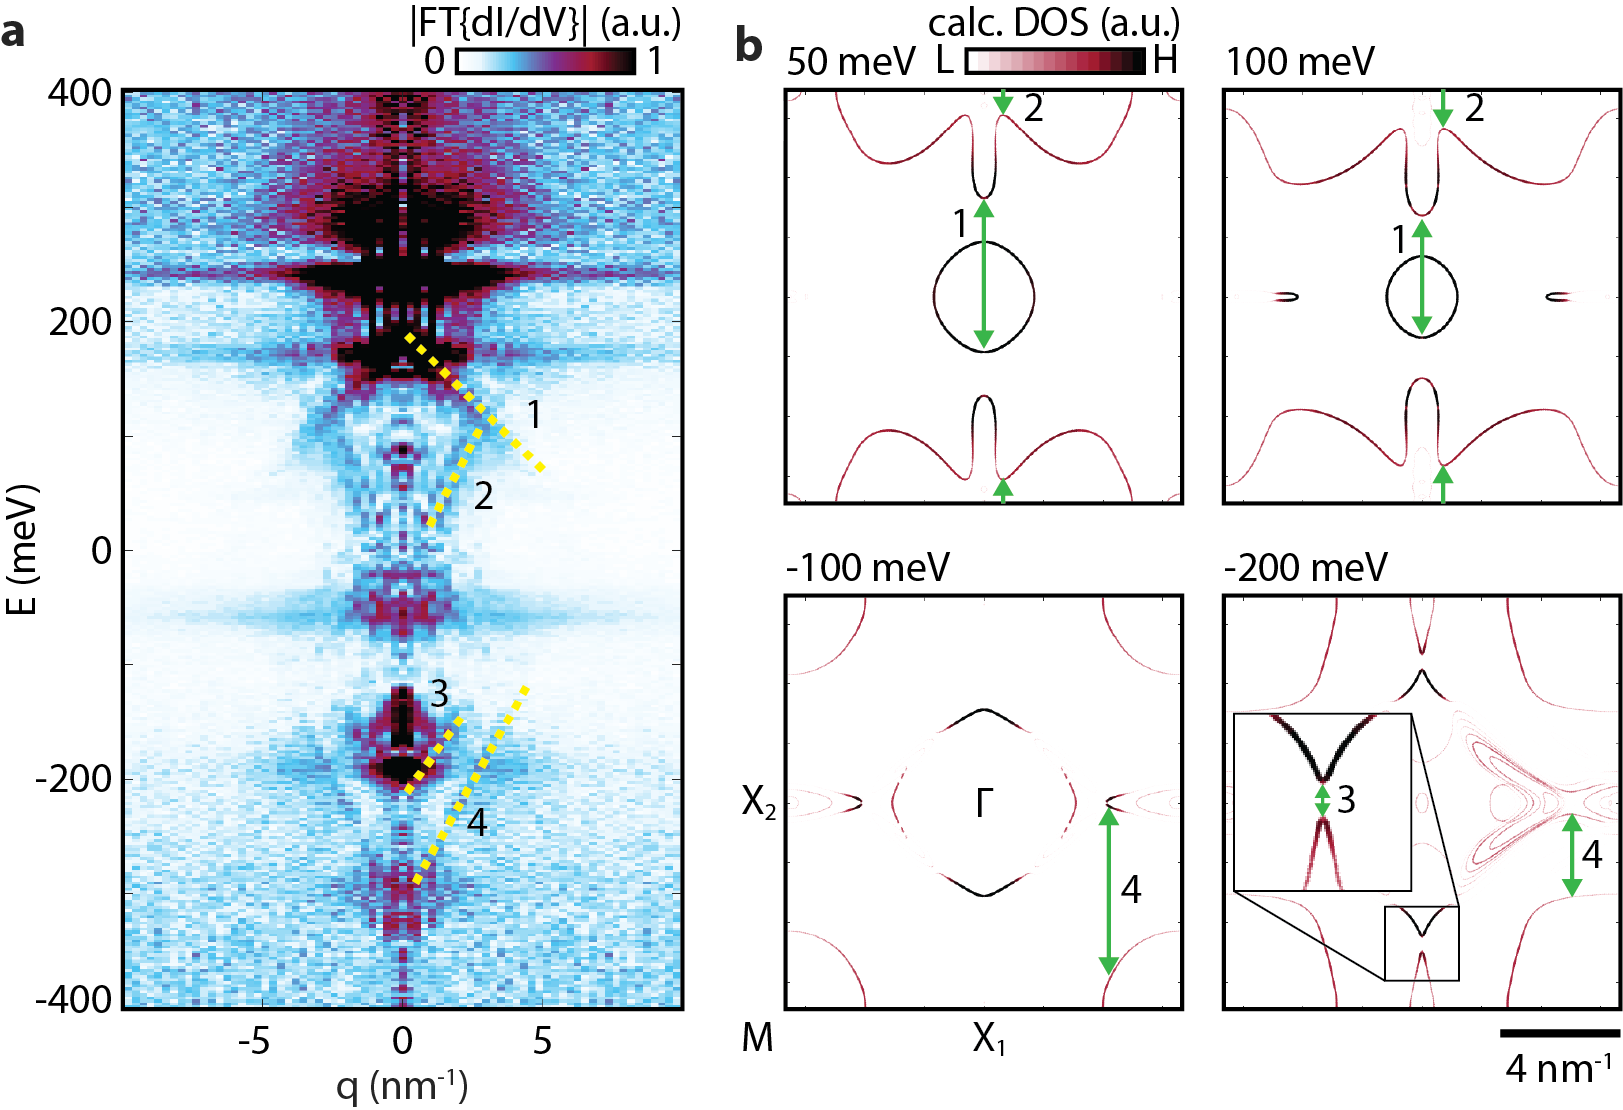
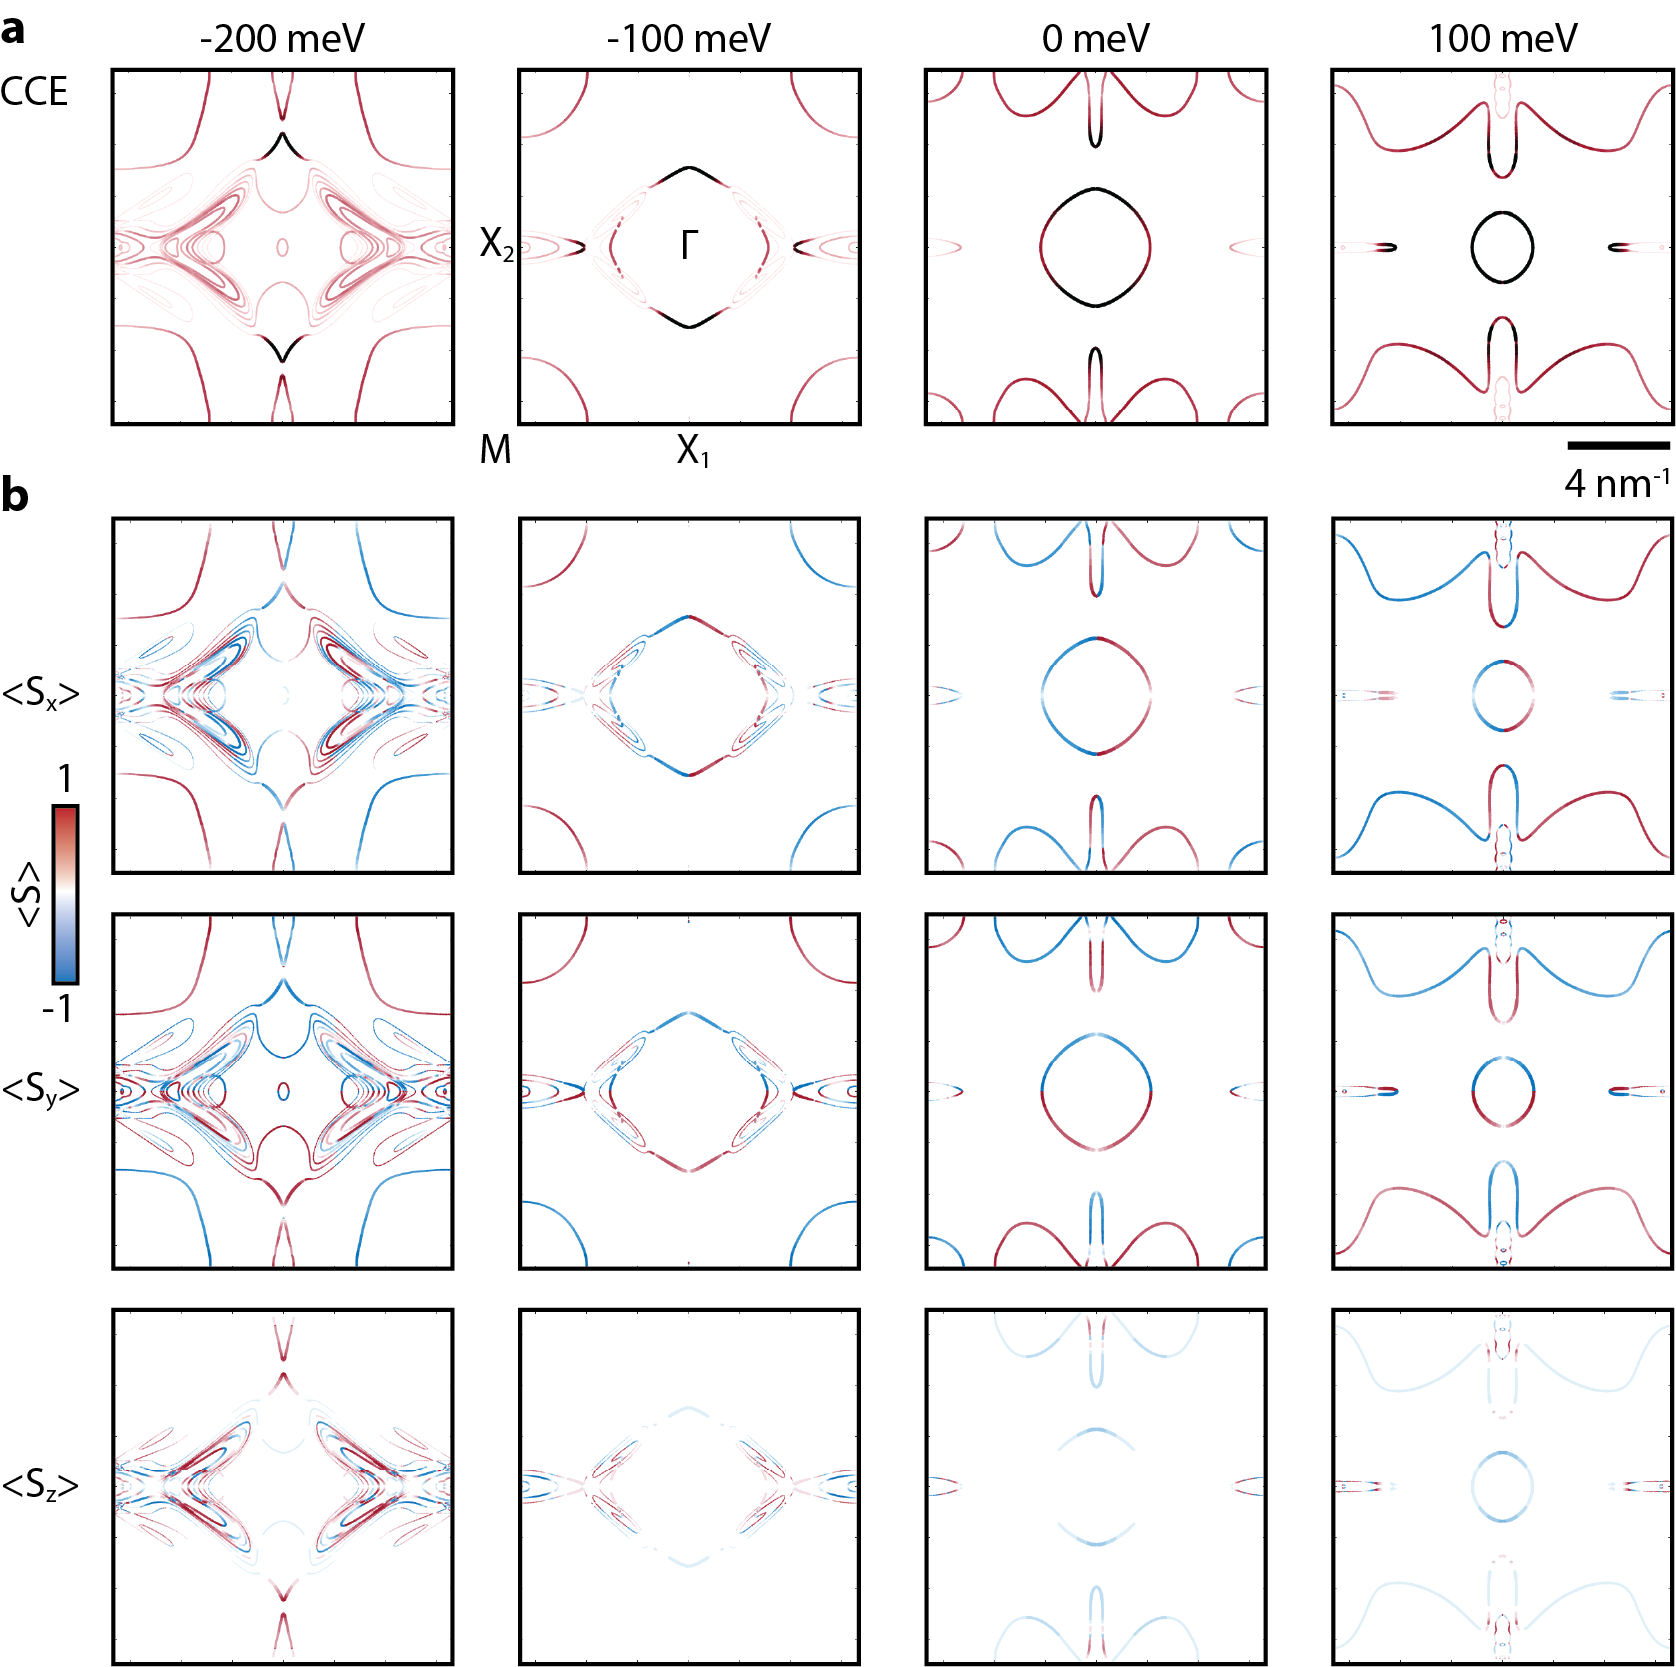
Further identification of the particular processes is obtained by comparing the momentum transfer with particular q vectors that connect the corresponding electron and hole pockets in the calculated surface band structure. A few representative contours of constant energy (CCE) cuts along with the identified scattering wave vectors (labeled and marked by green arrows) is shown in Fig.2f (see also Fig.S3 and Fig.S4 for details). Sparsity of the surface bands in the relevant energies allowed us to readily visualize and uniquely identify the various scattering processes. The scattering process 1 along the direction, indeed corresponds to momentum transfer between the lower part of the Dirac band, the circular dispersing band around gamma, and its upper part that curves downwards (Fig.2c), giving rise to the U-shaped dispersing pocket. Process 2 results from scattering across the Brillouin zone, between the high intensity tips of those U-shaped pockets. Finally, processes 3 and 4 result from scattering between high intensity points along the direction within the Brillouin zone.
High-order van Hove singularity
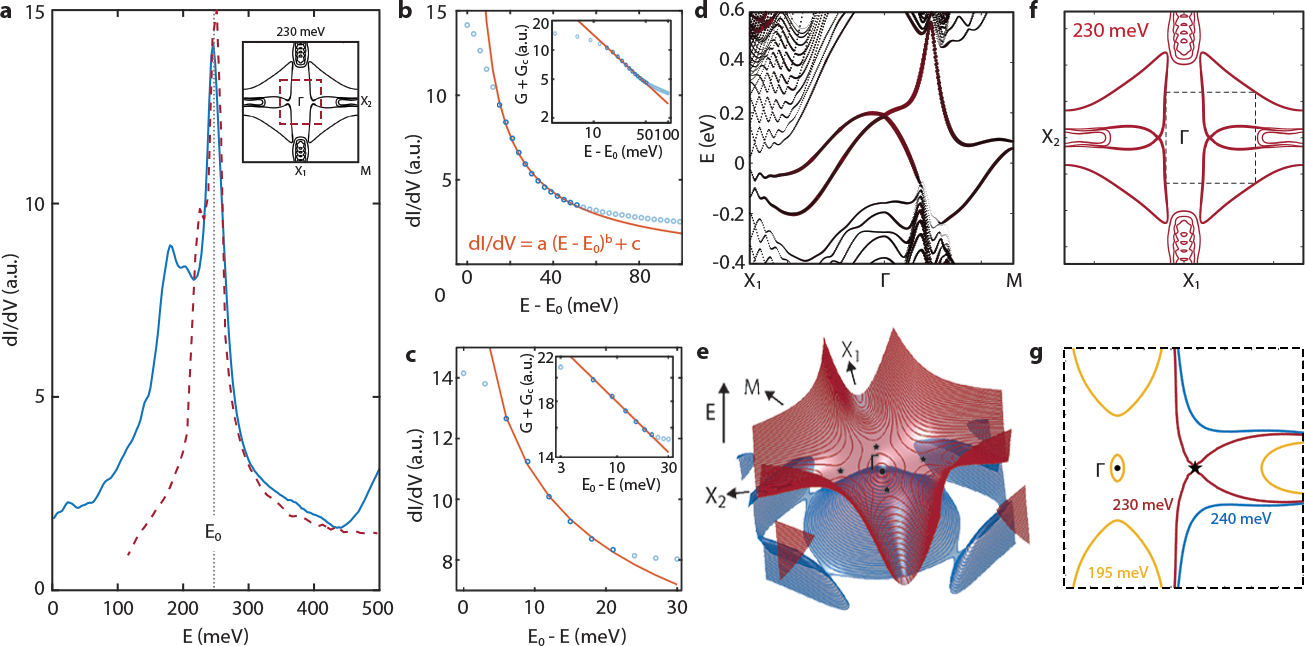
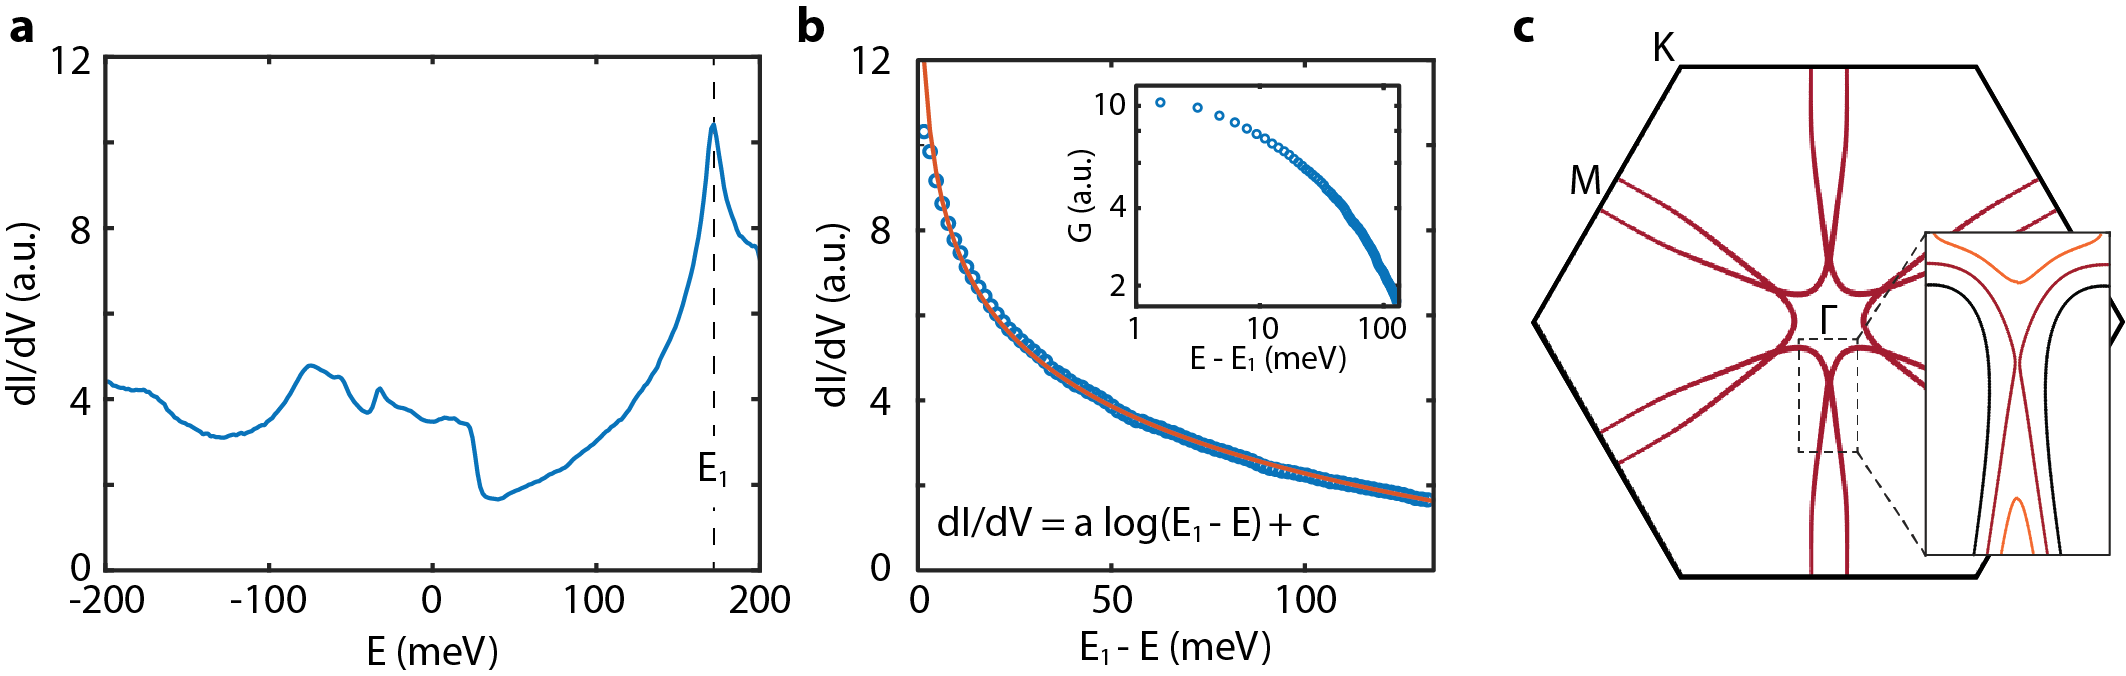
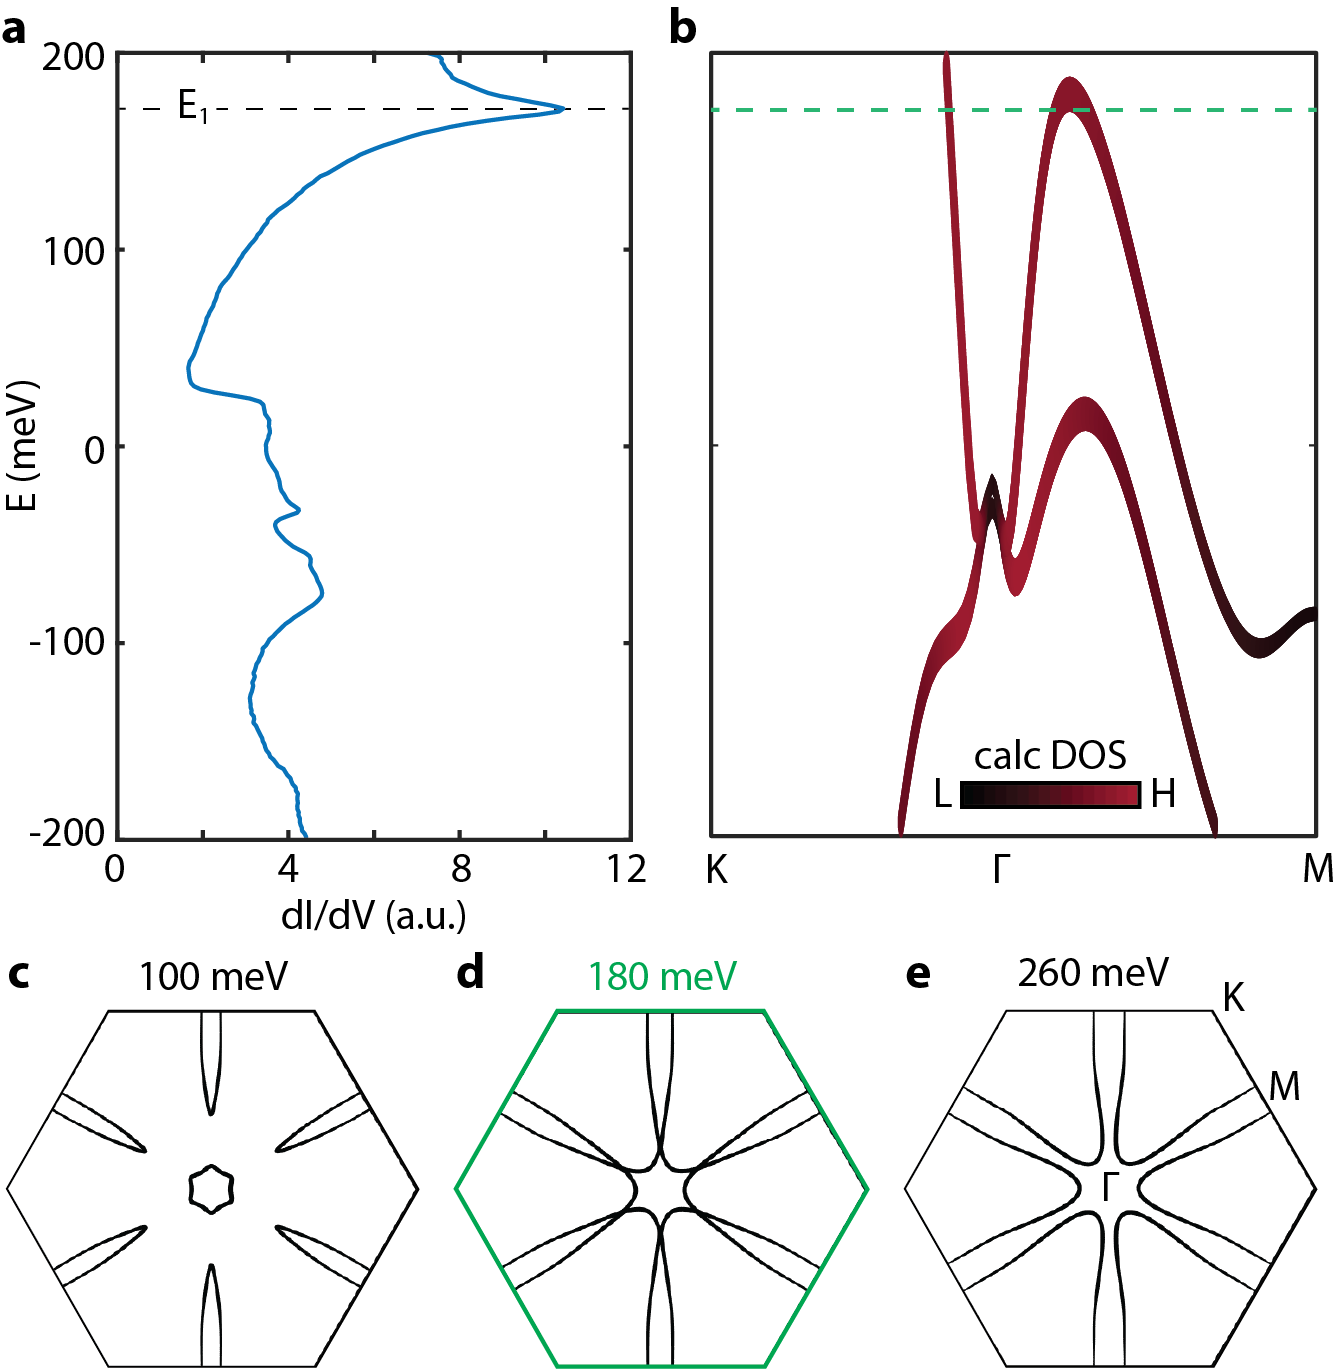
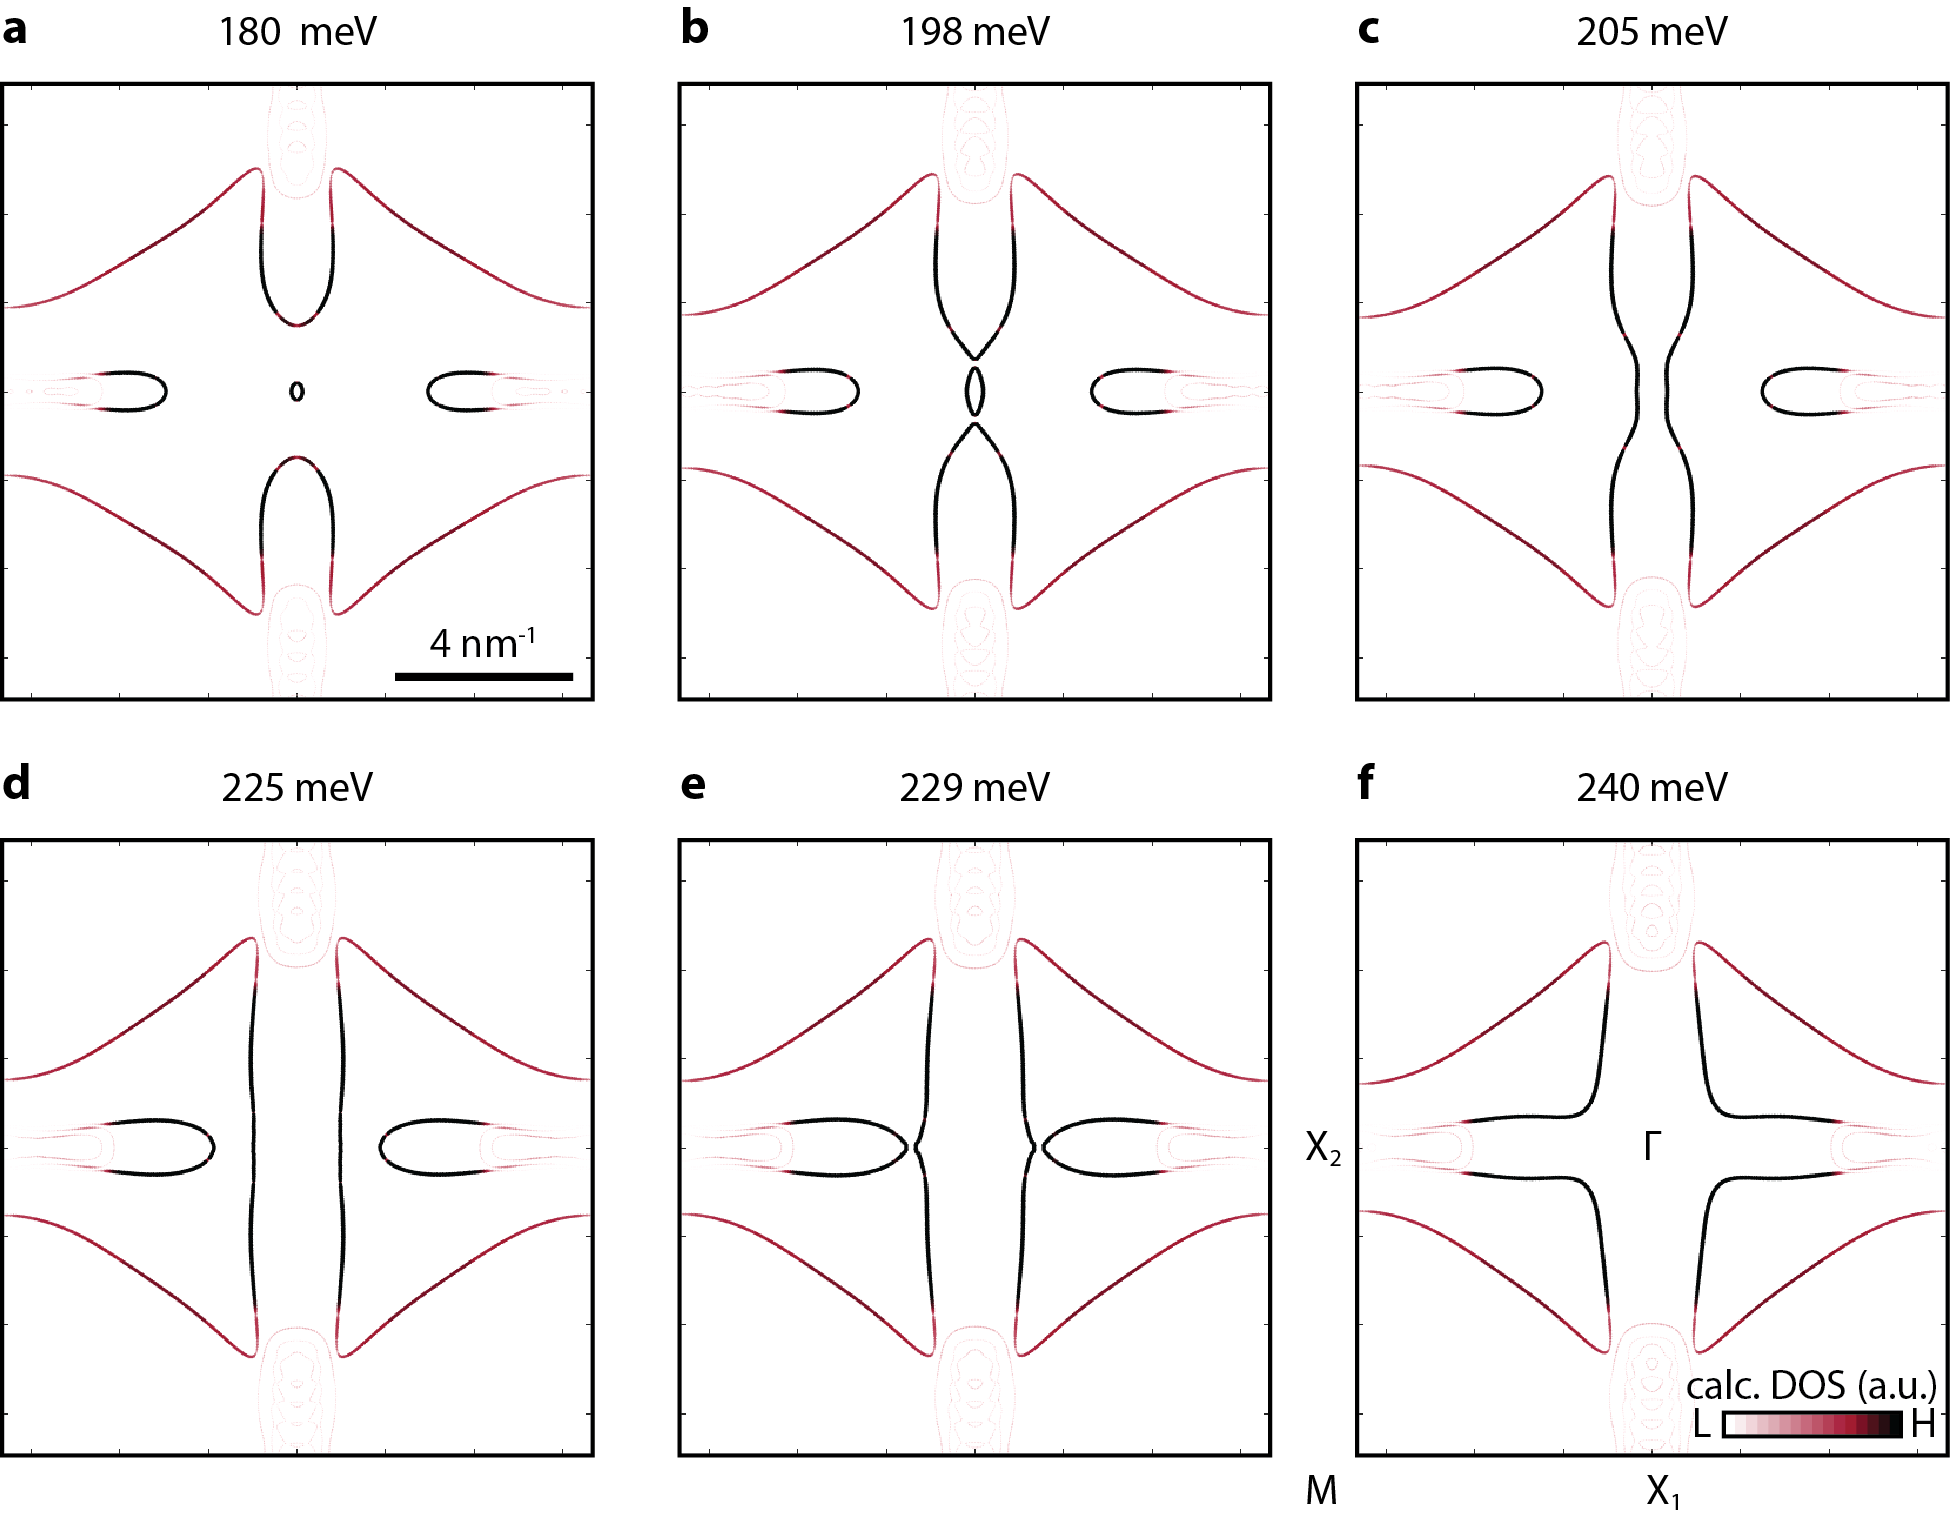
We now focus on the energy region just above the Dirac node in which the upper part of the Dirac band flattens out as a function of energy. The spectrum in that energy window exhibits a remarkable increase characterized by a sharp peak at meV (Fig.1d). This VHS is characterized by a power law divergence with an unusually high exponent of . Much higher than an exponent of measured near high-order VHS in magic angle graphene [8]. Comparison with DFT calculations shows that the peak at meV is very well captured by the calculated DOS stemming from the vicinity of the Dirac cone at (Fig.3a and Fig.S8 for more details). A power-law fit () to the profile shown in Fig.3a, for energies above the peak, is presented in Fig.3b along with a log-log plot of the exact fitting region (inset). The power-law exponent was extracted by fitting over the linear region shown in the log-log plot and its corresponding domain in the raw profile (dark blue circles in Fig.3b). This remarkable divergence has been observed across all our measurements done at different regions on the Bi(110) surface (see Fig.S9). A similar analysis of the power-law divergence of the DOS for energies below the peak is shown in Fig.3c. The corresponding power-law fit yields a much lower exponent of , possibly due to the DOS contributed by other bands, at lower energies. The high order VHS observed on the (110) surface can be contrasted with a conventional VHS observed on the (111) surface, at about 180 meV, as demonstrated by the spectrum of the Bi(111) surface shown in Fig.4a and b. Here the VHS originates from six ordinary saddle points that form around at 180 meV (Fig.4c) when the six hole pockets along the direction merge with the hexagonal electron pocket around (see Fig.S7). Indeed, the divergence exhibits logarithmic behaviour as expected for conventional VHS (Fig.4b).
Close inspection of the Bi(110) band structure around , in the corresponding energy window, reveals two Lifshitz transitions at slightly different energies, meV and meV, which give rise to two pairs of symmetric saddle points located along the and the directions, respectively (Fig.S10b and d. While the points along are clearly ordinary saddle points, the nearly tangential band touching along the direction (Fig.3d and e) have similar shape to the symmetric VHS observed on twisted bilayer graphene [8] with a slight deviation just around the touching point. Indeed, probing the DOS on a smaller region just around these nearly tangential touching points does not account for the large exponent we observe. However, on a larger scale (Fig.3a) the power-law exponent extracted on the Bi(110) surface is significantly higher than the one observed on twisted bilayer graphene [8]. We therefore believe that the enhanced power-law divergence does not originate from the immediate local surrounding of the saddle points but rather from the unique topology of the Bi(110) band structure, at this energy range, on a larger scale. As shown in Fig.3e and Fig.S10, the surface bands along the direction that constitute the nearly tangential saddle points remain flat almost across the whole Brillouin zone (Fig.3f). At higher energies these flat bands merge with the hole pockets along , such that around the peak energy meV, this surface band becomes flat along both the and the directions (Fig.3e and S10), though not to the same extent. This extended flattening seems to give rise to the sharp increase in the DOS we observe in our measurements. We therefore identify the small peak at meV with the regular saddle points along , and the more significant peak with the extended flattening of the bands constituent the nearly tangential saddle points. While point singularities have been theoretically explored and classified [19, 8], singularities of lines or circles of critical points have not been classified and explored theoretically [19], further studies are needed to generalize the classification to include singularities of infinite dimensions. The bulk chemical potential in Bi(110) lies around 200 mev above the touching point of the Dirac point and the higher order saddle point. Nevertheless, our spectroscopic study may very well motivate thin film growth and investigation [32, 33] of this exotic orientation under efficient gate tuning of the electronic density towards the extreme van Hove singularities and adjacent Dirac node.
Summary
In summary, we observe a power-law divergent DOS stemming from high-order VHS on the (110) surface of Bismuth. This high order VHS does not originate from the immediate local vicinity of the saddle points hosted on the surface, but rather from an extended flattening of the surface band structure on a larger scale. We further show that this high-order singularity occurs in close proximity to the surface Dirac cone of Bi(110) surface. The coexistence of Dirac fermions and nearly flat bands have been studied theoretically on 2D systems with square-octagon lattice [34]. It was shown that the competition of paramagnetic contribution of the high-order VHS and diamagnetic contribution of the Dirac cones may lead to a dia- to paramagnetic phase transition in orbital suseptibility as a function of doping at the touching point at which the high-order VHS and Dirac point are present. Our observation renders Bi(110) an interesting system to study physical quantities related to high-order VHS in general and to this unique coexistence in particular. Moreover, tuning of the chemical potential towards the high-order VHS in Bi(110) thin films may induce correlated states of matter within strongly interacting topological bands.
Figures
Methods
STM measurements
The measurements were performed in a commercial Unisoku STM at 4.2 K. The Pt-Ir tips were characterized in a freshly prepared Cu(111) single crystal. This process ensured a robust tip with reproducible results across different cleaves and samples from different batches. All the measurements were taken using standard lock-in techniques.
DFT calculations
To study the electronic properties of Bi(110) surface, calculations based on density functional theory (DFT) were performed using Vienna Ab initio Simulation Package (VASP)[35, 36]. The projector-augmented wave pseudopotential and a plane-wave energy cutoff of 120 eV were adopted. A 58 Å thick slab was constructed to model the cleaved Bi(110) surface. The in-plane lattice parameters of 4.25 ×4.72 Å and a vacuum region of 15 Å along z-direction were set for the slab model. A k-mesh was adopted for sampling the two-dimensional Brillouin Zone. The four upmost atomic layers were relaxed until the force on each atom is less than 0.01 eV/Å. The surface-atom-projected band structures in Fig.1e present the surface electronic properties. The size of red circules represent the projected weight of the top four Bi layers. Because of the finite size effect, the top and bottom surface states have weak hybridization and generate tiny gaps at and points. Such gaps have marginal effects in our analysis of VHS and should vanish in reality.
Data availability
The data that support the plots within this paper and other findings of this study are available from the corresponding authors upon reasonable request.
References
- [1] W. Kohn and J.. Luttinger “New Mechanism for Superconductivity” In Phys. Rev. Lett. 15.12 American Physical Society, 1965, pp. 524–526
- [2] J.. McChesney, Aaron Bostwick, Taisuke Ohta, Thomas Seyller, Karsten Horn, J González and Eli Rotenberg “Extended van Hove Singularity and Superconducting Instability in Doped Graphene” In Phys. Rev. Lett. 104.13, 2010, pp. 136803
- [3] T.. Rice and G.. Scott “New Mechanism for a Charge-Density-Wave Instability” In Phys. Rev. Lett. 35.2 American Physical Society, 1975, pp. 120–123
- [4] D. Makogon, R. Gelderen, R. Roldán and C. Smith “Spin-density-wave instability in graphene doped near the van Hove singularity” In Phys. Rev. B 84.12 American Physical Society, 2011, pp. 125404
- [5] Marcus Fleck, Andrzej M. Oleś and Lars Hedin “Magnetic phases near the Van Hove singularity in - and -band Hubbard models” In Phys. Rev. B 56.6 American Physical Society, 1997, pp. 3159–3166
- [6] A. Ziletti, S.. Huang, D.. Coker and H. Lin “Van Hove singularity and ferromagnetic instability in phosphorene” In Phys. Rev. B 92.8 American Physical Society, 2015, pp. 085423
- [7] Léon Van Hove “The Occurrence of Singularities in the Elastic Frequency Distribution of a Crystal” In Phys. Rev. 89.6 American Physical Society, 1953, pp. 1189–1193
- [8] Noah F.. Yuan, Hiroki Isobe and Liang Fu “Magic of high-order van Hove singularity” In Nat. Commun. 10.1 Nature Research, 2019, pp. 5769
- [9] Laura Classen, Andrey V. Chubukov, Carsten Honerkamp and Michael M. Scherer “Competing orders at higher-order Van Hove points” In Phys. Rev. B 102, 2020, pp. 125141
- [10] A. Shtyk, G. Goldstein and C. Chamon “Electrons at the monkey saddle: A multicritical Lifshitz pointbility of T-graphene: Interplay of high-order van Hove singularities and Dirac cones” In Phys. Rev. B 95, 2017, pp. 035137
- [11] Guerci Daniele, Simon Pascal and Mora Christophe “Higher-order Van Hove singularity in magic-angle twisted trilayer graphene” In Phys. Rev. Res. 4, 2022, pp. L012013
- [12] Di Sante Domenico, Wu Xianxin, Fink Mario, Hanke Werner and Thomale Ronny “Triplet superconductivity in the Dirac semimetal germanene on a substrate” In Phys. Rev. B 99, 2019, pp. 201106
- [13] Ramires Aline, Coleman Piers, Nevidomskyy Andriy H. and Tsvelik A.. “ - YbAlB4 : A Critical Nodal Metal” In Phys. Rev. Lett. 109, 2012, pp. 176404
- [14] Robert S. Markiewicz, Bahadur Singh, Christopher Lane and Arun Bansil “High-order Van Hove singularities in cuprates and related high-Tc superconductors” In arXiv:2105.04546v1, 2021
- [15] Dmitry V. Efremov, Alex Shtyk, Andreas W., Claudio Chamon, Andrew P Mackenzie and Joseph J. Betouras “Multicritical Fermi Surface Topological Transitions” In Phys. Rev. Lett. 123, 2019, pp. 207202
- [16] Hiroki Isobe and Liang Fu “Supermetal” In Phys. Rev. Res. 1, 2019, pp. 033206
- [17] Kang Mingu, Fang Shiang, Kim Jeong-Kyu, Ortiz Brenden R, Ryu Sae Hee, Kim Jimin, Yoo Jonggyu, Sangiovanni Giorgio, Sante Domenico Di, Park Byeong-Gyu, Jozwiak Chris, Bostwick Aaron, Rotenberg Eli, Kaxiras Efthimios, Wilson Stephen D., Park Jae-Hoon and Comin Riccardo “Twofold van Hove singularity and origin of charge order in topological kagome superconductor ” In Nature Physics 18, 2022, pp. 301
- [18] Noah F Q Yuan and Liang Fu “Classification of critical points in energy bands based on topology, scaling, and symmetry” In Phys. Rev. B 101.12, 2020, pp. 125120
- [19] Anirudh Chandrasekaran, Alex Shtyk, Joseph J Betouras and Claudio Chamon “Catastrophe theory classification of Fermi surface topological transitions in two dimensions” In Phys. Rev. Res. 2.1, 2020
- [20] Ilya K. Drozdov, A. Alexandradinata, Sangjun Jeon, Stevan Nadj-Perge, Huiwen Ji, R.. Cava, B. Andrei Bernevig and Ali Yazdani “One-dimensional topological edge states of bismuth bilayers” In Nat. Phys. 10.9, 2014, pp. 664–669
- [21] Frank Schindler, Zhijun Wang, Maia G Vergniory, Ashley M Cook, Anil Murani, Shamashis Sengupta, Alik Yu Kasumov, Richard Deblock, Sangjun Jeon, Ilya Drozdov, Hélène Bouchiat, Sophie Guéron, Ali Yazdani, B Andrei Bernevig and Titus Neupert “Higher-order topology in bismuth” In Nat. Phys. 14.9, 2018, pp. 918–924
- [22] Chuang-Han Hsu, Xiaoting Zhou, Tay-Rong Chang, Qiong Ma, Nuh Gedik, Arun Bansil, Su-Yang Xu, Hsin Lin and Liang Fu “Topology on a new facet of bismuth” In Proc. Natl. Acad. Sci. 116.27, 2019, pp. 13255–13259
- [23] Jäck Berthold, Xie Yonglong, Li Jian, Jeon Sangjun, Bernevig B. and Yazdani Ali “Observation of a Majorana zero mode in a topologically protected edge channel” In Science 364.6447 American Association for the Advancement of Science, 2019, pp. 1255–1259
- [24] Om Prakash, Anil Kumar, A Thamizhavel and S Ramakrishnan “Evidence for bulk superconductivity in pure bismuth single crystals at ambient pressure” In Science 355.6320 American Association for the Advancement of Science, 2017, pp. 52–55
- [25] Kamran Behnia, Luis Balicas and Yakov Kopelevich “Signatures of electron fractionalization in ultraquantum bismuth” In Science 317.5845 American Association for the Advancement of Science, 2007, pp. 1729–1731
- [26] Benjamin E. Feldman, Mallika T. Randeria, András Gyenis, Fengcheng Wu, Huiwen Ji, R.. Cava, Allan H. MacDonald and Ali Yazdani “Observation of a nematic quantum Hall liquid on the surface of bismuth” In Science 354.6310, 2016, pp. 316–321
- [27] Mallika T. Randeria, Kartiek Agarwal, Benjamin E. Feldman, Hao Ding, Huiwen Ji, R.. Cava, S.. Sondhi, Siddharth A. Parameswaran and Ali Yazdani “Interacting multi-channel topological boundary modes in a quantum Hall valley system” In Nature 566.7744 Nature Publishing Group, 2019, pp. 363–367
- [28] Abhay Kumar Nayak, Jonathan Reiner, Raquel Queiroz, Huixia Fu, Chandra Shekhar, Binghai Yan, Claudia Felser, Nurit Avraham and Haim Beidenkopf “Resolving the topological classification of bismuth with topological defects” In Sci. Adv. 5.11, 2019, pp. eaax6996
- [29] Frank Schindler, Zhijun Wang, Maia G. Vergniory, Ashley M. Cook, Anil Murani, Shamashis Sengupta, Alik Yu Kasumov, Richard Deblock, Sangjun Jeon, Ilya Drozdov, Hélène Bouchiat, Sophie Guéron, Ali Yazdani, B. Bernevig and Titus Neupert “Higher-order topology in bismuth” In Nature Physics 14, 2018, pp. 918–924
- [30] Chandra Shekhar, Nitesh Kumar, V Grinenko, Sanjay Singh, R Sarkar, H Luetkens, Shu-Chun Wu, Yang Zhang, Alexander C Komarek, Erik Kampert, Yurii Skourski, Jochen Wosnitza, Walter Schnelle, Alix McCollam, Uli Zeitler, Jürgen Kübler, Binghai Yan, H-H Klauss, S S P Parkin and C Felser “Anomalous Hall effect in Weyl semimetal half-Heusler compounds RPtBi (R = Gd and Nd)” In Proc. Natl. Acad. Sci. 115.37 National Academy of Sciences, 2018, pp. 9140–9144
- [31] Nurit Avraham, Jonathan Reiner, Abhay Kumar-Nayak, Noam Morali, Rajib Batabyal, Binghai Yan and Haim Beidenkopf “Quasiparticle Interference Studies of Quantum Materials” In Adv. Mater. 30.41 Wiley-Blackwell, 2018, pp. 1707628
- [32] Shuo-Ying Yang, Kai Chang and Stuart S.. Parkin “Large planar Hall effect in bismuth thin films” In Phys. Rev. Research 2, 2020, pp. 022029(R)
- [33] Laisi Chen, Amy X. Wu, Naol Tulu, Joshua Wang, Adrian Juanson, Kenji Watanabe, Takashi Taniguchi, Michael T. Pettes, Marshall Campbell, Chaitanya A. Gadre, Yinong Zhou, Hangman Chen, Penghui Cao, Luis A. Jauregui, Ruqian Wu, Xiaoqing Pan and Javier D. Sanchez-Yamagishi “Ultrathin crystals of bismuth grown inside atomically-smooth van der Waals materials” In arXiv:2211.07681
- [34] D.. Oriekhov, V.. Gusynin and V.. Loktev “Orbital susceptibility of T-graphene: Interplay of high-order van Hove singularities and Dirac cones” In Phys. Rev. B 103, 2021, pp. 195104
- [35] G. Kresse and J. Furthmüller “Efficient iterative schemes for ab initio total-energy calculations using a plane-wave basis set” In Phys. Rev. B 54.16 American Physical Society, 1996, pp. 11169–11186
- [36] Fabien Tran and Peter Blaha “Accurate Band Gaps of Semiconductors and Insulators with a Semilocal Exchange-Correlation Potential” In Phys. Rev. Lett. 102.22 American Physical Society, 2009, pp. 226401
References
- [37] C. Dutreix, H. González-Herrero, I. Brihuega, M.. Katsnelson, C. Chapelier and V.. Renard “Measuring the Berry phase of graphene from wavefront dislocations in Friedel oscillations” In Nature Nature Publishing Group, 2019, pp. 1–4
- [38] Yu Zhang, Ying Su and Lin He “Local Berry Phase Signatures of Bilayer Graphene in Intervalley Quantum Interference” In Phys. Rev. Lett. 125.11 American Physical Society, 2020, pp. 116804
- [39] Abhay Kumar Nayak, Jonathan Reiner, Raquel Queiroz, Huixia Fu, Chandra Shekhar, Binghai Yan, Claudia Felser, Nurit Avraham and Haim Beidenkopf “Resolving the topological classification of bismuth with topological defects” In Sci. Adv. 5.11, 2019, pp. eaax6996
Acknowledgement
The authors thank A. Stern and R. Quieroz for insightful discussions. N.A., H.B., and B.Y acknowledge the German–Israeli Foundation for Scientific Research and Development (GIF grant no. I-1364-303.7/2016). B.Y. acknowledges financial support by the Willner Family Leadership Institute for the Weizmann Institute of Science, the Benoziyo Endowment Fund for the Advancement of Science, the Ruth and Herman Albert Scholars Program for New Scientists, and the Israel Science Foundation (ISF 1251/19). T.P. acknowledges financial support from NSERC and FRQNT.
Author contribution
A.K.N. and J.R. acquired the data. A.K.N analyzed the data. A.K.N, N.A and H.B. conceived the experiments. H.T., H.F. and B.Y. calculated the ab initio model. H.L., and T.P. calculated the theoretical model. C.S. and C.F. grew the material. A.K.N., H.B., and N.A. wrote the manuscript with substantial contributions from all authors.
Competing interests
The authors declare no competing interests.
Supplementary Information for
Visualizing a Dirac cone in proximity to high-order van Hove singularities
S1 Additional QPI measurements
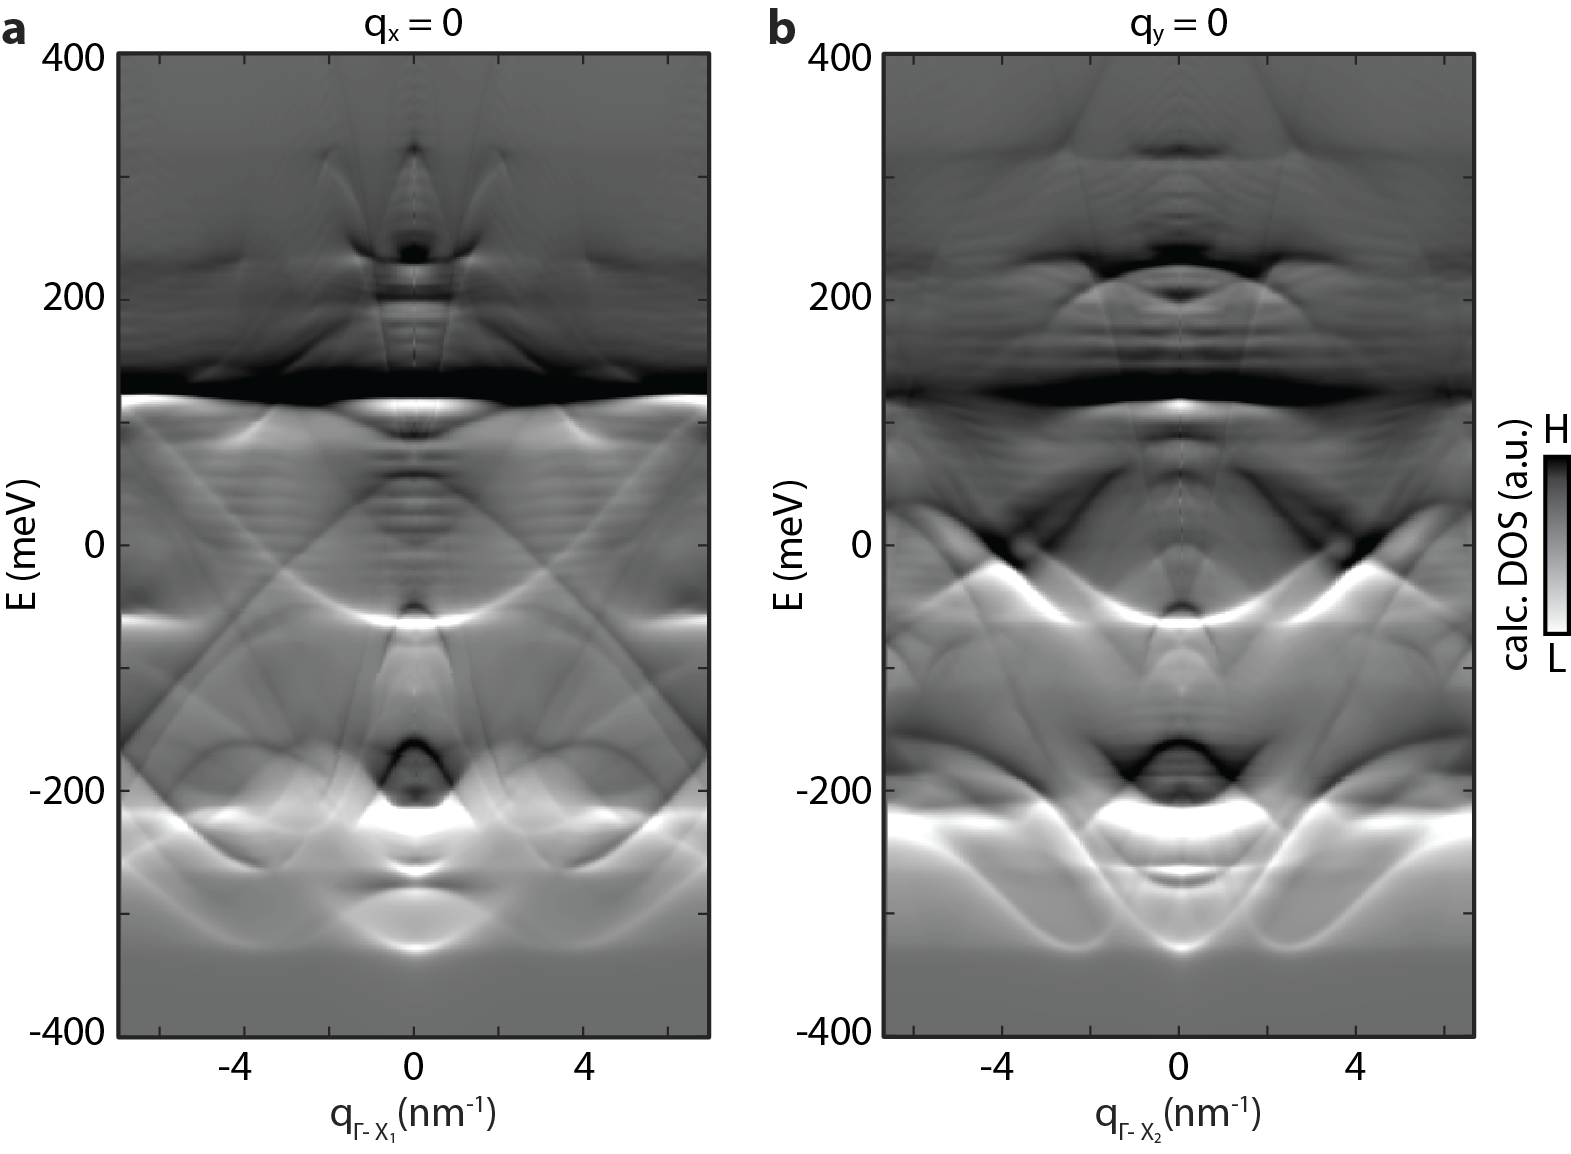
Similar QPI patterns were observed in the dI/dV measurements on two different samples as shown in Fig.S1 and S2, respectively. The dI/dV profile measured far from any defects and impurities on the (110) surface is shown in Fig.S1a. The measured profile shows the characteristic peak at meV. The dI/dV map measured perpendicular to a step edge (marked by black arrow) is shown in Fig.S1b. It has dispersing features emanating from the step edge and non-dispersing features associated with the surface band extrema and van Hove singularities. Fourier transform of the dI/dV map shows the evolution of several dispersing features. The magnitude and the phase of the Fourier transform is shown in Fig.S1c and d, respectively. Most of the features are well identified in the calculated QPI. The phase of the QPI pattern may reveal information related to the Berry curvature of the surface bands [37, 38]. However, here we use the phase as a means to clearly visualize the scattering processes. Similar QPI features can be seen in another measurement on a different sample, as shown in S2.
S2 Identification of scattering processes
The detailed scattering processes giving rise to the observed QPI patterns is presented in Fig.S3 and Fig.S4. Fig.S3a shows a high energy resolution QPI map of Bi(110) surface. We clearly identify the main scattering process observed in the QPI map as the intra-Dirac scattering along , as shown in Fig.S3b and c. Such scattering processes are not forbidden since it occurs across the same Dirac band with a finite overlap in their spin texture (Fig.S5). Similarly, more scattering process are identified in the large energy window QPI map, as shown in Fig.S4.
S3 Calculated QPI pattern
In order to calculate the QPI pattern we use the Born approximation which states that
| (1) |
In other words, the spatial modulations in the density of states at energy , is a consequence of scattering events due to the potential . When Fourier transformed, the local density of states is arranged according to the momentum transfer and hence it is a convolution of the Green’s function with itself. This convolution relates on-shell states with energy (where the Green’s functions are peaked) such that the initial and final momenta are separated by the vector .
In order to construct the Green’s functions we use the wavefunctions which are found by DFT to have the largest weight on the surface and write the retarded Green’s function as:
| (2) |
where goes over all relevant eigen modes, is its corresponding energy and is a small phenomenological broadening of the states. is a spinor whose direction is found by DFT.
S4 DOS of Bi(111)
The DOS measured on a prisitne Bi(111) surface is shown in Fig.S7a (more details in ref.[39]). It shows a characteristic peak at meV. This peak corresponds to the band extrema along the direction as shown in Fig.S7b. The DOS diverges logarithmically close to the peak due to ordinary van-Hove singularities (Fig.S7c-e). The topology of the Fermi surface undergoes a transition at the peak energy. This demonstrates the ability to distinguish ordinary and high-order van Hove singularities in dI/dV profiles.
S5 Calculated DOS on Bi(110)
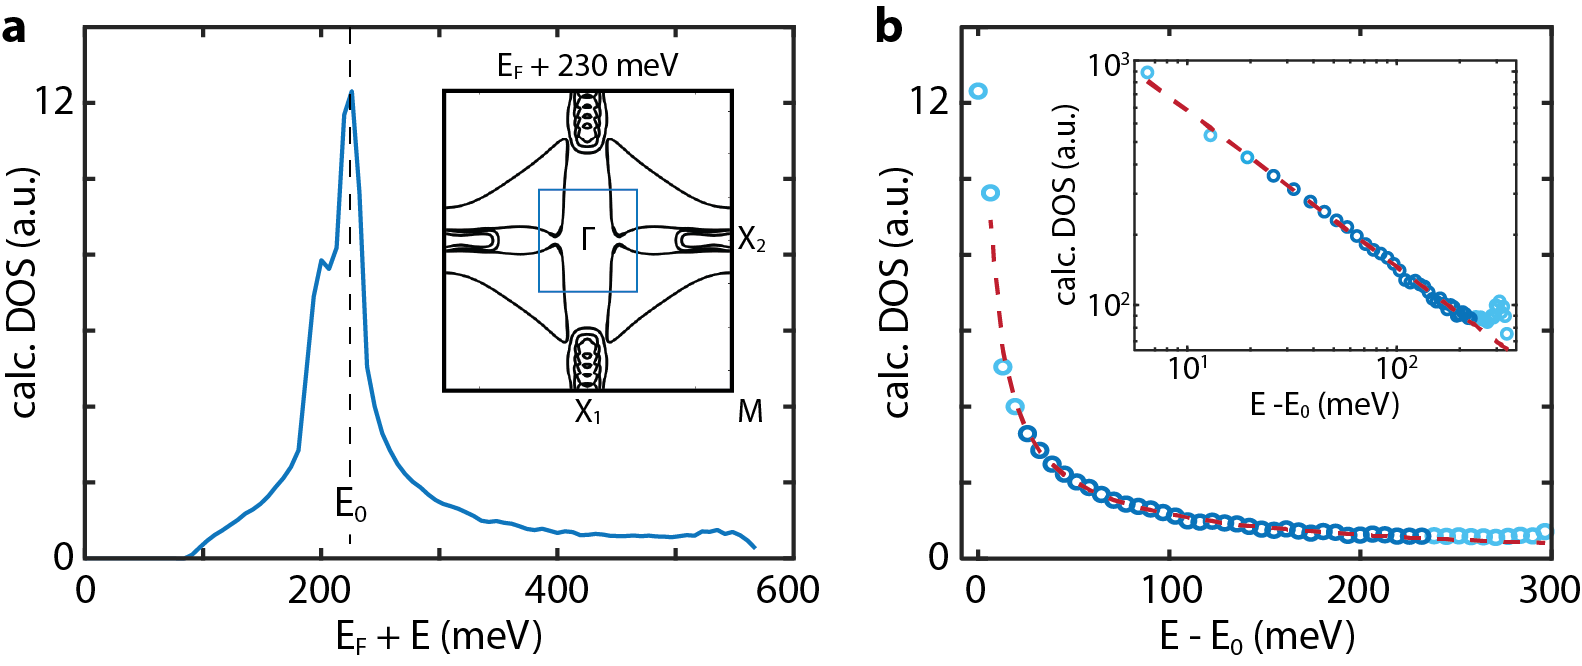
We extracted the total DOS from Density Functional Theory (DFT) calculated surface band structure. The calculated (calc.) DOS was integrated only over a region close to the point as shown in the inset of Fig.S8a. This region (marked by a blue box) includes the high-order van-Hove singularity close to the point. The calculated DOS to the right of the peak fits well to a power-law model as shown in Fig.S8b. The same data was plotted in log-log to unambiguously determine its power-law nature (inset Fig.Fig.S8b).
S6 Power-law divergent DOS
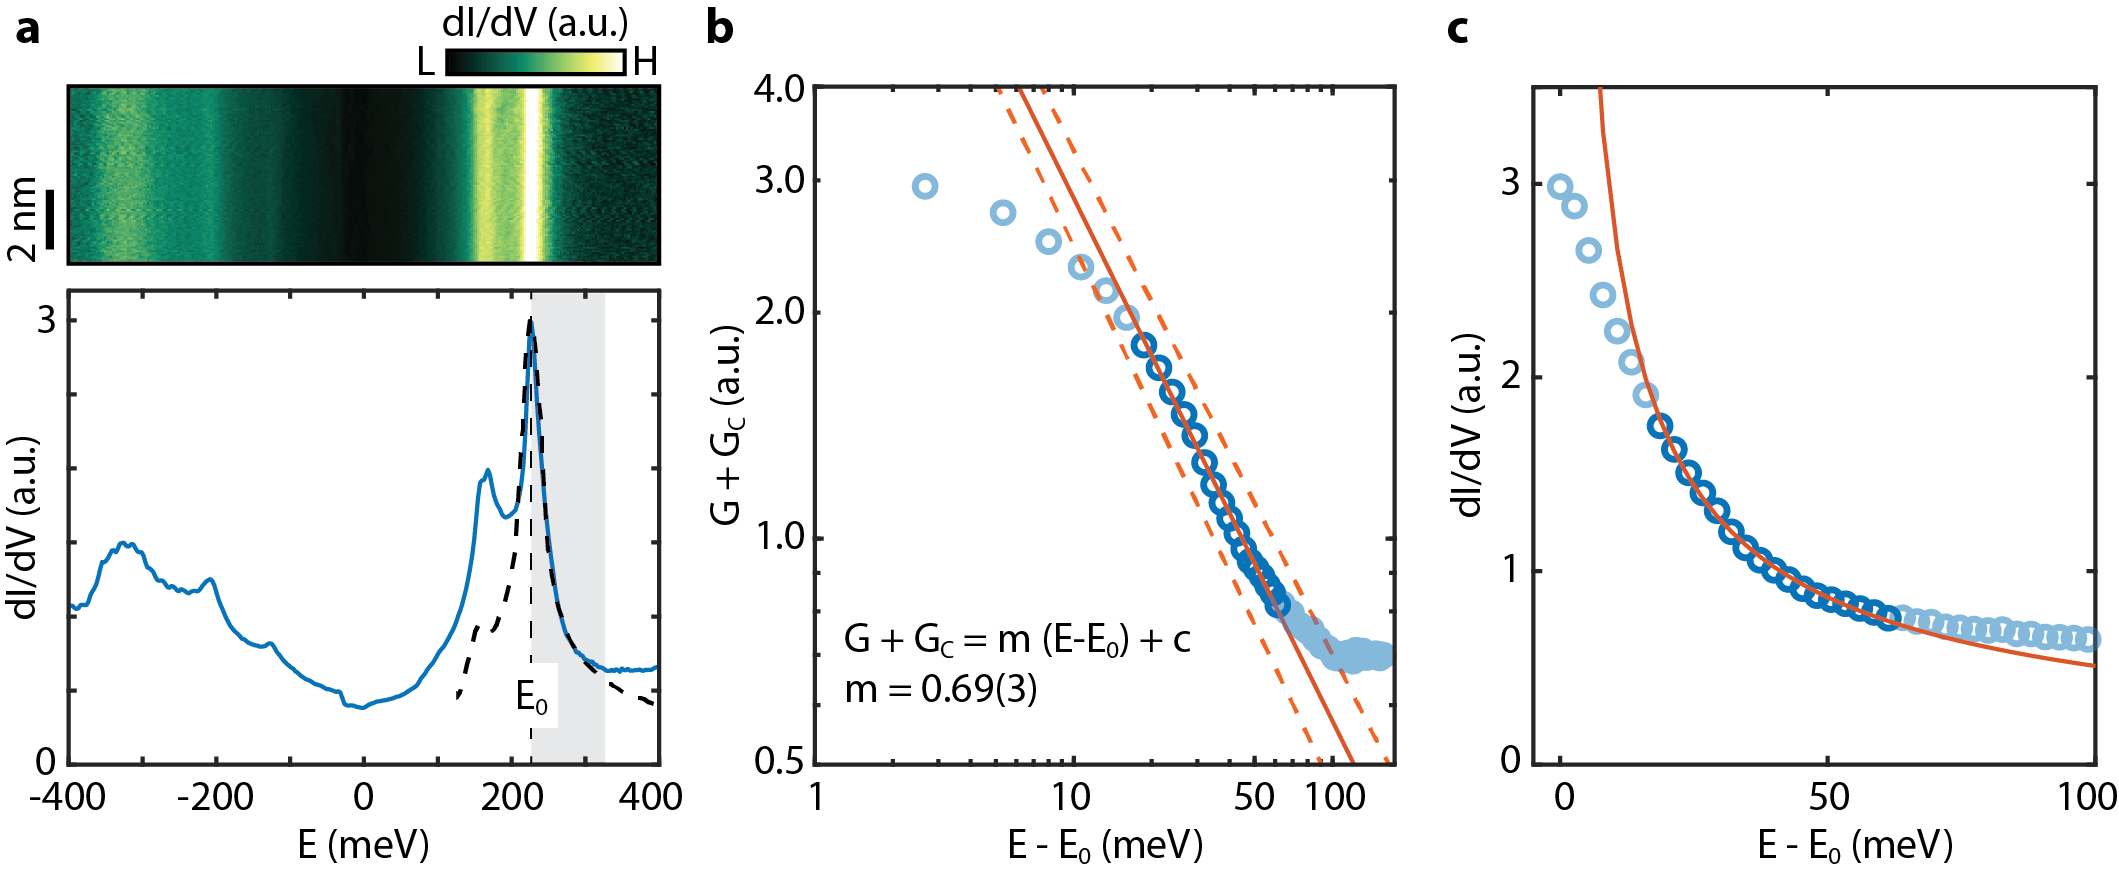
The power-law divergence in the density of states was carefully measured across measurements on different regions of the sample as shown in Fig.2 and S9. The spatially averaged dI/dV profile measured on the Bi(110) surface is shown in Fig.S9a (lower panel). The dI/dV profile was averaged over a clean region on the (110) terrace (upper panel Fig.S9a). The dI/dV profile shows a characteristic peak, marked by , corresponding to van Hove singularity in the surface band structure. The ab initio calculated total DOS (black dashed line), overlaid on the dI/dV profile, shows good agreement (see Fig.S8 for details). We examined the power-law behavior in the density of states in the shaded region of Fig.S9a.
First, we plot the dI/dV profile in log-log to clearly identify the linear regime (marked by dark blue circles in Fig.S9b). We fit this subset of the dI/dV profile (that is linear in log-log plot) to a power-law formula . This fit yields the following parameters: , , and . To accurately extract the slope from the log-log plot, we add the constant extracted from the power-law fit to the DOS in the log-log plot. Therefore, is equivalent to in Fig.S9b. Fitting a linear model, , to the log-log plot over the relevant energy window (marked by dark blue circles) yields the slope , consistent with the power-law fit. The dI/dV profile close to the peak ( meV) deviates from the power-law behavior, possibly due to instrumental broadening of the divergence.
S7 CCEs of Bi(110)
The contours of constant energy (CCE) calculated for the Bi(110) surface is shown in Fig.S10. The CCEs show the transition in the Fermi pockets known as Lifshtiz transition. The first saddle point appears along at meV and the second saddle point appears along at meV. The Dirac cone at merges with the pockets along (Fig.S10b) creating long straight segments in the CCE as shown in Fig.S10d. Subsequently, the long straight segments merge with the pockets along almost tangentially as shown in Fig.S10e.
Bismuth