Linked Data Science Powered by Knowledge Graphs [Technical Report]
Abstract.
In recent years, we have witnessed a growing interest in data science not only from academia but particularly from companies investing in data science platforms to analyze large amounts of data. In this process, a myriad of data science artifacts, such as datasets and pipeline scripts, are created. Yet, there has so far been no systematic attempt to holistically exploit the collected knowledge and experiences that are implicitly contained in the specification of these pipelines, e.g., compatible datasets, cleansing steps, ML algorithms, parameters, etc. Instead, data scientists still spend a considerable amount of their time trying to recover relevant information and experiences from colleagues, trial and error, lengthy exploration, etc. In this paper, we, therefore, propose a scalable system (KGLiDS) that employs machine learning to extract the semantics of data science pipelines and captures them in a knowledge graph, which can then be exploited to assist data scientists in various ways. This abstraction is the key to enabling Linked Data Science since it allows us to share the essence of pipelines between platforms, companies, and institutions without revealing critical internal information and instead focusing on the semantics of what is being processed and how. Our comprehensive evaluation uses thousands of datasets and more than thirteen thousand pipeline scripts extracted from data discovery benchmarks and the Kaggle portal and shows that KGLiDS significantly outperforms state-of-the-art systems on related tasks, such as dataset recommendation and pipeline classification.
1. Introduction
Data science is the process of collecting, cleaning, and analyzing structured and unstructured data to derive insights or to build models for predicting particular tasks. To achieve these goals, data science is founded on datasets and the pipelines built on top of them. In recent years, we have witnessed a growing interest in data science not only from academia but particularly from companies owning colossal amounts of data and investing in data science platforms to help develop and enhance pipelines analyzing these datasets for various tasks. Furthermore, open data science and collaborative portals, such as Kaggle (kag, 2022) and OpenML (Vanschoren et al., 2013), are expanding in popularity as well; the Kaggle portal, for instance, contains tens of thousands of open datasets and hundreds of thousands of associated data science pipelines (meta-kaggle, 2022). Despite the importance of efforts and their large-scale nature, existing systems do not offer a holistic approach but instead consider data science artifacts, e.g., datasets and pipeline scripts, only in isolation from each other; there is little or no support to help users learn from the experiences and best practices connecting datasets and pipelines.
A data scientist building a pipeline, for instance, is generally interested in datasets relevant to the task at hand, whether on open data portals or within their enterprise, as well as in previously built pipelines using these datasets. Integrating related datasets builds upon traditional approaches for data enrichment (e.g. by having more rows or columns) and data integrity checks, and allows not only to fulfill the initial task but can also enable a broader range of analyses by introducing additional dimensions and perspectives. The associated data science pipelines then allow the data scientist to benefit from the accumulated (public or enterprise) domain knowledge about the datasets, which helps accelerating the development and discovery of new solutions and possibilities. Unfortunately, existing portals and platforms have no or little support to assist data scientists in easily exploring and systematically discovering data science artifacts. Instead, existing platforms offer only isolated and limited support for dataset search or pipeline recommendation.
To overcome this lack of support and to allow for the understanding and maintenance of large repositories of pipelines, a number of techniques (Abdelaziz et al., 2021; Atzeni and Atzori, 2017; Jiomekong et al., 2019) has been proposed to provide machine-readable semantic abstractions of software code. However, the majority of these systems targets statically-typed languages like Java, where accurate static code analysis is feasible. However, the vast majority of data science pipelines is not written in Java but in Python, which makes these approaches inapplicable. For example, over 91% (553,000) of pipelines on Kaggle are written in Python according to the Meta Kaggle dataset. Moreover, even existing approaches for Python code (Abdelaziz et al., 2021) resort to using general-purpose static code analysis techniques although for a dynamic language, such as Python, accurate static analysis is challenging or even infeasible in some cases (Salis et al., 2021). Hence, there is a need for approaches tailored specifically to the requirements of data science pipelines in Python and their particularities.
Existing platforms, such as Google Dataset Search, or enterprise data catalog tools, such as Amundsen(Amundsen, 2022), offer a rudimentary form of searching for relevant datasets based on keyword matching. Hence, these systems do not allow discovering datasets based on certain characteristics or similar datasets given a sample or a complete dataset (Fernandez et al., 2018; Bogatu et al., 2020; Nargesian et al., 2018). Other state-of-the-art data discovery approaches, e.g., for measuring table relatedness (Zhang and Ives, 2020), identifying joinable (Zhu et al., 2019) or unionable (Nargesian et al., 2018) tables, work in isolation from each other and do not support discovery based on a combination of diverse features.
In conclusion, although some techniques have been proposed for dataset and pipeline discovery, they (i) have been studied in isolation, (ii) come with several shortcomings, and (iii) have not been integrated in existing platforms that can be used in practice. In this paper, we therefore propose KGLiDS, a fully-fledged platform powered by knowledge graphs capturing the semantics of data science artifacts, incl. both datasets and pipelines as well as their interconnections. To the best of our knowledge, KGLiDS is the first system to encapsulate both aspects of data science in a single representation. In summary, the contributions of this paper are:
-
•
The first platform to enable Linked Data Science111 The KGLiDS repository, technical report, ontology, and datasets can be accessed at https://github.com/CoDS-GCS/kglids.
-
•
Capturing the semantics related to data science from pipeline scripts at scale with specific support for Python.
-
•
Scalable deep learning-based data profiling techniques and fine-grained type inference methods to construct a global representation of datasets.
-
•
A comprehensive evaluation using thousands of datasets and more than thirteen thousand pipeline scripts extracted from data discovery benchmarks and Kaggle – showing the superiority of KGLiDS over the state of the art.
The remainder of this paper is organized as follows. Section 2 provides an architecture overview of KGLiDS. Section 3 describes our knowledge graph construction process. Section 4 highlights the KGLiDS interfaces. Section 5 discusses the results of our comprehensive evaluation. Sections 6 and 7 present related work and conclusion.
2. KGLiDS and Linked Data Science
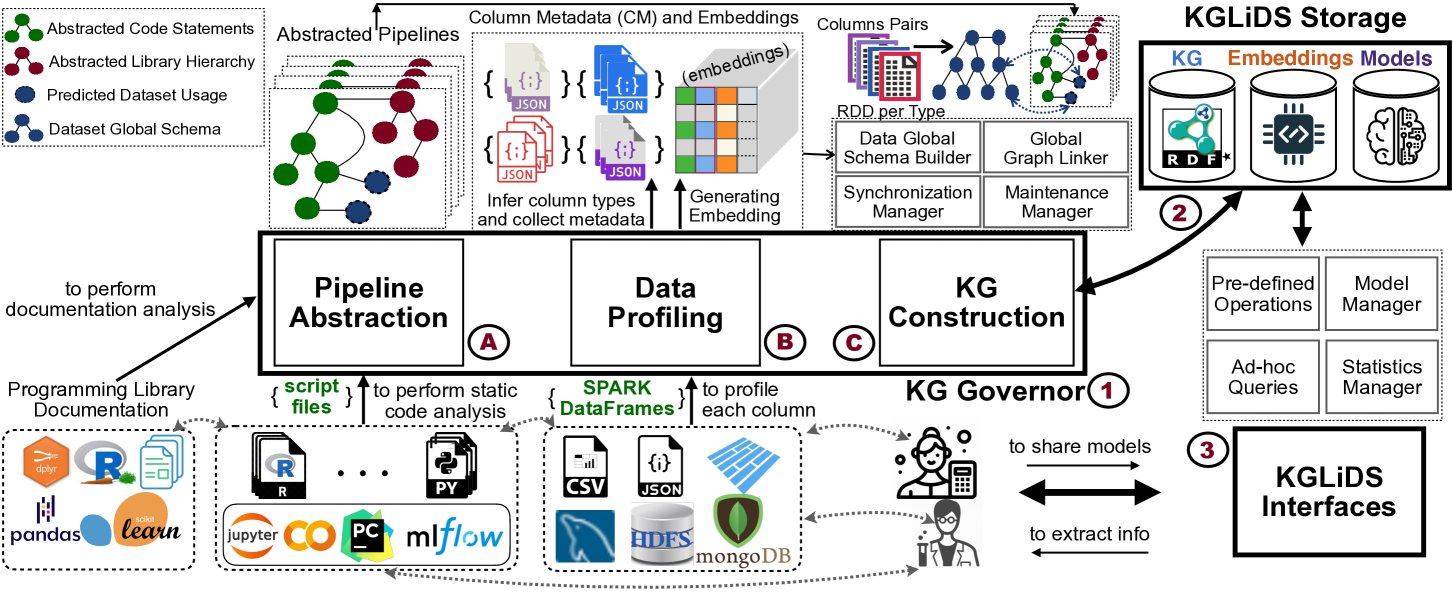
The architecture of KGLiDS is illustrated in Figure 1. The main components are: (1) KG Governor, which is responsible for creating, maintaining, and synchronizing the KGLiDS knowledge graph with the covered data science artifacts, pipelines, and datasets, (2) KGLiDS Storage, which stores the constructed knowledge graphs as well as embeddings and ML models, (3) KGLiDS Interfaces, which allows a diverse range of users to interact with KGLiDS to extract information or share their findings with the community.
2.1. The KG Governor and Data Science Artifacts
KGLiDS captures semantics of data science artifacts, i.e., pipelines and their associated datasets, by applying novel methods for pipeline abstraction and data profiling. During bootstrapping, KGLiDS is deployed by enabling the KG Govenor to profile the local datasets and abstract pipeline scripts to construct a knowledge graph as illustrated in Figure 1. The KG Governor consists of: (A) Pipeline Abstraction, which captures semantics of pipelines by analyzing pipeline scripts, programming libraries documentation, and usage of datasets, (B) Data Profiling, which collects metadata and learns representations of datasets including columns and tables, and (C) Knowledge Graph Construction, which builds and maintains the LiDS graph and embeddings. In KG Construction, the Global Graph Linker performs link prediction between nodes, e.g., linking a table used in a pipeline and exists in a dataset.
KGLiDS adopts embedding-based methods to predict relationships among data items and utilizes MapReduce algorithms to guarantee a scalable approach for constructing the graph from large growing datasets and pipelines. KGLiDS is not a static platform; as more datasets and pipelines are added, KGLiDS continuously and incrementally maintains the LiDS graph. To avoid having to run the prediction every time a user wants to use the system, predictions are materialized and the resulting nodes and edges annotated with a prediction score expressing the degree of confidence in the prediction.
The Linked Data Science (LiDS) ontology. To store the created knowledge graph in a standardized and well-structured way, we developed an ontology for linked data science: the LiDS ontology. Its main types of nodes (classes) are: datasets (with related nodes representing datasets, tables, and columns), libraries, and pipeline scripts (with related nodes describing statements). The LiDS ontology conceptualizes the data, pipeline, and library entities in data science platforms, as illustrated in Figure 2. The ontology is specified in the Web Ontology Language (OWL 2) and has 13 classes, 19 object properties, and 22 data properties. OWL was chosen as a standard because of its integral support of interoperability and sharing data on the Web and across platforms. The URIs of classes and properties (relationships) have the prefix http://kglids.org/ontology/, while data instances (resources) have the prefix http://kglids.org/resource/. For example, a column Age in a table train.csv of the titanic dataset has the URI http://kglids.org/resource/kaggle/titanic/train.csv/Age. Similarly, libraries are identified by unique URIs such as http://kglids.org/resource/library/sklearn/svm/SVC.
The Linked Data Science (LiDS) graph. We refer to the graph populating the ontology with instances of the classes as the LiDS graph. Using the RDF standard (Klyne et al., 2014) , KGLiDS captures and describes the relationships among these entities and uses Uniform Resource Identifiers (URIs) for nodes and edges in the LiDS graph so that the graph can easily be published and shared on the Web. All entities are associated with an RDF label and RDF type to facilitate RDF reasoning on top of the LiDS graph. Example object properties include column similarity relationships: http://kglids.org/ontology/data/hasLabelSimilarity, and data flow between pipeline statements: http://kglids.org/ontology/pipeline/hasDataFlowTo, while data properties include statement parameters: http://kglids.org/ontology/pipeline/hasParameter.
2.2. The KGLiDS Storage and Interfaces
KGLiDS maintains different types of information, namely the LiDS graph, the generated embeddings for columns and tables, and the machine learning models for different use cases. The current implementation of KGLiDS adopts the RDF model to manage the LiDS graph and uses Stardog as storage engine (Engine, 2022). KGLiDS uses RDF-based knowledge graph technology because (i) it already includes the formalization of rules and metadata using a controlled vocabulary for the labels in the graphs ensuring interoperability (Villazón-Terrazas et al., 2017; Galárraga et al., 2013), (ii) it has built-in notions of modularity in the form of named graphs, for instance, each pipeline is abstracted in its own named graph (Carroll et al., 2005), and (iii) it is schema-agnostic, allowing the platform to support reasoning and semantic manipulation, e.g., adding new labeled edges between equivalent artifacts, as the platform evolves (Zheng et al., 2016; Bursztyn et al., 2015; Galárraga et al., 2015), and (iv) it has a powerful query language (SPARQL) to support federated query processing (Abdelaziz et al., 2017; Montoya et al., 2017; Schwarte et al., 2011). In extension, KGLiDS uses the RDF-star (Hartig, 2019) model, which supports annotating edges between nodes with metadata, which enables us, for instance, to capture the similarity scores for similarity edges between column nodes of datasets.

KGLiDS uses an embedding store, i.e., Faiss (Johnson et al., 2021), to index the generated embeddings and enable several methods for similarity search based on approximate nearest neighbor operations on both CPU and GPU. This allows users to query the LiDS graph based on the embeddings associated with graph nodes. Finally, KGLiDS also stores the ML models developed on top of the LiDS graph.
The KGLiDS portal supports access restrictions to prevent unauthorized users or could be public for anyone. Authorized users have access to query the LiDS graph or embeddings. However, accessing the actual data files in an enterprise may need another level of authorization. A broad range of users with different technical backgrounds can use and benefit from KGLiDS, which provides a simplified interface for non-technical users where pre-configured operations are available, as well as an interface for experts that allows, for instance, editing parameters or formulating ad-hoc queries against the LiDS graph to discover data items and pipelines. Interoperability with other tools was one of KGLiDS’s design goals. Hence, KGLiDS, for instance, exports query results as Pandas DataFrame, a widely used format in data science (Petersohn, 2021).
3. The KGLiDS Governor
The core component of the KGLiDS platform is the KG Governor, which captures the semantics of datasets, associated data science pipelines, and programming libraries to construct (i) pipeline graphs, e.g., each pipeline script is abstracted and stored in a separate named graph, (ii) a library graph for all programming libraries used by the abstracted pipelines, and (iii) a dataset graph, i.e., a global schema for datasets accessible by KGLiDS. For pipeline and library graphs, KGLiDS performs static code analysis combined with documentation and dataset usage analysis to naturally interlink a pipeline graph into the dataset and library graphs. For the dataset graph, KGLiDS starts by profiling the datasets at the granularity of columns and then predicts links between columns.
3.1. Pipeline Abstraction
A data science pipeline, i.e., code or script, performs one or more data science tasks, e.g., data analysis, visualization, or modelling. The pipeline could be abstracted as a control flow graph, in which code statements are nodes and edges are a flow of instruction or data. The objective of pipeline abstraction is to have a language-independent representation of the pipeline semantics, such as code and data flow within a pipeline, invocations of built-in or third-party libraries, and parameters used in such invocations. This information can be obtained using dynamic or static program analysis.
Dynamic vs. Static Code Analysis
Dynamic analysis involves the execution of a pipeline and examining the memory traces of each statement at run time. Thus, it is more detailed and accurate but does not scale. This is because executing a pipeline is costly in terms of time and memory. It also involves setting up the runtime environment, which is not always possible due to, for example, deprecated libraries. In contrast, static code analysis is less accurate, especially for dynamic languages, such as Python and R. However, it scales well to thousands of pipelines as no pipeline execution is required. To overcome these limitations, KGLiDS combines static code analysis with library documentation and dataset usage analyses to have a rich semantic abstraction that captures the essential concepts in data science pipelines. Algorithm 1 is the pseudocode of our Pipeline Abstraction algorithm. The main inputs of Algorithm 1 are a dataset , where is a pipeline script, metadata of pipelines, such as information of datasets used in the pipeline, pipeline author, and its score, and documentations of programming libraries. The algorithm also maintains the library graph for the used libraries and a named graph for each pipeline (lines 2 to 3). Our algorithm decomposes the pipeline abstraction into a set of independent jobs (line 5), where each job is to generate an abstracted graph (named graph) per a pipeline script (line 19).
Static Code Analysis
Algorithm 1 applies static code analysis per (line 7). KGLiDS utilizes the lightweight static code analysis tools, which are natively supported by several programming languages, such as Python (via, for instance ast and astor) or R (via, for instance, CodeDepends). Each statement corresponds to a variable assignment or a method call. If there are multiple calls in a single line, they will correspond to multiple statements. For each statement, we store the following: i) code flow, i.e., the order of execution of statements, ii) data flow, i.e., subsequent statements that read or manipulate the same data variable, and iii) Control flow type, i.e., whether the statement occurs in a loop, a conditional, an import, or a user-defined function block, which captures the semantics of how a statement is executed, and iv) statement text, i.e., the raw text of the statement as it appears in the pipeline. We discard from our analysis statements that have no significance in the pipeline semantics, such as print(), DataFrame.head(), and summary().
Documentation Analysis
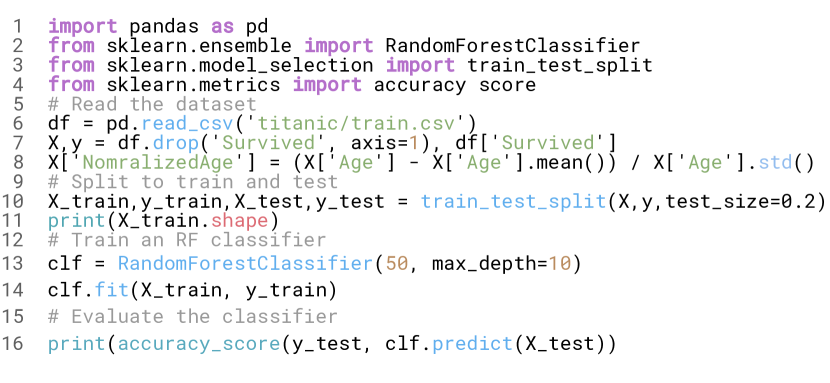
Static analysis is not sufficient to capture all semantics of a pipeline. For instance, it cannot detect that pd.read_csv() in line 6 in Figure 3 returns a Pandas DataFrame object. In Algorithm 1, we enrich the static program analysis using the documentation of data science libraries (lines 8 to 13). Each statement from static program analysis is enriched by the library it calls, names and values of parameters, including implicit and default ones, and data types of return variables. For each class and method in the documentation, we build a JSON document containing the names, values, and data types of input parameters, including default parameters, as well as their return data types. This analysis enables accurate data type detection for library calls. It also allows the inference of names of implicit call parameters, such as n_estimators, the first parameter in line 13 in Figure 3. A useful by-product of documentation analysis is the library graph, indicating methods belonging to classes, sub-packages, etc. (shown in red in Figure 2). This is useful for deriving exciting insights related to data science programming languages. For example, it helps find which libraries are used more frequently than others. KGLiDS, enable retrieving this kind of insight via queries against the LiDS graph.
Predicting Dataset Usage
The critical aspect of our LiDS graph is the realization of connections between pipeline statements and the tables or columns used by the pipeline. These connections enable the novel use-cases of linked data science platforms In KGLiDS, we build these links in two phases. First, Algorithm 1 applies dataset usage analysis to predict such cases and adds a node of the Predicted Dataset Usage (lines 14 to 18). If statement reads a table via pandas.read_csv (e.g. line 7 in Figure 3) or a column via string indices over DataFrames (e.g. line 8 in Figure 3), such tables or columns are predicted as potential reads of actual data. Second, when constructing the knowledge graph, these predicted nodes are later verified by the Graph Linker against the Data Global Schema of the corresponding dataset.
3.2. Data Profiling
KGLiDS profiles datasets to learn representations (embeddings) of columns and tables, then generates fixed-size and dense embeddings based on their content (e.g., column values) and semantics (e.g., table or column names). Moreover, our profiler collects statistics and classifies columns into 7 fine-grained types using our data type inference module. Inspired by (Mueller and Smola, 2019), we developed a deep learning model to generate column learned representations (CoLR) based on their content. For embeddings based on label semantics, i.e., column names, we developed a method based on Word Embeddings (Goikoetxea et al., 2016). KGLiDS analyzes datasets at the level of individual columns. We developed KGLiDS to profile datasets at scale. This is achieved through two main steps: (i) using CoLR to get fixed-size embeddings per column and (ii) performing a pairwise comparison between columns of the same type. Our data profiling is developed using PySpark to enable distributed computation. Moreover, KGLiDS handles files of different formats, such as CSV and JSON, and connects to relational DB and NoSQL systems. Algorithm 2 is the pseudocode of our data profiling algorithm. It receives: (i) a dataset consisting of one or more tables, (ii) a set of CoLR models to generate embeddings of columns the fine-grained data types, and (iii) an NER model and a set of word embeddings and to predict fine-grained types. In Algorithm 2, tables are broken down into a set of columns. Then, KGLiDS uses Spark to generate a column profile (JSON) per column (lines 2 and 3).
Data Type Inference
KGLiDS predicts similarities between columns across tables by performing a pairwise comparison between embeddings of columns having the same fine-grained type – this helps reduce the cost of constructing the dataset graph. KGLiDS infers for each column (line 6) a fine-grained data type out of 7 types, namely: integers, floats, booleans, dates, named entities (e.g. names of persons, locations, languages), natural language texts (e.g. product reviews, comments), and generic strings that do not fall into the previous categories (e.g. postal codes, IDs). Named entities are predicted using a named entity recognition (NER) model (Peters et al., 2017), while natural language texts are predicted based on the existence of corresponding word embeddings for the tokens. Having fine-grained types dramatically reduces the number of false positives in column similarity prediction, as these similarities are predicted only between columns of the same fine-grained type.
Dataset Embeddings
The data profiling component generates a column learned representation (CoLR) for each column based on its fine-grained type and actual values using our pre-trained embedding models. The CoLR models capture similarities between column values and provide three main advantages to KGLiDS. First, higher accuracy of predicted column content similarities in contrast to hand-crafted meta-features, which have been shown to fail when a column distribution does not match the designed features (Mueller and Smola, 2019; Hulsebos et al., 2019). Second, enabling data discovery without exposing datasets’ raw content is invaluable in an enterprise setting, where access to the raw data might be restricted. Third, a compact representation of fixed-size embeddings, regardless of the actual dataset size, greatly reduces the storage requirements.
Two columns have similar embeddings if their raw values have high overlap, have similar distributions, or measure the same variable – even with different distributions (e.g. area_sq_ft is similar to area_sq_m). To generate a column embedding, a neural network is applied to each value and averaged for the entire column (lines 8-10). We trained on a collection of 5,500 tables from Kaggle (kag, 2022) and OpenML (Vanschoren et al., 2013), where the input is a pair of columns and whether they are similar (binary target variable) using the binary cross-entropy loss (Good, 1952). In KGLiDS, the embedding of a table is the concatenation of aggregated column embeddings per fine-grained data type:
| (1) |
where is the number of columns in with the fine-grained type . Similarly, an embedding of a dataset is an aggregation of its tables’ embeddings. The Data Profiling stores the generated embeddings in the embedding store. For simplicity, we do not show the generation of the table’s embeddings. Algorithm 2 generates a column’s profile containing the predicted fine-grained type fgt, the generated embeddings , the column statistics , and metadata and dumps it as a JSON document (lines 11 and 12). Algorithm 2 is designed to work with independent tasks at two levels. First, the dataset is decomposed into independent tables. Second, each table is decomposed into a set of columns, where most computations are done. This design profiles datasets at scale.
3.3. The KG Construction
This section highlights the dataset graph construction and interlinking it with the pipeline graphs. The LiDS graph is maintained as a Web-accessible graph based on our ontology.
Data Global Schema
Algorithm 3 illustrates the pseudocode of our algorithm to construct the dataset graph. The algorithm receives a set of column profiles and a set of similarity thresholds. Each profile contains the predicted fine-grained type , the generated embeddings , the column statistics , and metadata , which are generated by Algorithm 2. First, Algorithm 3 constructs a metadata subgraph, which contains the hierarchy structure of the datasets and statistics collected for each column. Next, the similarity relationships are checked between all possible column pairs having the same fine-grained data type and exist in different tables. Algorithm 3 distributes the processing of the pairwise comparisons in a MapReduce fashion (lines 9 to 19).
Each worker takes a pair of profiles and generates the similarity edges, i.e., predicates, between them. Two columns have similarity relationships if they have higher similarity scores than the predefined thresholds for the following similarities: (i) label similarity: exists between columns that have similar column names based on GloVe Word embeddings (Pennington et al., 2014) and a semantic similarity technique (Goikoetxea et al., 2016) (lines 11-12). (ii) content similarity exists between columns that have similar raw values. For all fine-grained types except booleans, content similarity is based on the cosine distance between their column embeddings (lines 16-18), while for booleans, it is based on the difference in true ratio, i.e., the percentage of values that equal True (lines 13-15). Finally, the dataset graph is constructed (lines 21 to 24). KGLiDS utilizes the predicted relationships between columns to identify unionable and joinable tables. Two tables are unionable or joinable if one or more of their columns have high label or content similarity relationships, respectively. The similarity score between two tables is based on both the number of similar columns and the similarity scores between them.
Graph Linker
In pipeline abstraction, the dataset usage analysis predicts potential columns or tables read by statements based on predefined heuristics. However, not all predicted columns or tables exist in the dataset. For instance, the column NormalizedAge in line 8 in Figure 3 is added by the user and does not exist in the data global schema. The graph linker verifies the predicted tables and columns against the global schema. Therefore, pipelines that read the same table or column are linked together in the global graph.
4. The KGLiDS Interfaces
The primary users of KGLiDS are data scientists in an open or enterprise setting whose objective is to derive insights from their datasets, construct pipelines, and share their results with other users. To achieve this goal, KGLiDS offers a number of interfaces (see component 3 in Figure 1). Our interfaces include a set of Pre-defined Operations, Ad-hoc Queries enabling users to query the raw LiDS graph directly. In addition, the Statistics Manager helps collect and manage statistics about the system and the LiDS graph. Finally, the Model Manager enables data scientists to run analyses and train models directly on the LiDS graph to derive insights.
We developed the KGLiDS Interfaces library as a Python package that provides simple API interfaces222a Colab notebook demonstrating the KGLiDS APIs is available at https://colab.research.google.com/drive/1XbjJkppz5_nTufgnD53gEBzxyLYViGAi, allowing users to directly access the KGLiDS storage. We designed these APIs to formulate the query results as a Pandas Dataframe, which Python libraries widely support. Thus, data scientists can use our APIs interactively or programmatically while writing their pipeline scripts via Jupyter Notebook or any Python-based data science platform. Due to limited space, the remainder of this section focuses on pre-defined operations.
Let us consider a scenario where a data scientist is interested in predicting heart failure in patients and illustrate how KGLiDS’s pre-defined operations can help achieve this goal.
Search Tables Based on Specific Columns. To get started, the data scientist would like to find relevant datasets using keyword search, the following operation supports this:
table_info = search_keywords([[’heart’,
’disease’], ’patients’]])
KGLiDS will then perform a search in LiDS using the conditions that are passed by the user who has the possibility to express conjunctive (AND) and disjunctive conditions (OR) using nested lists. In the example above ‘heart’ and ‘disease’ are conjunctive and ‘patients’ is a disjunctive condition. Let us assume the data scientist has found the following two datasets of interest: heart-failure-prediction, heart-failure-clinical-data.
Discover Unionable Columns. In the next step, let us assume that the data scientist would like to combine the two tables into one. Since it is very unlikely that the two tables in our example come with exactly the same schema, the data scientist is seeking assistance to identify matching (unionable) columns expressing the same information. KGLiDS provides support to automatically recommend a schema for the merged table containing all columns from both input tables that can be matched (unionable columns). The output will be a Pandas DataFrame. This can be expressed as:
find_unionable_columns(table_info.iloc[0],
table_info.iloc[1]) Join Path Discovery. Let us now assume that the data scientist would like to join the obtained table with a table from another dataset to obtain a richer set of features for downstream tasks. Let us further assume that the table is not directly joinable. Hence, KGLiDS suggests intermediate tables (restricted to a join path with 2 hops in our example) and displays the potential join paths. This is done by computing an embedding of the given DataFrame (df), finding the most similar table in the LiDS graph, and determining potential join paths to the given target table. This could be expressed as follows:
get_path_to_table(table_info.iloc[0],
hops=2)KGLiDS also supports more challenging variations, such as identifying the shortest path between two given tables.
Library Discovery. Before switching to the machine learning phase of their pipeline, the data scientist would like to have a look at the most used libraries by their fellow users. The library graph of KGLiDS can be utilized to retrieve the number of unique pipelines calling a specific library. This can be expressed as:
get_top_k_library_used(k: int)
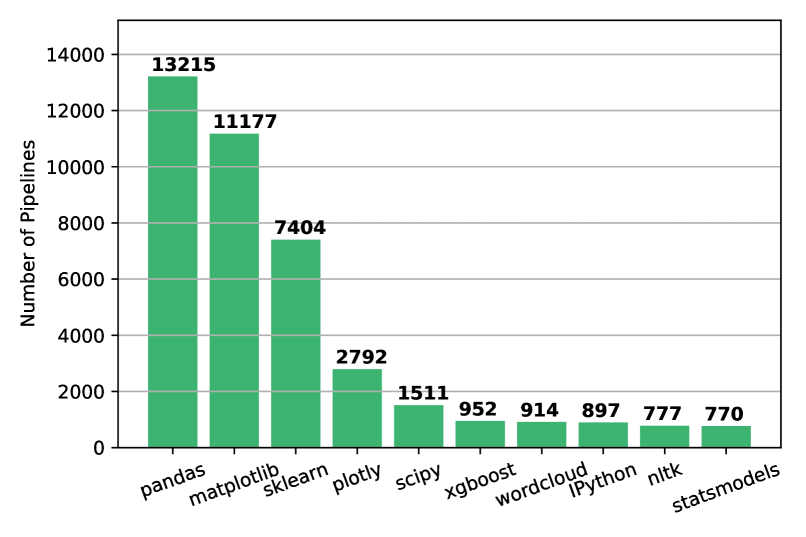
where is the number of libraries. KGLiDS also plots the corresponding bar chart with the top-k used libraries in all the pipelines (see Figure 4). Data scientists can quickly get statistics about different data science artifacts, i.e., used libraries. As the data scientist wishes to predict heart failure and is not an expert in building ML pipelines, KGLiDS assists the data scientist by providing a way to become familiar with the most used libraries in ML pipelines for a specific task, classification in this case. This can be expressed as follows:
get_top_used_libraries(k=10,
task=’classification’)
Pipeline Discovery. After reading more about some of the most used libraries (namely, Pandas, Scikit-learn, and XGBoost), the data scientist is interested to see example pipelines where the following components are used: pandas.read_csv, XGBoost.XGBClassifier, and sklearn.f1_score. This can be expressed as:
get_pipelines_calling_libraries( ’pandas.read_csv’, ’xgboost.XGBClassifier’, ’sklearn.metrics.f1_score’)KGLiDS returns a DataFrame containing a list of pipelines matching the criteria along with other important metadata.
Transformation Recommendation. Before training a model, its important to perform the necessary pre-processing and transformations. For the same KGLiDS offers a function to recommend transformations for a given dataset. The data scientist in our example can make use of this function as follows:
recommend_transformations( dataset=’heart-failure-prediction’)KGLiDS returns the set of transformations that could be applied on the given dataset such as sklearn’s MinMaxScaler, OneHotEncoder etc. Based on these recommendations the data scientist can then easily transform their data to generate a much more representative dataset for model building.
Classifier Recommendation. Afterwards, the data scientist needs to decide which classification model to use and would like to retrieve suggestions:
model_info = recommend_ml_models(
dataset=’heart-failure-prediction’, task=’classification’)
KGLiDS returns a dataframe with the list of all classifiers that have been used for the given dataset along with their score to assist the data scientist in finalizing the model training.
Hyperparameter Recommendation. In the final step, the data scientist would like KGLiDS to provide help with finding a promising configuration for the hyperparameters of the chosen classifier. This can be expressed as follows:
recommend_hyperparameters( model_info.iloc[0])
The data scientist can use the configuration values of recommend_hyperparameters to train a model based on the seen ones. This enables hyperparameter optimization with ease based on the best practices adopted in thousands of pipelines.
5. Experimental Evaluation
| Modelled Aspect | KGLiDS | GraphGen4Code | Description | ||
| Library call | 507.3 | 03.0% | 15,272 | 15.6% | Calls to external or built-in APIs e.g. sklearn.ensemble.RandomForest(). |
| Code flow | 2,106.9 | 12.7% | 20,304 | 20.8% | Order of execution of code statements. |
| Data flow | 1,269.5 | 07.6% | 13,295 | 13.6% | Order of usage of the same data variables (e.g. DataFrame) by code statements. |
| RDF node types | 2,546.7 | 15.3% | - | - | Indicate the RDF type of each node e.g. Statement or Column. |
| Control flow type | 808.8 | 04.9% | 1,124 | 01.2% | Special types of code execution e.g. imports, loops, and if-else. |
| Column reads | 3,516.5 | 21.1% | 1,997 | 02.0% | Column(s) in the data global schema read by each statement. |
| Dataset reads | 26.2 | 00.2% | - | - | Table in the data global schema read by a statement e.g. using pd.read_csv(). |
| Function parameters | 3,719.6 | 22.4% | 7,511 | 07.7% | Names and values of inferred function parameters (for library calls). |
| Library hierarchy | 18.1 | 00.1% | - | - | Hierarchy of library components e.g. sum() part of DataFrame part of pandas. |
| Statement text | 2,120.7 | 12.7% | 7,944 | 08.1% | The raw text of a code statement e.g. ”x = 1”. |
| Statement location | - | - | 3,972 | 04.1% | Starting and ending line and column numbers of statement in the script file. |
| Variable names | - | - | 987 | 01.0% | Name of the variable in an assignment e.g. ”idx” for the statement: idx = 0. |
| Function parameter order | - | - | 25,133 | 25.8% | The order of each function parameter (for library calls). |
| Total | 16,640.4 | 97,538 | |||
To empirically evaluate KGLiDS, and because there is no holistic system combining programming scripts and data discovery, we compared against related systems that capture the semantics of code or support data discovery. We compare the performance of KGLiDS’s components to these systems and analyze the quality of modelling different tasks on top of our LiDS graph.
Compared Systems. We evaluated KGLiDS in terms of pipelines abstraction against GraphGen4Code (Abdelaziz et al., 2021), a toolkit to generate a knowledge graph for code 333GrapGen4Code is obtained from https://github.com/wala/graph4code. For data discovery, we evaluated KGLiDS against SANTOS (Khatiwada et al., 2023), (Bogatu et al., 2020), and Aurum (Fernandez et al., 2018), which utilize diverse techniques for discovering tables in data lakes.
Pipeline Scripts and Datasets. From Kaggle 444The script to download these datasets is available at KGLiDS’s repository we collected 13,800 data science pipeline scripts used in the top 1000 datasets, which includes 3,775 tables and 141,704 columns. We selected these pipelines and datasets based on the number of users’ votes on the Kaggle platform. For each dataset, we select up to 20 most voted Python pipelines. The datasets are related to various supervised and unsupervised tasks in different domains, such as health, economics, games, and product reviews. The pipeline scripts have different categories of pipelines, such as pure data exploration and analysis (EDA), and machine learning modelling. We also used the real-world benchmarks provided by SANTOS and , namely SANTOS Small, SANTOS Large555https://github.com/northeastern-datalab/santos, and Small666https://github.com/alex-bogatu/DataSpiders, which are collections real tables from various open data portals covering multiple domains fields.
RDF Engines and Computing Infrastructure. We used Stardog version 8.0.0 as SPARQL engine to store the LiDS graph. We deployed the endpoint, KGLiDS, and GrapGen4Code on the same local machine. We used two different settings for our experiments. In the first setting, we used a Linux machine with 16 cores and 90GB of RAM. In the second setting, we used a SPARK cluster of 16 machines; each with 64 GB RAM and 16 cores to construct our dataset graphs. Unlike KGLiDS, none of the other systems are distributed, i.e., do not scale up with multiple machines. Therefore, we used this configuration to evaluate the scalability of KGLiDS.
5.1. Pipeline Graphs: Abstraction and Usability
We compared KGLiDS to GraphGen4Code (Abdelaziz et al., 2021) using the 13,800 Kaggle pipelines. Our comparison focused on pipeline abstraction and the usability of abstracted pipelines.
5.1.1. Semantic Pipeline Abstraction.
For this set of pipelines, KGLiDS consumed 11.4 minutes to generate our LiDS graph, which contains 16.6M triples. GraphGen4Code consumed 2,255.4 minutes to generate a graph of 97M triples for the same set of pipelines. In GraphGen4Code, the focus is abstracting semantics from general code of programs. Thus, GraphGen4Code captures unnecessary semantics from pipeline scripts. Unlike GraphGen4Code, KGLiDS captures semantics related only to data science. Comparing with GraphGen4Code, KGLiDS achieved a graph reduction of more than 82% and even captured semantics, which GraphGen4Code did not manage to capture, as shown in Table 1. For example, capturing semantics related to statement location, variable names, or function’s parameter order is irrelevant to pipeline automation or discovery. In contrast, capturing semantics related to datasets, such as dataset reads, or libraries, such as library hierarchy, is essential for automating data science pipelines, such as discovering pipelines for similar datasets and highly effective libraries.
5.1.2. KGLiDS Usability: Data Preprocessing Support.
The LiDS graph models the relationships between data science artifacts like datasets, pipeline scripts, and libraries, which enables several opportunities to automate tasks in data science. This automation is not straightforward when using systems like GraphGen4Code that miss the interaction between these artifacts (see Table 1). For instance, consider automating the task of data preparation, which anecdotally consumes 80% of a data scientist’s work load. KGLiDS is able to utilize the knowledge “encoded” by fellow data scientists working on similar datasets to recommend promising data preparation techniques in real time. This can be formulated as a SPARQL query that finds the most similar datasets and the data preparation statements that use the individual columns. For example, finding feature transformations applied to a specific column, say Age in the titanic table can be done effortlessly by a SPARQL query fetching all operations provided by the sklearn.preprocessing package and applied on the Age column of the titanic table. This query takes 70 ms and returns a list of feature transformation techniques employed by other data scientists, for example StandardScaling which is used to standardize a feature by removing the mean and scaling to unit variance.
Similarly, for finding data cleaning techniques to handle missing values in the titanic table, a query that fetches cleaning operations in the pandas.DataFrame class and applied on titanic can be constructed easily. This query takes 100 ms and returns a list of cleaning operations applied previously by fellow data scientists, for example, interpolate which is used to fill missing values by interpolation.Finally, to automate data preparation for unseen tables, KGLiDS computes column embeddings on the fly and queries the embedding store for the most similar tables. This is followed by querying the LiDS graph in the regular fashion to discover transformations or cleaning operations applied on these similar tables. The above discussed approach takes 500 ms including (i) calculating embeddings, (ii) searching for the most similar tables, and (iii) querying the LiDS graph. This allows KGLiDS to exploit the collected knowledge to solve tasks such as feature transformation and data cleaning in a productive fashion.
5.2. The Datasets Graph and Data Discovery
We compared KGLiDS to SANTOS (Khatiwada et al., 2023), (Bogatu et al., 2020), and Aurum (Fernandez et al., 2018) in terms of the effectiveness and scalability of data discovery on three benchmark datasets: Santos Small, Santos Large, and Small which consist of 525, 11,086, and 654 tables, respectively.
5.2.1. Effectiveness of Data Discovery.
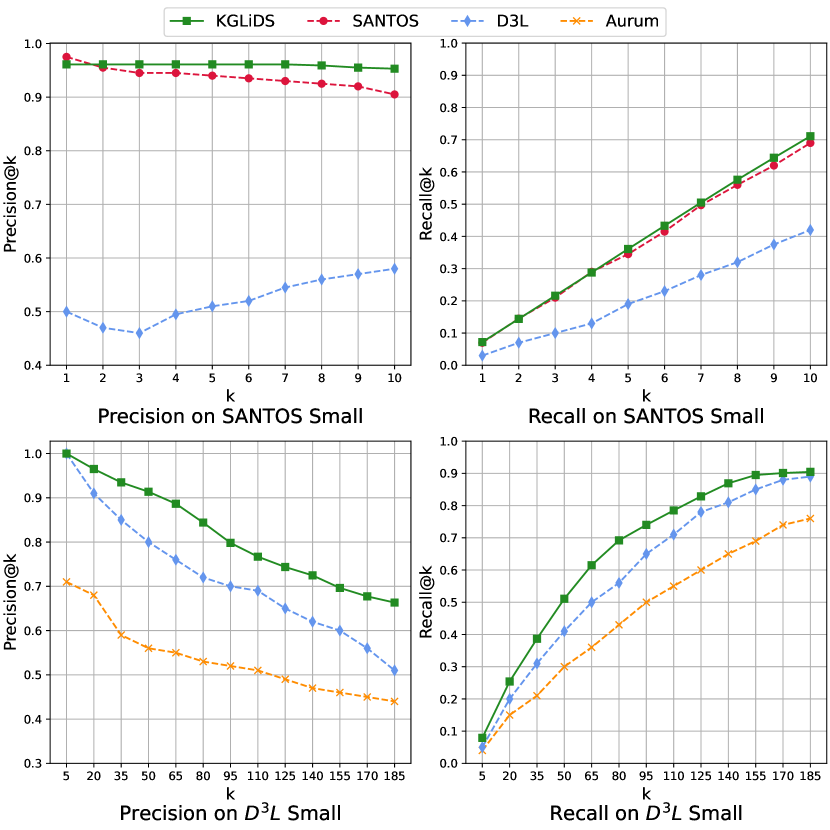
In an extensive collection of datasets, such as a data lake, one of the data discovery tasks is to find related tables. As defined in (Khatiwada et al., 2023; Bogatu et al., 2020), for a certain table , (i) table relatedness is calculated in terms of Precision@k and Recall@k for different values of , where is the number of related tables to , and (ii) precision and recall are calculated as the averages over multiple query tables sampled at random. We use the same values of (10- and 185-) and number of query tables (50 and 100) as in SANTOS (Khatiwada et al., 2023) and (Bogatu et al., 2020), respectively. Figure 5 shows the average Precision@k and Recall@k for the different systems and benchmarks.
KGLiDS significantly outperforms in terms of precision and recall in both datasets. In Santos Small, KGLiDS maintains a consistently-higher precision while varying the number of tables . In contrast, Santos achieves lower precision with higher . Regarding recall, KGLiDS consistently achieves comparable or slightly better recall than Santos. The Santos approach requires the ground truth to be in a specific format that was not provided by the authors. Furthermore, the authors did not evaluate the performance of Santos versus using the Small dataset. They also used the large datasets for scalability test only. These results demonstrates the effectiveness of (i) using CoLR models to infer similarity between columns and (ii) breaking down columns into fine-grained data types. Both of these techniques help reduce the number of false-positives relationships in these majority-textual benchmark datasets, thus resulting in high precision.
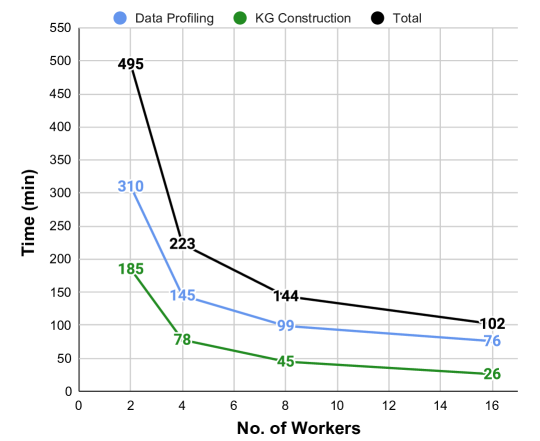
5.2.2. Performance and Scalability Analysis.
To analyze the cost of achieving our outstanding precision and recall, we analyzed the performance of KGLiDS and SANTOS in terms of indexing and discovery queries. Table 2 summarizes our results. Moreover, we also performed a strong scalability test using KGLiDS by varying the number of machines while indexing SANTOS Large, as shown in Figure 6. For both experiments, we utilized a cluster of 16 machines. SANTOS operates as a multi-threaded system on a single machine known as scale-up. Conversely, KGLiDS is a SPARK-based system that can scale out to multiple machines. Thus, regarding indexing the large dataset, KGLiDS is 22 times faster than SANTOS. Furthermore, KGLiDS is designed to scale for discovery queries. Our queries leverage the built-in indices in RDF engines, resulting in a sub-second query time for both the small and large datasets. Compared to SANTOS, KGLiDS is two orders of magnitude faster for discovery queries. For the strong scalability test, Figure 6 shows the time taken by both the data profiling (Algorithm 2) and knowledge graph construction (Algorithm 3). Overall, KGLiDS maintains a consistent level of performance and effectively utilizes additional resources to index and construct the LiDS graph.
| Benchmark | System | Indexing | Query |
| SANTOS Small | KGLiDS | 3.5 min | 0.02 sec |
| SANTOS | 4.1 hr | 28.2 sec | |
| Santos Large | KGLiDS | 1.7 hr | 0.24 sec |
| SANTOS | 38.2 hr | 35.8 sec |
6. Related Work
While some existing systems capture the semantics of code and others support data discovery, KGLiDS is the first platform to combine these aspects in a single system and implement our vision of linked data science on federated datasets (Mansour et al., 2021). Our platform is powered by knowledge graph technologies to enable the data science community to explore, exchange, and automatically learn from data science artifacts, namely pipeline scripts and datasets. KGLiDS provides a navigational structure linking data science artifacts that serves as a basis for automating various tasks in data science. For example, systems that formalize the AutoML problem as a graph generation problem (Helali et al., 2022) can benefit from our semantic representation of pipelines. In addition, we demonstrated an example of automating data preparation tasks, which data scientists reportedly spend the majority of their time on.
Capture Pipeline Semantics. The use of KGs to support applications on top of source code has seen much traction in recent years. Several approaches (Alnusair and Zhao, 2010; Atzeni and Atzori, 2017; Jiomekong et al., 2019; Abdelaziz et al., 2021) provide a semantic representation of source code with KGs. These techniques cannot be generalized to data science pipelines due to their heavy reliance on the detailed static analysis of Java, where information such as method input and return types is straightforward to determine. GraphGen4Code (Abdelaziz et al., 2021) is a toolkit utilizing a tool called WALA (WAL, 2022) for general-purpose static code analysis. Unlike GraphGen4Code, KGLiDS combines static code analysis with library documentation and dataset usage analyses to have a rich semantic abstraction that captures the essential concepts in data science pipelines.
Data Discovery Systems design metadata collected from datasets as different navigational data structures. Consider for example, (i) SANTOS (Khatiwada et al., 2023) that generates a synthetic knowledge base, (ii) RONIN (Ouellette et al., 2021), which builds a hierarchical structure, (iii) (Bogatu et al., 2020), which constructs hash-based indices, and (iv) Aurum (Fernandez et al., 2018) that creates an in-memory linkage graph. These systems do rarely use open standards. We are the first to design a navigational data structure capturing the semantics of datasets and pipelines based on knowledge graph technologies. Furthermore, we enable several data discovery operations, such as unionable tables, joinable tables, and join path discovery. Unlike (Zhang and Ives, 2020; Zhu et al., 2019; Nargesian et al., 2018), KGLiDS also enables users to query datasets based on embeddings and combines easily different operations in one pipeline script. We demonstrated these capabilities of KGLiDS’s data discovery support, and we called it KGLac (Helal et al., 2021).
7. Conclusion
This paper describes KGLiDS, a fully-fledged platform to enable Linked Data Science powered by knowledge graphs and machine learning. KGLiDS is designed to scale in constructing a highly interconnected knowledge graph capturing the semantics of datasets, pipeline scripts, and code libraries. KGLiDS implements specialized static code analysis that infers information not otherwise obtainable with general-purpose static analysis, resulting in a richer, more accurate, and more compact abstraction of data science pipelines. KGLiDS further utilizes an advanced data profiler empowered by machine learning to analyze data items, including datasets, tables, and columns. In combination, these components enable novel use cases for discovery, exploration, reuse, and automation in data science platforms.
References
- (1)
- kag (2022) 2022. Kaggle Portal. Accessed: 2022-07-15. https://www.kaggle.com/
- WAL (2022) 2022. WALA Tool. Accessed: 2022-07-15. https://wala.github.io
- Abdelaziz et al. (2021) Ibrahim Abdelaziz, Julian Dolby, James McCusker, and Kavitha Srinivas. 2021. A Toolkit for Generating Code Knowledge Graphs. Proceedings of Knowledge Capture Conference (K-CAP) (2021). https://doi.org/10.1145/3460210.3493578
- Abdelaziz et al. (2017) Ibrahim Abdelaziz, Essam Mansour, Mourad Ouzzani, Ashraf Aboulnaga, and Panos Kalnis. 2017. Lusail: A System for Querying Linked Data at Scale. Proceedings of the VLDB Endowment, (PVLDB) (2017), 485–498. http://www.vldb.org/pvldb/vol11/p485-abdelaziz.pdf
- Alnusair and Zhao (2010) Awny Alnusair and Tian Zhao. 2010. Component search and reuse: An ontology-based approach. In Proceedings of IEEE International Conference on Information Reuse & Integration, (IRI). 258–261. https://doi.org/10.1109/IRI.2010.5558931
- Amundsen (2022) Amundsen. 2022. http://www.amundsen.io.
- Atzeni and Atzori (2017) Mattia Atzeni and Maurizio Atzori. 2017. CodeOntology: RDF-ization of Source Code. In Proceedings of International Semantic Web Conference, (ISWC). 20–28. https://doi.org/10.1007/978-3-319-68204-4_2
- Bogatu et al. (2020) Alex Bogatu, Alvaro Fernandes, Norman Paton, and Nikolaos Konstantinou. 2020. Dataset Discovery in Data Lakes. In Proceedings of International Conference on Data Engineering (ICDE). 709–720. https://doi.org/10.1109/ICDE48307.2020.00067
- Bursztyn et al. (2015) Damian Bursztyn, François Goasdoué, Ioana Manolescu, and Alexandra Roatis. 2015. Reasoning on web data: Algorithms and performance. In Proceedings of the IEEE International Conference on Data Engineering (ICDE). 1541–1544. https://doi.org/10.1109/ICDE.2015.7113422
- Carroll et al. (2005) Jeremy Carroll, Christian Bizer, Patrick Hayes, and Patrick Stickler. 2005. Named graphs, provenance and trust. In Proceedings of the international conference on World Wide Web (WWW). 613–622. https://doi.org/10.1145/1060745.1060835
- Engine (2022) The Stardog RDF Engine. 2022. http://stardog.com. http://stardog.com
- Fernandez et al. (2018) Raul Fernandez, Ziawasch Abedjan, Famien Koko, Gina Yuan, Samuel Madden, and et al. 2018. Aurum: A Data Discovery System. In Proceedings of International Conference on Data Engineering (ICDE). 1001–1012. https://doi.org/10.1109/ICDE.2018.00094
- Galárraga et al. (2013) Luis Galárraga, Christina Teflioudi, Katja Hose, and Fabian Suchanek. 2013. AMIE: association rule mining under incomplete evidence in ontological knowledge bases. In Proceedings of the International World Wide Web Conference (WWW). 413–422. https://doi.org/10.1145/2488388.2488425
- Galárraga et al. (2015) Luis Galárraga, Christina Teflioudi, Katja Hose, and Fabian M. Suchanek. 2015. Fast rule mining in ontological knowledge bases with AMIE+. Proceedings of the VLDB J. Endowment, (VLDB) (2015), 707–730. https://doi.org/10.1007/s00778-015-0394-1
- Goikoetxea et al. (2016) Josu Goikoetxea, Eneko Agirre, and Aitor Soroa. 2016. Single or Multiple? Combining Word Representations Independently Learned from Text and WordNet. In Proceedings of the Thirtieth Conference on Artificial Intelligence (AAAI). 2608–2614. http://www.aaai.org/ocs/index.php/AAAI/AAAI16/paper/view/11777
- Good (1952) I. J. Good. 1952. Rational Decisions. Journal of the Royal Statistical Society. Series B (Methodological) 14, 1 (1952), 107–114. http://www.jstor.org/stable/2984087
- Hartig (2019) Olaf Hartig. 2019. Foundations to Query Labeled Property Graphs using SPARQL. In Joint Proceedings of the 1st International Workshop On Semantics For Transport and the 1st International Workshop on Approaches for Making Data Interoperable co-located with 15th Semantics Conference (SEMANTiCS). http://ceur-ws.org/Vol-2447/paper3.pdf
- Helal et al. (2021) Ahmed Helal, Mossad Helali, Khaled Ammar, and Essam Mansour. 2021. A Demonstration of KGLac: A Data Discovery and Enrichment Platform for Data Science. Proceedings of VLDB Endowment, (PVLDB) 12 (2021), 2075–2089. http://www.vldb.org/pvldb/vol13/p2075-christodoulakis.pdf
- Helali et al. (2022) Mossad Helali, Essam Mansour, Ibrahim Abdelaziz, Julian Dolby, and Kavitha Srinivas. 2022. A Scalable AutoML Approach Based on Graph Neural Networks. Proceedings of the VLDB Endowment 15, 11 (2022), 2428–2436. https://doi.org/10.14778/3551793.3551804
- Hulsebos et al. (2019) Madelon Hulsebos, Kevin Hu, Michiel Bakker, Emanuel Zgraggen, Arvind Satyanarayan, Tim Kraska, Çağatay Demiralp, and César Hidalgo. 2019. Sherlock: A Deep Learning Approach to Semantic Data Type Detection. In ACM Knowledge Discovery and Data Mining (KDD). https://doi.org/10.1145/3292500.3330993
- Jiomekong et al. (2019) Azanzi Jiomekong, Gaoussou Camara, and Maurice Tchuente. 2019. Extracting ontological knowledge from Java source code using Hidden Markov Models. Open Computer Science (2019), 181–199. https://doi.org/10.1515/comp-2019-0013
- Johnson et al. (2021) Jeff Johnson, Matthijs Douze, and Hervé Jégou. 2021. Billion-scale similarity search with GPUs. Proceedings of IEEE Transactions on Big Data 3 (2021), 535–547. https://doi.org/10.1109/TBDATA.2019.2921572
- Khatiwada et al. (2023) Aamod Khatiwada, Grace Fan, Roee Shraga, Zixuan Chen, Wolfgang Gatterbauer, Renée J Miller, and Mirek Riedewald. 2023. SANTOS: Relationship-based Semantic Table Union Search. In SIGMOD Conference 2023. ACM.
- Klyne et al. (2014) Graham Klyne, Jeremy Carrol, and Brian McBride. 2014. RDF 1.1 Concepts and Abstract Syntax. World-Wide Web Consortium. https://www.w3.org/TR/rdf11-concepts/
- Mansour et al. (2021) Essam Mansour, Kavitha Srinivas, and Katja Hose. 2021. Federated Data Science to Break Down Silos [Vision]. SIGMOD Record 50, 4 (2021), 16–22. https://doi.org/10.1145/3516431.3516435
- meta-kaggle (2022) meta-kaggle. 2022. https://www.kaggle.com/kaggle/meta-kaggle.
- Montoya et al. (2017) Gabriela Montoya, Hala Skaf-Molli, and Katja Hose. 2017. The Odyssey Approach for Optimizing Federated SPARQL Queries. In Proceedings of the International Semantic Web Conference (ISWC), Vol. 10587. 471–489. https://doi.org/10.1007/978-3-319-68288-4_28
- Mueller and Smola (2019) Jonas Mueller and Alex Smola. 2019. Recognizing Variables from Their Data via Deep Embeddings of Distributions. In International Conference on Data Mining (ICDM). 1264–1269. https://doi.org/10.1109/ICDM.2019.00158
- Nargesian et al. (2018) Fatemeh Nargesian, Erkang Zhu, Ken Pu, and Renée Miller. 2018. Table Union Search on Open Data. Proceedings of the VLDB Endowment, (PVLDB) (2018), 813–825. http://www.vldb.org/pvldb/vol11/p813-nargesian.pdf
- Ouellette et al. (2021) Paul Ouellette, Aidan Sciortino, Fatemeh Nargesian, Bahar Bashardoost, Erkang Zhu, and et al. 2021. RONIN: Data Lake Exploration. Proceedings of the VLDB Endowment, (PVLDB) (2021), 2863–2866. http://www.vldb.org/pvldb/vol14/p2863-nargesian.pdf
- Pennington et al. (2014) Jeffrey Pennington, Richard Socher, and Christopher Manning. 2014. GloVe: Global Vectors for Word Representation. In Proceedings of the 2014 Conference on Empirical Methods in Natural Language Processing (EMNLP). 1532–1543. https://doi.org/10.3115/v1/D14-1162
- Peters et al. (2017) Matthew Peters, Waleed Ammar, Chandra Bhagavatula, and Russell Power. 2017. Semi-supervised sequence tagging with bidirectional language models. In Proceedings of the Association for Computational Linguistics (ACL), Vol. 1. 1756–1765. https://doi.org/10.18653/v1/P17-1161
- Petersohn (2021) Devin Petersohn. 2021. Scaling Data Science does not mean Scaling Machines. In Conference on Innovative Data Systems Research (CIDR). http://cidrdb.org/cidr2021/papers/cidr2021_abstract11.pdf
- Salis et al. (2021) Vitalis Salis, Thodoris Sotiropoulos, Panos Louridas, Diomidis Spinellis, and Dimitris Mitropoulos. 2021. PyCG: Practical Call Graph Generation in Python. International Conference on Software Engineering (ICSE) (2021), 1646–1657. https://doi.org/10.1109/ICSE43902.2021.00146
- Schwarte et al. (2011) Andreas Schwarte, Peter Haase, Katja Hose, Ralf Schenkel, and Michael Schmidt. 2011. FedX: A Federation Layer for Distributed Query Processing on Linked Open Data. In Proceedings of The Semanic Web: Research and Applications (ESWC) (Lecture Notes in Computer Science). Springer, 481–486. https://doi.org/10.1007/978-3-642-21064-8_39
- Vanschoren et al. (2013) Joaquin Vanschoren, Jan Rijn, Bernd Bischl, and Luis Torgo. 2013. OpenML: Networked Science in Machine Learning. SIGKDD Explorations 15 (2013), 49–60. https://doi.org/10.1145/2641190.2641198
- Villazón-Terrazas et al. (2017) Boris Villazón-Terrazas, Nuria García-Santa, Yuan Ren, Kavitha Srinivas, Mariano Rodriguez-Muro, and et al. 2017. Construction of Enterprise Knowledge Graphs (I). In Proceedings of Exploiting Linked Data and Knowledge Graphs in Large Organisations. 87–116. https://doi.org/10.1007/978-3-319-45654-6_4
- Zhang and Ives (2020) Yi Zhang and Zachary Ives. 2020. Finding Related Tables in Data Lakes for Interactive Data Science. In Proceedings of The International Conference on Management of Data, (SIGMOD). 1951–1966. https://doi.org/10.1145/3318464.3389726
- Zheng et al. (2016) Weiguo Zheng, Lei Zou, Wei Peng, Xifeng Yan, Shaoxu Song, and et al. 2016. Semantic SPARQL Similarity Search Over RDF Knowledge Graphs. Proceedings of the VLDB Endowment, (PVLDB) (2016), 840–851. http://www.vldb.org/pvldb/vol9/p840-zheng.pdf
- Zhu et al. (2019) Erkang Zhu, Dong Deng, Fatemeh Nargesian, and Renée Miller. 2019. JOSIE: Overlap Set Similarity Search for Finding Joinable Tables in Data Lakes. In Proceedings of the International Conference on Management of Data (SIGMOD). 847–864. https://doi.org/10.1145/3299869.3300065