YSE-PZ: A Transient Survey Management Platform that Empowers the Human-in-the-Loop
Abstract
The modern study of astrophysical transients has been transformed by an exponentially growing volume of data. Within the last decade, the transient discovery rate has increased by a factor of 20, with associated survey data, archival data, and metadata also increasing with the number of discoveries. To manage the data at this increased rate, we require new tools. Here we present YSE-PZ, a transient survey management platform that ingests multiple live streams of transient discovery alerts, identifies the host galaxies of those transients, downloads coincident archival data, and retrieves photometry and spectra from ongoing surveys. YSE-PZ also presents a user with a range of tools to make and support timely and informed transient follow-up decisions. Those subsequent observations enhance transient science and can reveal physics only accessible with rapid follow-up observations. Rather than automating out human interaction, YSE-PZ focuses on accelerating and enhancing human decision making, a role we describe as empowering the human-in-the-loop. Finally, YSE-PZ is built to be flexibly used and deployed; YSE-PZ can support multiple, simultaneous, and independent transient collaborations through group-level data permissions, allowing a user to view the data associated with the union of all groups in which they are a member. YSE-PZ can be used as a local instance installed via Docker or deployed as a service hosted in the cloud. We provide YSE-PZ as an open-source tool for the community.
1 Introduction
Time-domain astronomy is experiencing an exponentially growing rate of astrophysical transient discoveries, with 24,634 transients reported in 2021111https://www.wis-tns.org/stats-maps compared to only 909 in 2011222https://www.rochesterastronomy.org/sn2011/snstats.html, a 27-fold increase. The rising discovery rate is driven by the transition from narrow-field galaxy-targeted surveys (e.g., the Lick Observatory Supernova Search; Filippenko et al., 2001) to wide-field time-domain surveys, including the All-Sky Automated Survey for Supernovae (ASAS-SN; Shappee et al., 2014), the Asteroid Terrestrial-impact Last Alert System (ATLAS; Tonry et al., 2018), the Catalina Real-Time Transient Survey (CSS; Drake et al., 2009), the Gaia Photometric Science Alerts (Hodgkin et al., 2021), the Mobile Astronomical System of Telescope-Robots (MASTER; Lipunov et al., 2010), the Panoramic Survey Telescope and Rapid Response (Pan-STARRS) Survey for Transients (PSST; Huber et al., 2015), the Palomar Transient Factory (PTF; Law et al., 2009), the Nearby Supernova Factory (SNfactory; Aldering et al., 2002), the Young Supernova Experiment (YSE; Jones et al., 2021), and the Zwicky Transient Facility (ZTF; Bellm et al., 2019). The discovery rate is expected to further increase by an additional order of magnitude with the start of survey operations for the Vera Rubin Observatory’s Legacy Survey of Space and Time (LSST; LSST Science Collaboration et al., 2009).
The corresponding continually expanding volume of data introduces new challenges for data management, transient triage, and follow-up decisions. On average, 50 new transients are reported to the International Astronomical Union (IAU) every day, with several times more potential transients identified in survey data. Without efficient ways to sift data streams to find targets of interest, we risk missing novel transient events or failing to discover them in time to obtain follow-up observations before they have changed or faded. Furthermore, collating data from multiple transient surveys and extant archives is essential to have the most complete dataset for making decisions in real time.
For supernovae (SNe), follow-up observations obtained within the first hours to days after explosion are particularly critical since they probe the outermost layers of a SN’s ejecta and its progenitor star (e.g., Soderberg et al., 2008; Modjaz et al., 2009; Ofek et al., 2010; Bloom et al., 2012; Tinyanont et al., 2022), illuminate close-in circumstellar material before it is overrun (e.g., Sternberg et al., 2011; Gal-Yam et al., 2014; Jacobson-Galán et al., 2020a, 2022a; Terreran et al., 2022), and reveal details of the progenitor system (e.g., Marion et al., 2016; Hosseinzadeh et al., 2017; Dimitriadis et al., 2019; Shappee et al., 2019; Miller et al., 2020). While wide-field high-cadence observations are critical to discover SNe at early times, additional tools are necessary to identify these SNe before this phase has passed.
Methods of managing transient data have evolved from transient survey websites in the 1990s and early 2000s, such as the Rochester Astronomy Supernova webpage333https://www.rochesterastronomy.org/supernova.html. that started in 1996. This website collated information about every SN, including its location, brightness, and host galaxy. Many SNe had finding charts, providing critical information not transmitted through International Astronomical Union (IAU) Circulars and Central Bureau Electronic Telegrams (CBETs; Green, 2002), which at the time were the primary way for professional astronomers to communicate about SNe in (near) real time. As IAU reporting diminished throughout the early 2000s, the Rochester webpage became the de facto database for all transients until the IAU system was overhauled and the new Transient Name Server (TNS)444https://www.wis-tns.org/. re-engaged the community in 2016.
Internal webpages for high-redshift SN cosmology surveys including Equation of State: SupErNovae trace Cosmic Expansion (ESSENCE; Smith et al., 2002), SDSS-II (Frieman et al., 2008), SNFactory (Aldering et al., 2002), and the Supernova Legacy Survey (SNLS; Astier et al., 2006) also tracked SN discoveries from their specific surveys and included important information about the sources, such as brightness and classification. Over time, these systems became more sophisticated. Several systems began to splinter into “search” services and “target and observation managers” (TOMs). The former would be a database of potential transients from the survey (e.g., Goldstein et al., 2015), while the latter would consist of “promoted” transients of interest that could be monitored. For several surveys, these internal tools were significantly more powerful than the Rochester webpage or the CBETs, causing further fragmentation.
In recent years, the community has tackled the challenge of effectively and efficiently acting on modern transient data streams by breaking the problem into two complementary layers: so-called data “brokers,” which broadly replicate the search features of previous surveys but with several enhancements; and continually improved TOMs. Data brokers parse the data from raw transient alert streams by filtering on criteria such as those that reduce false positive detections or indicate likely SNe. Many brokers have focused on the ZTF alert stream, which has 1 million alerts a night, including MARS (Brown et al., 2013), ANTARES (Saha et al., 2014), Lasair (Smith & Gray, 2018), AMPEL (Nordin et al., 2019), Fink (Möller et al., 2021), ALeRCE (Förster et al., 2021), and Pitt-Google555https://github.com/mwvgroup/Pitt-Google-Broker.. Nearly all of these brokers will also be tasked with serving the Rubin Observatory alert stream — which will provide 10 million alerts per night — as it begins operation in the mid 2020s. Some of these brokers include features such as value-added galaxy catalog cross-matching (e.g., via GHOST; Gagliano et al. 2021). Several also give the user flexibility to define their own transient filtering criteria and execute queries on a flexibly-defined set of data attributes.
After transient data have been parsed by a broker, a TOM will store the pre-processed alert packages and facilitate follow-up observations or identify samples for subsequent scientific analyses. Some recently developed TOMs include the Palomar Transient Factory (PTF) Follow-up Marshal (Rau et al., 2009), the RoboNet Microlensing System (Tsapras et al., 2009), the PESSTO Marshall (Smartt et al., 2015), the Supernova Exchange (SNeX; Howell & Global Supernova Project, 2017), the TOM-toolkit Street et al. (2018), the Global Relay of Observatories Watching Transients Happen (GROWTH) Marshall (Kasliwal et al., 2019), the Transient Science Server (Smith et al., 2020), the SNAD ZTF object viewer (Malanchev et al., 2022), and the NASA Exoplanet Follow-Up Portal (ExoFOP)666https://exofop.ipac.caltech.edu/tess/.
These tools are usually designed for a single survey and purpose, with common limitations including a focus on specific data sets or surveys, the lack of access to the public, and a closed source codebase. The exception is the TOM-toolkit (Street et al., 2018), which is an open-source777https://github.com/TOMToolkit.. extensible and customizable TOM framework, but — by design — requires significant customization by the user. Despite the rich combination of brokers and TOMs currently available, it remains challenging to leverage data into effective decision making. Automated tools that retrieve metadata, fit models, or classify transients often need human intervention to robustly identify transients of interest and select scientifically interesting samples of transients.
Here, we address these ongoing challenges with YSE-PZ, a transient survey management platform. YSE-PZ combines traditional TOM functions, e.g., data collation and resource management, with a data broker-like query and filtering system to empower human-in-the-loop decision making. It is open-source, publicly available software that synthesizes astronomical data from existing public transient survey and combines these data with private data, user-uploaded data, archival metadata, and output from value-added services. YSE-PZ synthesizes and displays these distinct data in an easy-to-digest format, provides a variety of query and filtering tools that supports filtering these data streams into scientific samples of interest, and enhances real-time decision-making. Finally, YSE-PZ includes a framework for planning and executing follow-up observations, allowing transients to be managed from discovery through to analysis of followup data.
In Section 2 we give an overview of the YSE-PZ platform. In Section 3 we discuss our generic transient workflow, and in Section 4 we share use cases that illustrate how YSE-PZ supports a diverse set of user and science requirements. We discuss YSE-PZ in the context of a broader open science ecosystem in Section 5. We conclude in Section 6.
2 YSE-PZ
YSE-PZ is a new transient survey management platform that takes an object-oriented approach to modeling the full workflow of transient observations. This workflow is built on YSE-PZ’s data model, which defines relationships between the transient, its data, and metadata. This model also defines the types of data that YSE-PZ can store and upon which it can act. YSE-PZ is also a dynamic application; it continually ingests new transients, their data and metadata, invokes value-added services that annotate these data, and performs application-level maintenance tasks.
In this section, we will first cover YSE-PZ’s data model (Section 2.1) and task management system (Section 2.3), and then we will enumerate the data (Section 2.4 and 2.5) as well as features (Section 2.6) enabled by these two components. We then describe how a human-in-the-loop interacts with YSE-PZ via the query engine (Section 2.7), front-end web application (Section 2.2), API (Section 2.8), and user groups and permissions (Section 2.9).
2.1 Data Model
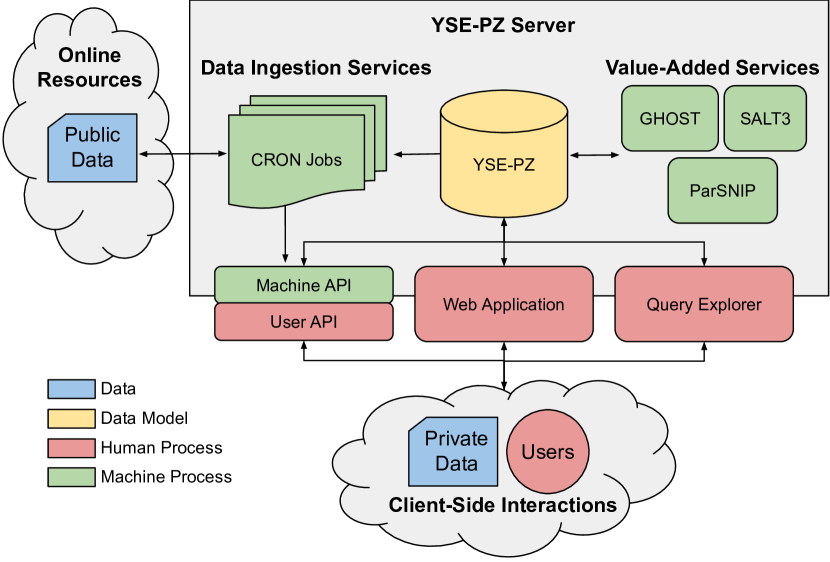
YSE-PZ is a Django-based web application888https://www.djangoproject.com/ employing a MySQL999https://www.mysql.com/. backend and a Representational State Transfer (REST) compliant Application Programming Interface (API) (see Figure 1). To model the objects within the transient workflow, YSE-PZ uses the Django Object-Relational Mapper (ORM) framework. The ORM allows a developer to model transient properties, behaviors, and relationships within Python code rather than creating these objects directly in SQL. This developer-friendly approach makes extending the application easier.
YSE-PZ’s data model is constructed to be general enough to model any transient survey data, astronomical metadata, and observational workflow. While this generality makes some queries more complex than those against a simpler data model, the advantage is that YSE-PZ can ingest any public or private astronomical data and define workflows down to the instrument configuration for follow-up requests.
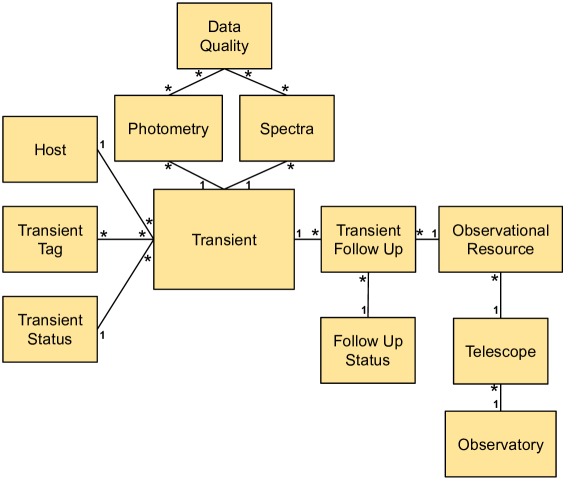
Within YSE-PZ, the main objects include the transients themselves, their host galaxies, metadata, public data, private data, and auxiliary data such as observing resources and follow-up requests. YSE-PZ has 100 tables, for a complete listing of tables, see the YSE-PZ GitHub repository101010https://github.com/davecoulter/YSE_PZ. For brevity, we present a simplified science schema of YSE-PZ in Figure 2, conceptually focused on the central YSE-PZ objects. A Transient object is defined by its name, coordinates, and discovery date. A Transient object is also connected to other data and metadata objects. For example, a Transient has associated astronomical data objects, Photometry and Spectra, each defined by fields like flux, magnitude, bandpass, etc. A Transient also has an associated metadata object called Transient Status that stores how a given transient relates to a user’s workflow (see Section 3).
In the case of Photometry and Spectra, a Transient has a “one-to-many” relationship, i.e., one transient may have many data points, but each data point is associated with only one transient. On the other hand, some object relations are “many-to-many”, e.g., the Transient-Transient Tag relationship. The Transient Tag object holds a user-defined tag that can be applied to any transient, and denotes some interesting property (see Section 2.7). One tag may apply to many transients, and a transient may have many different tags for many different properties. These relationships are denoted in Figure 2.
2.2 Front-End Web Application
The Django ORM also powers a front-end web application in the industry-standard design pattern of the Model-View-Controller (MVC) architecture. In this paradigm, web requests are made to a controller object, which acts as a gateway that routes incoming requests to the appropriate resource, e.g., a web page or direct data download.
Based on the requested URL, user identity, and group permission, the controller will retrieve the information of interest from the database using the Django ORM and then package these data into an object called a model. A model is a dictionary of structured data that is rendered dynamically by an HTML template, called a view. The final rendered HTML is what a user sees in their browser.
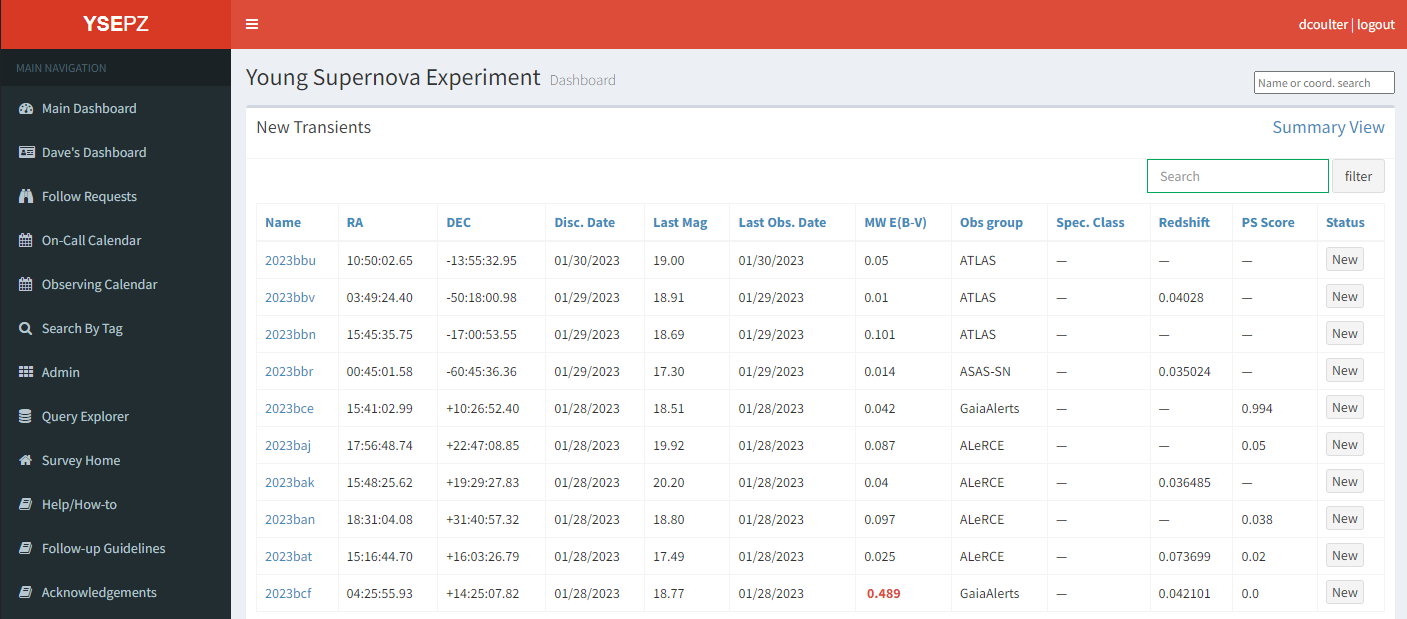
YSE-PZ accomplishes most of its front-end functionality with a series of interactive dashboards that allow data to be displayed in space-efficient, paginated tables with the ability to sort on each column displayed. Upon logging into YSE-PZ, a user is greeted with the main dashboard, which displays newly ingested transients from TNS into a table called “New Transients” (Figure 3). Below the New Transients table, there are further tables for transients with different user-configurable statuses: Followup Requested, Following, Interesting, Watch, Finished Following, and Needs Template (see Section 3.1 for a description of these statuses). While these are the default statuses, it’s important to note that a user is free to define any status they wish, as well as to customize the main page of the application to reflect their workflow preferences.
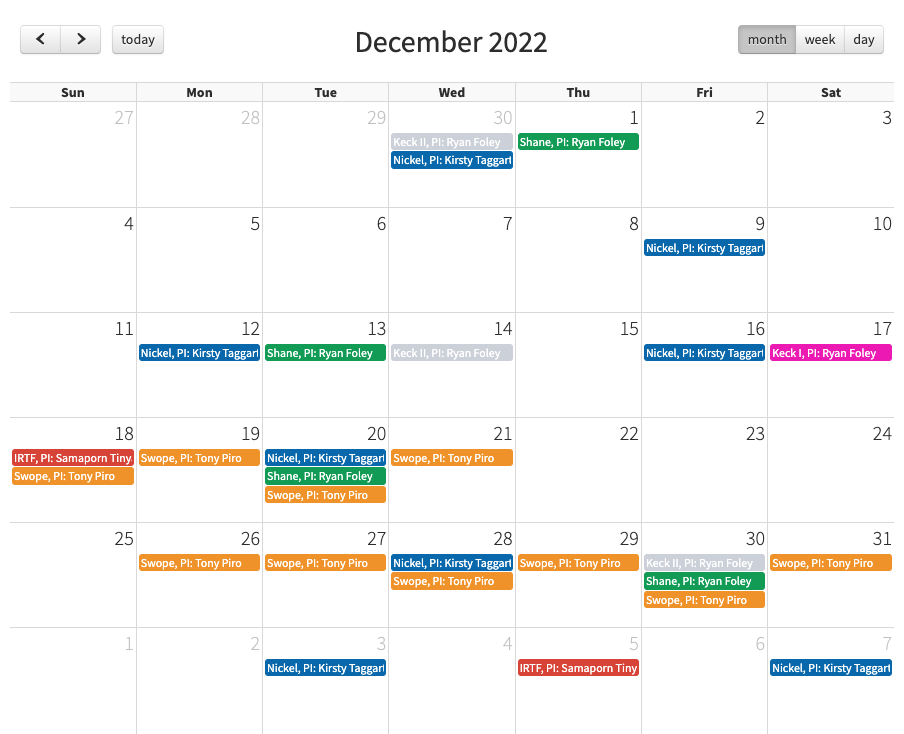
The front-end web application also has a left navigation bar with links to other parts of the site, including a separate web page that displays all follow-up requests made for each telescope resource, an on-call calendar which is configurable to send SMS text messages to users who want to respond to events in real time (e.g., searching for gravitational wave counterparts, see Section 4.4), an observation calendar (which displays configured observing resources in a calendar format, see Figure 8), a search utility that can query the database for transients that have been tagged with user-defined tags (see Figure 6), a Query Explorer111111The YSE-PZ Query Explorer is built off of the Django SQL Explorer https://django-sql-explorer.readthedocs.io/en/latest/ that allows users to flexibly create ad hoc queries against the database on any property of the data model, and an administration function exposed by Django that allows a user with administrative permissions to edit data in the database directly using a built-in, Django web form. Finally, each user has their own personal dashboard that can be configured to display transients of interest. To do this, a user writes a query to select objects using the Query Explorer, and then attaches that query to their dashboard. Users can also select from a predefined set of python-based queries for this purpose.
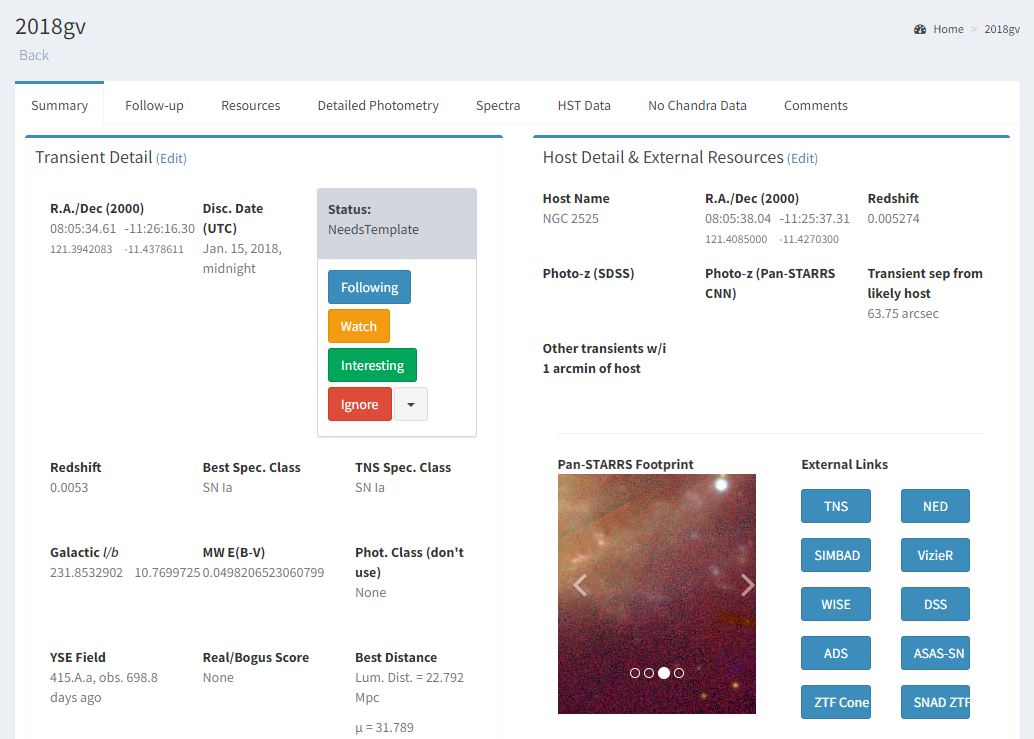
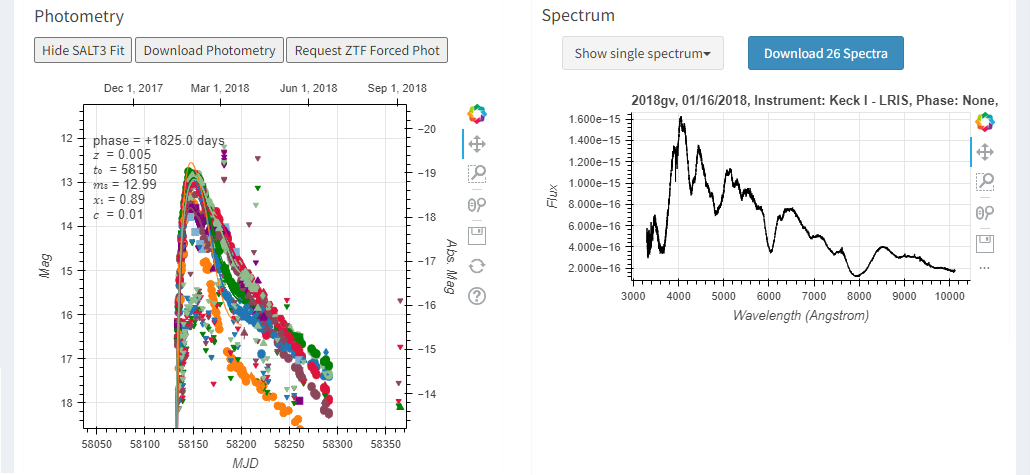
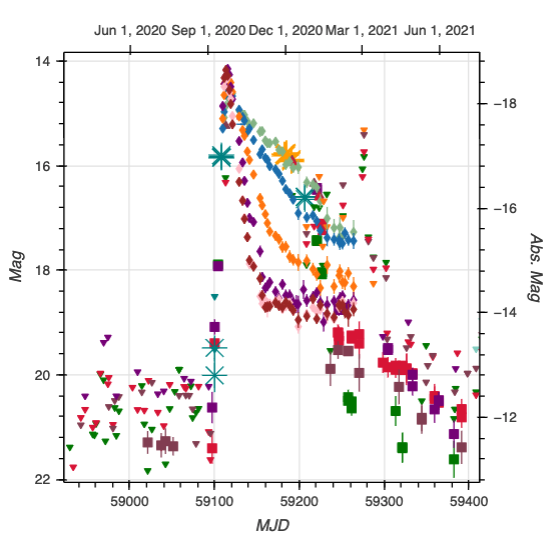
Transient data can then be viewed via template-generated, individual transient detail pages (see Figure 4). These transient detail pages are tab-based, and each tab provides different views of the data and different functions available to a user. On the main Summary tab, all available photometry and spectroscopy that a user is permitted to view (see Section 2.9) is plotted via an interactive Bokeh JavaScript widget. Metadata and external links to archival data (e.g., NED and TNS) are shown at the top of the page, and archival Digitized Sky Survey (DSS), SDSS, Pan-STARRS, and DECam legacy survey images are shown in a section devoted to galaxy host data. On the Follow-up tab, there are resources for requesting follow-up for a transient, as well as forms to add new observational resources to the system (see Section 3.3. A Detailed Photometry tab provides a tabular view of all transient photometry, as well as a convenient way to download this data. HST and Chandra tabs report if archival image footprints coincide with the transient position, and a Comments tab allows users to attach free-form comments to a transient.
2.3 YSE-PZ’s Task Management System
The dynamic part of YSE-PZ is the configured Command Run On (CRON) job. These task runners are modular, configured for a single task, and interact with the API via POSTs, as well as the Django ORM. The modular nature of these CRON jobs makes extending YSE-PZ’s functionality straightforward. In principle, CRON jobs can be run from any server and interact purely with the API to GET or POST any necessary data; however, YSE-PZ largely uses CRON jobs that are constructed to directly query the database on the YSE-PZ back-end for computational efficiency. These server-side CRON jobs are constructed and organized using the django-cron121212https://django-cron.readthedocs.io/en/latest/. module, which allows users to create and configure CRON jobs using Django’s application settings file, as well as providing access to the ORM’s representation of YSE-PZ objects.
YSE-PZ uses CRON jobs to continually ingest public data (see Section 2.4), retrieve archival and metadata (see Section 2.5), and invoke value-added services (see Section 2.6). CRON jobs are also used by YSE-PZ to perform various other tasks, including annotating data (e.g., flagging transients in TESS fields), scheduling YSE survey observations (see Section 4), and performing daily database back-ups. For more on how YSE-PZ is used by specific collaborations, see Section 4.
2.4 Sources of Publicly Available Transient Data
YSE-PZ retrieves and stores data from the following sources via CRON jobs:
-
1.
The Transient Name Server (TNS131313https://www.wis-tns.org/.). TNS is the official reporting service for the International Astronomical Union (IAU) that provides available photometry and spectroscopic classifications for publicly reported transients discovered by the community. The CRON job that handles TNS data ingestion queries their API every five minutes to ingest newly discovered transients or to update previously ingested transients with new photometric, spectroscopic, and classification data. Because existing transients may be updated within TNS, this CRON job has logic to prevent transients from being duplicated141414We require that any new transient be greater than 2 arcsec from the position of an existing transient or be discovered more than a year earlier/later. While this still allows for duplicate events in rare cases with an exceptionally long reporting/discovery lag time, it generally mitigates against missing new transients at a coincident location in the same galaxy; an occurrence that could be particularly scientifically interesting..
-
2.
ATLAS forced photometry (Tonry et al., 2018; Smith et al., 2020; Shingles et al., 2021). The Asteroid Terrestrial-impact Last Alert System (ATLAS) surveys the visible sky in the “cyan” and “orange” bands (“cyan” is approximately the same as ; “orange” is approximately ) every two days. YSE-PZ automatically queries the public ATLAS forced photometry data once per day for a subset of transients of interest that we identify using a YSE-PZ query.
-
3.
Gaia photometric science alerts (Hodgkin et al., 2021). Gaia observes the whole sky with a spatially heterogeneous cadence (e.g., Boubert et al., 2020) but typically makes successive pairs of observations separated by 2-4 weeks in the G-band (a broad white-light filter). Gaia alerts are queried hourly.
-
4.
PSST via the Transient Science Server. PSST surveys 14,000 square degrees of sky in the and (white light that is roughly ) bands at an irregular cadence with 1-4 return visits of each field scheduled within 15 days of the first observation. PSST photometry is ingested every two hours.
-
5.
Swift optical and ultraviolet photometry via the Swift quick-look data archive151515https://swift.gsfc.nasa.gov/cgi-bin/sdc/ql. Once per hour, we query all previously unanalyzed Swift imaging for overlap with transients in YSE-PZ and perform forced aperture photometry on these images at the locations of the transients.
-
6.
The Young Supernova Experiment via the Transient Science Server (Smith et al., 2020). The Young Supernova Experiment surveys 1500 square degrees of sky at any time to a depth of mag, and mag, with a three-day cadence. YSE data are vetted using the Transient Science Server, and transients deemed both “good” and “possible” (indicating a transient that may be real) by the YSE team are ingested to YSE-PZ every 30 minutes.
-
7.
ZTF via the ANTARES Astronomical Time-domain Event Broker (Matheson et al., 2021). ZTF is currently surveying the northern extragalactic sky on a two-day cadence, with publicly available photometry in the bands. We use the ANTARES client to ingest ZTF photometry for transients reported to TNS; ZTF photometry is queried upon ingestion of the TNS transients and updated twice per day for transients not flagged as “Ignore” (see Section 3.1 for status labels). Forced photometry can be manually requested via the ZTF forced photometry service161616https://ztfweb.ipac.caltech.edu/cgi-bin/requestForcedPhotometry.cgi and is uploaded within approximately one hour, depending on the speed of the ZTF forced photometry server171717Previously, YSE-PZ used the “Make Alerts Really Simple” (MARS, from the Las Cumbres Observatory; Brown et al., 2013) broker to perform the same task, but this service has been taken offline by Las Cumbres Observatory at the end of January 2023..
-
8.
Additional photometric and spectroscopic data from individual collaboration follow-up surveys currently using YSE-PZ are continually added to YSE-PZ via private scripts that POST their data through the API. This workflow demonstrates the extensibility of the platform, as well as an example of API-only CRONs referred to in Section 2.3.
While TNS is the primary source for transients to enter the YSE-PZ database, transients can also be directly discovered by collaborations that use YSE-PZ, and ingested via the API (see the YSE Case Study in Section 4). In these cases, YSE-PZ’s API has been designed to match existing transients by position, taking a union of the final objects’ properties while setting the default transient name to the IAU name from TNS.
2.5 Sources of Archival data
Archival data and metadata, including static-sky data and forced photometry, are retrieved for each transient using several public catalogs and image servers. Cutout archival images at the location of each transient are displayed using image servers from SDSS (York et al., 2000), Pan-STARRS (Chambers et al., 2016), the Digitized Sky Survey via Aladin (Bonnarel et al., 2000; Boch & Fernique, 2014), and the DESI Legacy Imaging Surveys (Dey et al., 2019). These data are not stored in the database but can be easily downloaded by the user. Any available HST, Spitzer, and Chandra data are included on each transient detail page (see Section 2.2), and the existence of such archival data from each source is stored in the Transient table to facilitate queries on transients with archival space-based data. Archival Pan-STARRS1 catalog data (Chambers et al., 2016; Flewelling et al., 2020) are also used to determine whether a given transient coincides with a point source (Tachibana & Miller, 2018), indicating a likely flaring star.
2.6 Value-added services
YSE-PZ uses GHOST (Gagliano et al., 2021) to match each transient to its most likely host galaxy; GHOST also measures a photometric redshift via Eazy PhotoZ (Aleo et al., 2022) for each host galaxy from a fully connected, feed-forward neural network algorithm trained on Pan-STARRS data. YSE-PZ also includes interactive plots and plot-anlysis tools. Plotting is performed with Bokeh (Bokeh Development Team, 2018), and interactive SALT3 fitting is performed (Kenworthy et al., 2021) using sncosmo (Barbary et al., 2022). These routines estimate light-curve parameters and approximate times of maximum light under the assumption that a transient is a Type Ia SN. Finder charts for each transient can be generated automatically on request from the user, and airmass plots, target rise/set times, and moon angle information from astroplan (Morris et al., 2018) are also included (see Section 3.3 for a discussion on these features).
2.7 Queries & Tags
All data in the YSE-PZ database can be queried either through the REST API or the Query Explorer. These queries are custom written to meet a user or survey group’s transient science goals. The most-used queries are those that identify recently discovered transients with rising light curves and queries that find unclassified transients in a magnitude- or volume-limited sample. For example, the Keck Infrared Transient Survey (Section 4), uses these queries to identify subsets of transients for follow-up observations. The results of these queries can be displayed on a user’s personal dashboard page or accessed programmatically through the web application itself (see Appendix A for example queries).
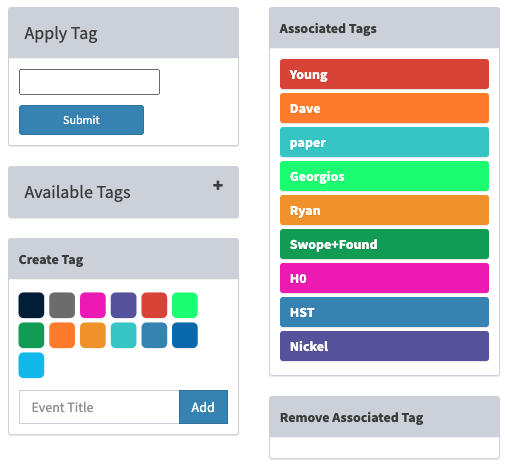
While queries provide a powerful way to interrogate the data, YSE-PZ also enables users to apply customizable tags to objects (see Figure 6). Tags are user-defined, text strings that can be attached as metadata to transients. These tags empower users to create arbitrary groupings of transients, and provides an additional property upon which queries can be built. Tags can also be applied automatically to facilitate data triage from certain sources or science programs.
2.8 Application Programming Interface
YSE-PZ contains two Application Programming Interfaces (APIs), a machine-facing API used to ingest or extract raw data from an authorized user into YSE-PZ’s tables directly, and a user-facing API that allows users to upload data to YSE-PZ through a system of checks and flags that allow data to be created, modified, and deleted while checking for logical inconsistencies and errors like incomplete data, incorrectly formatted data, or duplication. The machine API is provided by a Django plugin module called the Django REST framework, while the user API was written by YSE-PZ developers. Both APIs are easily extensible and continue to evolve as needed to accommodate new science requirements.
2.9 User Groups and Permissions
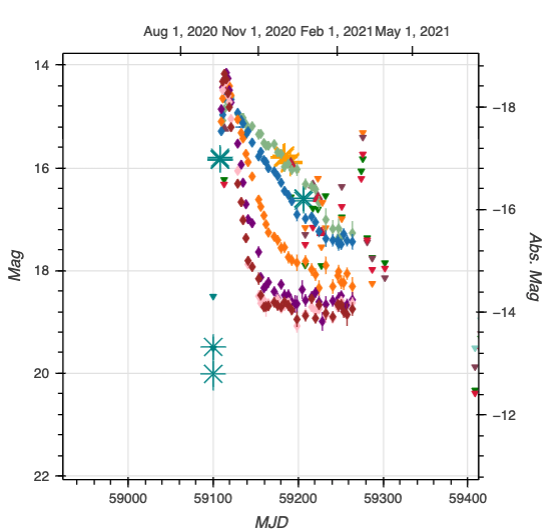
YSE-PZ has been designed to support multiple surveys and collaborations within a single instance. This is accomplished through user-defined “user groups” that can be associated with astronomical data uploaded through the API. Access to these data (both download and display) is then controlled by adding or removing users to specific groups. An example of this data access control is shown in Figure 5.
While user groups offer reasonable control over access to private data, we recommend that if data security is a concern, a separate instance of YSE-PZ be deployed. In this scenario, there is no possibility of one group gaining access to another group’s data on the same system. See Section 5 for a discussion on YSE-PZ deployment approaches.
3 The YSE-PZ transient Lifecyle
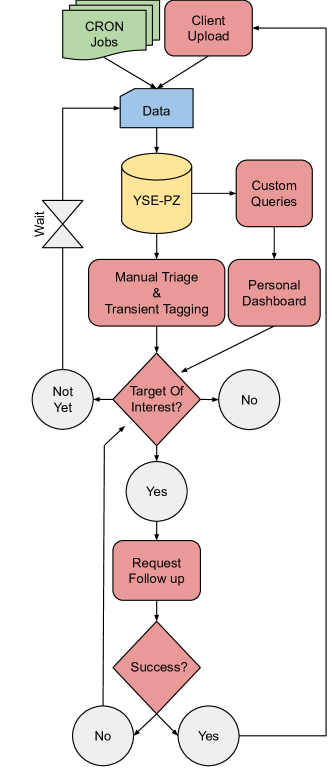
In this section we detail how YSE-PZ is used to triage, analyze, and obtain follow-up data for transients. Figure 7 shows an overview of the entire life cycle of an ingested transient in YSE-PZ. We explain each aspect of the workflow below.
3.1 Manual Triage and Transient Tagging
When transients are first ingested into YSE-PZ, they are given a status of New. As described in Section 2.2, users interact with these transients through a series of dashboards (e.g., Figure 3) with sortable, paginated tables that include redshifts, classifications, Milky Way reddening, last reported magnitudes, and discovery dates for each transient. These provide the user an overview of the data and allow them to easily view and triage new transients.
Though the exact status categories can be altered by the user, our team has found the following status categories to be useful:
-
•
New: a transient that has just entered the system.
-
•
Watch: a transient that could be potentially interesting, but hasn’t risen to the level of being targeted for follow-up observations. Most transients are triaged into this category from their initial status of New.
-
•
Interesting: an interesting transient that may be targeted for follow-up observations.
-
•
Followup Requested: A transient for which a follow-up request has been made.
-
•
Following: a transient actively being followed. At least one observation is necessary for this status to be used.
-
•
Needs Template: a transient with completed follow-up observations, but that require template observations (i.e., observations with no transient flux).
-
•
Followup Finished: a transient whose dedicated follow-up observations have been completed, including template observations.
-
•
Ignore: a transient where no follow-up observations have been obtained and none are expected to be obtained.
These statuses are broadly descriptive enough to organize, track, and act on most transients as they flow through the follow-up process. However, where these metadata states are insufficient, users can create or assign custom metadata tags (see Section 2.7 and Figure 6) to create new groupings of transients.
3.2 Custom Queries and Personal Dashboards
In addition to screening new transients as they are ingested, users can write and execute custom queries as described in Section 2.7, and attach them to their personal dashboards as described at the end of Section 2.2. These queries can be written to select transients based on interesting properties or trends in the data (e.g., rising light curves, close distances, etc.), and offer ways to define scientific samples for further study.
3.3 Requesting and Planning Follow-up Observations
Each transient within YSE-PZ has an automatically generated transient detail page (see Figure 4). Within the detail page, users can navigate to the Follow-up tab which has a series of simple forms to record follow-up requests and to add new observational resources to the system. If a user adds a new resource to the system, it is displayed in a calendar format on the Observing Calendar (see Figure 8).
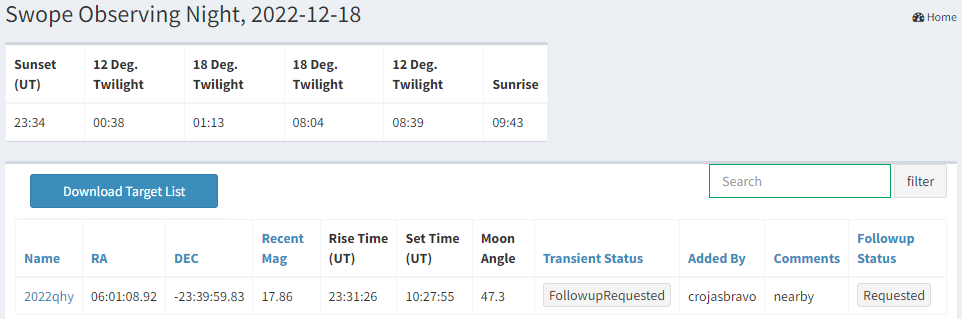
To manually request follow-up observations a user can link one of these resources to the transient. Finder charts and airmass plots, which can be used to vet the feasiblity of a follow-up request, are available on the transient’s detail page under the Resources tab. Once a request is made, a history of all requests, and their statuses (e.g., Requested, Successful, Failed, etc.), are displayed. All requested transients for an observing night are accessible through the observing calendar, and are displayed with interactive dashboards (see Figure 9. Each row of this dashboard contains comments left for the observer and a link back to the transient detail page.
In addition to manual follow-up it is also possible to automatically trigger follow-up observations with YSE-PZ. As mentioned in Section 2.4, API-only CRON jobs can be written to select transients that have been tagged using YSE-PZ’s tagging system (see Section 2.7 and Figure 6), and then inject those transients into third party scripts to trigger queue-based networks like Las Cumbres Observatory’s API (Brown et al., 2013; Nation et al., 2022) or NOIRLab’s AEON network (Briceño & Astronomical Event Observatory Network, 2020).
3.4 Uploading Follow-up Data
Finally, after transient follow-up observations have been successfully obtained a user can upload the data to YSE-PZ via the API. These uploads can be manual, or can be automated by adding an upload stage to an independent data reduction CRON jobs. Once uploaded, the transient detail page can be refreshed to display this new data, and a a user closes the workflow loop shown in Figure 7.
4 Case Studies
The transient life cycle described above is only one of many possible use cases for YSE-PZ. Below, we outline several additional collaboration-level workflows that YSE-PZ’s flexible platform enables.
4.1 Photometric and Spectroscopic Monitoring of Interesting Transients by the UC Santa Cruz Transient Team
Although transient sample sizes are growing exponentially, some of the most interesting questions related to transients are best answered by observing individual, extraordinary events. The University of California, Santa Cruz Transient Team spectroscopically and photometrically monitors dozens of interesting transients simultaneously. We use YSE-PZ to triage all discovered transients, track interesting objects, and schedule follow-up observations. Here, we describe in detail how The University of California Santa Cruz Transient Team uses the triage tags outlined in Section 3.1.
After a transient discovery is announced on TNS, YSE-PZ will ingest the basic information for this transient. Initially, YSE-PZ labels its transient status as New, and it will appear on the dashboard under this category. Some transients are immediately deemed uninteresting (e.g., old discoveries, high Galactic reddening, coincident with a known quasar or Galactic star) and their status is changed to Ignore. A particularly interesting transient will either immediately have follow-up observations requested, at which point its status is automatically updated to Followup Requested, or its status is changed to Interesting. The remaining transients have their statuses changed to Watch.
For the interesting transients, we will usually manually request forced photometry to obtain those data on a timescale faster than the automatic CRON job would provide. Additional examination of data on the detail page will often result in applying user-defined tags (e.g., “Young”).
Either through the main dashboard, where one can sort transients based on the time the last data was obtained, or through the personal dashboard, users can easily monitor these interesting events separately from the bulk of active transients. During normal monitoring or in preparation for a classical observing night, we will use ad hoc queries displayed on the personal dashboard and queries from user-defined tags to select targets for follow-up observations. Some ad hoc queries include targets rising quickly and those with new data within a day of discovery. Useful user-defined tags include “personal” tags for individual users (usually marked by their name) and qualitative information such as those objects for which a paper will be written. We also examine observation requests from previous observing nights to request observations of additional objects.
Once an object has targeted follow-up observations, its status is changed to Following. When we no longer expect to obtain more data for an object, we change the status to either Followup Finished or Needs Template depending on if a template observation is required.
If no targeted follow-up data is obtained and there is no expectation to obtain data, a transient’s status is changed to Ignore. Changing the status not only reduces the number of objects that we are actively monitoring, but also stops now unnecessary CRON jobs executing for that transient (see Section 2.3).
The bulk of transients have a life cycle where their status changes from New to Watch to Ignore; this occurs for thousands of transients each year and requires tools to reduce the workload. Using a query (Section 2.7), we select all transients with a Watch status and where there has been no new data in three weeks. These objects are good candidates for changing their status to Ignore without examining each object in detail. We have a separate query to look at the subset of those objects that might have interesting aspects such as being particularly bright at the time of the last observation. After manually examining the potentially interesting objects (and possibly updating their status to Interesting), we can change all remaining object from the initial query to Ignore in bulk.
4.2 Survey Planning and Operations with YSE
As introduced Section 2.4, YSE is a time-domain survey that combines proprietary Pan-STARRS and other public imaging data, along with significant follow-up resources, to survey a large fraction of the high Galactic latitude Northern sky. For an overview of the survey’s goals and operations, see Jones et al. (2021) and Aleo et al. (2022).
YSE-PZ is an integral part of YSE operations, supporting the survey’s transient discovery process and organizing its transient follow-up observations. YSE relies on complex interfaces between reduced data products (via the Image Processing Pipeline (IPP); Magnier et al., 2020), initial transient vetting (via the Transient Science Server; Smith et al., 2020), and data synthesis via YSE-PZ. Critically, YSE-PZ enables a “secondary” vetting of potential YSE SN discoveries. The YSE survey cannot easily rule out whether a possible transient is a moving object, such as an asteroid, because YSE has just five minutes between its observations in two different filters. To mitigate this, YSE uploads unverified transients into YSE-PZ to cross-match against other public surveys.
Vetting these candidates is made easy through YSE-PZ because observers can search both publicly reported transients at the possible SN location, as well as trigger jobs to download ZTF or ATLAS forced photometry. Furthermore, because YSE-PZ collates a variety of archival data, such as host galaxy redshifts, team members can use queries to identify an approximate luminosity for a given transient and help the team decide if the transient is likely real and/or young. YSE-PZ also uses its record of YSE fields and YSE observations to see if publicly reported transients have YSE imaging at their location and then queries forced photometry at that location via the Pan-STARRS IPP. IPP forced photometry is then added to the YSE database, and can result in recent non-detections that alert the team that a transient is young. By combining these public, private, and archival data streams, YSE-PZ is perfect for this secondary transient vetting, confirming new transient discoveries, and optimizing follow-up decisions.
YSE-PZ is also used to schedule and monitor the status of every Pan-STARRS observation for YSE. YSE-PZ stores each Pan-STARRS observation in a Survey Observation model, which includes the status of each observation (i.e., if it was successfully observed) and important characteristics of each observation (e.g., seeing, airmass, etc.). Team members access these metadata from the API to ensure that future observations meet the desired cadence, filter choice, and moon avoidance criteria, while allowing individual survey images to be inspected for photometric quality. The YSE-PZ data model also contains survey-specific objects to model YSE’s Survey Minimum Schedulable Blocks (SMSBs), which are logical groupings of survey field centers. These MSBs enable YSE observers to dynamically manipulate and schedule groups of survey fields, e.g., to image nearby SNe or galaxies of interest, through an interactive tool within YSE-PZ.
4.3 Query Driven Follow-up Observations with the Keck Infrared Transient Survey
The Keck Infrared Transient Survey (KITS) is a NASA Key Strategic Mission Support program (Programs 2022A_N125, 2022B_N169, 2023A_N040; PI Foley) to usethe Near-InfraRed Echellette Spectrometer (NIRES; Wilson et al., 2004) on the 10-m Keck 2 telescope to obtain, and subsequently make publicly accessible, near-infrared (NIR) spectra of all types of astrophysical transients (Tinyanont et al. in prep.). Specifically, KITS emphasizes observations of rare transients, as well as obtaining spectra of more common transients at epochs with poor existing NIR spectroscopic data, which will be crucial to interpreting James Webb Space Telescope (JWST; Gardner et al., 2006) data of transients at higher redshift. These data will also play a key role in planning future time-domain surveys with the upcoming Nancy Grace Roman Space Telescope (Spergel et al., 2015).
To accomplish these goals, KITS selects targets with three different criteria powered by queries written with YSE-PZ’s Query Explorer: (1) a survey of SNe Ia at phases with poor NIR spectroscopic observations and/or with large host extinction, (2) a magnitude-limited survey of all transients with mag, and (3) a volume-limited survey of transients with . For examples of these queries, see Appendix A.
In addition to defining samples of transients to observe, the KITS team tags every KITS object with a custom tag. This tag makes querying YSE-PZ for all KITS objects simple, and facilitates tracking the progress of the overall survey, generating survey statistics, producing analysis plots, and planning which are observations are needed to maximize the science goals of the survey.
4.4 Making Decisions with Archival, Meta, and Astronomical Data Sources with the Swope Supernova Survey
The Swope Supernova Survey is a time-domain survey that uses the 1-m Swope telescope at Las Campanas Observatory to obtain uBVgri follow-up imaging of SNe and other astrophysical transients (Kilpatrick et al., 2018a). A chief aim of the SSS is to produce a sample of low-redshift, cosmologically useful Type Ia SNe akin to the Foundation Supernova Survey (Foley et al., 2018). YSE-PZ is used to check if the host of the transient is nearby, whether that host has coincident Chandra and HST imaging, and ZTF and ATLAS forced photometry can constrain whether the transient is young. For transients that are assumed to be SN Ias, the SALT3 function on the transient detail page (see Section 2.6) can assess important SN properties like phase and luminosity.
Since 2017, SSS has also searched for the electromagnetic (EM) counterparts to gravitational wave (GW) sources, as a part of the One-Meter Two-Hemispheres (Coulter et al., 2017; Kilpatrick et al., 2017) and the Gravity Collective (Kilpatrick et al., 2021) collaborations. During a search, astronomers do not know when and where to search for EM counterparts beforehand; this information is published by the LIGO-Virgo-KAGRA Collaboration in the form of localization maps. These maps can range in size from tens to thousands of square degrees on the sky (Abbott et al., 2020), and depending on the area, subsequent searches can identify hundreds to thousands of transient candidates a night.
It is crucial to locate EM counterparts to GW sources as quickly as possible to understand their physics because they change on fast timescales (Arcavi, 2018). This urgency means that most candidates can not be vetted before they are reported, so they are reported through messaging networks like the Gamma-Ray Coordinates Network (Barthelmy et al., 1995) and the Astronomer’s Telegram (Rutledge, 1998) instead of the TNS. YSE-PZ’s archival information is key in committing follow-up resources to these candidates. YSE-PZ can be queried to find spatially coincident preexisting transients, candidates can be matched to a host galaxies to estimate their luminosity distance, and forced photometry can reveal pre-GW event variability. If no viable counterparts are discovered, spatial and temporal queries can retrieve all reported candidates (and their data) potentially associated with GW event to rule them out, allowing for search data to be interpreted as upper limits on counterpart models.
5 YSE-PZ and NASA’s Open-Source Science Initiative
Astronomy faces challenges beyond those solely posed by exponentially increasing data volumes. Large transient surveys and their associated software infrastructure (e.g., Alert brokers, TOMs, value-added services) are often sprawling, complex, and difficult to install and run. To ensure that large collaborations run efficiently, that effort is not duplicated, and to broaden collaboration within the scientific community, the way that software is built is increasingly as important as the software itself. In the face of these challenges, NASA has made a long-term commitment to the Open-Source Science Initiative (OSSI)181818https://science.nasa.gov/open-science-overview. with the aim of implementing NASA’s Strategy for Data Management and Computing for Groundbreaking Science191919https://science.nasa.gov/science-red/s3fs-public/atoms/files/SDMWG%20Strategy_Final.pdf. At the heart of the OSSI are four core principles: transparency, accessibility, inclusivity, and reproducibility.
While YSE-PZ was conceived and the initial framework was built before NASA had adopted the OSSI, our initial goals, structures, and development approaches were aligned with its principles, and we now use the OSSI as a guide for our work moving forward. For instance, YSE-PZ is transparent; its code base is open source and developed on Github202020https://github.com/davecoulter. under a GNU General Public License v3.0. YSE-PZ is inclusive; extensive documentation describing how to use the web interface and API, and how to install and develop against the application is hosted by readthedocs212121https://yse-pz.readthedocs.io/en/latest/.. YSE-PZ is accessible and reproducible; its environment has been virtualized and the orchestration between its required services is scripted using Docker (Merkel, 2014). Enabled by Docker, all of YSE-PZ’s required components, i.e., its database, operating systems, standard and customized packages, etc., are packaged together in a way to make the application installable with only a handful of commands222222See https://yse-pz.readthedocs.io/en/latest/install.html for instructions on how to run YSE-PZ using Docker..
Beyond the portability that virtualization affords, having YSE-PZ constructed this way removes the installation and deployment barrier that can stifle new developers from contributing to the project. To increase the transparency and reproducibility of all contributions to YSE-PZ, code is merged through pull requests that include both peer reviews and several automatic and manual tests. Promoting code this way builds confidence that code is of high quality, does what it is intended to do, protects our production environment from preventable bugs, and enhances the application’s stability.
6 Conclusions
In this work we describe the features and implementation of YSE-PZ, a transient survey management platform. We highlight our model of the machine-human workflow used to accumulate data on scientifically interesting transients, and discuss how the design and development operations used to develop YSE-PZ are aligned with the OSSI.
There are currently more than a dozen public, active data sources for transient data. YSE-PZ leverages this public transient survey data by combining sources such as ZTF, ATLAS, ASAS-SN, and Gaia that make the entire photometric transient light curve public, with other surveys that publish the first photometric epochs or provide public transient spectra. YSE-PZ then combines these data with private transient data obtained by individual transient science teams.
YSE-PZ has a flexible data model for ingesting these data from multiple data streams. Data can be easily displayed, queried or downloaded, and the database itself can be queried to search for transients that display certain photometric or spectroscopic behavior. Archival data and contextual metadata is combined as part of the data model to allow a holistic picture of each transient.
YSE-PZ also addresses the challenge of optimizing follow-up resources for a given transient science case. Transient science goals require incorporating considerations such as the brightness of the transient versus the size of the follow-up telescope, the latency of follow-up observations compared to how fast the transient is evolving, the wavelength/frequency range at which the transient must be observed, and the priority of the observations versus the time remaining in a given program.
YSE-PZ addresses these issues by storing each available observing resource and observing night in the database, and listing all facilities in a calendar page. Users request transients for follow-up observations, with comments that motivate the follow-up request, and the list of transients requested for each resource and observing night are listed on an observing night’s detail page.
Although YSE-PZ’s design is effective for the data volume from current ongoing surveys, the next generation of surveys will present new challenges for our transient management workflows. Current data streams are small enough to allow the human-machine workflow shown in Figure 7 to select individual scientifically interesting transients to be followed (see Appendix B for a list of publications enabled by YSE-PZ) and to build scientifically useful samples of transients (e.g., Aleo et al., 2022). However, for next-generation, high-volume transient surveys such as LSST which will find 105 bone fide transients a year — at least a 6-fold increase in our current data ingestion rate — further workflow automation will become increasingly necessary. Despite this, humans will always be more flexible than static code routines and may always be required to manually request follow-up observations on high-value resources; therefore, this next generation of infrastructure needs to do more than simply remove “human bottlenecks” and instead empower humans to make effective decisions in real-time.
Realizing the scientific potential of these data will require a corresponding investment in infrastructure tools. YSE-PZ is poised to meet these challenges by incorporating new technologies that will reconcile automation with human-centered decision-making processes. New messaging protocols like Apache Kafka232323https://kafka.apache.org/ are moving the astronomical community toward a “publication-subscription” model of information ingestion; YSE-PZ will adapt and enable users to subscribe to alert streams from any astronomical data broker with customizable filters. YSE-PZ will also continue to take advantage of machine-learning advances in automatic transient classification (e.g., Boone, 2021; Burhanudin & Maund, 2022), and could be combined with citizen science platforms (e.g., Christy et al., 2022; Zevin et al., 2017) to further empower, or even optimize (e.g., Walmsley et al., 2020; Wright et al., 2017), robust human-in-the-loop decision making at scale.
Appendix A Example database queries
This section contains example queries which can be run from the MySQL Explorer interface by a user and shows how transients of interest can be selected. A more extensive list of query examples can be found in YSE-PZ’s documentation.242424https://yse-pz.readthedocs.io/en/latest/queries.html
A.1 Selecting volume-limited and recently discovered SNe Ia
The query below selects SNe Ia discovered within the last 356 days with either a transient or host redshift . The names of the transients meeting this criteria are returned in descending order of their discovery date. In the query below disc_date is the transient discovery data, photo_z is the host photometric redshift, and TNS_spec_class is the spectroscopic classification from the transient name server.
SELECT
    DISTINCT transient.name, transient.disc_date
FROM YSE_App_transient transient
LEFT JOIN YSE_App_host host ON host.id = transient.host_id
WHERE
    (transient.redshift OR host.redshift OR host.photo_z) IS NOT NULL
    AND COALESCE(transient.redshift, host.redshift, host.photo_z) <= 0.03
    AND DATEDIFF(curdate(),transient.disc_date) < 365
    AND transient.TNS_spec_class LIKE ’%Ia%’
ORDER BY
    transient.disc_date DESC;
A.2 Selecting new southern and unclassified transients
The query below selects the names of new transients which are spectroscopically unclassified (TNS_spec_class is NULL), in the southern sky (dec), have a flux signal-to-noise of 2 (flux/flux_err >= 2), a magnitude error (mag_err < 1.0), and the current day to be and days from the first and latest distinct detections, respectively. The names of the transients are returned in descending order of first detection.
WITH TransientStats AS
(
    SELECT
        t.id,
        t.‘name‘,
        MIN(pd.obs_date) AS ‘first_detection‘,
        MAX(pd.obs_date) AS ‘latest_detection‘,
        COUNT(pd.obs_date) AS ‘number_of_detection‘
    FROM YSE_App_transient t
    JOIN YSE_App_transientphotometry tp ON tp.transient_id = t.id
    JOIN YSE_App_transientphotdata pd ON pd.photometry_id = tp.id
    WHERE
        (pd.flux/pd.flux_err) >= 2 AND
        pd.mag_err < 1.0 AND
        t.TNS_spec_class IS NULL AND
        t.dec <= -30
    GROUP BY
        t.id
)
SELECT
    ‘name‘
FROM
    TransientStats ts
WHERE
    TO_DAYS(CURDATE())- TO_DAYS(first_detection) < 21 AND
    TO_DAYS(CURDATE())- TO_DAYS(latest_detection) < 7 AND
    TO_DAYS(latest_detection) - TO_DAYS(first_detection) > 0.01 AND
    number_of_detection > 1
ORDER BY
    first_detection DESC;
A.3 Selecting a magnitude-limited sample
SELECT
    DISTINCT t.name,
    t.ra,
    t.‘dec‘
FROM YSE_App_transient t, YSE_App_transientphotdata pd, YSE_App_transientphotometry p
WHERE
    pd.photometry_id = p.id AND
    pd.id = (
        SELECT
            pd2.id
        FROM YSE_App_transientphotdata pd2,     YSE_App_transientphotometry p2
        WHERE
            pd2.photometry_id = p2.id AND
            p2.transient_id = t.id AND
            ISNULL(pd2.mag) = False AND
            pd2.flux/pd2.flux_err > 3
        ORDER BY
            pd2.mag ASC
         LIMIT 1
     ) AND

  pd.mag < 17 AND
  t.‘dec‘ > -30 AND
  (t.name LIKE ’202%’ OR t.name LIKE ’201%’) AND
  DATEDIFF(curdate(),t.disc_date) < 365 AND
  t.TNS_spec_class is not NULL AND
  t.TNS_spec_class != ’CV’ AND
  t.TNS_spec_class != ’SN Ia’;
Appendix B Publications enabled by YSE-PZ
A non-exhaustive search of the literature reveals that YSE-PZ has enabled the following publications in some capacity: Fulton et al. (2023), Angus et al. (2022), Aleo et al. (2022), Davis et al. (2022), Ward et al. (2022), Kilpatrick et al. (2022), Pastorello et al. (2022), Jacobson-Galán et al. (2022b), Tinyanont et al. (2022), Dimitriadis et al. (2022), Gagliano et al. (2022), Jacobson-Galán et al. (2022a), Dettman et al. (2021), Kilpatrick et al. (2021), Wang et al. (2021), Armstrong et al. (2021), Jencson et al. (2021), Barna et al. (2021), Jones et al. (2021), Hinkle et al. (2021), Holoien et al. (2020), Hung et al. (2020), Jacobson-Galán et al. (2020a), Jacobson-Galán et al. (2020b), Neustadt et al. (2020), Dimitriadis et al. (2019), Jones et al. (2019), Li et al. (2019), Kilpatrick et al. (2018a), Kilpatrick et al. (2018b), Tartaglia et al. (2018).
References
- Abadi et al. (2016) Abadi, M., Agarwal, A., Barham, P., et al. 2016, arXiv e-prints, arXiv:1603.04467, doi: 10.48550/arXiv.1603.04467
- Abbott et al. (2020) Abbott, B. P., Abbott, R., Abbott, T. D., et al. 2020, Living Reviews in Relativity, 23, 3, doi: 10.1007/s41114-020-00026-9
- Aldering et al. (2002) Aldering, G., Adam, G., Antilogus, P., et al. 2002, in Society of Photo-Optical Instrumentation Engineers (SPIE) Conference Series, Vol. 4836, Survey and Other Telescope Technologies and Discoveries, ed. J. A. Tyson & S. Wolff, 61–72, doi: 10.1117/12.458107
- Aleo et al. (2022) Aleo, P. D., Malanchev, K., Sharief, S., et al. 2022, arXiv e-prints, arXiv:2211.07128. https://arxiv.org/abs/2211.07128
- Angus et al. (2022) Angus, C. R., Baldassare, V. F., Mockler, B., et al. 2022, Nature Astronomy, 6, 1452, doi: 10.1038/s41550-022-01811-y
- Arcavi (2018) Arcavi, I. 2018, ApJ, 855, L23, doi: 10.3847/2041-8213/aab267
- Armstrong et al. (2021) Armstrong, P., Tucker, B. E., Rest, A., et al. 2021, MNRAS, 507, 3125, doi: 10.1093/mnras/stab2138
- Astier et al. (2006) Astier, P., Guy, J., Regnault, N., et al. 2006, A&A, 447, 31, doi: 10.1051/0004-6361:20054185
- Astropy Collaboration et al. (2013) Astropy Collaboration, Robitaille, T. P., Tollerud, E. J., et al. 2013, A&A, 558, A33, doi: 10.1051/0004-6361/201322068
- Astropy Collaboration et al. (2018) Astropy Collaboration, Price-Whelan, A. M., Sipőcz, B. M., et al. 2018, AJ, 156, 123, doi: 10.3847/1538-3881/aabc4f
- Barbary et al. (2022) Barbary, K., Bailey, S., Barentsen, G., et al. 2022, SNCosmo, v2.8.0, Zenodo, Zenodo, doi: 10.5281/zenodo.6363879
- Barna et al. (2021) Barna, B., Szalai, T., Jha, S. W., et al. 2021, MNRAS, 501, 1078, doi: 10.1093/mnras/staa3543
- Barthelmy et al. (1995) Barthelmy, S. D., Butterworth, P., Cline, T. L., et al. 1995, Ap&SS, 231, 235, doi: 10.1007/BF00658623
- Bellm et al. (2019) Bellm, E. C., Kulkarni, S. R., Graham, M. J., et al. 2019, PASP, 131, 018002, doi: 10.1088/1538-3873/aaecbe
- Bloom et al. (2012) Bloom, J. S., Kasen, D., Shen, K. J., et al. 2012, ApJ, 744, L17, doi: 10.1088/2041-8205/744/2/L17
- Boch & Fernique (2014) Boch, T., & Fernique, P. 2014, in Astronomical Society of the Pacific Conference Series, Vol. 485, Astronomical Data Analysis Software and Systems XXIII, ed. N. Manset & P. Forshay, 277
- Bokeh Development Team (2018) Bokeh Development Team. 2018, Bokeh: Python library for interactive visualization. https://bokeh.pydata.org/en/latest/
- Bonnarel et al. (2000) Bonnarel, F., Fernique, P., Bienaymé, O., et al. 2000, A&AS, 143, 33, doi: 10.1051/aas:2000331
- Boone (2021) Boone, K. 2021, AJ, 162, 275, doi: 10.3847/1538-3881/ac2a2d
- Boubert et al. (2020) Boubert, D., Everall, A., & Holl, B. 2020, MNRAS, 497, 1826, doi: 10.1093/mnras/staa2050
- Bradley et al. (2022) Bradley, L., Sipőcz, B., Robitaille, T., et al. 2022, astropy/photutils: 1.5.0, 1.5.0, Zenodo, Zenodo, doi: 10.5281/zenodo.6825092
- Briceño & Astronomical Event Observatory Network (2020) Briceño, C., & Astronomical Event Observatory Network. 2020, The NOIRLab Mirror, 1, 52
- Brown et al. (2013) Brown, T. M., Baliber, N., Bianco, F. B., et al. 2013, PASP, 125, 1031, doi: 10.1086/673168
- Burhanudin & Maund (2022) Burhanudin, U. F., & Maund, J. R. 2022, MNRAS, doi: 10.1093/mnras/stac3672
- Chambers et al. (2016) Chambers, K. C., Magnier, E. A., Metcalfe, N., et al. 2016, arXiv e-prints, arXiv:1612.05560, doi: 10.48550/arXiv.1612.05560
- Chollet & others (2018) Chollet, F., & others. 2018, Keras: The Python Deep Learning library, Astrophysics Source Code Library, record ascl:1806.022. http://ascl.net/1806.022
- Christy et al. (2022) Christy, C. T., Jayasinghe, T., Stanek, K. Z., et al. 2022, PASP, 134, 024201, doi: 10.1088/1538-3873/ac44f0
- Coulter et al. (2017) Coulter, D. A., Foley, R. J., Kilpatrick, C. D., et al. 2017, Science, 358, 1556, doi: 10.1126/science.aap9811
- Coulter et al. (2022) Coulter, D. A., Jones, D. O., McGill, P., et al. 2022, YSE-PZ: An Open-source Target and Observation Management System, v0.3.0, Zenodo, Zenodo, doi: 10.5281/zenodo.7278430
- Davis et al. (2022) Davis, K. W., Taggart, K., Tinyanont, S., et al. 2022, arXiv e-prints, arXiv:2211.05134, doi: 10.48550/arXiv.2211.05134
- Dembinski et al. (2022) Dembinski, H., Ongmongkolkul, P., Deil, C., et al. 2022, scikit-hep/iminuit: v2.17.0, v2.17.0, Zenodo, Zenodo, doi: 10.5281/zenodo.7115916
- Dettman et al. (2021) Dettman, K. G., Jha, S. W., Dai, M., et al. 2021, ApJ, 923, 267, doi: 10.3847/1538-4357/ac2ee5
- Dey et al. (2019) Dey, A., Schlegel, D. J., Lang, D., et al. 2019, AJ, 157, 168, doi: 10.3847/1538-3881/ab089d
- Dimitriadis et al. (2019) Dimitriadis, G., Foley, R. J., Rest, A., et al. 2019, ApJ, 870, L1, doi: 10.3847/2041-8213/aaedb0
- Dimitriadis et al. (2022) Dimitriadis, G., Foley, R. J., Arendse, N., et al. 2022, ApJ, 927, 78, doi: 10.3847/1538-4357/ac4780
- Drake et al. (2009) Drake, A. J., Djorgovski, S. G., Mahabal, A., et al. 2009, ApJ, 696, 870, doi: 10.1088/0004-637X/696/1/870
- Filippenko et al. (2001) Filippenko, A. V., Li, W. D., Treffers, R. R., & Modjaz, M. 2001, in Astronomical Society of the Pacific Conference Series, Vol. 246, IAU Colloq. 183: Small Telescope Astronomy on Global Scales, ed. B. Paczynski, W.-P. Chen, & C. Lemme, 121
- Flewelling et al. (2020) Flewelling, H. A., Magnier, E. A., Chambers, K. C., et al. 2020, ApJS, 251, 7, doi: 10.3847/1538-4365/abb82d
- Foley et al. (2018) Foley, R. J., Scolnic, D., Rest, A., et al. 2018, MNRAS, 475, 193, doi: 10.1093/mnras/stx3136
- Förster et al. (2021) Förster, F., Cabrera-Vives, G., Castillo-Navarrete, E., et al. 2021, AJ, 161, 242, doi: 10.3847/1538-3881/abe9bc
- Frieman et al. (2008) Frieman, J. A., Bassett, B., Becker, A., et al. 2008, AJ, 135, 338, doi: 10.1088/0004-6256/135/1/338
- Fulton et al. (2023) Fulton, M. D., Smartt, S. J., Rhodes, L., et al. 2023, arXiv e-prints, arXiv:2301.11170, doi: 10.48550/arXiv.2301.11170
- Gagliano et al. (2021) Gagliano, A., Narayan, G., Engel, A., Carrasco Kind, M., & LSST Dark Energy Science Collaboration. 2021, ApJ, 908, 170, doi: 10.3847/1538-4357/abd02b
- Gagliano et al. (2022) Gagliano, A., Izzo, L., Kilpatrick, C. D., et al. 2022, ApJ, 924, 55, doi: 10.3847/1538-4357/ac35ec
- Gal-Yam et al. (2014) Gal-Yam, A., Arcavi, I., Ofek, E. O., et al. 2014, Nature, 509, 471, doi: 10.1038/nature13304
- Gardner et al. (2006) Gardner, J. P., Mather, J. C., Clampin, M., et al. 2006, Space Sci. Rev., 123, 485, doi: 10.1007/s11214-006-8315-7
- Ginsburg et al. (2019) Ginsburg, A., Sipőcz, B. M., Brasseur, C. E., et al. 2019, AJ, 157, 98, doi: 10.3847/1538-3881/aafc33
- Goldstein et al. (2015) Goldstein, D. A., D’Andrea, C. B., Fischer, J. A., et al. 2015, AJ, 150, 82, doi: 10.1088/0004-6256/150/3/82
- Górski et al. (2005) Górski, K. M., Hivon, E., Banday, A. J., et al. 2005, ApJ, 622, 759, doi: 10.1086/427976
- Graham et al. (2014) Graham, M., Plante, R., Tody, D., & Fitzpatrick, M. 2014, PyVO: Python access to the Virtual Observatory, Astrophysics Source Code Library, record ascl:1402.004. http://ascl.net/1402.004
- Green (2002) Green, D. W. E. 2002, Central Bureau Electronic Telegrams, 1, 1
- Green (2018) Green, G. 2018, The Journal of Open Source Software, 3, 695, doi: 10.21105/joss.00695
- Harris et al. (2020) Harris, C. R., Millman, K. J., van der Walt, S. J., et al. 2020, Nature, 585, 357, doi: 10.1038/s41586-020-2649-2
- Hinkle et al. (2021) Hinkle, J. T., Holoien, T. W. S., Auchettl, K., et al. 2021, MNRAS, 500, 1673, doi: 10.1093/mnras/staa3170
- Hodgkin et al. (2021) Hodgkin, S. T., Harrison, D. L., Breedt, E., et al. 2021, A&A, 652, A76, doi: 10.1051/0004-6361/202140735
- Holoien et al. (2020) Holoien, T. W. S., Auchettl, K., Tucker, M. A., et al. 2020, ApJ, 898, 161, doi: 10.3847/1538-4357/ab9f3d
- Hosseinzadeh et al. (2017) Hosseinzadeh, G., Sand, D. J., Valenti, S., et al. 2017, ApJ, 845, L11, doi: 10.3847/2041-8213/aa8402
- Howell & Global Supernova Project (2017) Howell, D. A., & Global Supernova Project. 2017, in American Astronomical Society Meeting Abstracts, Vol. 230, American Astronomical Society Meeting Abstracts #230, 318.03
- Huber et al. (2015) Huber, M., Carter Chambers, K., Flewelling, H., et al. 2015, in IAU General Assembly, Vol. 29, 2258303
- Hung et al. (2020) Hung, T., Foley, R. J., Ramirez-Ruiz, E., et al. 2020, ApJ, 903, 31, doi: 10.3847/1538-4357/abb606
- Hunter (2007) Hunter, J. D. 2007, Computing in Science & Engineering, 9, 90, doi: 10.1109/MCSE.2007.55
- Jacobson-Galán et al. (2020a) Jacobson-Galán, W. V., Margutti, R., Kilpatrick, C. D., et al. 2020a, ApJ, 898, 166, doi: 10.3847/1538-4357/ab9e66
- Jacobson-Galán et al. (2020b) —. 2020b, ApJ, 898, 166, doi: 10.3847/1538-4357/ab9e66
- Jacobson-Galán et al. (2022a) Jacobson-Galán, W. V., Dessart, L., Jones, D. O., et al. 2022a, ApJ, 924, 15, doi: 10.3847/1538-4357/ac3f3a
- Jacobson-Galán et al. (2022b) Jacobson-Galán, W. V., Venkatraman, P., Margutti, R., et al. 2022b, ApJ, 932, 58, doi: 10.3847/1538-4357/ac67dc
- Jencson et al. (2021) Jencson, J. E., Andrews, J. E., Bond, H. E., et al. 2021, ApJ, 920, 127, doi: 10.3847/1538-4357/ac1424
- Jones et al. (2019) Jones, D. O., Scolnic, D. M., Foley, R. J., et al. 2019, ApJ, 881, 19, doi: 10.3847/1538-4357/ab2bec
- Jones et al. (2021) Jones, D. O., Foley, R. J., Narayan, G., et al. 2021, ApJ, 908, 143, doi: 10.3847/1538-4357/abd7f5
- Kasliwal et al. (2019) Kasliwal, M. M., Cannella, C., Bagdasaryan, A., et al. 2019, PASP, 131, 038003, doi: 10.1088/1538-3873/aafbc2
- Kenworthy et al. (2021) Kenworthy, W. D., Jones, D. O., Dai, M., et al. 2021, ApJ, 923, 265, doi: 10.3847/1538-4357/ac30d8
- Kilpatrick et al. (2022) Kilpatrick, C. D., Coulter, D. A., Foley, R. J., et al. 2022, ApJ, 936, 111, doi: 10.3847/1538-4357/ac8a4c
- Kilpatrick et al. (2017) Kilpatrick, C. D., Foley, R. J., Kasen, D., et al. 2017, Science, 358, 1583, doi: 10.1126/science.aaq0073
- Kilpatrick et al. (2018a) Kilpatrick, C. D., Foley, R. J., Drout, M. R., et al. 2018a, MNRAS, 473, 4805, doi: 10.1093/mnras/stx2675
- Kilpatrick et al. (2018b) Kilpatrick, C. D., Coulter, D. A., Dimitriadis, G., et al. 2018b, MNRAS, 481, 4123, doi: 10.1093/mnras/sty2503
- Kilpatrick et al. (2021) Kilpatrick, C. D., Coulter, D. A., Arcavi, I., et al. 2021, ApJ, 923, 258, doi: 10.3847/1538-4357/ac23c6
- Law et al. (2009) Law, N. M., Kulkarni, S. R., Dekany, R. G., et al. 2009, PASP, 121, 1395, doi: 10.1086/648598
- Li et al. (2019) Li, W., Wang, X., Vinkó, J., et al. 2019, ApJ, 870, 12, doi: 10.3847/1538-4357/aaec74
- Lipunov et al. (2010) Lipunov, V., Kornilov, V., Gorbovskoy, E., et al. 2010, Advances in Astronomy, 2010, 349171, doi: 10.1155/2010/349171
- LSST Science Collaboration et al. (2009) LSST Science Collaboration, Abell, P. A., Allison, J., et al. 2009, arXiv e-prints, arXiv:0912.0201, doi: 10.48550/arXiv.0912.0201
- Magnier et al. (2020) Magnier, E. A., Chambers, K. C., Flewelling, H. A., et al. 2020, ApJS, 251, 3, doi: 10.3847/1538-4365/abb829
- Malanchev et al. (2022) Malanchev, K., Kornilov, M. V., Pruzhinskaya, M. V., et al. 2022, arXiv e-prints, arXiv:2211.07605. https://arxiv.org/abs/2211.07605
- Marion et al. (2016) Marion, G. H., Brown, P. J., Vinkó, J., et al. 2016, ApJ, 820, 92, doi: 10.3847/0004-637X/820/2/92
- Matheson et al. (2021) Matheson, T., Stubens, C., Wolf, N., et al. 2021, AJ, 161, 107, doi: 10.3847/1538-3881/abd703
- Merkel (2014) Merkel, D. 2014, Linux J., 2014
- Miller et al. (2020) Miller, A. A., Yao, Y., Bulla, M., et al. 2020, ApJ, 902, 47, doi: 10.3847/1538-4357/abb13b
- Modjaz et al. (2009) Modjaz, M., Li, W., Butler, N., et al. 2009, ApJ, 702, 226, doi: 10.1088/0004-637X/702/1/226
- Möller et al. (2021) Möller, A., Peloton, J., Ishida, E. E. O., et al. 2021, MNRAS, 501, 3272, doi: 10.1093/mnras/staa3602
- Morris et al. (2018) Morris, B. M., Tollerud, E., Sipőcz, B., et al. 2018, AJ, 155, 128, doi: 10.3847/1538-3881/aaa47e
- Nation et al. (2022) Nation, J., Bowman, M., Daily, M., et al. 2022, in Society of Photo-Optical Instrumentation Engineers (SPIE) Conference Series, Vol. 12186, Observatory Operations: Strategies, Processes, and Systems IX, ed. D. S. Adler, R. L. Seaman, & C. R. Benn, 121860Q, doi: 10.1117/12.2629809
- Neustadt et al. (2020) Neustadt, J. M. M., Holoien, T. W. S., Kochanek, C. S., et al. 2020, MNRAS, 494, 2538, doi: 10.1093/mnras/staa859
- Nordin et al. (2019) Nordin, J., Brinnel, V., van Santen, J., et al. 2019, A&A, 631, A147, doi: 10.1051/0004-6361/201935634
- Ofek et al. (2010) Ofek, E. O., Rabinak, I., Neill, J. D., et al. 2010, ApJ, 724, 1396, doi: 10.1088/0004-637X/724/2/1396
- Pastorello et al. (2022) Pastorello, A., Valerin, G., Fraser, M., et al. 2022, arXiv e-prints, arXiv:2208.02782, doi: 10.48550/arXiv.2208.02782
- Pedregosa et al. (2011) Pedregosa, F., Varoquaux, G., Gramfort, A., et al. 2011, Journal of Machine Learning Research, 12, 2825
- Rau et al. (2009) Rau, A., Kulkarni, S. R., Law, N. M., et al. 2009, PASP, 121, 1334, doi: 10.1086/605911
- Rutledge (1998) Rutledge, R. E. 1998, PASP, 110, 754, doi: 10.1086/316184
- Saha et al. (2014) Saha, A., Matheson, T., Snodgrass, R., et al. 2014, in Society of Photo-Optical Instrumentation Engineers (SPIE) Conference Series, Vol. 9149, Observatory Operations: Strategies, Processes, and Systems V, ed. A. B. Peck, C. R. Benn, & R. L. Seaman, 914908, doi: 10.1117/12.2056988
- Shappee et al. (2014) Shappee, B. J., Prieto, J. L., Grupe, D., et al. 2014, ApJ, 788, 48, doi: 10.1088/0004-637X/788/1/48
- Shappee et al. (2019) Shappee, B. J., Holoien, T. W. S., Drout, M. R., et al. 2019, ApJ, 870, 13, doi: 10.3847/1538-4357/aaec79
- Shingles et al. (2021) Shingles, L., Smith, K. W., Young, D. R., et al. 2021, Transient Name Server AstroNote, 7, 1
- Smartt et al. (2015) Smartt, S. J., Valenti, S., Fraser, M., et al. 2015, A&A, 579, A40, doi: 10.1051/0004-6361/201425237
- Smith & Gray (2018) Smith, D. G. A., & Gray, J. 2018, Journal of Open Source Software, 3, 753, doi: 10.21105/joss.00753
- Smith et al. (2020) Smith, K. W., Smartt, S. J., Young, D. R., et al. 2020, PASP, 132, 085002, doi: 10.1088/1538-3873/ab936e
- Smith et al. (2002) Smith, R. C., Aguilera, C., Krisciunas, K., et al. 2002, in American Astronomical Society Meeting Abstracts, Vol. 201, American Astronomical Society Meeting Abstracts, 78.08
- Soderberg et al. (2008) Soderberg, A. M., Berger, E., Page, K. L., et al. 2008, Nature, 453, 469, doi: 10.1038/nature06997
- Spergel et al. (2015) Spergel, D., Gehrels, N., Baltay, C., et al. 2015, arXiv e-prints, arXiv:1503.03757, doi: 10.48550/arXiv.1503.03757
- Sternberg et al. (2011) Sternberg, A., Gal-Yam, A., Simon, J. D., et al. 2011, Science, 333, 856, doi: 10.1126/science.1203836
- Street et al. (2018) Street, R. A., Bowman, M., Saunders, E. S., & Boroson, T. 2018, in Society of Photo-Optical Instrumentation Engineers (SPIE) Conference Series, Vol. 10707, Software and Cyberinfrastructure for Astronomy V, ed. J. C. Guzman & J. Ibsen, 1070711, doi: 10.1117/12.2312293
- Tachibana & Miller (2018) Tachibana, Y., & Miller, A. A. 2018, PASP, 130, 128001, doi: 10.1088/1538-3873/aae3d9
- Tartaglia et al. (2018) Tartaglia, L., Sand, D. J., Valenti, S., et al. 2018, ApJ, 853, 62, doi: 10.3847/1538-4357/aaa014
- Team (2022) Team, T. P. D. 2022, pandas-dev/pandas: Pandas, v1.5.2, Zenodo, Zenodo, doi: 10.5281/zenodo.7344967
- Terreran et al. (2022) Terreran, G., Jacobson-Galán, W. V., Groh, J. H., et al. 2022, ApJ, 926, 20, doi: 10.3847/1538-4357/ac3820
- The HDF Group (1997) The HDF Group. 1997, Hierarchical Data Format, version 5
- Tinyanont et al. (2022) Tinyanont, S., Ridden-Harper, R., Foley, R. J., et al. 2022, MNRAS, 512, 2777, doi: 10.1093/mnras/stab2887
- Tonry et al. (2018) Tonry, J. L., Denneau, L., Heinze, A. N., et al. 2018, PASP, 130, 064505, doi: 10.1088/1538-3873/aabadf
- Tsapras et al. (2009) Tsapras, Y., Street, R., Horne, K., et al. 2009, Astronomische Nachrichten, 330, 4, doi: 10.1002/asna.200811130
- Van Kemenade et al. (2022) Van Kemenade, H., Murray, A., Wiredfool, et al. 2022, python-pillow/Pillow: 9.2.0, 9.2.0, Zenodo, Zenodo, doi: 10.5281/zenodo.6788304
- Van Kerkwijk (2021) Van Kerkwijk, M. 2021, liberfa/pyerfa: v2.0.0, v2.0.0, Zenodo, Zenodo, doi: 10.5281/zenodo.3940698
- Virtanen et al. (2020) Virtanen, P., Gommers, R., Oliphant, T. E., et al. 2020, Nature Methods, 17, 261, doi: 10.1038/s41592-019-0686-2
- Walmsley et al. (2020) Walmsley, M., Smith, L., Lintott, C., et al. 2020, MNRAS, 491, 1554, doi: 10.1093/mnras/stz2816
- Wang et al. (2021) Wang, Q., Rest, A., Zenati, Y., et al. 2021, ApJ, 923, 167, doi: 10.3847/1538-4357/ac2c84
- Ward et al. (2022) Ward, S. M., Thorp, S., Mandel, K. S., et al. 2022, arXiv e-prints, arXiv:2209.10558, doi: 10.48550/arXiv.2209.10558
- Waskom (2021) Waskom, M. L. 2021, Journal of Open Source Software, 6, 3021, doi: 10.21105/joss.03021
- Wilson et al. (2004) Wilson, J. C., Henderson, C. P., Herter, T. L., et al. 2004, in Society of Photo-Optical Instrumentation Engineers (SPIE) Conference Series, Vol. 5492, Ground-based Instrumentation for Astronomy, ed. A. F. M. Moorwood & M. Iye, 1295–1305, doi: 10.1117/12.550925
- Wright et al. (2017) Wright, D. E., Lintott, C. J., Smartt, S. J., et al. 2017, MNRAS, 472, 1315, doi: 10.1093/mnras/stx1812
- Yang et al. (2020) Yang, Y., Hoeflich, P., Baade, D., et al. 2020, ApJ, 902, 46, doi: 10.3847/1538-4357/aba759
- York et al. (2000) York, D. G., Adelman, J., Anderson, John E., J., et al. 2000, AJ, 120, 1579, doi: 10.1086/301513
- Zevin et al. (2017) Zevin, M., Coughlin, S., Bahaadini, S., et al. 2017, Classical and Quantum Gravity, 34, 064003, doi: 10.1088/1361-6382/aa5cea
- Zonca et al. (2019) Zonca, A., Singer, L., Lenz, D., et al. 2019, Journal of Open Source Software, 4, 1298, doi: 10.21105/joss.01298