Likes and Fragments: Examining Perceptions of Time Spent on TikTok
Abstract
Researchers use information about the amount of time people spend on digital media for a variety of purposes including to understand impacts on physical and mental health as well as attention and learning. To measure time spent on digital media, participants’ self-estimation is a common alternative method if the platform does not allow external access to directly measure people’s time spent. However, prior work raises questions about the accuracy of self-reports of time spent on traditional social media platforms and questions about the cognitive factors underlying people’s perceptions of the time they spend on social media. In this work, we build on this body of literature by exploring a novel social platform: TikTok. We conduct platform-independent measurements of people’s self-reported and server-logged TikTok usage (n=255) to understand how users’ demographics and platform engagement influence their perceptions of the time they spend on the platform and the accuracy of their estimates. Our work adds to the body of work seeking to understand time estimations in different digital contexts, and identifies new engagement factors that may be relevant in future social media time estimation studies.
Introduction
Assessing users’ digital media use has been of interest to researchers across disciplines. Digital media use has been connected to users’ psychological well-being (e.g., Valkenburg 2021; Schønning et al. 2020; Lee et al. 2014), cognitive processes like attention and learning (e.g., Ra et al. 2018), and physical outcomes (e.g., Orzech et al. 2016; Zeeni et al. 2018; Garett, Liu, and Young 2018). The popularity of digital platforms and services like social media underpin the importance for a deeper understanding of the implications of digital media use. Measuring digital media use accurately, however, remains a challenge.
Most social media research relies on self-reported estimates of usage by participants (Griffioen et al. 2020). Yet, participants’ self-reports of their time spent on digital media are frequently inaccurate (Parry et al. 2021). Little is known about the cognitive processes behind this phenomenon, with psychology and media scholars speculating that factors like memory (Schwarz and Oyserman 2001; Larson and von Eye 2006), reporting bias from personal and societal views of social media (Lee, Katz, and Hancock 2021; Junco 2013; Podsakoff et al. 2003), or interpretability issues within question wording or other aspects of study design (Schwarz and Oyserman 2001; Ernala et al. 2020; Junco 2013; Mieczkowski, Lee, and Hancock 2020) are at play. Advances in technology allowing researchers to compare self-report estimates from participants to their actual logged usage, such as screen time trackers, have shed more light on time estimation inaccuracies in digital media; prior work has found that users inaccurately report their time spent on the internet (Scharkow 2016; Araujo et al. 2017), using mobile phones (Sewall et al. 2020; Ellis et al. 2019; Ohme et al. 2020), and on social media platforms (Sewall et al. 2020; Verbeij et al. 2021; Ernala et al. 2020; Verbeij et al. 2022; Boyle et al. 2022; Burnell et al. 2021; Junco 2013; Rozgonjuk et al. 2020). This logged data cannot be obtained by researchers externally, and must be shared by participants. Through analysis of self-reported time estimations and logged usage data, researchers have been able to determine potentially relevant demographic, usage and context-based factors that impact users’ self-reporting accuracy.
Though time estimation research has been explored in the context of different social media platforms such as Facebook, Snapchat and Instagram, research has yet to explore how users estimate their time on TikTok. TikTok, a relatively new and highly popular social media platform (Ruby 2022), differentiates itself from other platforms by centering the user experience almost entirely on short-form video content (Montenegro 2021). The content is selected and served to users via a content recommendation system which researchers and the public know little about (Boeker and Urman 2022; Klug et al. 2021; Bandy and Diakopoulos 2020), but which users find a compelling feature (Bhandari and Bimo 2022; Klug et al. 2021). Users think about, reason with and interact with this system to optimize its ability to deliver personalized content (Zeng and Kaye 2022; Karizat et al. 2021; Klug et al. 2021; Simpson and Semaan 2021; Lee et al. 2022; Bhandari and Bimo 2020). TikTok, then, is a unique platform in that in addition to seeing content from people they follow (some of whom may be part of their social networks), users also spend their time on the platform viewing videos from and interacting with the content-personalization algorithm.
We add to the body of knowledge on social media time estimation research to investigate the factors that influence TikTok users’ estimates of how much time they spend using this new platform. Additionally, we compare those estimations with users’ actual logged usage to identify inaccuracies. We examine relationships between self-reported time spent on TikTok – and the accuracy of those self-reports – and demographics. Going beyond the engagement measures in prior work, which were limited to the users’ tenure on the platform and the number of sessions of engagement per day (Ernala et al. 2020), we also explore the role of a richer set of platform behavior metrics (likes, follows, and number of videos watched) in an attempt to measure how engagement may contribute to users’ accurate estimations of their time spent on TikTok, based on prior work finding that TikTok users may engage with the platform uniquely compared to other platforms.
To do so, we leverage a dataset previously collected (Zannettou et al. 2023) that includes donated TikTok user data packages from 255 TikTok users. This dataset contains information on users’ interactions with the TikTok platform, including their logged time spent on the platform, watched videos, and forms of video engagement (such as likes and comments) as well as self-reported data on the dataset participants’ demographics and self-reported estimates of their time spent on TikTok.
Using these data, we analyze the relationship between self-reported time spent on TikTok and server-logged time. Overall, in line with prior work (Ernala et al. 2020; Burnell et al. 2021; Verbeij et al. 2021; Sewall et al. 2020; Junco 2013) on other platforms, we find that participants overestimated the time they spend on TikTok. Further, their estimates of their time spent are not correlated with the actual (logged) amount of time they spend on TikTok; this is consistent with findings from prior work assessing the accuracy of Facebook users’ estimates of their time spent on the platform. However, we do find several other predictors of time spent estimates and error in those estimates among the TikTok users whose data we analyze. First, we find that those who engage more with the platform by liking more videos estimate that they spend longer on TikTok (and the error in their estimations is higher). This finding may relate to two prior results in psychology: (i) likes are discrete actions; psychological theory suggests that discrete events or actions may alter our perceptions of how long we have spent doing an activity (Eagleman 2008) and (ii) that reflecting on our activities (e.g., in deciding whether to press the like button) may cause that activity to be perceived as taking a longer amount of time than reality (Larson and von Eye 2006). Second, we find that the number of sessions, or times participants start and stop using TikTok, is negatively related to their estimates of time spent (higher amount of sessions, lower estimates of time), and positively related to accuracy (higher amount of sessions, less over-estimation error). Prior work offers conflicting results on whether fragmented social media use – using social media in several sessions per day – results in more (Ernala et al. 2020) or less (Schwarz and Oyserman 2001; Voorveld and Van der Goot 2013; Voorveld et al. 2014) accurate estimations of time spent. In line with the more recent among these prior works – Ernala et al. (2020) conducted on Facebook in 2020 – we find that more fragmented TikTok use results in more accurate (e.g., lower) estimates of time spent on the platform. Our confirmation of this more recent data, which contradicts results from 2001-2014, may suggest that our way of perceiving the time we spend on social media has changed. As our use has become more habitually fragmented and interwoven throughout our daily lives, long single stretches of use may feel to us even longer than they already are.
The contributions of this work can be summarized as follows:
-
•
We provide the first evaluation of the accuracy of self-reported time on a recommendation system-orientated platform (TikTok) to find that participants generally overestimate their use on TikTok;
-
•
We analyze factors that are associated with the self-reported time accuracy and find that while the actual time spent is not significantly related to time estimation, various dimensions of engagement are;
-
•
We provide possible theories based in social media and cognitive psychology literature to explain the correlations between the self-reported time and engagement, and provide suggestions for future study design.
Ethical Considerations. Before conducting our study, we obtained approval from our institution’s Ethical Board Review committee. Our work relies on the dataset provided by Zannettou et al. (2023) whose methods were also IRB approved and where all participants explicitly gave consent before donating any data or filling out the surveys. All participants could opt-in to specific data fields they were comfortable with donating. At the same time, they had the opportunity not to answer (i.e., skip) any question in the survey. Overall, the provided dataset was properly anonymized and includes the participants’ actions on TikTok (video watch history, like history, follow history, etc.), as well as their survey responses. We emphasize that we follow standard ethical guidelines in our analysis (Rivers and Lewis 2014), like presenting results on aggregate and not trying to de-anonymize the participants.
Related Work
Here, we summarize prior work on the accuracy of self-reports of social media use, offer background on the TikTok platform and how we account for its unique features in our analysis, and briefly summarize prior work on data donation – the method through which the dataset we analyze was obtained.
Accuracy of Self-Reports of Social Media Use
A recent meta-analysis of research on self-reports of time spent on digital media found only a moderate association between self-reported digital media usage and logged usage across studies (Parry et al. 2021). Indeed, work utilizing recent technological advances allowing researchers to view users’ actual logged usage times suggests that asking participants to assess their time spent using social media, the variables of focus in our study, is an unreliable means of measurement. Prior work finds evidence that participants have a tendency to overestimate the time they spend on social media (Burnell et al. 2021; Ernala et al. 2020; Verbeij et al. 2021; Sewall et al. 2020; Junco 2013), yet little is known about what causes inaccuracies between users estimates and actual usage. Researchers have identified related factors; demographic variables may play a role, with one study finding that younger Facebook users, women, and Facebook users from the Global South had less accurate estimations of their usage time (Ernala et al. 2020). Usage factors have also been explored, with prior work finding that individuals who spend more time on social media platforms estimate their time less accurately (Ernala et al. 2020; Boyle et al. 2022; Sewall et al. 2020). Self-report accuracy may also be context-dependent, as differences in accuracy of estimations have been noted across social media platforms (Verbeij et al. 2021; Ernala et al. 2020; Burnell et al. 2021).
In addition to demographic, usage and context-related factors that correlate with inaccurate self-reporting, prior work has posited potential cognitive explanations for inaccuracies. Participants may struggle to accurately recall their behaviors (Schwarz and Oyserman 2001); both features of the activity (like its complexity or novelty) and users’ participation (like their emotional and intellectual engagement) can impact their perception of their time spent (Larson and von Eye 2006). For social media use in particular, use can be sporadic and fragmented throughout the day, or multi-tasked with other activities (Voorveld and Van der Goot 2013; Voorveld et al. 2014), which adds a unique challenge to estimating total usage time (Verbeij et al. 2021). Participants may also report their behaviors based on perceptions of themselves (Schwarz and Oyserman 2001), attitudes towards on social media (Lee, Katz, and Hancock 2021; Junco 2013; Podsakoff et al. 2003), or a desire to appear a certain way (Latkin et al. 2017), rather than based on reality. Additionally, inaccuracies can stem from participants’ varied interpretations of the research design, i.e., some may interpret the wording and framing of self-report questions differently than others or than the study intends (Schwarz and Oyserman 2001; Ernala et al. 2020; Junco 2013; Mieczkowski, Lee, and Hancock 2020).
Researchers have attempted to optimize research designs and methodologies to more accurately capture the time users spend on social media (Jenkins-Guarnieri, Wright, and Johnson 2013; Ernala et al. 2020; Mieczkowski, Lee, and Hancock 2020; Block, Grondin, and Zakay 2018). However, the widespread inaccuracies across self-report measures warrants a deeper exploration into users’ habits of time estimation, and what factors correlate with inaccuracies. We extend the literature in this area by assessing how users report their time spent on TikTok, a social media platform whose users have not yet been investigated on their self-report behaviors, which differs on several dimensions from previously explored platforms as detailed below. We compare a sample of 255 TikTok users’ estimations of their time spent on the platform compared to their actual usage, and identify factors that correlate with estimation times and accuracy.
TikTok
TikTok, a prominent social media and entertainment platform, presents an interesting setting to study how users estimate their usage time. Owned by parent company ByteDance, TikTok launched as Douyin in its home market of China in 2016 and has been expanding internationally ever since (Tidy and Galer 2020; Sun et al. 2020), achieving a reach of more than 1.5 billion active users worldwide, as of the third quarter of 2022 (Ruby 2022).
The interface and experience TikTok provides users is unique compared to other social platforms. When using TikTok, users may scroll through two different content feeds, one containing videos posted by the people they follow (“Following”), the other a curated feed of content from different creators (“For You”). The For You feed is the homepage of the app and is endlessly scrollable. While TikTok provides video editing tools and classic social media features like messaging and comments, the content recommendation system powering the For You feed is arguably its most prominent feature (Smith 2021). Often called the ”algorithm,” the recommendation system’s ability to recommend relevant video content to users plays a large role in continued user engagement with the app (Bhandari and Bimo 2022; Klug et al. 2021). Prior work shows that users think and reason about TikTok’s algorithm more than they do for other social media platforms (Bhandari and Bimo 2022). While TikTok remains notoriously opaque about how their recommendation system selects and serves content to users (Boeker and Urman 2022; Klug et al. 2021; Bandy and Diakopoulos 2020), users form their own beliefs on how it may suppress or uplift certain content, and strategically interact with it to optimally personalize its content (Zeng and Kaye 2022; Karizat et al. 2021; Klug et al. 2021). For instance, users perceive that the accuracy of the algorithm strengthens with time, and that at a certain point in their tenure it begins to understand them more intimately (Bhandari and Bimo 2022; Simpson and Semaan 2021; Lee et al. 2022). TikTok users then, in addition to interacting with their networks, are interacting with a recommendation system meant to represent their interests (Bhandari and Bimo 2020; Lee et al. 2022), which is notably different from social media platforms centering on interactions with friends and/or followers (though it should be noted that more platforms are embedding short-form video recommendations into their interfaces following the success of TikTok (Pardes 2020)).
We take into account TikTok’s highly personalized content landscape and uniquely engaged user base and investigate whether these features and affordances impact users’ cognitions when using the app – namely, how users retrospectively estimate the time they spend on the app. As self-reporting inaccuracies are seen to vary across social media platforms already (Verbeij et al. 2021; Ernala et al. 2020), we add to this body of work and study how TikTok users estimate their time and the accuracy of those estimations. In addition to other factors, we measure forms of user engagement, such as the number of videos they watch and the number of videos they ”like,” to understand how engagement may influence people’s estimates of their time spent on this type of platform.
Data Donation
Our work assesses how users estimate their time spent on TikTok, comparing self-report survey data to logged use obtained from data donated directly by TikTok users. Per Article 15 of the EU’s General Data Protection Regulation (European Union 2016), which describes rights of access for data subjects, most major digital platforms now provide their users with electronic access to the personal data they collect and process for each user via downloadable data packages (Boeschoten et al. 2020). Researchers studying digital platforms are beginning to leverage the rich information in these packages by requesting that users donate them for study (Van Driel et al. 2021; Wei et al. 2020). This data collection method is especially relevant for retrieving accurate logs of screen time (e.g., Baumgartner et al. 2022). To assess the accuracy of users’ estimations for their time spent on TikTok, and to explore other personal usage factors that may correlate with logged usage time, we compare self-reported time estimations collected from a survey against logged usage data using a dataset from Zannettou et al. (2023) which is created from data donations as further detailed in Methodology.
Methodology
| Gender | Age | Education | |||
|---|---|---|---|---|---|
| Woman | 120 (47%) | 18-24 years old | 118 (46%) | Below bachelor degree | 112 (44%) |
| Man | 135 (53%) | 25-64 years old | 137 (54%) | Holds a bachelor degree or above | 143 (56%) |
Data Collection
We utilize a dataset collected by Zannettou et al. (2023), which collected the server logged data from 347 TikTok users by asking them to request their downloadable data packages from the TikTok mobile app. Because the participants were able to select the type of data that they request from TikTok (e.g., video watch history, account settings, and following users), Zannettou et al. (2023) mandated that participants donate their video watch history to participate, and allowed participants to be paid more by also uploading more of their TikTok data.
Along with data donation, participants were administered an optional survey for collection of demographic data and participants’ self-reported estimation of the time they spent on TikTok. Participants in their study received higher compensation for finishing the survey.
To validate the data from Zannettou et al. (2023) beyond that done by those authors, in November 2022, one researcher on our team donated their own logged data to the Zannettou et al. (2023) study, and with the cooperation of those authors we manually verified that the extracted time was consistent with the time monitored by the IOS built-in “Screen Time” application for the prior fifteen days.
Data Analysis
In this section, we first explain how we excluded invalid responses from data analysis, and then show our approach of analyzing participants’ self-report accuracy and estimation error. We identify four key factors from prior works that influence people’s self-estimation, and explain how we measure these factors using both participants’ self-reported and donated data.
Data Selection
The dataset we received included data for 347 TikTok users; we excluded 92 (26.5%) responses as a result of incompleteness and incompatibility with our analysis plan, as we elaborate below, resulting in a final dataset from 255 participants. A fraction of the data was excluded since it was incomplete: 4 (1.2%) participants chose not to fill in the survey, and 40 (11.5%) participants who filled in the survey chose not to answer one or more questions that are essential to our analysis (education, age, gender or TikTok usage estimation). In addition, we exclude 34 (9.8%) participants who rarely use TikTok – having video watched histories less or equal to one week. We also excluded 4 (1.2%) participants of non-binary genders. We acknowledge the importance and uniqueness of this group, but due to the small group size of the non-binary community in our study, we cannot generate meaning statistical results.
The demographics of participants in our data set are gender-balanced: with 47% of the participants identified as men. We classify the participants’ age and education each into two balanced categories. For age, we merge the “25-34 years old”, “35-44 years old”, and “45-64 years old” categories in our survey to one “25-64 years old” group. For education, “Below Bachelor’s Degree” is merged from “Less than high school”, “High school graduate”, “Trade school”, “Some college” and “Associate’s degree”; “Holds a Bachelor’s Degree or above” is merged from “Bachelor’s degree” and “Postgraduate degree (MSc or PhD)”. Table 1 shows the demographics of 255 participants included in the data analysis.
| Self-reported time | # (%) |
|---|---|
| 0 - 4 hours | 32 (12.5%) |
| 4 - 12 hours | 73 (28.6%) |
| 12 - 24 hours | 78 (30.1%) |
| 24 - 48 hours | 48 (18.8%) |
| >48 hours | 24 (9.4%) |
|
|
|
|
|
|
|
||||||||||||||
|---|---|---|---|---|---|---|---|---|---|---|---|---|---|---|---|---|---|---|---|---|
| 0 - 4 hours | 6 (18.8%) | 0 (0%) | 26 (81.3%) | 31 (96.9%) | 0.22 | 1.14 | ||||||||||||||
| 4 - 12 hours | 4 (5.5%) | 53 (72.6%) | 16 (21.9%) | 72 (98.7%) | 0.79 | 2.72 | ||||||||||||||
| 12 - 24 hours | 0 (0%) | 75 (96.2%) | 3 (3.8%) | 16 (20.5%) | 1.76 | 9.45 | ||||||||||||||
| 24 - 48 hours | 0 (0%) | 48 (100%) | 0 (0%) | 2 (4.2%) | 2.75 | 21.56 | ||||||||||||||
| >48 hours | 0 (0%) | 24 (100%) | 0 (0%) | 0 (0%) | 3.56 | 43.75 | ||||||||||||||
| Total | 10 (3.9%) | 200 (78.4%) | 45 (17.6%) | 121 (47.5%) | 1.65 | 12.00 |
Self-Reported Time
Participants’ self-reported time was obtained in the survey using a six-point Likert scale. The two groups of the lowest value self-reported time per week (“Less than two hours” and “Two to four hours”) are combined to balance the number of responses in each group.
Measured Variables
As noted in our Related Work, accuracy in self-report time estimations varies by different demographic, usage behaviors and context-based factors. Because we have chosen the context of TikTok to situate our research, we enumerate the demographic and usage factors we have chosen to examine the participants by.
Demographics.
We analyze the participants in our dataset by the following demographics: age, education, gender and internet skills. The demographic information was provided by participants in the optional survey. We measure the users’ level of internet skills based on their familiarity with six internet terminologies (such as Spyware, Meme, and Followers) (Hargittai 2005). We used the mean reported understanding of the questioned terminologies (ranging from ”No understanding” (1) to ”Full understanding” (5)) as the participants’ internet skills measure.
TikTok User Behavior.
In our work, we chose to measure various behaviors and dimensions of engagement with the TikTok app. Prior work finds mixed results regarding whether people’s self-reports of their time spent correlate with their actual time spent (as measured via survey logs). Thus, we consider the relationship between logged time spent and self-reported time spent. Additionally, as prior work on TikTok specifically finds that the videos people see are most strongly influenced by who they follow (Boeker and Urman 2022), we also conduct an analysis in which we separate the server-logged time into two categories: time spent watching videos from accounts the user follows (follow time) and time spent watching videos from accounts the user does not follow (non-follow time). Following best practice from prior work (Ernala et al. 2020), we equally classify the server-logged time into four quartile groups. Times smaller than the lower quartile () are put into the first group, and times between the lower quartile () and the median () are put into the second group, followed by the third and the fourth groups for times between the median () and the upper quartile () and times larger than the upper quartile (). Finally, we also characterize actual activity on TikTok by measuring the number of videos participants viewed per day on average to collect another dimension of use.
Prior work have observed that tenured and frequent users are likely to make more estimation errors (Burnell et al. 2021). Thus, we include tenure into analysis. As TikTok does not expose user’s registration date in participants’ donated data, we define the tenure of each participant as the duration between the timestamp of the oldest video they accessed and the time they donated their data. This approach takes participants’ first interaction with the TikTok content ecosystem as the time they start using TikTok.
Further, reporting on fragmented behaviors, or behaviors done multiple times throughout the day, is hypothesized to result in self-report time estimation error (Schwarz and Oyserman 2001). Social media use often is fragmented (Voorveld and Van der Goot 2013; Voorveld et al. 2014), and prior work finds that users have more accurate social media time estimations for platforms which they use in less fragmented ways (Verbeij et al. 2021). Yet, other work has found that users who engage in more sessions of use have less error in estimating their time on platforms (Ernala et al. 2020). We measure this construct in our study by assessing the participants’ number of sessions per day. We define a new session when we observe a participant started watching a TikTok video after not using TikTok for at least 400 seconds (prior work on Facebook activity defined new sessions as engaging in activity at least 300 seconds after a period of inactivity (Ernala et al. 2020)).
Finally, noting TikTok users’ unique means of engagement with the platform, we investigate participants’ direct engagement with content on TikTok and measure the amount of liked videos they have per day on average. We turn to psychological research citing that time estimations are impacted by the number of events one remembers (Eagleman 2008), and seek to measure specific forms of engagement that may impact participants’ memory of their time spent. As the dataset also had most (99%) of participants opt in for donating their “like” data, we choose this variable over other forms of content engagement like “comments” or “shares.”
Results
Below, we detail the results of our analyses evaluating the accuracy of the time estimations of the 255 TikTok users in the dataset we analyze and our efforts to identify factors that explain errors in their estimations. As a reference, we list their self-reports in Table 2.
Accuracy of Self-Reported Time
We first analyze how participants’ self-reported time estimates correlate with their observed usage history. Presented in Table 3, we see that in general, most participants over-reported their time spent on TikTok. 45 users (17.6%) report their usage correctly (their logged time matched the self-report time category), while 121 users (47.5%) report estimations close to their actual usage (in which “close” is defined as the estimation is one time block below or above the logged usage). For example, a user who uses five hours of TikTok per week with the self-estimation of “0-4 hours” is considered as “close”. We observe that as the participants’ self-reported time estimates increased, their accuracy decreased, and their average error increased.
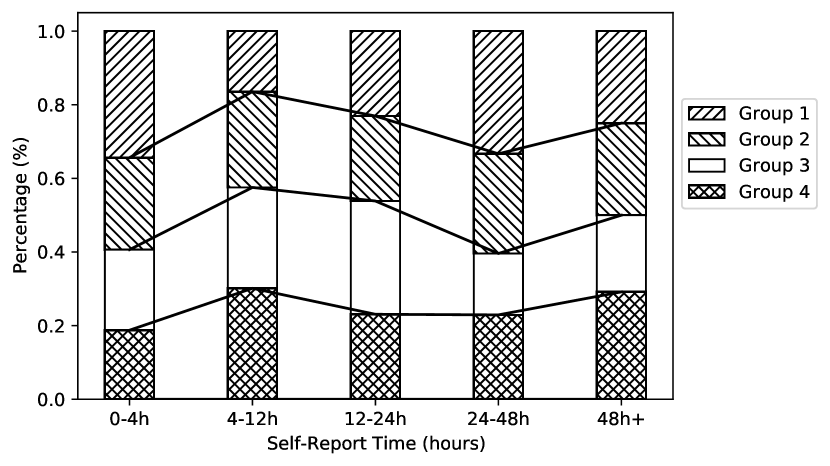
Figure 1 shows the distribution between server-logged times and self-reported time estimations. Participants show similar TikTok usage distribution in each self-reported time category, which suggests that the server-reported time may not be a decisive factor of self-estimation. To explore the factors that influence participants’ time estimations, we run an ordinal logistic regression (specifically, we build a Cumulative Linked Model (CLM) using the ordinal R package (Christensen. 2018)). We explore how participants’ demographics and usage characteristics are associated with their self-reported estimations.
We take the self-report time, which is categorized by the quartile groups, as the dependent variable and treat it as an ordinal variable. All other parameters (bolded in the “TikTok User Characteristics” section) are taken as independent variables. Number of likes and logged time spent on following or non-following times are similarly grouped by the quartiles and treated as categorical variables to avoid non-linear results. Education, gender, and age are also treated categorically. We treat the internet skills, tenure, number of videos and number of sessions as numerical variables and apply natural logarithm () on them. The baseline of each ordinal or categorical factor is its ordinal lowest category (e.g., youngest age and lowest quartile group of number of likes). For gender, we use men as the baseline category. To avoid potential bias of atypical or disproportionate time spent between following and non-following accounts, we present both models of measuring these two times separately and together. The result of the ordinal regression models are summarized in Table 4. Estimate 1 reports results of the model combining following and non-following times, while estimate 2 reports the results of separated times.
Aligned with the trend reflected in Figure 1, we find that the server-logged time does not significantly correlate to participants’ self-reported time estimates. However, participants’ number of sessions is significantly negatively correlated with the self-reported time estimates. Additionally, those who had higher daily liked videos were more likely to estimate their time spent on TikTok higher. As for participants’ demographics, we observe that those with higher education levels were more likely to provide higher estimates of their time spent on TikTok. Other factors are not significantly correlate with the self-reported time. We observe no significant difference between two models.
| Coefficient | Estimate 1 | Estimate 2 | ||||
|---|---|---|---|---|---|---|
| Age | 0.23 | 0.22 | ||||
| Gender | 0.21 | 0.20 | ||||
| Education |
|
|
||||
| Like 2 |
|
|
||||
| Like 3 |
|
|
||||
| Like 4 |
|
|
||||
| Internet Skills | 0.23 | 0.22 | ||||
| Tenure | -0.15 | -0.15 | ||||
| Videos | 0.17 | 0.27 | ||||
| Sessions |
|
|
||||
| Time Spent 2 | 0.00 | - | ||||
| Time Spent 3 | -0.16 | - | ||||
| Time Spent 4 | 0.07 | - | ||||
| Follow Time 2 | - | -0.08 | ||||
| Follow Time 3 | - | 0.14 | ||||
| Follow Time 4 | - | 0.03 | ||||
| Non-follow Time 2 | - | -0.22 | ||||
| Non-follow Time 3 | - | -0.52 | ||||
| Non-follow Time 4 | - | -0.45 |
Source of Overestimation
Observing that participants’ self-reported time estimations were inaccurate, we explore the factors related to their overestimations. We compute the gap between self-report time () and server-logged time () using the following formula: . We then define categories of by separating by quartiles as was done in the prior analysis. We use the same factors as in the estimation models with the same approach. The results are summarized in Table 5.
| Coefficient | Estimate1 | Estimate 2 | ||||
|---|---|---|---|---|---|---|
| Age | 0.24 | 0.22 | ||||
| Gender | 0.16 | 0.16 | ||||
| Education |
|
|
||||
| Like 2 | 0.40 | 0.42 | ||||
| Like 3 |
|
0.44 | ||||
| Like 4 |
|
|
||||
| Internet Skills | 0.20 | 0.19 | ||||
| Tenure | -0.06 | -0.06 | ||||
| Videos | 0.02 | 0.11 | ||||
| Sessions |
|
|
||||
| Time Spent 2 | 0.22 | - | ||||
| Time Spent 3 | 0.21 | - | ||||
| Time Spent 4 | -0.21 | - | ||||
| Follow Time 2 | - | -0.05 | ||||
| Follow Time 3 | - | 0.19 | ||||
| Follow Time 4 | - | 0.04 | ||||
| Non-follow Time 2 | - | -0.03 | ||||
| Non-follow Time 3 | - | -0.24 | ||||
| Non-follow Time 4 | - | -0.79 |
Similar to the estimation models, we see that education and number of videos liked – albeit in these models, only for those in the 3rd and 4th quartile group of the first model (not separating the non-following and following times) and in the 4th quartile groups of the second model (separating the times) – positively correlate with a tendency to over-estimate, while the number of sessions negatively correlates with a tendency to over-estimate.
Discussion
Prior work finds evidence that people tend to overestimate their time spent using social media when asked to self-report (Ernala et al. 2020; Verbeij et al. 2021; Sewall et al. 2020; Junco 2013; Boyle et al. 2022). Our work adds to this body of literature by investigating how user estimates differ on an unexplored social media platform, TikTok, and exploring what user factors correlate with accurate time estimations. We find that participants generally overestimated their time spent on TikTok, and that server-logged time was not correlated with participants’ self-reported time. We see that participants who liked more videos were more likely to provide higher estimates of their time spent on TikTok and had higher overestimations of their time spent on the platform. Conversely, participants with more sessions of use were more likely to provide lower time estimates and had lower overestimation errors.
These results corroborate prior work finding that users tend to overestimate their own social media usage (Ernala et al. 2020; Verbeij et al. 2021; Sewall et al. 2020; Junco 2013), and that users with a higher number of sessions have lower error (Ernala et al. 2020). Importantly, we identify a unique engagement factor – number of likes – that was correlated with self-reporting inaccuracy.
Below, we enumerate several hypotheses that offer possible explanations for our findings and advocate for further research in these areas.
“Likes,” Cognitive Effort and Retrospective Activity
Our study finds that users who liked more videos were more likely to estimate high usage times, and also to overestimate their time spent on TikTok compared to their logged data. Users interact with “like” buttons on social media for various motivations, such as endorsing a message, acting in accordance with social norms, or simply to express that they like the content (Chin, Lu, and Wu 2015; Gorrell and Bontcheva 2016; Xu, Yao, and Teo 2020; Eranti and Lonkila 2015). Regardless, they are an indicator that the user has made a sort of decision or judgement on a piece of content. Drawing on work that the brain takes the number of events into account when estimating time (Eagleman 2008), it is possible that users who have more liking activity have an inflated sense of their time spent on TikTok because they have exercised cognitive effort on more pieces of content than users who use TikTok more passively, enabling them to remember more individual pieces of content and creating the illusion that they have spent more time on the platform.
Alternatively, overestimation may be due to challenges in reflecting on retrospective activity. While making the decision whether the video deserves a “like” or not, the user unavoidably recalls the video content and engages in retrospective activity; prior work has identified that retrospective activities are perceived to have slower time flow (Larson and von Eye 2006). Future work should investigate the link between this particular type of user engagement and time estimations.
Sessions and Use Fragmentation
Prior work offers mixed results on whether use fragmentation results in higher or lower usage estimation errors. Our finding – that users with more sessions reported lower, more accurate estimations of their time spent on TikTok – corroborates prior work (Ernala et al. 2020) on Facebook finding that users who engaged with many Facebook sessions had less error in their estimations. It is possible that the fragmented use of TikTok throughout the day increased participants’ ability to more accurately recall their usage time whereas long and continuous use, especially with the endless scroll nature of the app (Kendall 2021; Zhao and Wagner 2022; Schellewald 2021), may cause users to binge, space out and forget how much time they used the app for. These results do however contradict earlier prior work (from 2001, 2013, and 2014) suggesting that fragmented use of social media is also a potential source of self-reporting inaccuracy, as the intermixing of social media use with other daily activities may also cause confusion in users when reflecting on their time spent (Schwarz and Oyserman 2001; Voorveld and Van der Goot 2013; Voorveld et al. 2014). Future work may seek to understand whether people’s increasingly experienced use with fragmented social media has now changed their time perceptions from earlier time estimation studies. As we adapt to a fragmented, post-digital life (Cramer 2015) our familiarity with fragmented time may create an illusion that continuous periods of engagement with social media are longer than they actually are.
TikTok Sentiments and Mindsets
Researchers speculate that personal or societal beliefs of social media may impact users when they are asked to report on their behavior (Junco 2013; Podsakoff et al. 2003; Lee, Katz, and Hancock 2021). For instance, perceptions of norms surrounding social media use (e.g., how much social media should be used) can impact how a user perceives their own usage (Lee, Katz, and Hancock 2021). While the present study lacks a formal content analysis, we point to some popular sentiments surrounding TikTok. Anecdotally and in scholarship, users express getting lost in the app, or even addicted (Smith 2021; Evitts 2022; Kendall 2021; Schellewald 2021). TikTok itself has a screen break reminder feature, in which users can choose to be reminded to take a break from using the app (Wong 2022), and has published a digital well-being guide detailing other screen time-related features in their Safety Center (TikTok 2023). Further, studies of what drives non-use of TikTok have found that fears of addiction, perceiving the content as low quality, or leaving only temporarily to focus on pressing tasks all play a role (Lu, Lu, and Liu 2020). Taken together, it could be possible that the participants in our dataset took this sentiment around addictive use into account when reporting their usage, explaining the high levels of overestimation found in our study. Our study did not assess the participants’ sentiments of TikTok, and research points to mixed positive and negative perceptions of and experiences with the platform (Simpson and Semaan 2021; Schellewald 2021; Omar and Dequan 2020; Lu, Lu, and Liu 2020; Scherr and Wang 2021; Shao and Lee 2020; Bossen and Kottasz 2020). Emerging research on how mindsets of social media govern the outcomes that users experience from their use (Lee, Katz, and Hancock 2021) should be taken into account in future time estimation studies, as it might provide some rationale for why reporting inaccuracies occur.
Limitations and Recommendations for Future Study
We acknowledge that attaining logged data of users’ social media usage is not a fool-proof measure, and may involve technical errors, costly efforts to obtain, and ethical concerns (Parry et al. 2021). In our work, we experienced technical errors with the dataset we received, finding that the dataset was missing 2 months’ worth of users’ “like” data.
With this in mind, we advocate for future work to identify other variables that accurately reflect participants’ social media use. Our work analyzes select types of user behaviors (likes, follows, tenure, videos watched, and number of sessions) in an attempt to measure how engagement may contribute to users’ accurate estimations of their time spent on TikTok, based on prior work (Taulli 2020; Bhandari and Bimo 2022; Klug et al. 2021; Bandy and Diakopoulos 2020) finding that TikTok users may engage with the platform uniquely compared to other platforms. We find that certain dimensions of user engagement – how many videos they like and how often they start new sessions of use – are correlated with self-report accuracy. This warrants a deeper investigation into user engagement as a measure that may supplement, or even supplant, self-reports of time spent on social media. Social media research on intensiveness of use (Ellison, Steinfield, and Lampe 2007; Orosz, Tóth-Király, and Bőthe 2016) and active vs. passive use (Peterka-Bonetta et al. 2021; Lee, Ng, and Bogomolova 2019) are being explored in relation to psychological and behavioral outcomes in users. Future research interested in gauging social media use habits, instead of relying on self-reports of time, may choose to ask the participants questions about their engagement or use styles. Variables like number of likes and sessions are also sometimes readily available to users within applications or though mobile phone tracking (Ernala et al. 2020; Ohme et al. 2020), which adds reliability to these types of self-reports.
Conclusion
We conduct the first study examining how TikTok users estimate their time spent on the app. We also assess the accuracy of their estimations using log data from user-donated data packages. Among the 255 participants in our dataset, we find the majority overestimated the time they spent using TikTok. Examining the participants by different dimensions of engagement, we see that participants with more active engagement (measured in “likes”) provided higher estimations of their time spent on the app, and also had higher overestimation error. Conversely, we see that participants with a higher number of sessions of use had lower estimations of their time spent on the app, and lower overestimation error. Our findings build on prior work on the accuracy of people’s social media usage self-reports, corroborating the notion that people generally overestimate their time spent on social media. We also highlight potentially relevant engagement factors to study in future work.
References
- Araujo et al. (2017) Araujo, T.; Wonneberger, A.; Neijens, P.; and de Vreese, C. 2017. How much time do you spend online? Understanding and improving the accuracy of self-reported measures of internet use. Communication Methods and Measures, 11(3): 173–190.
- Bandy and Diakopoulos (2020) Bandy, J.; and Diakopoulos, N. 2020. #TulsaFlop: A case study of algorithmically-influenced collective action on TikTok. arXiv preprint arXiv:2012.07716.
- Baumgartner et al. (2022) Baumgartner, S. E.; Sumter, S. R.; Petkevič, V.; and Wiradhany, W. 2022. A novel iOS data donation approach: Automatic processing, compliance, and reactivity in a longitudinal study. Social Science Computer Review, 08944393211071068.
- Bhandari and Bimo (2020) Bhandari, A.; and Bimo, S. 2020. TikTok and the “algorithmized self”: A new model of online interaction. AoIR Selected Papers of Internet Research.
- Bhandari and Bimo (2022) Bhandari, A.; and Bimo, S. 2022. Why’s everyone on TikTok now? The algorithmized self and the future of self-making on social media. Social Media and Society, 8(1): 205630512210862.
- Block, Grondin, and Zakay (2018) Block, R. A.; Grondin, S.; and Zakay, D. 2018. Prospective and retrospective timing processes: Theories, methods, and findings. In Timing and Time Perception: Procedures, Measures, & Applications, 32–51. Brill.
- Boeker and Urman (2022) Boeker, M.; and Urman, A. 2022. An empirical investigation of personalization factors on TikTok. arXiv preprint arXiv:2201.12271.
- Boeschoten et al. (2020) Boeschoten, L.; Ausloos, J.; Moeller, J.; Araujo, T.; and Oberski, D. L. 2020. Digital trace data collection through data donation. arXiv preprint arXiv:2011.09851.
- Bossen and Kottasz (2020) Bossen, C. B.; and Kottasz, R. 2020. Uses and gratifications sought by pre-adolescent and adolescent TikTok consumers. Young Consumers, 21(4): 463–478.
- Boyle et al. (2022) Boyle, S. C.; Baez, S.; Trager, B. M.; and LaBrie, J. W. 2022. Systematic bias in self-reported social media use in the age of platform wwinging: Implications for studying social media use in relation to adolescent health behavior. International Journal of Environmental Research and Public Health, 19(16): 9847.
- Burnell et al. (2021) Burnell, K.; George, M. J.; Kurup, A. R.; Underwood, M. K.; and Ackerman, R. A. 2021. Associations between self-reports and device-reports of social networking site use: An application of the truth and bias model. Communication Methods and Measures, 15(2): 156–163.
- Chin, Lu, and Wu (2015) Chin, C.-Y.; Lu, H.-P.; and Wu, C.-M. 2015. Facebook users’ motivation for clicking the “like” button. Social Behavior and Personality: An international journal, 43(4): 579–592.
- Christensen. (2018) Christensen., R. H. B. 2018. Cumulative link models for ordinal regression with the R Package ordinal. https://cran.r-project.org/web/packages/ordinal/vignettes/clm˙article.pdf.
- Cramer (2015) Cramer, F. 2015. What is ‘Post-digital’? In Berry, D. M.; and Dieter, M., eds., Postdigital Aesthetics: Art, Computation and Design, 12–26. London: Palgrave Macmillan UK.
- Eagleman (2008) Eagleman, D. M. 2008. Human time perception and its illusions. Current Opinion in Neurobiology, 18(2): 131–136.
- Ellis et al. (2019) Ellis, D. A.; Davidson, B. I.; Shaw, H.; and Geyer, K. 2019. Do smartphone usage scales predict behavior? International Journal of Human-Computer Studies, 130: 86–92.
- Ellison, Steinfield, and Lampe (2007) Ellison, N. B.; Steinfield, C.; and Lampe, C. 2007. The benefits of Facebook “friends:” Social capital and college students’ use of online social network sites. Journal of Computer-mediated Communication, 12(4): 1143–1168.
- Eranti and Lonkila (2015) Eranti, V.; and Lonkila, M. 2015. The social significance of the Facebook Like button. First Monday, 20.
- Ernala et al. (2020) Ernala, S. K.; Burke, M.; Leavitt, A.; and Ellison, N. B. 2020. How well do people report time spent on Facebook? In Proceedings of the 2020 CHI Conference on Human Factors in Computing Systems. ACM.
- European Union (2016) European Union. 2016. General Data Protection Regulation. https://eur-lex.europa.eu/eli/reg/2016/679/oj.
- Evitts (2022) Evitts, J. 2022. TikTok-addicted students delete app during exams. https://www.bbc.com/news/uk-wales-62720657.
- Garett, Liu, and Young (2018) Garett, R.; Liu, S.; and Young, S. D. 2018. The relationship between social media use and sleep quality among undergraduate students. Information, Communication & Society, 21(2): 163–173.
- Gorrell and Bontcheva (2016) Gorrell, G.; and Bontcheva, K. 2016. Classifying Twitter favorites: Like, bookmark, or Thanks? Journal of the Association for Information Science and Technology, 67(1): 17–25.
- Griffioen et al. (2020) Griffioen, N.; van Rooij, M.; Lichtwarck-Aschoff, A.; and Granic, I. 2020. Toward improved methods in social media research. Technology, Mind, and Behavior, 1(1).
- Hargittai (2005) Hargittai, E. 2005. Survey measures of web-oriented digital literacy. Social Science Computer Review, 23(3): 371–379.
- Jenkins-Guarnieri, Wright, and Johnson (2013) Jenkins-Guarnieri, M. A.; Wright, S. L.; and Johnson, B. 2013. Development and validation of a social media use integration scale. Psychology of Popular Media Culture, 2(1): 38.
- Junco (2013) Junco, R. 2013. Comparing actual and self-reported measures of Facebook use. Computers in Human Behavior, 29(3): 626–631.
- Karizat et al. (2021) Karizat, N.; Delmonaco, D.; Eslami, M.; and Andalibi, N. 2021. Algorithmic folk theories and identity: How TikTok users co-produce Knowledge of identity and engage in algorithmic resistance. Proceedings of the ACM on Human-Computer Interaction, 5(CSCW2): 1–44.
- Kendall (2021) Kendall, T. 2021. From binge-watching to binge-scrolling: TikTok and the rhythms of #LockdownLife. Film Quarterly, 75(1): 41–46.
- Klug et al. (2021) Klug, D.; Qin, Y.; Evans, M.; and Kaufman, G. 2021. Trick and please. A mixed-method study on user assumptions about the TikTok algorithm. In 13th ACM Web Science Conference 2021, 84–92.
- Larson and von Eye (2006) Larson, E.; and von Eye, A. 2006. Predicting the perceived flow of time from qualities of activity and depth of engagement. Ecological Psychology, 18(2): 113–130.
- Latkin et al. (2017) Latkin, C. A.; Edwards, C.; Davey-Rothwell, M. A.; and Tobin, K. E. 2017. The relationship between social desirability bias and self-reports of health, substance use, and social network factors among urban substance users in Baltimore, Maryland. Addictive Behaviors, 73: 133–136.
- Lee, Katz, and Hancock (2021) Lee, A. Y.; Katz, R.; and Hancock, J. 2021. The role of subjective construals on reporting and reasoning about social media use. Social Media+ Society, 7(3): 20563051211035350.
- Lee et al. (2022) Lee, A. Y.; Mieczkowski, H.; Ellison, N. B.; and Hancock, J. T. 2022. The Algorithmic Crystal: Conceptualizing the Self through Algorithmic Personalization on TikTok. In Proceedings of the ACM on Human-Computer Interaction, volume 6, 1–22.
- Lee, Ng, and Bogomolova (2019) Lee, D.; Ng, P. M. L.; and Bogomolova, S. 2019. The impact of university brand identification and eWOM behaviour on students’ psychological well-being: A multi-group analysis among active and passive social media users. Journal of Marketing Management, 36(3-4): 384–403.
- Lee et al. (2014) Lee, H.-R.; Lee, H. E.; Choi, J.; Kim, J. H.; and Han, H. L. 2014. Social media use, body image, and psychological well-being: A cross-cultural comparison of Korea and the United States. Journal of Health Communication, 19(12): 1343–1358.
- Lu, Lu, and Liu (2020) Lu, X.; Lu, Z.; and Liu, C. 2020. Exploring TikTok use and non-use practices and experiences in China. In International Conference on Human-Computer Interaction, 57–70. Springer.
- Mieczkowski, Lee, and Hancock (2020) Mieczkowski, H.; Lee, A. Y.; and Hancock, J. T. 2020. Priming effects of social media use scales on well-being outcomes: The influence of intensity and addiction scales on self-reported depression. Social Media+ Society, 6(4): 2056305120961784.
- Montenegro (2021) Montenegro, L. 2021. The rise of short-form video: TikTok is changing the game. https://www.forbes.com/sites/forbesagencycouncil/2021/08/27/the-rise-of-short-form-video-tiktok-is-changing-the-game/?sh=aa7bbb850837.
- Ohme et al. (2020) Ohme, J.; Araujo, T.; de Vreese, C. H.; and Piotrowski, J. T. 2020. Mobile data donations: Assessing self-report accuracy and sample biases with the iOS Screen Time function. Mobile Media & Communication, 9(2): 293–313.
- Omar and Dequan (2020) Omar, B.; and Dequan, W. 2020. Watch, share or create: The influence of personality traits and user motivation on TikTok mobile video usage. International Journal of Interactive Mobile Technologies, 14(4): 121.
- Orosz, Tóth-Király, and Bőthe (2016) Orosz, G.; Tóth-Király, I.; and Bőthe, B. 2016. Four facets of Facebook intensity—The development of the multidimensional Facebook intensity scale. Personality and Individual Differences, 100: 95–104.
- Orzech et al. (2016) Orzech, K. M.; Grandner, M. A.; Roane, B. M.; and Carskadon, M. A. 2016. Digital media use in the 2 h before bedtime is associated with sleep variables in university students. Computers in Human Behavior, 55: 43–50.
- Pardes (2020) Pardes, A. 2020. All the Social Media Giants Are Becoming the Same. https://www.wired.com/story/social-media-giants-look-the-same-tiktok-twitter-instagram/.
- Parry et al. (2021) Parry, D. A.; Davidson, B. I.; Sewall, C. J.; Fisher, J. T.; Mieczkowski, H.; and Quintana, D. S. 2021. A systematic review and meta-analysis of discrepancies between logged and self-reported digital media use. Nature Human Behaviour, 5(11): 1535–1547.
- Peterka-Bonetta et al. (2021) Peterka-Bonetta, J.; Sindermann, C.; Elhai, J. D.; and Montag, C. 2021. How objectively measured Twitter and Instagram use relate to self-reported personality and tendencies toward Internet/Smartphone Use Disorder. Human Behavior and Emerging Technologies, 3(5): 898–911.
- Podsakoff et al. (2003) Podsakoff, P. M.; MacKenzie, S. B.; Lee, J.-Y.; and Podsakoff, N. P. 2003. Common method biases in behavioral research: A critical review of the literature and recommended remedies. Journal of Applied Psychology, 88(5): 879–903.
- Ra et al. (2018) Ra, C. K.; Cho, J.; Stone, M. D.; De La Cerda, J.; Goldenson, N. I.; Moroney, E.; Tung, I.; Lee, S. S.; and Leventhal, A. M. 2018. Association of digital media use with subsequent symptoms of attention-deficit/hyperactivity disorder among adolescents. JAMA, 320(3): 255–263.
- Rivers and Lewis (2014) Rivers, C. M.; and Lewis, B. L. 2014. Ethical research standards in a world of big data. F1000Research, 3.
- Rozgonjuk et al. (2020) Rozgonjuk, D.; Pruunsild, P.; Jürimäe, K.; Schwarz, R.-J.; and Aru, J. 2020. Instagram use frequency is associated with problematic smartphone use, but not with depression and anxiety symptom severity. Mobile Media & Communication, 8(3): 400–418.
- Ruby (2022) Ruby, D. 2022. TikTok User Statistics: How many TikTok Users Are There in 2023? https://www.demandsage.com/tiktok-user-statistics/.
- Scharkow (2016) Scharkow, M. 2016. The accuracy of self-reported internet use—A validation study using client log data. Communication Methods and Measures, 10(1): 13–27.
- Schellewald (2021) Schellewald, A. 2021. On getting carried away by the TikTok algorithm. AoIR Selected Papers of Internet Research.
- Scherr and Wang (2021) Scherr, S.; and Wang, K. 2021. Explaining the success of social media with gratification niches: Motivations behind daytime, nighttime, and active use of TikTok in China. Computers in Human Behavior, 124: 106893.
- Schønning et al. (2020) Schønning, V.; Hjetland, G. J.; Aarø, L. E.; and Skogen, J. C. 2020. Social media use and mental health and well-being among adolescents–A scoping review. Frontiers in Psychology, 11: 1949.
- Schwarz and Oyserman (2001) Schwarz, N.; and Oyserman, D. 2001. Asking questions about behavior: Cognition, communication, and questionnaire construction. The American Journal of Evaluation, 22(2): 127–160.
- Sewall et al. (2020) Sewall, C. J. R.; Bear, T. M.; Merranko, J.; and Rosen, D. 2020. How psychosocial well-being and usage amount predict inaccuracies in retrospective estimates of digital technology use. Mobile Media & Communication, 8(3): 379–399.
- Shao and Lee (2020) Shao, J.; and Lee, S. 2020. The effect of Chinese adolescents’ motivation to use TikTok on satisfaction and continuous use intention. The Journal of the Convergence on Culture Technology, 6(2): 107–115.
- Simpson and Semaan (2021) Simpson, E.; and Semaan, B. 2021. For you, or for “you”? Everyday LGBTQ+ encounters with TikTok. Proceedings of the ACM on Human-Computer Interaction, 4(CSCW3): 1–34.
- Smith (2021) Smith, B. 2021. How TikTok Reads Your Mind. https://www.nytimes.com/2021/12/05/business/media/tiktok-algorithm.html.
- Sun et al. (2020) Sun, L.; Zhang, H.; Zhang, S.; and Luo, J. 2020. Content-based analysis of the cultural differences between TikTok and Douyin. In 2020 IEEE International Conference on Big Data (Big Data), 4779–4786. IEEE.
- Taulli (2020) Taulli, T. 2020. TikTok: Why the enormous success? https://www.forbes.com/sites/tomtaulli/2020/01/31/tiktok-why-the-enormous-success/?sh=103ed58c65d1.
- Tidy and Galer (2020) Tidy, J.; and Galer, S. S. 2020. TikTok: The story of a social media giant. https://www.bbc.com/news/technology-53640724.
- TikTok (2023) TikTok. 2023. Digital well-being. https://www.tiktok.com/safety/en/well-being/.
- Valkenburg (2021) Valkenburg, P. M. 2021. Social media use and well-being: What we know and what we need to know. Current Opinion in Psychology, 45: 101294.
- Van Driel et al. (2021) Van Driel, I.; Giachanou, A.; Pouwels, J. L.; Boeschoten, L.; Beyens, I.; Valkenburg, P. M.; et al. 2021. Promises and pitfalls of Instagram data donations. http://osf.io/krqb9.
- Verbeij et al. (2021) Verbeij, T.; Pouwels, J. L.; Beyens, I.; and Valkenburg, P. M. 2021. The accuracy and validity of self-reported social media use measures among adolescents. Computers in Human Behavior Reports, 3: 100090.
- Verbeij et al. (2022) Verbeij, T.; Pouwels, J. L.; Beyens, I.; and Valkenburg, P. M. 2022. Experience sampling self-reports of social media use have comparable predictive validity to digital trace measures. Scientific Reports, 12(1): 1–11.
- Voorveld et al. (2014) Voorveld, H. A.; Segijn, C. M.; Ketelaar, P. E.; and Smit, E. G. 2014. Investigating the prevalence and predictors of media multitasking across countries. International Journal of Communication, 8(0).
- Voorveld and Van der Goot (2013) Voorveld, H. A.; and Van der Goot, M. 2013. Age differences in media multitasking: A diary study. Journal of Broadcasting & Electronic Media, 57(3): 392–408.
- Wei et al. (2020) Wei, M.; Stamos, M.; Veys, S.; Reitinger, N.; Goodman, J.; Herman, M.; Filipczuk, D.; Weinshel, B.; Mazurek, M. L.; and Ur, B. 2020. What Twitter knows: Characterizing ad targeting practices, user perceptions, and ad explanations through users’ own Twitter data. In 29th USENIX Security Symposium (USENIX Security 20), 145–162.
- Wong (2022) Wong, Q. 2022. TikTok Wants to Remind You to Take Breaks From the App. https://www.cnet.com/news/social-media/tiktok-wants-to-remind-you-to-take-breaks-from-the-app/.
- Xu, Yao, and Teo (2020) Xu, X.; Yao, Z.; and Teo, T. S. 2020. Moral obligation in online social interaction: Clicking the “like” button. Information & Management, 57(7): 103249.
- Zannettou et al. (2023) Zannettou, S.; Nemeth, O.-N.; Ayalon, O.; Goetzen, A.; Gummadi, K. P.; Redmiles, E. M.; and Roesner, F. 2023. Leveraging rights of data subjects for social media analysis: Studying TikTok via data donations. arXiv preprint arXiv: 2301.04945.
- Zeeni et al. (2018) Zeeni, N.; Doumit, R.; Abi Kharma, J.; and Sanchez-Ruiz, M.-J. 2018. Media, technology use, and attitudes: Associations with physical and mental well-being in youth with implications for evidence-based practice. Worldviews on Evidence-Based Nursing, 15(4): 304–312.
- Zeng and Kaye (2022) Zeng, J.; and Kaye, D. B. V. 2022. From content moderation to visibility moderation: A case study of platform governance on TikTok. Policy & Internet, 14(1): 79–95.
- Zhao and Wagner (2022) Zhao, H.; and Wagner, C. 2022. How TikTok leads users to flow experience: investigating the effects of technology affordances with user experience level and video length as moderators. Internet Research, (ahead-of-print).