The Fast X-ray Transient XRT 210423 and its Host Galaxy
Abstract
Fast X-ray Transients (FXTs) are X-ray flares with a duration ranging from a few hundred seconds to a few hours. Possible origins include the tidal disruption of a white dwarf by an intermediate-mass black hole, a supernova shock breakout, and a binary neutron star merger. We present the X-ray light curve and spectrum, and deep optical imaging of the FXT XRT 210423, which has been suggested to be powered by a magnetar produced in a binary neutron star merger. Our Very Large Telescope and Gran Telescopio Canarias (GTC) observations began on May 6, 2021, thirteen days after the onset of the flare. No transient optical counterpart111We use the word ”counterpart” for any transient light in a waveband other than the original X-ray detection wave band, whereas the word ”host” refers to the host galaxy. is found in the 1′′ (3) X-ray uncertainty region of the source to a depth =27.0 AB mag. A candidate host lies within the 1′′ X-ray uncertainty region with a magnitude of 25.9 0.1 in the GTC/HiPERCAM -filter. Due to its faintness, it was not detected in other bands, precluding a photometric redshift determination.We detect two additional candidate host galaxies; one with and an offset of 4.21′′ (379 kpc) from the FXT and another one with , at an offset of 3.61′′ (308 kpc). Based on the properties of all the prospective hosts we favour a binary neutron star merger, as previously suggested in the literature, as explanation for XRT 210423.
1 Introduction
Fast X-ray transients (FXTs) have been discovered through systematic searches in Chandra, XMM-Newton, and eROSITA data by Jonker et al. (2013); Glennie et al. (2015); Irwin et al. (2016); Bauer et al. (2017); Xue et al. (2019); Alp & Larsson (2020); Novara et al. (2020); Wilms et al. (2020); Quirola-Vásquez et al. (2022); Lin et al. (2022). FXTs manifest as short flashes of X-rays, with a duration ranging from a few minutes to hours. Several different physical mechanisms have been suggested for the origin of FXTs. The leading theories explaining FXTs include events that are related to strong gravitational wave sources such as a binary neutron star merger (BNS; Dai et al. 2006; Metzger et al. 2008) and a white dwarf (WD) disruption by an intermediate-mass black hole (IMBH; Maguire et al. 2020), as well as supernovae shock-breakout (SBO) where those involving relatively compact progenitors are predicted to be detectable in soft X-rays (Waxman & Katz 2017).
Some neutron star mergers are thought to leave behind a rapidly rotating neutron star with a strong magnetic field (i.e., a magnetar) which could produce an X-ray transient (Dai et al. 2006; Metzger et al. 2008; Zhang 2013; Sun et al. 2017). Xue et al. (2019) favour this scenario for XRT 150321/CDFS XT2. The apparent plateau in its X-ray light curve comparable to those seen in a subset of short gamma-ray bursts (SGRBs; Rowlinson et al. 2013), has been used to argue for a BNS origin.
Tidal disruption events (TDEs) involving a massive BH and a main sequence star have timescales ranging from hours to weeks (Saxton et al. 2021). The relatively low mass of an IMBH compared to that of a super-massive black hole coupled with the compactness of a WD compared to that of a main sequence star is predicted to lead to a fast X-ray flash (Rosswog et al. 2009; Maguire et al. 2020). Some of the FXTs have been interpreted as a WD IMBH TDEs (e.g., XRT 000519; Jonker et al. 2013; Peng et al. 2019). Precursor flares are found in XRT 000519, and their timescale can be explained by the expected orbital time scale of a WD in an eccentric orbit around an IMBH (Jonker et al. 2013; Maguire et al. 2020).
The radiation–mediated shock from a supernova (SN) explosion crossing the star’s surface releases a so-called SBO (Waxman & Katz 2017). Depending on the radius of the exploding star, the SBO could initially appear as an X-ray flash and then evolve into an UV and optical signal. The best example of a SBO is XRT 080109 (Soderberg et al. 2008) in the galaxy NGC 2770, where the FXT was associated with a bright Type Ibc SN, SN 2008D (Mazzali et al. 2008; Modjaz et al. 2009).
About 30 FXTs have been identified to date, both serendipitously and through careful searches in archival data. Counterpart searches have been done for some FXTs. For instance, in the case of CDF-S XT1, Bauer et al. (2017) did not find a counterpart down to deep optical limits from Very Large Telescope (VLT) imaging beginning 80 minutes after the onset of the X-ray flare (R 25.7 mag; Bauer et al. 2017). Consequently, deep host searches have been undertaken from both space and ground for other FXTs. For instance, deep VLT and Gran Telescopio Canarias (GTC) observations of XRT 000519 (Jonker et al. 2013) were reported by Eappachen et al. (2022). They report the detection of a candidate host galaxy to the northwest side of the FXT position in the -band image at =26.290.09 AB mag. An SBO scenario is firmly ruled out if the FXT is indeed associated with this candidate host galaxy. If XRT 000519 is at the distance of M86, it is unlikely that an associated optical SN was missed, while if at a larger redshift, the peak X-ray luminosity would be so large it would rule out an SN SBO origin. Deep optical observations have constrained the hosts of two other FXTs: CDF-XT1 (Bauer et al. 2017) lies at a 0.13′′ offset from a =27.5 dwarf galaxy with zphot=0.4-3.2 and, CDFS XT2 (Xue et al. 2019) lies at a projected distance of 3.3 1.9 kpc from a =0.74 star-forming galaxy. For XRT 170901 Lin et al. (2022) finds an elongated, possibly late-type, star-forming galaxy within the 2 X-ray uncertainty region while for XRT 030511 (Lin et al. 2022), no host galaxy was found.
In this paper, we present the X-ray light curve and spectrum of the FXT XRT 210423, our search for its optical counterpart and host galaxy, and the analysis of the potential host galaxies we identified. Throughout the paper, we use the concordance -CDM cosmology, with Hubble constant H0= 67.40.5 km/s/Mpc and matter density parameter =0.3150.007 (Planck Collaboration et al. 2020). In § 2, we describe the observations and analysis, we present the results in § 3, which we discuss in § 4, and draw conclusions in § 5.
2 OBSERVATIONS AND ANALYSIS
2.1 Chandra X-ray data
The FXT XRT 210423 was serendipitously discovered on 2021 April 23 (Chandra Observation ID: ObsID 24604), in the direction of Abell 1795 in Chandra archival data and reported by Lin et al. (2021). The transient position was covered by the I3 CCD of the ACIS-I array of CCD detectors. We reprocessed and analysed the data with the CIAO 4.14 software developed by the Chandra X-Ray Center employing CALDB version 4.9.1. To identify the X-ray source, determine its position and its associated uncertainty, we utilize the CIAO source detection tool wavdetect (Freeman et al., 2002) using a series of “Mexican Hat” wavelet functions to account for the varying PSF size across the detector. To improve the Chandra astrometric solution, we cross-match the positions of fifteen X-ray sources with those of their prospective optical counterparts that either come from the Gaia Early Data Release 3 (Gaia-EDR3; Gaia Collaboration et al. 2020) or the Sloan Digital Sky Survey Data Release 16 (SDSS–DR16;Ahumada et al. 2019) catalogues. For this we use the wcs_match script in CIAO. The average residual is arcsec.
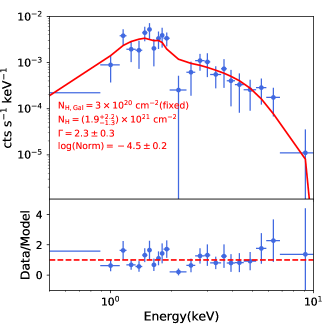
We extracted the source X-ray spectrum with the specextract package in CIAO. For this, we included the X-ray counts within a circular region centered at the X-ray position with a radius of 9.2′′ (corresponding to an encircled energy fraction of 98% given its off-axis angle of 7.5′; Yang et al. 2019). For the background regions, we considered two adjacent rectangular regions (centered on R.A.13h48m59s.27, Dec26∘39′33′′.9 and R.A.13h48m53s.55, Dec26∘39′55′′.3, size of 52′′17′′, and a position angle of the long side of regarding the east-west axis) to cover the gradient emission of the galaxy cluster LEDA 94646, which is the main source of background photons. This procedure yields a count rate of cts s-1 for XRT 210423. Using the Bayesian X-ray Astronomy package (BXA; Buchner et al., 2014), within the fitting environment of XSPEC version 12.10.1f (Arnaud, 1996) and Cash statistics (Cash, 1979), we fitted the spectra of XRT 210423. We used an absorbed power-law model (phabs*zphabs*pow model in XSPEC) to describe the data, where phabs and zphabs describe the Galactic and intrinsic absorption, respectively. For the extraction of the X-ray spectral parameters, we fixed the Galactic hydrogen column density () to 1020 cm-2 (taken from Kalberla et al., 2005; Kalberla & Haud, 2015), while the intrinsic hydrogen column density () is a free parameter in our fit. In addition, we calculate the hardness ratio (see Sect. 3.1), which we define as HR=(-)(+)-1, where and are the count rates in the 2.0–7.0 keV and 0.5–2.0 keV bands, respectively, and we derive their errors based on the Bayesian code BEHR (Park et al., 2006).
2.2 Optical data
We observed the field containing the FXT XRT 210423 with the FOcal Reducer/low dispersion Spectrograph (FORS2; Appenzeller et al. 1998) mounted on the 8.2 m Very Large Telescope (VLT) of the European Southern Observatory (ESO). FORS2 on VLT has a field of view 6.8′ 6.8 ′ and provides a pixel scale of 0.25′′ with 2 2 binning. A total of 7 180 s images were taken on 2021 May 6 in the Johnson-Cousins -band filter with the two 2k×4k MIT CCDs.
The average seeing in the images was around 1.8′′. The ESO reflex data reduction pipeline (Freudling et al. 2013) was used for bias and flat field correction. Next, we employed L.A.Cosmic to remove charge caused by cosmic ray hits from the images (van Dokkum 2001) and stacked them using the IRAF IMCOMBINE task. We applied an astrometric correction to the stacked image using astrometry.net222https://astrometry.net/(Lang et al. 2010).
On May 13 and June 10, 2021, we also obtained simultaneous , , , , and -band images with the HiPERCAM instrument mounted on the 10.4 m Gran Telescopio Canarias (GTC) at the Roque de los Muchachos Observatory (La Palma, Spain). Seventeen frames with an exposure time of 180 s each were obtained. HiPERCAM with 2 2 binning provides a plate scale of 0.16′′ per pixel and a field of view of 2.8′ 1.4′ on GTC (Dhillon et al. 2021). The average seeing in the images was around 1.4′′ and 0.9′′ for the first and second epoch, respectively.
The HiPERCAM data reduction steps were performed using a dedicated data reduction pipeline, including bias subtraction, flat field and fringe correction.333https://cygnus.astro.warwick.ac.uk/phsaap/HiPERCAM/docs/html/ For both epochs, the 17 images were averaged to create a single deep image using the IRAF IMCOMBINE task. We scaled each image to a common level (scale=’mode’) before using reject=’avsigclip’ to remove charge caused by cosmic rays.
For each of the combined , , , , and -band HiPERCAM images, we refined the world coordinate information that was based on the telescope pointing using the known astrometric positions of 8 stars from the Pan-STARRS catalogue (Chambers et al. 2016). We used the centroid algorithm in IRAF PHOT and IRAF CCMAP to determine the world coordinate solution and applied the astrometric corrections using IRAF CCSETWCS.
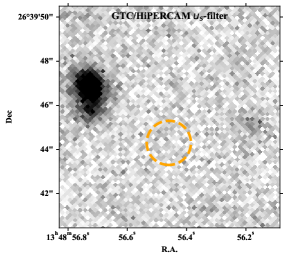
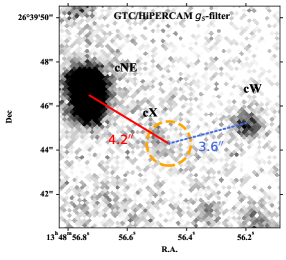
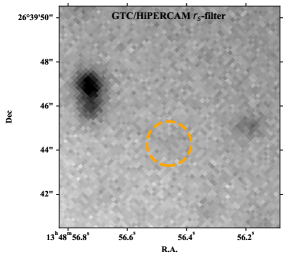
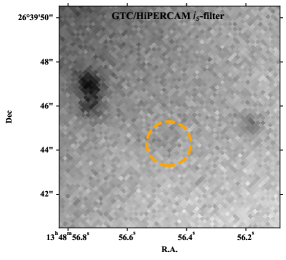
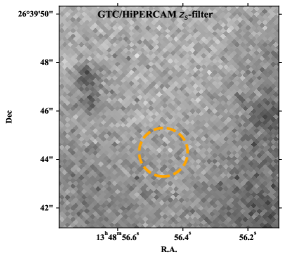
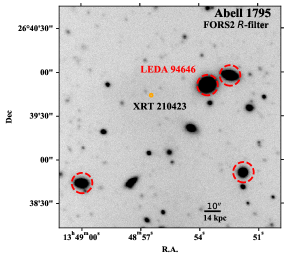
We used SExtractor (Bertin & Arnouts 1996) to extract the R.A. and Dec, magnitude, and magnitude error from all the objects detected in the stacked image. Photometric calibration of the image was done using stars from the Pan-STARRS DR2 catalogue data for , , , and filters (Chambers et al. 2016). For the zero point value of the -filter, we used SDSS catalogue data. For the FORS2 image we used the transformation equation of Lupton (2005) to convert the Pan-STARRS magnitudes given in the Sloan - and bands to a Johnson-Cousins -band magnitude. The resultant GTC/HiPERCAM , , , , , and the VLT/FORS2 -filter images of the field of XRT 210423 are shown in Figure 1.
We obtained a spectrum of the galaxy SDSS J134856.75+263946.7, which lies 4.2′′ from the position of the FXT XRT 210423 on May 16, 2021 using the X-SHOOTER instrument mounted on the UT3 VLT (Vernet et al. 2011). X-SHOOTER is a multi-wavelength (300-2500 nm), medium–resolution spectrograph mounted at the Cassegrain focus. Using slit widths of 1.3′′/1.2′′/1.2′′, we obtained exposures of 2 735 sec, 2680 sec, and 4300 sec in the UVB, VIS, and NIR arm of the spectrograph, respectively. For data reduction, we used the ESO Reflex pipeline (Freudling et al. 2013).
3 RESULTS
3.1 The X-ray light curve and spectrum
The Chandra X-ray position of XRT 210423 is R.A.13h48m56s.46 and Dec26∘39′44′′.3 (with a 3 positional uncertainty of 1′′; with an X-ray localization uncertainty of 0.31′′from wavdetect and an uncertainty of 0.14′′ associated with tying the source position to the International Celestial Reference System (ICRS), both at confidence level; Rots & Budavári 2011). Our resulting X-ray source position is consistent with that of Lin et al. (2021). We do not detect the source in any other publicly available Chandra observation covering the field of XRT 210423. The data spans a period from 13 years before the outburst to 40 days thereafter. Indeed, Chandra revisited the XRT 210423 field 40 days after the discovery observation of XRT 210423 (ObsId 25049 DDT proposal, PI Dacheng Lin) with an exposure time of 59.3 ks. A 3- upper limit of 1.410-15 erg cm-2 s-1 for the X-ray flux in the 0.5–7 keV band was obtained. Furthermore, the upper limit to any persistent flux of XRT 210423 is erg cm-2 s-1 in the 0.5–7 keV band at 3 confidence level. For this upper limit determination we considered all previous Chandra observations of the field yielding a total exposure time of Ms (for stacking, we used the merge_obs CIAO script), and the statistic developed by Kraft et al. (1991) at 3 confidence level.
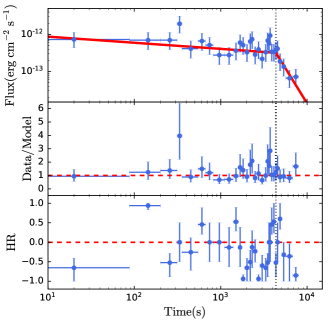
Figure 2, left panels, shows the Chandra 0.5–7 keV light curve of XRT 210423, and its best-fit (broken power-law) model. The light curve of XRT 210423 is comprised of a net (background subtracted) number of photons. The X-ray flash started at about 22:15:40 UT on April 23, 2021 () and lasted for 20–25 ks during a 26.4 ks Chandra observation. The time span over which 5% to 95% of the total detected number of counts was registered, , is 12.1 ks. The light curve is well fit by a broken power-law model (the chi-squared, the number of degrees-of-freedom and the Bayesian Information Criteria are 17.9, 26 and , respectively), with slopes of before the break at ks and after the break (see Fig. 2). The pre-break average flux is 710-13 erg cm-2 s-1, while a minimum flux of 6–710-14 erg cm-2 s-1 is measured in the last bin after the break.
The best-fitting absorbed power–law spectral model is shown in the right panel of Fig 2. The best-fit powerlaw has an index of . The spectrum has an average hardness ratio of HR=. There is no evidence at the 3 level for spectral evolution over the flare (see Fig. 2, bottom left panel). In fact, fits to the spectra extracted before and after the break (dashed vertical line the left panel of Fig. 2) have consistent power-law spectral indices with values of and , respectively. Here, the uncertainties are given at a 90% confidence level.
3.2 Candidate host identification and photometry
We do not discuss the first epoch observation due to the relatively lower quality of data (seeing of 1.4′′). In the second epoch GTC observation on 2021 June 10, we detect a candidate host in the GTC/HiPERCAM -filter within the circular error circle (3 confidence) of the XRT 210423 at R.A. = , Dec = (hereafter called cX; see the GTC/HiPERCAM -filter panel in Figure 1). Using SExtractor, we obtain an aperture (15 pixels corresponding to 2.4′′ in diameter) magnitude of 25.9 0.1 for this candidate host in the band.
We also measured the magnitude of other possible host candidates near the XRT 210423 3 uncertainty region. From the GTC/HiPERCAM and FORS2 images, we obtained the Kron magnitude for the candidate host that lies to the North-East (SDSS J134856.75+263946.7; hereafter called cNE) of the FXT position at R.A. and Dec , . The magnitudes are =22.89 0.15 (the photometric uncertainty is largely dominated by zero-point uncertainty for the -filter), =22.77 0.01, =22.76 0.02, =22.99 0.07, and =22.75 0.11 from the GTC/HiPERCAM observations. cNE has a Kron magnitude of 22.82 0.05 in the FORS2 -filter. A fainter possible host candidate to the west of the FXT (hereafter cW) that lies at R.A. = , Dec= was detected in the , , , , -band images of the GTC/HiPERCAM observation. Aperture photometry of cW for a 2.4′′ aperture diameter gives a magnitude of =25.6 0.2, =25.08 0.07, =24.71 0.08, =23.9 0.1, and =23.4 0.1.
We determined the density of sources brighter than or as bright as the candidate host cX in the HiPERCAM filter to be 0.027 objects/sq. arcsec in a region of 25′′ 25′′ centred on R.A. = , Dec = . Assuming Poisson statistics and considering the 1′′ error region, we compute the probability of a chance alignment between XRT 210423 and cX to be 7.8%. Similarly for cNE and cW we computed the chance alignment probability considering the 4.2′′ and 3.6′′ offset from the center of the X-ray position of XRT 210423, respectively. cNE has a chance alignment probability of 8.1%, whereas it is 16% for cW.
3.2.1 Limiting magnitude and completeness limit
We did not find any transient light (counterpart) to the X-ray transient XRT 210423 in our optical observations. For the second epoch GTC/HiPERCAM and VLT/FORS2 data, we determine the 3 completeness and limiting magnitude using the methods explained in Eappachen et al. (2022). The completeness limits for the images taken in the corresponding filters are =24.7, =25.7, =25.0, =23.9, =23.8, and =22.4 whereas the limiting magnitudes are =26.2, =27.0, =26.1, =24.4, =24.7, and =24.7.
3.3 Spectroscopic redshift of cNE
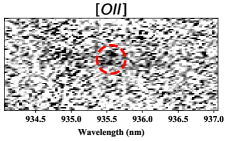
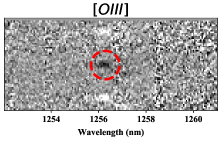
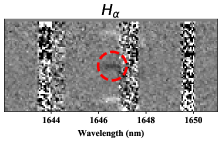
From the X-shooter spectrum of the galaxy cNE (SDSS J134856.75+263946.7), we determine its redshift to be 1.5082 0.0001, using the faint emissions lines at 16465 (restframe wavelength444https://classic.sdss.org/dr6/algorithms/linestable.html 6564.6 H), 12562 (restframe wavelength 5008.2 [O III]; the 4960.3 rest-wavelength emission line is not visible in the two dimensional spectra since the 4960.3 line strength is typically a factor of 1.5 lower compared to the observed 5008.2 emission line which is just detected) and 9356 (restframe wavelength 3729.9 [OII]; 3727.1 is overlapped with a sky line). The centre of the emission lines determined by eye from the two-dimensional spectra were taken for the calculation, and the associated uncertainty is derived from the standard deviation on the redshift calculated using the three different emission lines identified. The two dimensional spectra zoomed-in on these faint emission lines are shown in the Figure 3. This redshift is consistent with that reported by Andreoni et al. (2021) and Jonker et al. (2021). The white lines seen in the two dimensional spectra are caused by the AB nodding on slit, where Y-axis is the spatial direction along the 11′′–long slit.
3.4 Photometric redshifts and galaxy properties
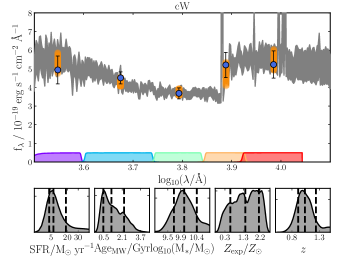
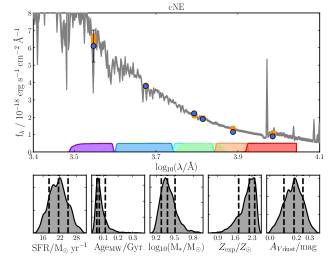
To derive the properties of the galaxies cNE and cW, we employed the code BAGPIPES (Bayesian Analysis of Galaxies for Physical Inference and Parameter EStimation; Carnall et al. 2018). Using the MultiNest sampling algorithm, BAGPIPES fits stellar population models taking into account the star formation history and the transmission function of neutral/ionized ISM for broadband photometry and spectra. Posterior probability distributions for the host galaxy redshift (), age, extinction by dust (), star formation rate (SFR), metallicity (), stellar mass (), and specific star formation rate (sSFR) are determined through the fit by BAGPIPES. We used an exponentially declining star formation history function and the parametrization developed by Calzetti et al. (2000) to account for dust attenuation in the spectral energy distributions (SEDs), fitting for values between 0.0 and 2.0 mag as priors.
Figure 4 shows the 16th to 84th percentile range for the posterior probability distribution for the spectrum and broadband photometry (shaded gray and orange). The used input, observed, photometric data are shown in blue. We determine the photometric redshift of cW to be . The posterior probability distribution of the other fitted parameters are shown in the bottom panels of Figure 4. Similarly, for the galaxy cNE, we obtained the posterior probability distribution for the fitted parameters, considering a fixed redshift of = 1.5082 (see § 3.2 and Figure 4).
3.5 Galaxy offsets
We calculated the galaxy offset for the candidate host galaxies cX, cNE and cW in the -band image. The candidate host cX lies at an offset of 0.6. This corresponds to a physical offset of 0.7 1.2 kpc, if the candidate host galaxy is at the distance of the Abell 1795 cluster (=0.063). For an assumed redshift between 1 and 1.5, the physical offset ranges from 4.5 to 4.8 kpc. We computed the offset between the galaxy cNE and the center of the localization uncertainty region of XRT 210423 to be 4.2. At the redshift of cNE this angular offset translates to a physical projected offset of 379 kpc555We use https://www.astro.ucla.edu/wright/CosmoCalc.html. Similarly, for the galaxy cW, we derive the angular offset to be 3.6. Given the photometric redshift of 1.04 (see § 3.3), this implies a distance of 1700 Mpc, which yields a physical offset of 308 kpc. The offsets of the candidate host galaxies cX, cNE and cW are shown in Figure 1.
4 Discussion
In this manuscript we report on the X-ray detection of the FXT XRT 210423. We furthermore discuss our optical observations. No optical counterpart was discovered. We do detect candidate host galaxies and we discuss their properties and implications for the nature of this FXT. The X-ray light curve of XRT 210423 is well fit by a broken power law. The index before the break is –0.170.06 and this part is called the plateau phase (see Figure 2). XRT 210423’s light curve shares many similarities with that of several other FXTs such as CDFS XT2 (Xue et al. 2019), XRT 100831 (Quirola-Vásquez et al. 2022), XRT 170901 (Lin et al. 2022), XRT 030511 and XRT 110919 (Quirola-Vásquez et al. 2022; Lin et al. 2022). One of the explanations favoured by Xue et al. (2019) for CDFS XT2 is a magnetar-powered fast X-ray transient in the aftermath of the BNS merger. If true, and given the similarities in the light curve shape, the same explanation could be used for XRT 210423. Ai & Zhang (2021) indeed suggest that the XRT 210423 data is consistent with the magnetar models of Zhang (2013), Metzger & Piro (2014), Siegel & Ciolfi (2016a), Siegel & Ciolfi (2016b), and Sun et al. (2017). Sun et al. (2017) defines three zones where the observer would detect a different light curve shape: if the observer’s line of sight is in the jet zone, they would see a beamed SGRB signal, while if it is in the free zone, the observer can detect the FXT but is unlikely to detect a - ray burst. In the trapped zone, the X-ray emission first has to ionize the ejecta material but when the ejecta becomes optically thin the X-ray radiation will become detectable to an external observer. Assuming this model is true, the light curve of XRT 210423 suggests that our line of sight crosses the free zone.
The power-law decay after the break for XRT 210423 is 3.8 1.2, which is consistent within 3 with values found for other FXTs where the light curve can also be well fit with a broken power law (Xue et al. 2019; Quirola-Vásquez et al. 2022; Lin et al. 2022) . For those FXTs, the power law index ranges between 1.6 and 2.2 (median value of 1.9 0.3). The light curve decay index of XRT 210423 and similar FXTs is steeper than that of the median afterglow light curve decay slope for GRBs (1.2; Evans et al. 2009). Sun et al. (2017), in their magnetar model suggest that the decay index might become steeper (steeper than 3) if the magnetar collapses to a black hole (Sun et al. 2017; Ai & Zhang 2021). If the magnetar does not collapse to a black hole, the X-ray light curve in the free zone would follow a decay with a power law index between -1 and -2 (Sun et al. 2017).
A host association and a host redshift determination would help determine the (peak) luminosity, and energy associated with the transient and will allow to convert an angular to a physical offset. Constraints on any or all of these parameters will help constrain the FXT nature. Therefore, we discuss in detail the implications for each of the three possible host galaxies for XRT 210423.
4.1 Assuming cX is the host galaxy for XRT 210423
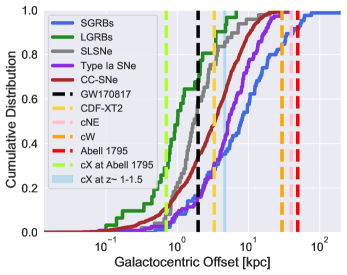
In our second epoch GTC/HiPERCAM observations, we detect the candidate host galaxy cX with the = 25.90.1 within the 1′′ X-ray uncertainty region (see Section 3.2). The lack of detections at other photometric bands preclude the determination of the photometric redshift. If at the distance of the Abell 1795 cluster (=0.063), cX lies at a (projected) offset of 0.7 1.2 kpc from the FXT. Alternatively, if cX is at the distance of the galaxies cNE or cW, the (projected) offset would be 4.8 8.7 kpc or 4.5 8.2 kpc, respectively. The left panel of Figure 5 shows the cumulative host galaxy offset distribution of SGRBs (Fong et al. 2022), long GRBs (Lyman et al. 2017), superluminous supernovae (Schulze et al. 2021), Type Ia SNe (Uddin et al. 2020) and core-collapsed SNe (CC-SNe; Kelly & Kirshner 2012, Schulze et al. 2021) compared with the offsets (in kpc) of GW170817 (Levan et al. 2017), CDFS XT2 (Xue et al. 2019), and XRT 210423. The possible offsets between XRT 210423 and cX are similar to the offsets seen for CDFS XT2, SGRBs, LGRBs, SLSNe and Type Ia SNe (see Left panel of Figure 5).
If cX is at the distance of the Abell cluster, it has an absolute magnitude of = -11.4. Given this absolute magnitude and the fact that cX seems an extended source, we can rule out a globular cluster host considering the observed absolute magnitudes and sizes of globular clusters (Simon 2019). We cannot rule out the possibility that the candidate host galaxy is a faint dwarf galaxy at the distance of the Abell cluster. If so, then the X-ray flare could be due to an IMBH-WD TDE (Maguire et al. 2020). If cX lies at the distance of cNE or cW, the candidate host galaxy would have an absolute magnitude of -19.3 or -18.2, respectively. We cannot discard a dwarf galaxy association even if at such a redshift as these absolute magnitudes are similar to that of the Large Magellanic Cloud (Belokurov & Evans 2022).
4.2 Assuming cNE is the host galaxy for XRT 210423
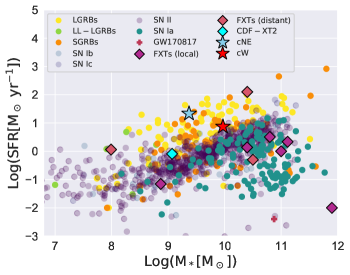
If XRT 210423 is associated with the candidate host galaxy cNE, which has a luminosity distance of 11 Gpc, the transient would have a peak X-ray luminosity of erg s-1. This is consistent with the suggestion of Berger (2014) that BNS mergers have an X-ray peak luminosity of 1044–1051 erg s-1 (considering beamed emission for larger luminosity). The XRT 210423 luminosity at this distance is also consistent with the luminosity of CDFS XT2 for which a distance has been determined through a host galaxy association (Xue et al. 2019) . The offset of XRT 210423 with respect to the candidate host galaxy cNE is consistent with the 90th percentile of the SGRB offsets. The parameters such as SFR and stellar mass of cNE, obtained through the SED fitting using BAGPIPES are shown in Figure 5. In the right panel of Figure 5 we show the stellar mass (M∗) and star-formation rate (SFR) of the candidate host galaxies cNE (coloured star) compared with host galaxies of other transient events. The FXT sample within 100 Mpc (Quirola-Vásquez et al. 2022) tends to have more massive hosts and lower SFR rates than more distant FXTs. The values for the XRT 041230, XRT 080819 and XRT 141001 for the sample of FXTs with distances larger than 100 Mpc have a larger spread than that for the sample of FXTs within 100 Mpc. cNE has a high SFRs compared to the candidate hosts of most FXTs.
The star formation rate and the mass of cNE are consistent with some of the hosts of SGRBs and LGRBs (orange circles and yellow circles, respectively, in the right panel of Figure 5). An SBO origin of the XRT 210423 is very unlikely given the low probability to have such a high peak luminosity ( erg s-1 for supernova SBOs; Soderberg et al. 2008; Waxman & Katz 2017; Goldberg et al. 2022), offset (see Figure 5; Uddin et al. 2020; Kelly & Kirshner 2012; Schulze et al. 2021), and SFR (see Figure 5; Galbany et al. 2014).
4.3 Assuming cW is the host galaxy
The photometric redshift of cW . If XRT 210423 lies at the distance of cW, it had a peak luminosity of (3–7) 1045 erg s-1 and a projected physical offset of 30 8 kpc (pink line in the Left panel of Figure 5). A few SGRBs (orange circles in the right panel of Figure 5) originate from hosts with similar SFR and (cW has a SFR 7.5 yr-1 and [] 1010; Right panel of Figure 5). As in the case of cNE, the host galaxy SFR and M⋆, the offset between the center of the host and the FXT uncertainty region, and the peak X-ray luminosity agree with the values found for SGRBs making a BNS merger scenario possible for XRT 210423. We discard an SBO origin for XRT 210423 based on the high X-ray luminosity and the large physical offset.
4.4 Assuming XRT 210423 is associated with Abell 1795
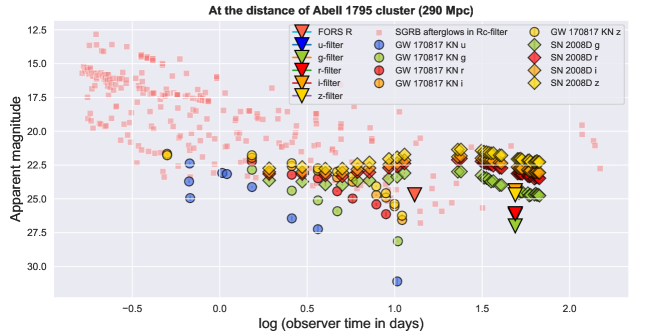
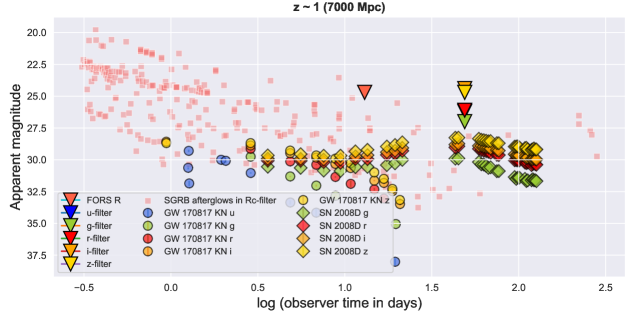
We already briefly discussed a possible association of XRT 210423 with the galaxy cluster Abell 1795 in Section 4.1. However, even if XRT 210423 is not associated with cX it can be associated with Abell 1795, which is at =0.063 (290 Mpc). This is what we discuss here. If XRT 210423 originated at the distance of the Abell 1795 cluster, the projected separation to the closest catalogued cluster galaxy, LEDA 94646 (R.A.:, Dec: ) is 49.1 kpc (bottom right panel of Figure 1). Although this large offset is rare, but not impossible for an SGRB host. On the other hand, the associated offset is too large for a core-collapse SN or a type Ia SN origin of XRT 210423. For the distance of 290 Mpc, XRT 210423 had a peak luminosity of 7 1042 erg s-1. We cannot rule out any of the progenitor models we consider here considering the peak X-ray luminosity. But, if associated with a typical type Ia supernova (peak absolute magnitude of -19 in V-band; Hillebrandt & Niemeyer 2000 or a CC-SNe, peak absolute magnitude of -17.5 in B-band; Richardson et al. 2014) at the distance of the cluster, the optical supernova would have a peak magnitude of 18.5 and 20, respectively. Therefore, it is unlikely that the associated optical supernova went undetected in our deep observations (see Figure 6).
5 Conclusion
We present the X-ray light curve and spectrum and the search for a possible host galaxy of the FXT XRT 210423. We consider various candidate hosts for XRT 210423, namely: a candidate host galaxy, called cX, detected in the -filter of the GTC/HiPERCAM image with a magnitude of 25.9 0.1 that falls within the 3 X-ray uncertainty region, a candidate host at a redshift, , named cNE, and a candidate host at a redshift, , named cW. Finally, we also investigate if XRT 210423 can be associated with the galaxy cluster Abell 1795. Considering the association of XRT 210423 with the candidate host cX in the 3-sigma X-ray uncertainty region, both a BNS and a WD-IMBH TDE origin remain plausible. For all host scenarios, we can rule out that the FXT originates in an SN SBO. The galactocentric offset, star formation rate, mass, and luminosity of the candidate hosts cW and cNE are consistent with a BNS merger origin. The plateau in the X-ray light curve is similar to that of the FXT CDFS XT2, also seen in some SGRBs, consistent with a BNS merger origin.
6 Acknowledgements
DE acknowledges discussions with Ashley Chrimes, Fiorenzo Stoppa, Nicola Gaspari and Anne Inkenhaag. FEB acknowledges support from ANID-Chile BASAL CATA ACE210002 and FB210003, FONDECYT Regular 1200495 and 1190818, and Millennium Science Initiative Program – ICN12_009. MF is supported by a Royal Society - Science Foundation Ireland University Research Fellowship. JQV acknowledges support from ANID grants Programa de Capital Humano Avanzado folio #21180886, CATA-Basal AFB-170002, and Millennium Science Initiative ICN12_009. Based on observations collected at the European Southern Observatory under ESO programme 105.209R.001 (PI Jonker). We thank the anonymous referee for the helpful comments on this manuscript.
The design and construction of HiPERCAM was funded by the European Research Council under the European Union’s Seventh Framework Programme (FP/2007-2013) under ERC-2013-ADG Grant Agreement no. 340040 (HiPERCAM). VSD and HiPERCAM operations are supported by STFC grant ST/V000853/1. This work is based on observations made with the Gran Telescopio Canarias (GTC), installed at the Spanish Observatorio del Roque de los Muchachos of the Instituto de Astrofísica de Canarias, in the island of La Palma. The Pan-STARRS1 Surveys (PS1) and the PS1 public science archive have been made possible through contributions by the Institute for Astronomy, the University of Hawaii, the Pan-STARRS Project Office, the Max-Planck Society and its participating institutes, the Max Planck Institute for Astronomy, Heidelberg and the Max Planck Institute for Extraterrestrial Physics, Garching, The Johns Hopkins University, Durham University, the University of Edinburgh, the Queen’s University Belfast, the Harvard-Smithsonian Center for Astrophysics, the Las Cumbres Observatory Global Telescope Network Incorporated, the National Central University of Taiwan, the Space Telescope Science Institute, the National Aeronautics and Space Administration under Grant No. NNX08AR22G issued through the Planetary Science Division of the NASA Science Mission Directorate, the National Science Foundation Grant No. AST-1238877, the University of Maryland, Eotvos Lorand University (ELTE), the Los Alamos National Laboratory, and the Gordon and Betty Moore Foundation.
SDSS-IV acknowledges support and resources from the Center for High Performance Computing at the University of Utah. The SDSS website is www.sdss.org. SDSS-IV is managed by the Astrophysical Research Consortium for the Participating Institutions of the SDSS Collaboration including the Brazilian Participation Group, the Carnegie Institution for Science, Carnegie Mellon University, Center for Astrophysics — Harvard & Smithsonian, the Chilean Participation Group, the French Participation Group, Instituto de Astrofísica de Canarias, The Johns Hopkins University, Kavli Institute for the Physics and Mathematics of the Universe (IPMU) / University of Tokyo, the Korean Participation Group, Lawrence Berkeley National Laboratory, Leibniz Institut für Astrophysik Potsdam (AIP), Max-Planck-Institut für Astronomie (MPIA Heidelberg), Max-Planck-Institut für Astrophysik (MPA Garching), Max-Planck-Institut für Extraterrestrische Physik (MPE), National Astronomical Observatories of China, New Mexico State University, New York University, University of Notre Dame, Observatário Nacional / MCTI, The Ohio State University, Pennsylvania State University, Shanghai Astronomical Observatory, United Kingdom Participation Group, Universidad Nacional Autónoma de México, University of Arizona, University of Colorado Boulder, University of Oxford, University of Portsmouth, University of Utah, University of Virginia, University of Washington, University of Wisconsin, Vanderbilt University, and Yale University.
References
- Ahumada et al. (2019) Ahumada, R., Allende Prieto, C., Almeida, A., et al. 2019, arXiv e-prints, arXiv:1912.02905. https://arxiv.org/abs/1912.02905
- Ai & Zhang (2021) Ai, S., & Zhang, B. 2021, ApJ, 915, L11, doi: 10.3847/2041-8213/ac097d
- Alp & Larsson (2020) Alp, D., & Larsson, J. 2020, ApJ, 896, 39, doi: 10.3847/1538-4357/ab91ba
- Andreoni et al. (2021) Andreoni, I., Perley, D., Kasliwal, M., et al. 2021, The Astronomer’s Telegram, 14641, 1
- Appenzeller et al. (1998) Appenzeller, I., Fricke, K., Fürtig, W., et al. 1998, The Messenger, 94, 1
- Arnaud (1996) Arnaud, K. A. 1996, Astronomical Society of the Pacific Conference Series, Vol. 101, XSPEC: The First Ten Years, ed. G. H. Jacoby & J. Barnes, 17
- Bauer et al. (2017) Bauer, F. E., Treister, E., Schawinski, K., et al. 2017, MNRAS, 467, 4841, doi: 10.1093/mnras/stx417
- Belokurov & Evans (2022) Belokurov, V., & Evans, N. W. 2022, Nature Astronomy, 6, 911, doi: 10.1038/s41550-022-01740-w
- Berger (2014) Berger, E. 2014, ARA&A, 52, 43, doi: 10.1146/annurev-astro-081913-035926
- Bertin & Arnouts (1996) Bertin, E., & Arnouts, S. 1996, A&AS, 117, 393, doi: 10.1051/aas:1996164
- Buchner et al. (2014) Buchner, J., Georgakakis, A., Nandra, K., et al. 2014, A&A, 564, A125, doi: 10.1051/0004-6361/201322971
- Calzetti et al. (2000) Calzetti, D., Armus, L., Bohlin, R. C., et al. 2000, ApJ, 533, 682, doi: 10.1086/308692
- Carnall et al. (2018) Carnall, A. C., McLure, R. J., Dunlop, J. S., & Davé, R. 2018, MNRAS, 480, 4379, doi: 10.1093/mnras/sty2169
- Cash (1979) Cash, W. 1979, ApJ, 228, 939, doi: 10.1086/156922
- Chambers et al. (2016) Chambers, K. C., Magnier, E. A., Metcalfe, N., et al. 2016, arXiv e-prints, arXiv:1612.05560. https://arxiv.org/abs/1612.05560
- Cowperthwaite et al. (2017) Cowperthwaite, P. S., Berger, E., Villar, V. A., et al. 2017, ApJ, 848, L17, doi: 10.3847/2041-8213/aa8fc7
- Dai et al. (2006) Dai, Z. G., Wang, X. Y., Wu, X. F., & Zhang, B. 2006, Science, 311, 1127, doi: 10.1126/science.1123606
- Dhillon et al. (2021) Dhillon, V. S., Bezawada, N., Black, M., et al. 2021, MNRAS, 507, 350, doi: 10.1093/mnras/stab2130
- Eappachen et al. (2022) Eappachen, D., Jonker, P. G., Fraser, M., et al. 2022, MNRAS, 514, 302, doi: 10.1093/mnras/stac1194
- Evans et al. (2009) Evans, P. A., Beardmore, A. P., Page, K. L., et al. 2009, MNRAS, 397, 1177, doi: 10.1111/j.1365-2966.2009.14913.x
- Fong et al. (2022) Fong, W.-f., Nugent, A. E., Dong, Y., et al. 2022, arXiv e-prints, arXiv:2206.01763. https://arxiv.org/abs/2206.01763
- Freeman et al. (2002) Freeman, P. E., Kashyap, V., Rosner, R., & Lamb, D. Q. 2002, ApJS, 138, 185, doi: 10.1086/324017
- Freudling et al. (2013) Freudling, W., Romaniello, M., Bramich, D. M., et al. 2013, A&A, 559, A96, doi: 10.1051/0004-6361/201322494
- Gaia Collaboration et al. (2020) Gaia Collaboration, Brown, A. G. A., Vallenari, A., et al. 2020, arXiv e-prints, arXiv:2012.01533. https://arxiv.org/abs/2012.01533
- Galbany et al. (2014) Galbany, L., Stanishev, V., Mourão, A. M., et al. 2014, A&A, 572, A38, doi: 10.1051/0004-6361/201424717
- Glennie et al. (2015) Glennie, A., Jonker, P. G., Fender, R. P., Nagayama, T., & Pretorius, M. L. 2015, MNRAS, 450, 3765, doi: 10.1093/mnras/stv801
- Goldberg et al. (2022) Goldberg, J. A., Jiang, Y.-F., & Bildsten, L. 2022, ApJ, 933, 164, doi: 10.3847/1538-4357/ac75e3
- Hillebrandt & Niemeyer (2000) Hillebrandt, W., & Niemeyer, J. C. 2000, ARA&A, 38, 191, doi: 10.1146/annurev.astro.38.1.191
- Im et al. (2017) Im, M., Yoon, Y., Lee, S.-K. J., et al. 2017, ApJ, 849, L16, doi: 10.3847/2041-8213/aa9367
- Irwin et al. (2016) Irwin, J. A., Maksym, W. P., Sivakoff, G. R., et al. 2016, Nature, 538, 356, doi: 10.1038/nature19822
- Jonker et al. (2021) Jonker, P., Levan, A., Torres, M., Eappachen, D., & Quirola, J. 2021, Transient Name Server AstroNote, 160, 1
- Jonker et al. (2013) Jonker, P. G., Glennie, A., Heida, M., et al. 2013, ApJ, 779, 14, doi: 10.1088/0004-637X/779/1/14
- Kalberla et al. (2005) Kalberla, P. M. W., Burton, W. B., Hartmann, D., et al. 2005, A&A, 440, 775, doi: 10.1051/0004-6361:20041864
- Kalberla & Haud (2015) Kalberla, P. M. W., & Haud, U. 2015, A&A, 578, A78, doi: 10.1051/0004-6361/201525859
- Kelly & Kirshner (2012) Kelly, P. L., & Kirshner, R. P. 2012, ApJ, 759, 107, doi: 10.1088/0004-637X/759/2/107
- Kraft et al. (1991) Kraft, R. P., Burrows, D. N., & Nousek, J. A. 1991, ApJ, 374, 344, doi: 10.1086/170124
- Lang et al. (2010) Lang, D., Hogg, D. W., Mierle, K., Blanton, M., & Roweis, S. 2010, AJ, 139, 1782, doi: 10.1088/0004-6256/139/5/1782
- Levan et al. (2017) Levan, A. J., Lyman, J. D., Tanvir, N. R., et al. 2017, ApJ, 848, L28, doi: 10.3847/2041-8213/aa905f10.48550/arXiv.1710.05444
- Lin et al. (2021) Lin, D., Irwin, J. A., & Berger, E. 2021, The Astronomer’s Telegram, 14599, 1
- Lin et al. (2022) Lin, D., Irwin, J. A., Berger, E., & Nguyen, R. 2022, ApJ, 927, 211, doi: 10.3847/1538-4357/ac4fc6
- Lupton (2005) Lupton, R. 2005, Lutpon transformation equations, https://classic.sdss.org/dr4/algorithms/sdssUBVRITransform.html
- Lyman et al. (2017) Lyman, J. D., Levan, A. J., Tanvir, N. R., et al. 2017, MNRAS, 467, 1795, doi: 10.1093/mnras/stx220
- Maguire et al. (2020) Maguire, K., Eracleous, M., Jonker, P. G., MacLeod, M., & Rosswog, S. 2020, Space Sci. Rev., 216, 39, doi: 10.1007/s11214-020-00661-2
- Mazzali et al. (2008) Mazzali, P. A., Valenti, S., Della Valle, M., et al. 2008, Science, 321, 1185, doi: 10.1126/science.1158088
- Metzger & Piro (2014) Metzger, B. D., & Piro, A. L. 2014, MNRAS, 439, 3916, doi: 10.1093/mnras/stu247
- Metzger et al. (2008) Metzger, B. D., Quataert, E., & Thompson, T. A. 2008, MNRAS, 385, 1455, doi: 10.1111/j.1365-2966.2008.12923.x
- Modjaz et al. (2009) Modjaz, M., Li, W., Butler, N., et al. 2009, ApJ, 702, 226, doi: 10.1088/0004-637X/702/1/226
- Novara et al. (2020) Novara, G., Esposito, P., Tiengo, A., et al. 2020, ApJ, 898, 37, doi: 10.3847/1538-4357/ab98f8
- Park et al. (2006) Park, T., Kashyap, V. L., Siemiginowska, A., et al. 2006, ApJ, 652, 610, doi: 10.1086/507406
- Peng et al. (2019) Peng, Z.-K., Yang, Y.-S., Shen, R.-F., et al. 2019, ApJ, 884, L34, doi: 10.3847/2041-8213/ab481b
- Planck Collaboration et al. (2020) Planck Collaboration, Aghanim, N., Akrami, Y., et al. 2020, A&A, 641, A6, doi: 10.1051/0004-6361/201833910
- Quirola-Vásquez et al. (2022) Quirola-Vásquez, J., Bauer, F. E., Jonker, P. G., et al. 2022, A&A, 663, A168, doi: 10.1051/0004-6361/202243047
- Richardson et al. (2014) Richardson, D., Jenkins, Robert L., I., Wright, J., & Maddox, L. 2014, AJ, 147, 118, doi: 10.1088/0004-6256/147/5/118
- Rosswog et al. (2009) Rosswog, S., Ramirez-Ruiz, E., & Hix, W. R. 2009, ApJ, 695, 404, doi: 10.1088/0004-637X/695/1/404
- Rots & Budavári (2011) Rots, A. H., & Budavári, T. 2011, ApJS, 192, 8, doi: 10.1088/0067-0049/192/1/8
- Rowlinson et al. (2013) Rowlinson, A., O’Brien, P. T., Metzger, B. D., Tanvir, N. R., & Levan, A. J. 2013, MNRAS, 430, 1061, doi: 10.1093/mnras/sts683
- Saxton et al. (2021) Saxton, R., Komossa, S., Auchettl, K., & Jonker, P. G. 2021, Correction to: X-Ray Properties of TDEs, Space Science Reviews, Volume 217, Issue 1, article id.18, doi: 10.1007/s11214-020-00759-7
- Schulze et al. (2021) Schulze, S., Yaron, O., Sollerman, J., et al. 2021, ApJS, 255, 29, doi: 10.3847/1538-4365/abff5e
- Siegel & Ciolfi (2016a) Siegel, D. M., & Ciolfi, R. 2016a, ApJ, 819, 14, doi: 10.3847/0004-637X/819/1/14
- Siegel & Ciolfi (2016b) —. 2016b, ApJ, 819, 15, doi: 10.3847/0004-637X/819/1/15
- Simon (2019) Simon, J. D. 2019, ARA&A, 57, 375, doi: 10.1146/annurev-astro-091918-104453
- Soderberg et al. (2008) Soderberg, A. M., Berger, E., Page, K. L., et al. 2008, Nature, 453, 469, doi: 10.1038/nature06997
- Sun et al. (2017) Sun, H., Zhang, B., & Gao, H. 2017, ApJ, 835, 7, doi: 10.3847/1538-4357/835/1/7
- Uddin et al. (2020) Uddin, S. A., Burns, C. R., Phillips, M. M., et al. 2020, ApJ, 901, 143, doi: 10.3847/1538-4357/abafb7
- van Dokkum (2001) van Dokkum, P. G. 2001, PASP, 113, 1420, doi: 10.1086/323894
- Vernet et al. (2011) Vernet, J., Dekker, H., D’Odorico, S., et al. 2011, A&A, 536, A105, doi: 10.1051/0004-6361/201117752
- Waxman & Katz (2017) Waxman, E., & Katz, B. 2017, Shock Breakout Theory, 967, doi: 10.1007/978-3-319-21846-5_33
- Wilms et al. (2020) Wilms, J., Kreykenbohm, I., Weber, P., et al. 2020, The Astronomer’s Telegram, 13416, 1
- Xue et al. (2019) Xue, Y. Q., Zheng, X. C., Li, Y., et al. 2019, Nature, 568, 198, doi: 10.1038/s41586-019-1079-5
- Yang et al. (2019) Yang, G., Brandt, W. N., Zhu, S. F., et al. 2019, MNRAS, 1535, doi: 10.1093/mnras/stz1605
- Zhang (2013) Zhang, B. 2013, ApJ, 763, L22, doi: 10.1088/2041-8205/763/1/L22