Chemical models of adenine precursors cyanamide and carbodiimide in the interstellar medium
Abstract
Cyanamide (NH2CN) and its isomer, carbodiimide (HNCNH), may form adenine in the interstellar medium (ISM) via a series of reactions. Therefore, they are considered key prebiotic molecules in the study of the origin of life. We used the three-phase NAUTILUS chemical code, which includes the gas, the dust surface, and the icy mantle, to investigate the formation and destruction of cyanamide and carbodiimide. We added over 200 new chemical reactions of the two isomers and related species, and established a relatively complete network. We applied cold core, hot corino/core and shock models to simulate the different physical environments, and found that the two isomers are mainly produced by the free radical reactions on grain surfaces. Our simulated results suggest that cyanamide and carbodiimide molecules come from surface chemistry at early evolutionary stages. Then they are released back to the gas phase, either by thermal process (in hot cores, hot corinos) or shock-induced desorption (in shock regions). We speculate that it is an inefficient route to form a tautomer of adenine by starting from molecules cyanoacetylene (C3NH), cyanamide and carbodiimide in ISM.
keywords:
astrochemistry – molecular processes – ISM: abundances – ISM: molecules.1 Introduction
How life on Earth began remains an unexplained scientific problem. Prebiotic chemistry addresses this issue through the aspects of theory, experiment and observation. However, large molecules of life such as ribonucleic acid RNA break down easily and are difficult to survive in the harsh interstellar environment. Therefore, they may be studied indirectly by their precursors: relatively small prebiotic molecules. Molecules containing cyano (CN) functional group are regarded as intermediates for the formation of purines and proteins (De Becker, 2013). Adenine is one of purine of DNA and RNA nucleobases and is always presumed to be the product of HCN pentamer reaction (Chakrabarti & Chakrabarti, 2000). However, Smith et al. (2001) found the reaction from HCN to adenine to be inefficient under interstellar medium (ISM) conditions. Merz et al. (2014) provided a new route for adenine synthesis, using the concept of retrosynthetic analysis to create a tautomer of adenine, starting from molecules cyanoacetylene (C3NH), carbodiimide(HNCNH) and its isomer cyanamide (NH2CN). Chakrabarti et al. (2015) proposed that observers may look in the ISM for the two precursors C3NH and HNCNH which are equally important for predicting abundances of adenine. Both C3NH and HNCNH have been observed in the ISM (Kawaguchi et al., 1992; McGuire et al., 2012).
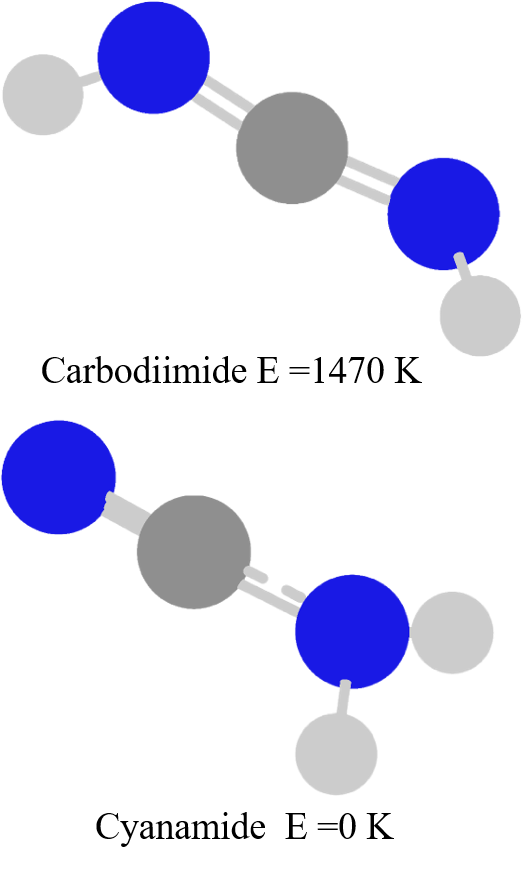
NH2CN is one of the simplest organic molecules featuring cyano and amide groups. It is also the most stable of the isomers with the formula CH2N2. HNCNH is the second one, which is less stable than NH2CN by about 4 kcal mol-1 and therefore it is expected to be present in a smaller amount at thermal equilibrium (Jabs et al., 1999). The structural images of two isomers are shown in Fig. 1. NH2CN is recognized as an important prebiotic molecule in the study of the origin of life (Steinman et al., 1964; Brack, 1999). It can be converted into urea in liquid water (Kilpatrick, 1947), while HNCNH can lead to isourea, a urea tautomer (Tordini et al., 2003). Urea has been observed to be present in Sgr B2(N1) (Belloche et al., 2019). However, Duvernay et al. (2004, 2005) did not detect the hydrolysis reaction of cyanamide or carbodiimide to form urea or isourea at low temperature (180 K) in their experimental study. Molecules with HNCNH moiety (-NCN-) are considered important condensing agents that are able to assemble amino acids into peptides in liquid water (Williams & Ibrahim, 1981).
| Source name | Tex (K) | N (cm-2) | N (H2) (cm-2) | Abundance | Reference |
|---|---|---|---|---|---|
| Sgr B2 | 2060 | Turner et al. (1975) | |||
| Sgr B2(OH) | 15 | Cummins et al. (1986) | |||
| Sgr B2(N) | 500 | Nummelin et al. (2000) | |||
| Sgr B2(N) | 150 | Belloche et al. (2013) | |||
| Sgr B2(M) | 68 | Nummelin et al. (2000) | |||
| Orion-KL | 100, 200 | White et al. (2003) | |||
| NGC 253 | 67 | Martín et al. (2006) | |||
| M 82? | 80.3 | Aladro et al. (2011) | |||
| G0.253+0.016 | Rathborne et al. (2015) | ||||
| IRAS 20126+4104 | 210 | Palau et al. (2017) | |||
| IRAS 16293-2422 B | 100, 300 | Coutens et al. (2018) | |||
| NGC 1333 IRAS2A | 130 | Coutens et al. (2018) | |||
| NGC 1333 IRAS2A1 | 150 | Belloche et al. (2020) | |||
| NGC 1333 IRAS4A2 | 150 | Belloche et al. (2020) | |||
| SVS13A | 220 | Belloche et al. (2020) | |||
| Barnard 1b? | 60, 200 | Marcelino et al. (2018) | |||
| G+0.693 | 6.3(ortho), 6.8(para) | Zeng et al. (2018) | |||
| NGC 6334I | 135-285 | Ligterink et al. (2020) | |||
| Notes. tentative detection. | |||||
In the interstellar medium, NH2CN was detected for the first time toward Sgr B2 by Turner et al. (1975), with a column density of 21014 cm-2. Since then, it has been detected in several high-mass star forming regions, Sgr B2(N), Sgr B(M), Orion KL and NGC 6334I (Nummelin et al., 2000; White et al., 2003; Ligterink et al., 2020), the extragalactic sources, NGC 253 and M86 (Martín et al., 2006; Aladro et al., 2011), the molecular cluster G0.253+0.016 (Rathborne et al., 2015), the massive protostar IRAS 20126+4104 (Palau et al., 2017), two solar-type protostars, IRAS 16293-2422B and NGC 1333 IRAS2A (Coutens et al., 2018), the young protostar system Barnard 1B (Marcelino et al., 2018), and the quiescent giant molecular cloud, G+0.693-0.027 (hereafter G+0.693) (Zeng et al., 2018). A list of cyanamide with selected observed information is shown in Table 1.
In contrast to NH2CN, HNCNH was only detected through weak maser emission toward the massive star formation region Sgr B2(N) using data from Green Bank Telescope (GBT) PRIMOS survey by McGuire et al. (2012). The column density of HNCNH was derived to be 21013cm-2, which is about one order of magnitude lower than that of NH2CN. Coutens et al. (2018) searched for HNCNH toward 16293-2422B and NGC1333 IRAS2A using ALMA Protostellar Interferometric Line Survey (PILS) and IRAM Plateau de Bure Interferometer (PdBI). However, HNCNH was not found and only a column density upper limit of 31015cm-2 was set. Rivilla et al. (2021) also searched for HNCNH in the G+0.693 cloud and set an upper limit of 2.51013cm-2.
In this work, we have added more than 200 reactions relating to NH2CN and HNCNH to the KIDA 2016 network. We consider the experimentally approved or theoretically suggested reactions concerning these two isomers in the models. We proposed new reaction routes which were confirmed by quantum chemistry calculations, and present them in Section 2. We built astrochemical models to simulate the formation and destruction mechanisms of the two prebiotic molecules under the different physical conditions. Also, we explored the possible interstellar environment to form these molecules and illustrate them in Section 3. We discussed the implications of the results in Section 4, and draw conclusions in Section 5.
2 Chemistry of cyanamide and carbodiimide
2.1 Formation and destruction of cyanamide and carbodiimide
The formation routes of cyanamide have been explored in many methods. Smith et al. (2004) proposed the reaction of CN + NH3 NH2CN + H, but a high barrier was found to form NH2CN and H in gas phase according to a theoretical study (Talbi & Smith, 2009). Later, Blitz et al. (2009) experimentally confirmed that this reaction was only the path to produce HCN and NH2. Sleiman et al. (2018a) proposed the reaction between CN and CH3NH2 as an efficient route to form NH2CN in ISM through low temperature kinetics experimental and theoretical studies. In their subsequent work, Sleiman et al. (2018b) further concluded that the route to form CH2NH2 + HCN is barrierless thus is the major production channel. Puzzarini et al. (2020) found CN + CH3NH2 has four reaction channels. Coutens et al. (2018) proposed the reaction of NH2 and CN may directly form NH2CN on grain surface.
Carbodiimide may be formed from the isomerization of cyanamide. The activation energy of this process is extremely high in gas phase, while it can be drastically reduced in the presence of water molecules (Tordini et al., 2003). Duvernay et al. (2004) confirmed that isomerization can become significant with water-ice at low temperatures by experiment. Duvernay et al. (2005) further verified through experiments that the isomerization reaction could occur by a photochemical process or when cyanamide is condensed at low temperature (50-140 K) on an amorphous water ice surface or trapped in the water ice, which acts like a catalyst. In addition, He et al. (1991) proposed three gas-phase reactions associated with HNCNH at high temperatures. Yadav et al. (2019) obtained two formation routes of HNCNH by quantum chemical calculation in gas phase or on grain surfaces. The first path is the reaction HNC + NH HNCNH. The second one contains two steps: NH + CN HNCN, followed by HNCN + H HNCNH. However, in ISM, the addition reaction would hardly take place in such low-density gas due to the difficulty to release excess energy. Therefore, these addition reactions just occur on dust grains in ISM.
The chemistry of cyanamide and carbodiimide has been investigated by multiple research groups. But so far, no efficient gas-phase formation reactions have been proposed. The origin of cyanaminde and carbodiimide in the ISM remains unclear. In this work, we ran quantum chemical calculations to evaluate the reactions of the two isomers and their related species. We found that the reaction of NH2 + HNC and HNCN + CH2 to produce NH2CN and HNCNH, respectively, have relative high barriers (Reactions (1)-(2)). Besides, we list some key destruction reactions below (Reactions (3)-(6)).
NH2 + HNC NH2CN + H, (1)
HNCN + CH2 HNCNH + CH, (2)
NH2CN + H HNCN + H2, (3)
HNCNH + H HNCN + H2, (4)
HNCNH + OH HNCN + H2O, (5)
NH2CN + OH HNCN + H2O. (6)
In addition to the reactions mentioned above, two radicals can likely add together on the grain surface and are assumed to be barrierless (Reaction (7)-(9)), although when the radicals attach to water ice, there might be a barrier (Enrique-Romero
et al., 2019). HNCN can form both cyanamide and carbodiimide through hydrogenation. Therefore, the formation we also propose reactions of HNCN (Reactions (8)-(9)).
HNCN + H NH2CN, (7)
HNC + N HNCN, (8)
NCN + H HNCN. (9)
Rate coefficients for gas-phase reactions of NH2CN, HNCNH and related species are summarized in Table LABEL:tab:gas-phase. The formulae that are used to calculate rate coefficients are categorized by different reaction types. For cosmic-ray induced photodissociation and UV photodissociation, the formulae are expressed as follows: = , = exp (-Av) respectively, where is cosmic-ray ionization rate; Av is the visual extinction (mag). The rate parameters of the cosmic-ray photodissociation and UV photodissociation reactions of cyanamide, carbodiimide and related species (HNCN, NCN) were estimated based on similar reactions already existing in the chemical network. Branching ratios to different product channels are often unmeasured for ion-molecule reactions that can lead to multiple products. To address this, we make the simplifying assumption that the different reaction channels occur equally, and thus have the same branching ratio. And the corresponding rate is calculated as = (0.62 + 0.4767 , except the reactions from Woon & Herbst (2009), where the corresponding rates are = . This formula is also adopted for the neutral-neutral reactions and dissociative recombination reactions.
Related surface reactions are listed in Table 3 with their activation energy barriers. The barriers of free radical groups are assumed to be zero in this work. There is a high isomerization barrier between NH2CN and HNCNH in the gas phase. But on ice surface, this barrier is low enough so that the reaction can take place even at a low temperature (Duvernay et al., 2005). Therefore, the surface isomerization reaction is added in the chemical reaction network in Table 3. As for the binding energies of NH2CN and HNCNH, we adopt the value of 5556 K for both isomers, as listed in Table 4. Besides, the binding energies of all other newly added species are also included in the table.
2.2 Quantum chemical calculations
All quantum chemical calculations reported here were performed with the double-hybrid B2PLYP functions (Grimme, 2006) combined with the may-cc-pVTZ basis set to optimize the structure and to calculate the frequency for all species and transition states involved in the study (Dunning, 1989; Papajak et al., 2009). Semi-empirical dispersion contributions were also included by means of the D3BJ model (Goerigk & Grimme, 2011; Grimme et al., 2011). Saddle points were assigned to reaction paths by using intrinsic reaction coordinate (IRC) (Fukui, 1981) calculations at the same B2PLYP level as the identification of reactants and products. To achieve accurate energies for the stationary points from the optimization at the B2PLYPD3/may-cc-pVTZ level, the highly cost-effective method of CCSD(T) (Purvis III & Bartlett, 1982; Scuseria et al., 1988; Scuseria & Schaefer III, 1989), together with the basis sets aug-cc-pVTZ was further used. All quantum chemical calculations were run with the GAUSSIAN 16 program (Frisch et al., 2016).
| Reaction | Ref. | |||
| Cosmic Ray Induced Photodissociation | (-) | (-) | (-) | |
| NH2CN NH2 + CN | 9.50E+03 | 0 | 0 | Harada et al. (2010) |
| NH2CN H + HNCN | 9.50E+03 | 0 | 0 | This work |
| HNCNH NH + HNC | 9.50E+03 | 0 | 0 | This work |
| HNCNH H + HNCN | 9.50E+03 | 0 | 0 | This work |
| HNCN N2 + CH | 9.50E+03 | 0 | 0 | Bise et al. (2001) |
| HNCN HCN + N | 9.50E+03 | 0 | 0 | Bise et al. (2001) |
| HNCN HNC + N | 9.50E+03 | 0 | 0 | Bise et al. (2001) |
| HNCN NCN + H | 9.50E+03 | 0 | 0 | Bise et al. (2001) |
| NCN N2 + C | 9.50E+03 | 0 | 0 | Bise et al. (1999) |
| NCN N + CN | 9.50E+03 | 0 | 0 | Bise et al. (1999) |
| Photodissociation | (-) | (-) | ||
| NH2CN NH2 + CN | 1.00E-09 | 0 | 1.7 | OSU database |
| NH2CN H + HNCN | 1.00E-09 | 0 | 1.7 | This work |
| HNCNH NH + HNC | 1.00E-09 | 0 | 1.7 | This work |
| HNCNH H + HNCN | 1.00E-09 | 0 | 1.7 | This work |
| HNCN N2 + CH | 1.00E-09 | 0 | 1.7 | Bise et al. (2001) |
| HNCN HCN + N | 1.00E-09 | 0 | 1.7 | Bise et al. (2001) |
| HNCN HNC + N | 1.00E-09 | 0 | 1.7 | Bise et al. (2001) |
| HNCN NCN + H | 1.00E-09 | 0 | 1.7 | Bise et al. (2001) |
| NCN N2 + C | 1.00E-09 | 0 | 1.7 | Bise et al. (1999) |
| NCN N + CN | 1.00E-09 | 0 | 1.7 | Bise et al. (1999) |
| Ion-neutral | (-) | (-) | ||
| C+ + NH2CN NH2CN+ + C | 0.50 | 1.48E-09 | 8.57 | This work |
| C+ + NH2CN C2N+ + NH2 | 0.50 | 1.48E-09 | 8.57 | This work |
| C+ + HNCNH HNCNH+ + C | 0.50 | 1.57E-09 | 3.66 | This work |
| C+ + HNCNH HNCN + CH+ | 0.50 | 1.57E-09 | 3.66 | This work |
| H+ + NH2CN NH2 + HNC+ | 0.50 | 4.73E-09 | 8.13 | Woon & Herbst (2009) |
| H+ + NH2CN NH + HNC | 0.50 | 4.73E-09 | 8.13 | Woon & Herbst (2009) |
| H+ + HNCNH HNC+ + NH2 | 0.50 | 4.85E-09 | 3.66 | This work |
| H+ + HNCNH HNC + NH | 0.50 | 4.85E-09 | 3.66 | This work |
| He+ + NH2CN NH2 + CN+ + He | 0.50 | 2.45E-09 | 8.13 | Woon & Herbst (2009) |
| He+ + NH2CN NH + CN + He | 0.50 | 2.45E-09 | 8.13 | Woon & Herbst (2009) |
| He+ + HNCNH HNC+ + NH + He | 0.50 | 2.51E-09 | 3.66 | This work |
| He+ + HNCNH HNC + NH+ + He | 0.50 | 2.51E-09 | 3.66 | This work |
| H + NH2CN NH2CNH+ + H2 | 0.50 | 2.79E-09 | 8.13 | Woon & Herbst (2009) |
| H + NH2CN HCN+ + NH2 + H2 | 0.50 | 2.79E-09 | 8.13 | This work |
| H + HNCNH NH2CNH+ + H2 | 0.33 | 2.86E-09 | 3.66 | This work |
| H + HNCNH HNC+ + NH2 + H2 | 0.33 | 2.86E-09 | 3.66 | This work |
| H + HNCNH HNC + NH + H2 | 0.33 | 2.86E-09 | 3.66 | This work |
| H3O+ + NH2CN HCN+ + NH2 + H2O | 0.50 | 1.25E-09 | 8.57 | This work |
| H3O+ + NH2CN NH2CNH+ + H2O | 0.50 | 1.25E-09 | 8.57 | This work |
| H3O+ + HNCNH NH2CNH+ + H2O | 0.33 | 1.33E-09 | 3.66 | This work |
| H3O+ + HNCNH HNC+ + NH2 + H2O | 0.33 | 1.33E-09 | 3.66 | This work |
| H3O+ + HNCNH HNC + NH + H2O | 0.33 | 1.33E-09 | 3.66 | This work |
| HCO+ + NH2CN NH2CNH+ + CO | 0.50 | 1.13E-09 | 8.13 | Woon & Herbst (2009) |
| HCO+ + NH2CN HCN+ + NH2 + CO | 0.50 | 1.13E-09 | 8.13 | This work |
| HCO+ + HNCNH NH2CNH+ + CO | 0.33 | 1.16E-09 | 3.66 | This work |
| HCO+ + HNCNH HNC+ + NH2 + CO | 0.33 | 1.16E-09 | 3.66 | This work |
| HCO+ + HNCNH HNC + NH + CO | 0.33 | 1.16E-09 | 3.66 | This work |
| He+ + HNCN CN+ + NH + He | 0.50 | 2.39E-09 | 5.30 | This work |
| He+ + HNCN CN + NH+ + He | 0.50 | 2.39E-09 | 5.30 | This work |
| C+ + HNCN HNCN+ + C | 0.50 | 1.50E-09 | 5.30 | This work |
| C+ + HNCN NCN + CH+ | 0.50 | 1.50E-09 | 5.30 | This work |
| H+ + HNCN NCN+ + H2 | 0.50 | 4.61E-09 | 5.30 | This work |
| H+ + HNCN HNCN+ + H | 0.50 | 4.61E-09 | 5.30 | This work |
| H + HNCN HNCNH+ + H2 | 0.33 | 2.73E-09 | 5.30 | This work |
| H + HNCN HNC+ + NH + H2 | 0.33 | 2.73E-09 | 5.30 | This work |
| H + HNCN HNC + NH+ + H2 | 0.33 | 2.73E-09 | 5.30 | This work |
| H3O+ + HNCN HNCNH+ + H2O | 0.33 | 1.26E-09 | 5.30 | This work |
| H3O+ + HNCN HNC+ + NH + H2O | 0.33 | 1.26E-09 | 5.30 | This work |
| H3O+ + HNCN HNC + NH+ + H2O | 0.33 | 1.26E-09 | 5.30 | This work |
| HCO+ + HNCN HNCNH+ + CO | 0.33 | 1.11E-09 | 5.30 | This work |
| HCO+ + HNCN HNC+ + NH + CO | 0.33 | 1.11E-09 | 5.30 | This work |
| HCO+ + HNCN HNC + NH+ + CO | 0.33 | 1.11E-09 | 5.30 | This work |
| He+ + NCN CN+ + N + He | 0.50 | 2.27E-09 | 1.69 | This work |
| He+ + NCN CN + N+ + He | 0.50 | 2.27E-09 | 1.69 | This work |
| C+ + NCN NCN+ + C | 0.50 | 1.43E-09 | 1.69 | This work |
| C+ + NCN CN + CN+ | 0.50 | 1.43E-09 | 1.69 | This work |
| H+ + NCN NCN+ + H | 0.50 | 4.39E-09 | 1.69 | This work |
| H+ + NCN CN+ + NH+ | 0.50 | 4.39E-09 | 1.69 | This work |
| H + NCN HNCN+ + H2 | 0.33 | 2.59E-09 | 1.69 | This work |
| H + NCN CN+ + NH + H2 | 0.33 | 2.59E-09 | 1.69 | This work |
| H + NCN CN + NH+ + H2 | 0.33 | 2.59E-09 | 1.69 | This work |
| H3O+ + NCN HNCN+ + H2O | 0.33 | 1.21E-09 | 1.69 | This work |
| H3O+ + NCN CN+ + NH + H2O | 0.33 | 1.21E-09 | 1.69 | This work |
| H3O+ + NCN CN + NH+ + H2O | 0.33 | 1.21E-09 | 1.69 | This work |
| HCO+ + HNCN HNCN+ + CO | 0.33 | 1.06E-09 | 1.69 | This work |
| HCO+ + HNCN CN+ + NH + CO | 0.33 | 1.06E-09 | 1.69 | This work |
| HCO+ + HNCN CN + NH+ + CO | 0.33 | 1.06E-09 | 1.69 | This work |
| Neutral-neutral | (-) | (-) | ||
| NH2 + HNC NH2CN + H | 8.05E-10 | 0.5 | 2.69E+03 | This work |
| NH2 + CH2 HNCNH + H | 9.46E-10 | 0.5 | 5.76E+03 | This work |
| HNCNH + H HNCN + H | 1.70E-10 | 0.5 | 5.03E+03 | This work |
| NH2CN + H HNCN + H | 7.75E-10 | 0.5 | 6.34E+03 | This work |
| HNCNH + OH HNCN + H2O | 8.64E-10 | 0.5 | 6.62E+02 | This work |
| NH2CN + OH HNCN + H2O | 1.41E-11 | 0.0 | 3.28E+03 | Espinosa-Garcia et al. (1993) |
| HNCN + OH HNCN + H2O | 8.07E-10 | 0.5 | 6.52E+02 | This work |
| HNCN + H HNCN + H2 | 1.54E-10 | 0.5 | 2.29E+03 | This work |
| Dissociative Recombination | (-) | (-) | ||
| NH2CN+ + e- CN + NH2 | 1.50E-07 | -0.5 | 0 | This work |
| NH2CNH+ + e- HNC + NH2 | 1.50E-07 | -0.5 | 0 | OSU database |
| NH2CNH+ + e- NH2CN + H | 1.50E-07 | -0.5 | 0 | OSU database |
| NH2CNH+ + e- HNCNH + H | 1.50E-07 | -0.5 | 0 | This work |
| HNCNH+ + e- HNC + NH | 1.50E-07 | -0.5 | 0 | This work |
| HNCNH+ + e- HNCN + H | 1.50E-07 | -0.5 | 0 | This work |
| HNCN+ + e- H + NCN | 1.50E-07 | -0.5 | 0 | This work |
| HNCNH+ + e- HNCN + H | 1.50E-07 | -0.5 | 0 | This work |
| NCN+ + e- N + CN | 1.50E-07 | -0.5 | 0 | This work |
| Surface reactions | Ea(K) | Ref. |
|---|---|---|
| NH2 + HNC NH2CN + H | 2.69E+03 | This work |
| HNCN + CH2 HNCNH + CH | 5.76E+03 | This work |
| NH2 + CN NH2CN | 0 | Coutens et al. (2018) |
| H + HNCN NH2CN | 0 | This work |
| H + HNCN HNCNH | 0 | Yadav et al. (2019) |
| NH + HNC HNCNH | 0 | Yadav et al. (2019) |
| NCN + H2 NH2CN | 0 | This work |
| H + NCN HNCN | 0 | Rivilla et al. (2021) |
| NH + CN HNCN | 0 | Yadav et al. (2019) |
| N + CN NCN | 0 | This work |
| HNCNH + H HNCN + H | 5.03E+03 | This work |
| NH2CN + H HNCN + H | 6.34E+03 | This work |
| HNCNH + OH HNCN + H2O | 6.64E+02 | This work |
| NH2CN + OH HNCN + H2O | 3.28E+03 | Espinosa-Garcia et al. (1993) |
| HNCN + OH HNCN + H2O | 6.54E+02 | This work |
| HNCN + H HNCN + H2 | 2.29E+03 | This work |
| NH2CN HNCNH | 4.30E+03 | Duvernay et al. (2005) |
| Species | Edes(K) | Ref. |
|---|---|---|
| NH2CN | 5556 | NH2+CN, Garrod & Herbst (2006) |
| HNCNH | 5556 | NH2CN |
| HNCN | 2500 | NH+CN |
| NCN | 2400 | N+CN |
3 ASTROCHEMICAL MODEL
To investigate the formation and destruction mechanism of cyanamide and its isomer carbodiimide, we use the three-phase NAUTILUS chemical code (Ruaud et al., 2016), which includes the gas, the dust grain surface and the icy mantle. The code allows us to compute abundances of chemical species with respect to time for a given set of physical and chemical parameters by setting up and solving a series of ordinary differential equations. In this study, in addition to the related reactions of cyanamide and carbodiimide, our network also includes updates of the chemistry of HNCO and its metastable isomers (Quan et al., 2010), CH3CHNH chemistry (Quan et al., 2016), as well as the chemistry of cyanomethanimine (Zhang et al., 2020). We have added more than 200 reactions concerning NH2CN and HNCNH. Except for gas-phase reactions as shown in Table LABEL:tab:gas-phase, the rate constants of reactions are calculated by the corresponding equations according to Hasegawa et al. (1992), Ruaud et al. (2016) on surface and mantle phases. We use the standard oxygen-rich low-metal elemental abundances. The initial abundances (Graedel et al., 1982; Quan & Herbst, 2007) are listed in Table 5. All abundances are given with respect to the total hydrogen density. The code simulates chemistry in three phases and also considers various possible exchanges between the different phases via accretion, thermal and non-thermal desorption. The latter includes cosmic-ray desorption, photodesorption via external photons or those via photons produced by cosmic rays (Öberg et al., 2007), and reactive desorption using the Rice-Ramsperature-Kessel (RRK) approach (Garrod et al., 2007). The surface-mantle and mantle-surface exchange of species is also considered, such as accretion and desorption but with a smaller diffusion rate of the species compared to the processes on the surface (Ruaud et al., 2016). The diffusion energy to binding energy ratio is set to be 0.5 for all species. Grains are assumed to be spherical with the radii of 0.1 m, The density of dusts is 3 g cm-3 and the dust-to-gas mass ratio is 0.01.
| Species | Abundance |
|---|---|
| He | |
| N | |
| O | |
| H2 | |
| C+ | |
| S+ | |
| Si+ | |
| Fe+ | |
| Na+ | |
| Mg+ | |
| P+ | |
| Cl+ | |
| F+ |
Cyanamide has been detected in many different types of sources, while carbodiimide is only detected in Sgr B2(N) by maser emission. We classified the sources where cyanamide was detected into three categories: hot cores (e.g. Sgr B2(N), Orion KL) (Turner et al., 1975; Nummelin et al., 2000; White et al., 2003), hot corinos (e.g. IRAS 16293-2422B, NGC 1333IRA2A) (Coutens et al., 2018), and low-velocity shock regions (e.g. G+0.693, NGC 253) (Zeng et al., 2018; Martín et al., 2006). Correspondingly, to simulate how NH2CN and HNCNH are formed and destroyed in the ISM, we applied three sets of models with different physical conditions: cold cores, hot cores/hot corinos, and shock models. Regarding G+0.693, a quiescent molecular cloud located within the Sgr B2 star-forming complex in the Central Molecular Zone (CMZ). The shock that is yielded from a cloud-cloud collision (Zeng et al., 2020), ultimately sputters icy mantles of grains efficiently. For NGC 253, the origin of the large-scale shocks is also suggested to be associated with a cloud–cloud collision (Ellingsen et al., 2017). Furthermore, NGC 253 and G+0.693 have similar physical properties, including gas kinetic temperatures and H2 densities (Zeng et al., 2020).
In cold core models, the physical parameters remain constant with a hydrogen density of nH = n(H) + 2n(H2) = 2104 cm-3, the gas and grain temperatures of 10, 15 and 20 K, a visual extinction Av of 10 mag, a cosmic ray ionization rate of 1.310-17 s-1, UV factor of 1 Habing and a single grain radius of 0.1 .
| Source(Stage) | nH(cm-3) | T(K) | AV (mag) | (s-1) | UV factor (Habing) |
| The freefall collapsea,b | 3 1.6 | 10 | 2 6.109102 | 1.310-17 | 1 |
| The warm-upb,d | 1.6 | 10 150, 200 | 6.109102 | 1.310-17 | 1, 10 |
| The freefall collapsea,c | 3 6 | 10 | 2 1.472105 | 1.310-17 | 1 |
| The warm-upc,d | 6 | 10 200, 400 | 1.472105 | 1.310-17 | 1 |
| Notes. aGarrod & Herbst (2006), bBonfand et al. (2019), cJørgensen et al. (2016), d Coutens et al. (2018) | |||||
According to the different periods of evolution, star formation can be divided into the following two stages: The first is to simulate the growth of the protostar through the accretion of the outer envelope region, namely the freefall collapse process or prestellar phase. During this stage (1 106 yr), the temperature stays at a constantly low value, the density increases gradually with time, and the extinction also increases. The gas and grain temperatures were set at 10 K, the initial gas density was 3103 cm-3, the final collapse density was set at two values, the low density of 1.6107 cm-3, and the high density of 61010 cm-3. The second stage is the warm-up stage, during which the temperature rises according to the formula (Garrod & Herbst, 2006), where = 2, th = 2 105 yr, ), t0 = 1 105 yr. After an initial cold phase of 1 105 yr, the gas and grain temperatures increase from 10 K to the maxima Tmax of 150, 200 and 400 K within a time frame of 2 105 yr. After reaching the maximum value, the temperature remains unchanged. During this stage, the gas and dust temperatures are assumed to be well coupled. The major physical parameters of hot core/hot corino models are summarized in Table 6.
In the shock models, we use the NAUTILUS code combined with the planar magnetohydrodynamic (MHD) shock code MHD_VODE (Flower & Pineau des Forêts, 2015) to simulate the chemical evolution under shock conditions. As we know, there are no signs of star formation toward G+0.693, of which the large-scale, low-velocity shocks may be yielded from a cloud-cloud collision (Zeng et al., 2020). Armijos-Abendaño et al. (2020) constrained the cloud-cloud collision age to 0.5 Myr for Sgr B2. Barnes et al. (2017) provided a broader time-scale of 0.5–0.9 Myr, assuming that clouds remain quiescent for 0.3–0.5 Myr after star formation. Therefore, before shock coming, we adopted two time-lengths of evolution stages for the cold core condition, 3105 and 5105 yr, respectively. The grain temperature of G+0.693 molecular cloud is 30 K (Rodríguez-Fernández et al., 2004), so we assumed that the pre-shock gas and dust temperatures were 20 and 30 K, respectively, while the pre-shock gas density is 2104 cm-3. The cosmic ray ionization rate in G+0.693 is 100 or even 1000 times larger than that in the Galactic disc (Zeng et al., 2019). Accordingly, we adopted two higher cosmic ray ionization rates of 1.310-15, and 1.310-14 s-1. In this study, we have considered weak C-type shock waves with a speed of 10 km s-1. The major physical parameters of the shock wave models are summarized in Table 7.
| Parameter | Value |
|---|---|
| Initial density (cm-3) | 2104 |
| Pre-shock temperature (K) | 20, 30 |
| Radiation field (Habing) UV factor | 1 |
| Cosmic ray ionization rate (s-1) | 1.310-15, 1.310-14 |
| Visual extinction (mag) | 10 |
| Magnetic field strength parameter | 1.0 |
| Shock speed (km s-1) | 10 |
4 RESULTS
4.1 Cold cores
Results from cold core models are shown in Fig. 2. It can be seen that cyanamide and carbodiimide are hardly produced in the gas phase, but can be slowly formed on the grain mantles at 10 K. The abundances of cyanamide and carbodiimide reach 10-9 and 10-10 on the grain at the time of yr, respectively. In those models, carbodiimide is mainly produced by the isomerization reaction of cyanamide on the grains. This conclusion agrees with the experiment by Duvernay et al. (2005). In the experiment, cyanamide formed carbodiimide when it was on amorphous water ice surfaces or was trapped in the water ice where the water ice acted like a catalyst and greatly lower the isomerization barrier. Therefore, cyanamide’s abundance becomes lower than carbodiimide’s at the time of 30 yr. At 15 and 20 K, gaseous cyanamide isomers’ abundance peaks are as low as 10-11, suggesting that they are still ineffectively produced. After 100 years, the cyanamide isomers are produced in a great amount on grain mantles. The maximum fractional abundances of cyanamide and carbodiimide can reach to 10-7 and 10-8 at 15 K, and 10-6 and 10-7 at 20 K, respectively. Under these conditions, the main formation routes of cyanamide are the addition reactions of free radicals on the grain surface, NCN + H2, HNCN + H and NH2 + CN. For carbodiimide, the major formation reaction is hydrogenation of HNCN. In these processes, even at the low temperatures, small molecules still can overcome the diffusion barriers, and react to form large molecules like NH2CN and HNCNH on the grain surface.
4.2 Hot cores/hot corinos
Results of hot core / hot corino models are shown In in Fig. 3. The leftmost panels show the variations of calculated abundances of NH2CN and HNCNH versus time during the freefall collapse stage. In the gas phase, the two species are produced with very low abundances in two collapse densities, while they can be produced in a large amount after 4105 yr on grains with the rapidly increasing density. The main formation route is the reaction of HNCN + H on grain surface and icy mantle for both NH2CN and HNCNH. Besides, NH2CN can also be formed by the reaction of NCN + H2. The maximum fractional abundance reaches 10-11. We found that the two different collapse densities affect little on the fractional abundances of the isomers in gas-phase nor on grain surface.
The right two columns of Fig. 3 show computational results from four models, corresponding to different maximum temperatures in warm-up stages and different gas densities gained from the freefall collapse conditions. As shown in the two top right panels, the warm-up models can produce sufficient abundances of NH2CN and HNCNH during the warm-up to maximum temperatures of 150 and 200 K with the hydrogen density of 1.6107 cm-3. Their peak fractional abundances can reach 610-9 and 210-10 at Tmax of 150 and 200 K, respectively. The physical parameters of top panels represent the sources of Sgr B2(N) suggested by Bonfand et al. (2019). The observational result is taken from Belloche et al. (2013). The emission of NH2CN corresponding to the warm component is optically thin for a source size of 2, the rotational temperature is 150 K, the column density is 5.131016 cm-2. In the other set of parameters, the density is 1013 cm-2 for the size of 60 where the gas is diluted. We adopt the hydrogen column density of 1.541025 cm-2 for the hot cores (Bonfand et al., 2017). The observed abundance of cyanamide is 310-9. We conclude that our simulated results are in good agreement with the observation within the time range of 2.9-4.2105 yr. Carbodiimide has been detected in Sgr B2(N) (McGuire et al., 2012). Its column density was anticipated to be 21013 cm-2 according to Duvernay et al. (2005), where the HNCNH abundance is 10 of the abundance of NH2CN from ice experiment. In our models, the calculated ratio of HNCNH to NH2CN is 9.4 at the time of 3.65105 yr when HNCNH abundance reaches its peak for Tmax = 150 K. Similarly, the ratio is 8.6 at the time of 3.40105 yr for Tmax = 200 K. The simulated ratios are very close to the experimental value of 10. However, when NH2CN abundance reaches its peak value, the ratio is getting lower. In the gas phase, the isomers mainly come from the surface by thermal desorption processes. A large amount of surface NH2CN and HNCNH desorb into the gas phase at temperature up to 140 K. This agrees with the experimental results by Duvernay et al. (2005), in which the desorption temperature of HNCNH is determined to be 130-140 K. We used the same binding energy of 5556 K for both isomers, as shown in Table 4. From Fig 3, it can be seen that when the temperature increases, the two isomers’ abundances rise significantly. This is because the thermal energy is sufficient to drive reactants to overcome the diffusion barriers on grain surface at 50 K. During the warm-up stage, the major formation reactions are NCN + H2 for NH2CN, HNC + NH for HNCNH on the grain surface. Besides, the isomers are destroyed by free radical OH on the grain surface, especially carbodiimide is. Eventually, when the temperature reaches 70 K, the isomers become to desorb efficiently, leading to their peak abundances at 140 K in the gas phase. During the warm-up stage, the two isomers desorb efficiently from the dust surface into the gas phase by thermal desorption. This agrees with the mechanism introduced by Garrod & Herbst (2006) to study interstellar complex organic molecules. After reaching the peak, the abundances of the two isomers subsequently decrease due to active destruction reactions in the gas-phase, including reactions with positive ions such as H+, H, C+, He+ and H3O+ and the free radical OH.
As shown in the two bottom right panels of Fig. 3, the warm-up models overproduce NH2CN and HNCNH during the warm-up to Tmax of 200 and 400 K with the hydrogen density of 61010 cm-3. The peak fractional abundances reach 310-9 for both NH2CN and HNCNH. The physical parameters of bottom panels correspond to the source of IRAS 16293-2422B (Jørgensen et al., 2016; Coutens et al., 2018). The observational results originated from Coutens et al. (2018) and the abundance of cyanamide is derived to be 210-10. Therefore, our simulated abundances are larger than the observation at the time range of 2.9-4.2105 yr and 2.3-2.7105 yr. Under the conditions of Tmax reaches 200 and 400 K, cyanamide and carbodiimide also firstly form on the grain surface, then desorb into gas phase by thermal process when temperature increases to 70 K. The main formation reactions are the same as those described above in the case of low gas density. On the other hand, the main destruction reactions are ion-neutral reactions by H for Tmax = 200 K. Besides, there is a rapid decline of the fractional abundance of NH2CN and HNCNH at Tmax of 400 K. That is because at this high temperature not only the rates of formation reactions increase but destruction reactions are also faster. The latter include ion-neutral reactions by H, and by atomic H. Although these reactions have high barriers, they can still take place at a high temperature above 200 K. The simulated ratio of NH2CN to HNCNH is 6 when HNCNH abundance reaches its peak value for Tmax of 200 K, while the ratio is 4 for Tmax of 400 K. The cause is that the reaction barrier of HNCNH + H is smaller than that of NH2CN + H, as shown in Table 3. The reaction rate of the former is higher than the latter. HNCNH is more quickly destroyed than NH2CN is.
There is high UV radiation in high mass star formation regions. Therefore, we used two higher values of UV factor, 10 and 100 times larger than the normal value for models with the hydrogen density of 1.6 107 cm-3 to further simulate the physical conditions in Sgr B2(N). In the models, only the warm-up stage adopts the high UV factor. The results are shown in Fig. 4, It can be seen that fractional abundances of cyanamide are lower comparing to the results from the standard UV factor computations for both Tmax of 150 and 200 K. Stronger UV radiations destroy the two isomers at higher chemical reaction rates. The peak abundance of cyanamide drops from 6.7910-9 to 2.9810-9 at the time of 3.16105 yr as the UV factor increases from 1 to 10 for Tmax of 150 K. For the case of UV factor of 100, it has the same trend as the UV factor of 10, and the peak abundance of cyanamide deduced to 2.5310-9 at the same time. For Tmax of 200 K, the abundance of cyanamide reduced from 6.9110-9 to 4.3710-9 at the time of 2.74105 yr when the UV factor increases from 1 to 10. With UV factor 100, the abundance of cyanamide further reduced to 3.7410-9. Fig. 4 shows that the UV factor affects more on Tmax = 150 K than on Tmax = 200 K. The effects of UV factors 10 and 100 have a small difference on cyanamide’s abundances. The simulated cyanamide abundances also agree well with the observational result within a certain time range, but it lasts a shorter period than using the standard UV factor. Although it is not shown here, the high UV factor has the same effect on the fractional abundance of carbodiimide as on that of cyanamide.
Formamide (NH2CHO) is the simplest molecule which includes peptide bond -NH-C(=O)-. It has been observed in a wide variety of sources including not only hot cores, hot corinos, protostellar shocked regions, but also comets. Detailed observational results are summarized in Table 1 of Lopez-Sepulcre et al. (2019). On the other hand, NH2CN hasn’t been detected in any comets so far. It was only detected in hot and dense regions like SgrB2(N), IRAS 16293-2422B, and the source in which wide low-velocity shock waves exist, such as G+0.693. The ratio of NH2CHO to NH2CN varies in different types of sources (Coutens et al., 2018). In our study, NH2CHO has the same desorption energy with NH2CN (5556 K), which is close to the desorption energy of water, so that they have the same desorption temperature. NH2CHO is mainly produced by the reaction of NH2 + H2CO NH2CHO + H in the gas phase (Garrod et al., 2008). We use the rate coefficient of NH2 + H2CO in the gas phase from Skouteris et al. (2017)’s computations, and add the reaction on grain surface as well. NH2CN is mainly produced by surface reactions of HNCN + H, NCN + H2 and NH2 + CN. NH2CHO and NH2CN have the competition to use NH2 as the precursor on the grain surface. The formation reaction of formamide has a low potential barrier (4.48 K) so that it is relatively easier to form than cyanamide is. As the result, NH2CHO exists more widely than NH2CN in ISM. As shown in Fig. 5, in standard UV factor models, the calculated ratio of NH2CN to NH2CHO is 0.02 at the time of 3.16105 yr in which both of them reach their peak abundance positions for Tmax of 150 K. Similarly, the ratio is 0.03 at the time of 2.74105 yr for Tmax of 200 K. The simulated ratios agree well with the observational value of 0.02-0.04 toward Sgr B2(N) (Coutens et al., 2018). In UV factor 10 models, the ratio of NH2CN to NH2CHO increases from 0.02 to 0.12 and from 0.03 to 0.36 for Tmax of 150 K and 200 K, respectively. In UV factor = 100 models, the ratio is greater than 1. Therefore, the ratio increases with higher UV factor. A strong UV radiation inhibits the formation of NH2CHO. Under strong UV radiation conditions, more NH2 are destroyed by H, which are produced by photodissociation reactions. Formation efficiency of NH2CHO thus decreases. While it affects less on NH2CN, the latter has more formation routes other than from the reactant NH2.
4.3 C-type shocked regions
Results of C-type shock models are shown in Fig. 6. In the pre-shock stage, cyanamide and its isomer, carbodiimide, have been produced in a large amount on the grain surface, while the gas phase formation reactions are inefficient because of the low temperature. After shock comes at the velocity of 10 km s-1, the gas density is increased by an order of magnitude, eventually leading to the final density of 105 cm-3. The gas and dust temperatures rapidly increase to over five hundred Kelvin. In Fig. 6, t = 0 denotes the onset of the shock. At this time, cyanamide and carbodiimide abundances are taken from the exit values of the previous stage of the cold core models. Then the gaseous cyanamide and carbodiimide fractional abundances dramatically increase with the time when shock propagates. Meanwhile, grain surface abundances of these molecules decrease rapidly. The shock heats the grain and sputters molecules from the grain mantles. Comparing to the observation, all of these abundances can reach the range of the observation, but within different time periods. For = 1.310-15s-1, the range of time is 3.9-7.6102 yr after 3105 yr of cold core conditions. This range is shorter (3.9-6.8102 yr) if the cold core evolves for 5105 yr, as shown in the top panels of Fig. 6. For = 1.310-14s-1, there are only a small time-window in which the result agrees with the observation, which are 50 and 40 yr with the evolution of time t = 3105 and 5105 yr for cold core conditions, respectively, as shown in the bottom panels of Fig. 6. We found that molecular peak values can be reached at a shorter time with higher cosmic ray ionization rates. That is because stronger cosmic ray accelerates the formation reactions of free radical so that lager molecules form more quickly on grain surface. Using high cosmic ray ionization rates reduces the time to reach peak abundances. Besides, the two isomers’ abundances reach the range of observation on the grain surface before the shock comes under cold core conditions with the evolution of time t = 3105 and 5105 yr. As the result, their gas phase abundances may agree with the observation after shock sputters them off the dust grains. The final temperature varies with the value of . In addition, when is 1.310-15 s-1, the past-shock temperature stays at 65 K. Therefore, small species accrete back on the grain from the gas phase, and complex organic molecules (COMs) will form on grain surface, like cyanamide and carbodiimide, as shown in top panels of Fig. 6. When is 1.310-14 s-1, all species have been sputtered by shock into gas phase at peak temperatures (above 1000 K). Then the temperature starts to drop, still above 130 K. Almost all cyanamide molecules no longer exist on grain as the temperature is equal to its’ desorption temperature. Molecules that are smaller than cyanamide are hard to deplete on grain. So, there are no COMs like cyanamide could form on grain surfaces. Two examples are shown in bottom panels of Fig. 6. For pre-shock temperature of 30K, our results agree with the observation using = 1.310-14 s-1, but this is not for the case for = 1.310-15 s-1. In the shock models, the origin of cyanamide and carbodiimide is also from the grain surface by free radical reactions, which are NH2 + CN, HNCN + H and NCN + H2 for cyanamide, and HNCN + H for carbodiimide. This is similar to results under cold core conditions. So, we speculated that the two isomers are mainly formed by sublimation process to release COMs, which were previously formed in the solid phase, into the gas phase. The destruction reactions include cosmic ray induced photodissociation, and ion-neutral reactions by H , H3O+ for of 1.310-15s-1. When is 1.310-14s-1, the destruction reactions are ion-neutral reactions by H+ and the reaction of NH2CN/HNCNH + H. According to our calculations, a strong cosmic ray ionization (10-15 s-1), shortens the time for the isomers to reach their peak abundances, and decreases the efficiency of their formation on dust grains.
As a precursor of cyanamide and carbodiimide, HNCN also has been detected toward G+0.693 with the abundance of 9.110-11, which is an order of magnitude lower than cyanamide abundance. Our simulated results reach 10-9, one order of magnitude larger than the observational result, but the high abundance of HNCN only lasts a very short period of time because HNCN is rapidly converted into cyanamide and carbodiimide by hydrogenation.
According to Merz et al. (2014), NH2CN, HNCNH and C3NH may create a tautomer of adenine with retrosynthetic analysis. The three molecules are all detected in ISM, but are in different types of sources. So far, C3NH was only detected in a standard cold core TMC-1, cyanamide was mainly detected in hot cores/corinos or shock regions, and carbodiimide was only detected in the hot core Sgr B2(N). Therefore, we preliminarily infer that they are produced under different physical conditions, and it is very unlikely that they could appear in the same region. C3NH’s fractional abundance is 210-11 from our shock models. This agrees with the suggested value of 1.510-11 in the tentative detection by Zeng et al. (2018). Besides, the three-body reaction to form the tautomer is hard to occur in ISM.
5 CONCLUSIONS
In this work, we ran chemical simulations to calculate the evolution of NH2CN and HNCNH in ISM. The main results are summarized as follows:
1. Cyanamide has been formed during the prestellar phase in hot cores or hot corinos. The formation process is interpreted as resulting from the sublimation of the icy mantles of dust grains. This agrees with the observations that this molecule generally has been found in the compact and hot regions with T100 K. A similar process could also occur through shocks, like in the region of G+0.693 where cyanamide was detected.
2. Our modelling results suggest that cyanamide and carbodiimide molecules come from surface chemistry formation at early evolutionary stages. They are subsequently released back to the gas phase, either by thermal process(in hot cores or hot corinos) or by shock-induced desorption (in shock regions). Comparing with the observations, our simulations are well verified. We found that cyanamide and carbodiimide are mainly formed by free radical reactions on dust grain surfaces, and are destroyed by positive ions in gas phase, as well as OH and H both in gas phase and on grain surfaces. The two isomers are difficult to form in gas phase because of high barriers of gaseous formation reactions. Thus, they are unlikely to be detected in the cold dark cloud cores.
3. Strong UV radiation significantly lower the abundances of cyanamide and carbodiimide. Stronger UV destroys the two isomers with faster chemical reaction rates. Besides, from high UV factor models, the ratio of NH2CN to NH2CHO increases comparing to a standard UV factor.
4. Strong cosmic ray ionization shortens the time for the isomers to reach peak abundances, and decreases the efficiency of their formation on dust grains.
5. C3NH is formed by gas reactions at low temperatures, and its fractional abundance is low in our simulations where cyanamide has relatively high abundances. Therefore, it is an inefficient route to form a tautomer of adenine by starting from molecules C3NH, HNCNH and NH2CN in ISM.
Acknowledgements
This work was supported by the Natural Science Foundation of Xinjiang Uygur Autonomous Region (2022D01A156), the National Key R&D Program of China (No.2022YFA1603103), the "Tianchi Doctoral Program 2021", the National Natural Science Foundation of China under grant 12203091, 11973075, 12173075.
DATA AVAILABILITY STATEMENT
The datasets generated during this study are available in the article and from the corresponding author upon request.
References
- Aladro et al. (2011) Aladro R., Martín S., Martín-Pintado J., Mauersberger R., Henkel C., Ocaña Flaquer B., Amo-Baladrón M. A., 2011, A&A, 535, A84
- Armijos-Abendaño et al. (2020) Armijos-Abendaño J., Banda-Barragán W. E., Martín-Pintado J., Dénes H., Federrath C., Requena-Torres M. A., 2020, MNRAS, 499, 4918
- Barnes et al. (2017) Barnes A. T., Longmore S. N., Battersby C., Bally J., Kruijssen J. M. D., Henshaw J. D., Walker D. L., 2017, MNRAS, 469, 2263
- Belloche et al. (2013) Belloche A., Müller H. S. P., Menten K. M., Schilke P., Comito C., 2013, A&A, 559, A47
- Belloche et al. (2019) Belloche A., Garrod R. T., Müller H. S. P., Menten K. M., Medvedev I., Thomas J., Kisiel Z., 2019, A&A, 628, A10
- Belloche et al. (2020) Belloche A., et al., 2020, A&A, 635, A198
- Bise et al. (1999) Bise R. T., Choi H., Neumark D. M., 1999, The Journal of chemical physics, 111, 4923
- Bise et al. (2001) Bise R. T., Hoops A. A., Neumark D. M., 2001, The Journal of Chemical Physics, 114, 9000
- Blitz et al. (2009) Blitz M. A., Seakins P. W., Smith I. W. M., 2009, Physical Chemistry Chemical Physics (Incorporating Faraday Transactions), 11, 10824
- Bonfand et al. (2017) Bonfand M., Belloche A., Menten K. M., Garrod R. T., Müller H. S. P., 2017, A&A, 604, A60
- Bonfand et al. (2019) Bonfand M., Belloche A., Garrod R. T., Menten K. M., Willis E., Stéphan G., Müller H. S. P., 2019, A&A, 628, A27
- Brack (1999) Brack A., 1999, Advances in Space Research, 24, 417
- Chakrabarti & Chakrabarti (2000) Chakrabarti S., Chakrabarti S. K., 2000, A&A, 354, L6
- Chakrabarti et al. (2015) Chakrabarti S. K., Majumdar L., Das A., Chakrabarti S., 2015, Ap&SS, 357, 90
- Coutens et al. (2018) Coutens A., et al., 2018, A&A, 612, A107
- Cummins et al. (1986) Cummins S. E., Linke R. A., Thaddeus P., 1986, ApJS, 60, 819
- De Becker (2013) De Becker M., 2013, Bulletin de la Societe Royale des Sciences de Liege, 82, 33
- Dunning (1989) Dunning Thom H. J., 1989, J. Chem. Phys., 90, 1007
- Duvernay et al. (2004) Duvernay F., Chiavassa T., Borget F., Aycard J.-P., 2004, Journal of the American Chemical Society, 126, 7772
- Duvernay et al. (2005) Duvernay F., Chiavassa T., Borget F., Aycard J.-P., 2005, The Journal of Physical Chemistry A, 109, 603
- Ellingsen et al. (2017) Ellingsen S. P., Chen X., Breen S. L., Qiao H. H., 2017, MNRAS, 472, 604
- Enrique-Romero et al. (2019) Enrique-Romero J., Rimola A., Ceccarelli C., Ugliengo P., Balucani N., Skouteris D., 2019, ACS Earth and Space Chemistry, 3, 2158
- Espinosa-Garcia et al. (1993) Espinosa-Garcia J., Corchado J., Sana M., 1993, Journal de Chimie Physique, 90, 1181
- Flower & Pineau des Forêts (2015) Flower D. R., Pineau des Forêts G., 2015, A&A, 578, A63
- Frisch et al. (2016) Frisch M. J., et al., 2016, Gaussian 16, Revision A.03. Gaussian, Inc., Wallingford, CT, USA
- Fukui (1981) Fukui K., 1981, Accounts of chemical research, 14, 363
- Garrod & Herbst (2006) Garrod R. T., Herbst E., 2006, A&A, 457, 927
- Garrod et al. (2007) Garrod R. T., Wakelam V., Herbst E., 2007, A&A, 467, 1103
- Garrod et al. (2008) Garrod R. T., Widicus Weaver S. L., Herbst E., 2008, ApJ, 682, 283
- Goerigk & Grimme (2011) Goerigk L., Grimme S., 2011, Journal of chemical theory and computation, 7, 291
- Graedel et al. (1982) Graedel T. E., Langer W. D., Frerking M. A., 1982, ApJS, 48, 321
- Grimme (2006) Grimme S., 2006, J. Chem. Phys., 124, 034108
- Grimme et al. (2011) Grimme S., Ehrlich S., Goerigk L., 2011, Journal of computational chemistry, 32, 1456
- Harada et al. (2010) Harada N., Herbst E., Wakelam V., 2010, ApJ, 721, 1570
- Hasegawa et al. (1992) Hasegawa T. I., Herbst E., Leung C. M., 1992, ApJS, 82, 167
- He et al. (1991) He Y., Liu X., Lin M. C., Melius C. F., 1991, International Journal of Chemical Kinetics, 23, 1129
- Jabs et al. (1999) Jabs W., Winnewisser M., Belov S. P., Lewen F., Maiwald F., Winnewisser G., 1999, Molecular Physics, 97, 213
- Jørgensen et al. (2016) Jørgensen J. K., et al., 2016, A&A, 595, A117
- Kawaguchi et al. (1992) Kawaguchi K., et al., 1992, ApJ, 396, L49
- Kilpatrick (1947) Kilpatrick M. L., 1947, Journal of the American Chemical Society, 69, 40
- Ligterink et al. (2020) Ligterink N. F. W., El-Abd S. J., Brogan C. L., Hunter T. R., Remijan A. J., Garrod R. T., McGuire B. M., 2020, ApJ, 901, 37
- Lopez-Sepulcre et al. (2019) Lopez-Sepulcre A., Balucani N., Ceccarelli C., Codella C., Dulieu F., Theule P., 2019, ACS Earth and Space Chemistry, 3, 2122
- Marcelino et al. (2018) Marcelino N., et al., 2018, A&A, 620, A80
- Martín et al. (2006) Martín S., Mauersberger R., Martín-Pintado J., Henkel C., García-Burillo S., 2006, ApJS, 164, 450
- McGuire et al. (2012) McGuire B. A., et al., 2012, ApJ, 758, L33
- Merz et al. (2014) Merz Kenneth M. J., Aguiar E. C., da Silva J. B. P., 2014, Journal of Physical Chemistry A, 118, 3637
- Nummelin et al. (2000) Nummelin A., Bergman P., Hjalmarson Å., Friberg P., Irvine W. M., Millar T. J., Ohishi M., Saito S., 2000, ApJS, 128, 213
- Öberg et al. (2007) Öberg K. I., Fuchs G. W., Awad Z., Fraser H. J., Schlemmer S., van Dishoeck E. F., Linnartz H., 2007, ApJ, 662, L23
- Palau et al. (2017) Palau A., et al., 2017, MNRAS, 467, 2723
- Papajak et al. (2009) Papajak E., Leverentz H. R., Zheng J., Truhlar D. G., 2009, Journal of chemical theory and computation, 5, 1197
- Purvis III & Bartlett (1982) Purvis III G. D., Bartlett R. J., 1982, The Journal of Chemical Physics, 76, 1910
- Puzzarini et al. (2020) Puzzarini C., Salta Z., Tasinato N., Lupi J., Cavallotti C., Barone V., 2020, MNRAS, 496, 4298
- Quan & Herbst (2007) Quan D., Herbst E., 2007, A&A, 474, 521
- Quan et al. (2010) Quan D., Herbst E., Osamura Y., Roueff E., 2010, ApJ, 725, 2101
- Quan et al. (2016) Quan D., Herbst E., Corby J. F., Durr A., Hassel G., 2016, ApJ, 824, 129
- Rathborne et al. (2015) Rathborne J. M., et al., 2015, ApJ, 802, 125
- Rivilla et al. (2021) Rivilla V. M., et al., 2021, MNRAS, 506, L79
- Rodríguez-Fernández et al. (2004) Rodríguez-Fernández N. J., Martín-Pintado J., Fuente A., Wilson T. L., 2004, A&A, 427, 217
- Ruaud et al. (2016) Ruaud M., Wakelam V., Hersant F., 2016, MNRAS, 459, 3756
- Scuseria & Schaefer III (1989) Scuseria G. E., Schaefer III H. F., 1989, The Journal of Chemical Physics, 90, 3700
- Scuseria et al. (1988) Scuseria G. E., Janssen C. L., Schaefer Iii H. F., 1988, The Journal of Chemical Physics, 89, 7382
- Skouteris et al. (2017) Skouteris D., Vazart F., Ceccarelli C., Balucani N., Puzzarini C., Barone V., 2017, MNRAS, 468, L1
- Sleiman et al. (2018a) Sleiman C., El Dib G., Talbi D., Canosa A., 2018a, ACS Earth and Space Chemistry, 2, 1047
- Sleiman et al. (2018b) Sleiman C., El Dib G., Rosi M., Skouteris D., Balucani N., Canosa A., 2018b, Physical Chemistry Chemical Physics, 20, 5478
- Smith et al. (2001) Smith I. W. M., Talbi D., Herbst E., 2001, A&A, 369, 611
- Smith et al. (2004) Smith I. W. M., Herbst E., Chang Q., 2004, MNRAS, 350, 323
- Steinman et al. (1964) Steinman G., Lemmon R. M., Calvin M., 1964, Proceedings of the National Academy of Sciences of the United States of America, 52, 27
- Talbi & Smith (2009) Talbi D., Smith I. W. M., 2009, Physical Chemistry Chemical Physics (Incorporating Faraday Transactions), 11, 8477
- Tordini et al. (2003) Tordini F., Bencini A., Bruschi M., De Gioia L., Zampella G., Fantucci P., 2003, The Journal of Physical Chemistry A, 107, 1188
- Turner et al. (1975) Turner B. E., Liszt H. S., Kaifu N., Kisliakov A. G., 1975, ApJ, 201, L149
- White et al. (2003) White G. J., Araki M., Greaves J. S., Ohishi M., Higginbottom N. S., 2003, A&A, 407, 589
- Williams & Ibrahim (1981) Williams A., Ibrahim I. T., 1981, Chemical Reviews, 81, 589
- Woon & Herbst (2009) Woon D. E., Herbst E., 2009, Astrophysical Journal Supplement Series, 185, 273
- Yadav et al. (2019) Yadav M., Misra A., Tandon P., et al., 2019, Origins of Life and Evolution of Biospheres, 49, 89
- Zeng et al. (2018) Zeng S., et al., 2018, MNRAS, 478, 2962
- Zeng et al. (2019) Zeng S., Quénard D., Jiménez-Serra I., Martín-Pintado J., Rivilla V. M., Testi L., Martín-Doménech R., 2019, MNRAS, 484, L43
- Zeng et al. (2020) Zeng S., et al., 2020, MNRAS, 497, 4896
- Zhang et al. (2020) Zhang X., Quan D., Chang Q., Herbst E., Esimbek J., Webb M., 2020, MNRAS, 497, 609