Thermal conductivity suppression in uranium-doped thorium dioxide due to phonon resonant scattering
Abstract
In this work, the thermal transport properties of thorium dioxide (ThO2, thoria) with low levels of substitutional uranium (U) doping are explored. We observe strong indications of resonant phonon scattering, an interaction between phonons and electronic degrees of freedom, induced by this doping in addition to common “impurity” scattering due to mass and interatomic force constant differences. Uranium doping levels of 6%, 9%, and 16% were studied in a single hydrothermally synthesized U-doped thoria crystal with spatially-varying U doping levels. Within this crystal, isoconcentration regions with relatively uniform doping were located for local thermal conductivity measurements using a thermoreflectance technique. The measured thermal conductivity profiles in the temperature range of 77–300 K are compared to predictions of an analytical Klemens-Callaway thermal conductivity model to identify impacts from different phonon scattering mechanisms. Highly suppressed thermal conductivity at cryogenic temperatures at these doping levels suggests that phonon resonant scattering plays an important role in thermal conductivity reduction in U-doped thoria.
I Introduction
Dopants play a key role in thermal transport in fluorite oxides across a range of energy applications including solid oxide fuel cells Mogensen and Tompsett. (2000), thermal barrier coatings Pan et al. (2012), laser host materials, thermoelectrics Zhao et al. (2016), and nuclear fuels Hurley et al. (2022). In oxide materials, thermal energy is primarily conducted by lattice vibrations, namely, phonons Berman (1976). Dopants acting as point defects (substitutional impurities or interstitials) scatter phonons, suppressing thermal conductivity Walker and Pohl (1963). Traditionally, such point-defect-induced thermal conductivity suppression in the actinide fluorite oxides has been described using a Rayleigh scattering formulation Gibby (1971); Ohmichi et al. (1981); Klemens (1955); Abeles (1963). However, for certain point defects, Rayleigh’s formulation fails to explain low-temperature thermal transport behavior due to phonon interaction with localized vibrational modes Slack (1961); Pohl (1962); Slack and Galginaitis (1964); Kundu et al. (2019). In the case of paramagnetic impurities, the interaction between the point defect impurity and the surrounding host lattice, through modulation of the crystalline electric field, induces a spin transition by perturbing the orbital motion of paramagnetic electrons. The spin transition energy is imparted to the host lattice leading to a localized (resonant) mode that gives rise to phonon resonant scattering or phonon-spin scattering Maradudin (1967); Mattuck and Strandberg. (1960). Phonon resonant scattering has a characteristic effect on low temperature thermal conductivity, tending to introduce a dip in thermal conductivity where one typically expects maximum thermal conductivity with Rayleigh-type scattering only. In some cases, the thermal conductivity reduction induced by phonon resonant scattering can be orders of magnitude higher than that induced by Rayleigh-type scattering Bagheri et al. (2020).
Thoria (ThO2) has been considered a promising candidate material for advanced nuclear fuel cycles due to its high melting point, reasonable thermal conductivity, and relatively low radioactive waste footprint Herring and Kullberg. (2001). Recently, a number of works have focused on better understanding the thermal and mechanical properties of thoria and the possible changes of these properties induced by defects generated in extreme nuclear reactor environments. The use of high-quality single crystal thoria has been the critical foundation of these works, as desired microstructure features can thus be introduced in isolation Hurley et al. (2022). Specifically, thermal conductivity, and corresponding changes induced by point defects and dislocation loops, have been investigated by Dennett, Deskins, Jin, and coworkers Dennett et al. (2020); Deskins et al. (2021); Dennett et al. (2021); Jin et al. (2022); Deskins et al. (2022), by combining the efforts of advanced experimental tools (laser-based thermoreflectance and transmission electron microscopy) and state-of-the-art modeling approaches (linearized Boltzmann transport equation solutions with inputs from first principles calculations, defect evolution models, and advanced electron microscopy characterization).
In this work, we further explore how resonant phonon scattering impacts the thermal conductivity of thoria by doping single crystal thoria with uranium (U). Here, local thermal conductivity () in a temperature range () of 77–300 K was measured on a U-doped thoria sample. By using a hydrothermal synthesis technique, varied U doping was introduced in isolated spatial regions from a single crystal thoria seed. Three isoconcentration regions with uniform U-doping percentages (6%, 9%, and 16%) were identified using Raman spectroscopy and X-ray fluorescence (XRF), and then fiducially marked using a focused-ion-beam (FIB) for thermoreflectance measurements. The extracted – curve is compared with that calculated from a Klemens-Callaway thermal transport model to isolate the impacts of Rayleigh-type phonon-point defect scattering and phonon resonant scattering on thermal conductivity. We find that phonon resonant scattering contributes more than Rayleigh-type scattering to the thermal conductivity reduction in this temperature range, and the correlated intensity is not linear with the doping level. This work shows the profound effect that introducing atoms with 5 electrons has on the thermal transport behavior of fluorite oxides.
II Materials and Methods
II.1 Crystal Preparation
Crystal synthesis followed the previously published procedure for hydrothermal synthesis of (U,Th)O2, with a feedstock composed of 0.2 g of UO2 (IBI Labs, 99.99) and 2.1 g of ThO2 (IBI Labs 99.99) Rickert et al. (2022). The bottom 127 mm of the silver growth ampoule was heated to 650°C over 4.5 hrs. The top 139.7 mm was heated to 525∘C over 4.5 hrs, paused at 525∘C for 18 hrs, and then heated to 600∘C over 2 hrs. These temperatures were held for 45 days at a pressure of 23.5 kpsi before being cooled to 10∘C over 24 hrs. The product was bisected with a water-cooled diamond wire saw (STX-202P, MTI Corporation) to obtain halves with the largest surface area. The cut face was polished on a rotary disc polisher with diamond laps, ending with a 0.1 µm grit size.
II.2 Isoconcentration Region Analysis
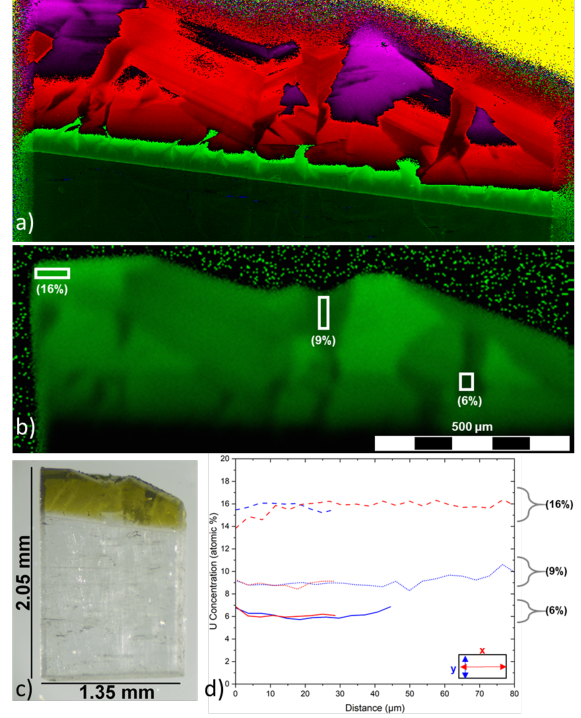
µ-Raman spectroscopy and XRF were used to identify different isoconcentration regions for thermal transport analysis and to measure the as-grown uranium concentrations, respectively. The Raman and XRF maps, an optical image of the as-polished crystal, and XRF line scans of the isoconcentration region are shown in fig. 1. A summary of the Raman and XRF analyses are provided here and further details can be found in the Supplementary Materials.
µ-Raman measurements were carried out using a Renishaw Invia Reflex Raman microscope with a 633 nm excitation source equipped with 1200 l/mm dispersion grating and a standard Renishaw Si CCD Rickert et al. (2019). A Si calibration was performed prior to the measurements. The laser was focused through a 50 long-working-distance objective with a numerical aperture (NA) of 0.5. A µ-Raman map of the polished side of the growth region was performed with a single 0.5 sec exposure for each point and points were collected in 2 µm by 2 µm intervals. The laser focus was manually adjusted every 50 µm and the intervening focal points were extrapolated. Renishaw Raman spectroscopy software WiRE was used to calculate and plot the signal to baseline intensity and full peak width at half of the maximum intensity (FWHM) for the peak.
XRF data were collected using two large-area silicon drift detectors set to a 40 keV range on a Bruker M4 TORNADO, with an Rh source set at 50 kV and 300 µA, and a spot size of 14.7 µm (independently measured on this specific instrument). An XRF map of the polished side of the growth region was taken and spots were analyzed every 4 µm (in both x and y directions). The dwell time was 50 ms/pixel, with each pixel being 4 µm in diameter, and 15 cycles were performed and averaged together. A Zr calibration was performed prior to measurements being taken. Visual inspection of the overall XRF spectrum of each map was used to initially determine which elements may be present. In all cases, peaks that did not match U or Th did not reasonably match any other elements, thus only U and Th were included in the quantification step.
II.3 Thermal Transport Measurements
Local thermal transport was measured using a spatial-domain thermoreflectance (SDTR) technique Hua et al. (2012); Hurley et al. (2015). In SDTR, a continuous-wave (CW) laser (Coherent OBIS 660 nm) with a periodically modulated intensity is used to locally heat the sample and induce a thermal wave. The propagation of the thermal wave is detected using a CW laser with constant intensity (Coherent Verdi 532 nm) through the thermoreflectance effect Hua et al. (2012). Thermal transport properties, such as thermal conductivity and thermal diffusivity, can be extracted using a thermal diffusion model and corresponding boundary conditions Hua et al. (2012); Maznev et al. (1995); Hurley et al. (2015). In order to improve the measurement spatial resolution, laser beams are focused using a 50 long-working-distance objective lens (Olympus SLMPlan 50). The spot size on the sample surface is 1 µm for each laser, with the power of 2 mW and 0.3 mW for the heating and probe lasers, respectively.
Thermal transport property measurements were conducted in the isoconcentration regions and in the seed ThO2 area over a 77–300 K temperature range with a step of 25 K and temperature fluctuation of less than 3 K Dennett et al. (2021). At each temperature, at least 6 sets of measurements at four modulation frequencies, 10, 20, 50, and 100 kHz, were performed to statistically reduce the uncertainty of measured thermal conductivity. A 63 nm film of gold was sputter-coated on the sample surface to improve the thermoreflectance effect and energy absorption at this heating laser wavelength Hatori et al. (2005). This film thickness was chosen based on a sensitivity analysis to ensure independent extraction of thermal conductivity () and thermal diffusivity () at room temperature. At room temperature, the SDTR thermal model can be validated by calculating the heat capacity () from measured and and comparing it to reference measurements made on crystals using the same growth process Dennett et al. (2020). At low temperature, was the sole parameter optimized from SDTR measurements to improve accuracy; was then calculated at each temperature as , where and density () for pure ThO2 was obtained from previously reported values Dennett et al. (2020). In U-doped regions, of pure ThO2 was used as the estimation of values for U-doped ThO2 as the heat capacity of pure fluorite UO2 varies little from that of ThO2 in this temperature range Hurley et al. (2022).
III Results and Discussion
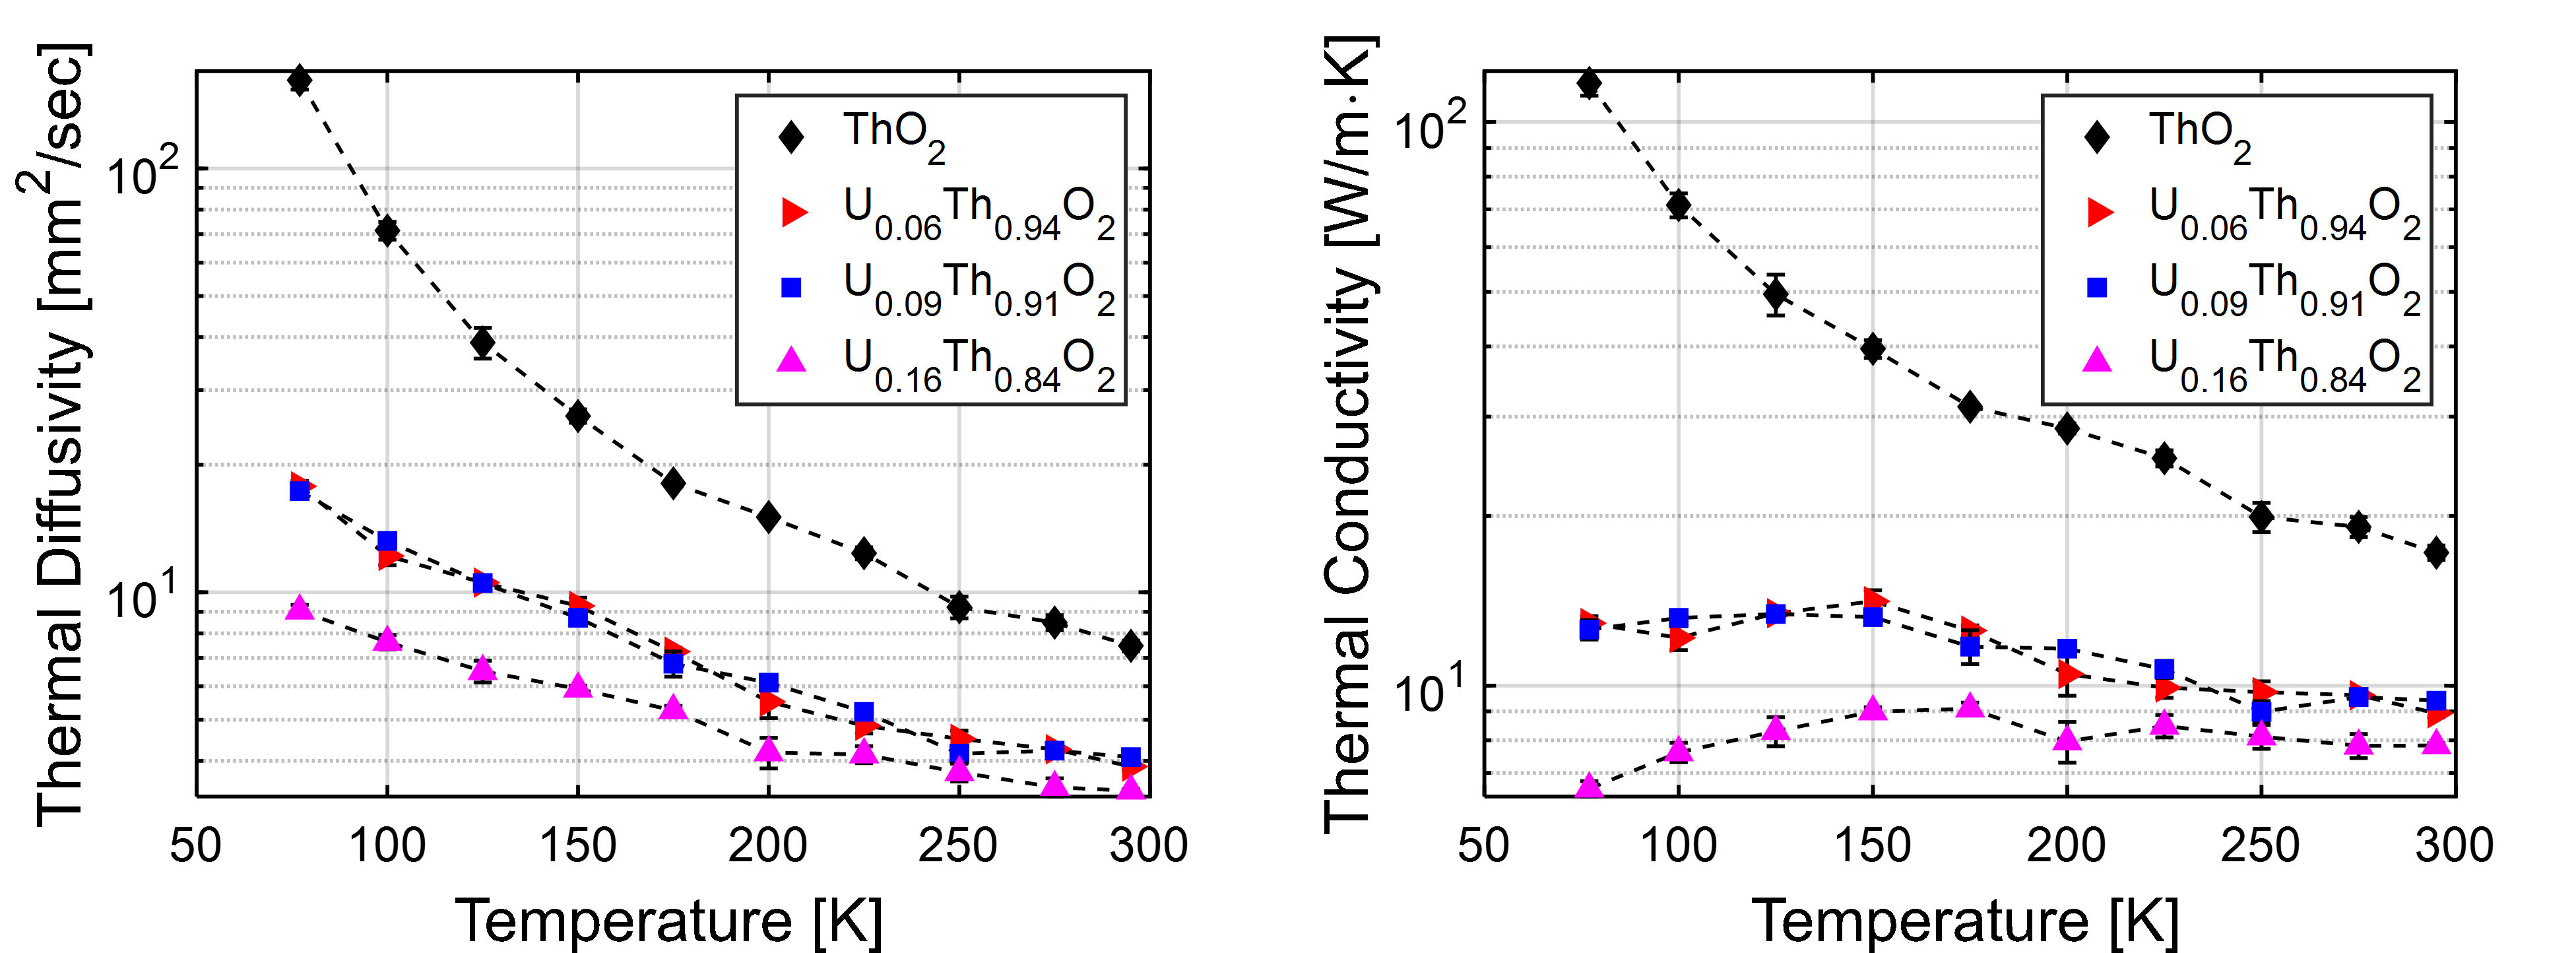
The measured thermal diffusivity () and calculated thermal conductivity () in the 6%, 9%, and 16% U doped ThO2 regions, and in the seed ThO2 region, of the heterogeneous crystal are plotted in fig. 2. The standard errors determined on the basis of multiple measurements at each concentration and temperature are 5% for the majority of concentrations and temperatures. In the seed ThO2 at 125 K, the uncertainty is slightly higher (10%) due to the high diffusivity at low temperatures and challenges associated with stabilizing this temperature using LN2 coolant. In the seed ThO2, at 77 K is measured as 117 W/mK, comparable to the highest reported value of for single crystal ThO2 at the same temperature Mann et al. (2010). This suggests low impurity levels in the seed crystal. After doping, there are significant reductions in both and over the entire temperature range. The relative change in increases as the temperature decreases. A slight hump is observable in the – curve between 125–175 K in all U-doped regions. This feature is not reflected in the ThO2 seed, nor is it expected based on previous measurements of hydrothermally-grown ThO2 single crystals Mann et al. (2010); Dennett et al. (2021); Xiao et al. (2022). The thermal conductivity of 9% U doped ThO2 does not differ noticeably from that at 6% U-doping: 12.6 W/mK for the 9% doped region versus 12.9 W/mK for the 6% doped region at 77 K. However, with additional doping to 16%, a significant thermal conductivity reduction was observed: 6.6 W/mK at 77 K, or 50% lower than the 9% doped region.
We analyze our results using a Klemens-Callaway model (KCM) to investigate the impact of individual phonon scattering mechanisms on thermal conductivity. Using Debye’s linear approximation for phonon dispersion, thermal conductivity of our U doped ThO2 system is calculated as
| (1) |
where is phonon frequency, is temperature, is the Debye frequency, and is the sound velocity Callaway (1959); Chauhan et al. (2021). The Debye sound velocity is expressed through the longitudinal () and transverse () components as . The sound velocity components and are obtained through elastic stiffness tensor elements and , as and . Values of the elastic stiffness tensor components for pure ThO2 are used as reported in Mathis et al. (2022) and the Debye sound velocity was calculated to be 3165 m/s. The Debye frequency is calculated as , where is the number of atoms in the fluorite unit cell, and is the volume of the unit cell, where Å is the lattice constant of pure ThO2 Khafizov et al. (2014). The specific heat, is expressed as:
| (2) |
where , is the Boltzmann constant, and is the reduced Planck’s constant. The scattering rate is a combination of multiple scattering processes that are summed using Matthiessen’s rule as
| (3) |
where each term in Eq. 3 represents an individual scattering process Walker and Pohl (1963); Chauhan et al. (2021); Ziman (2001). The first term corresponds to three-phonon scattering, where is the Debye temperature. The second term quantifies the contribution from impurities in the pristine sample, described here by Rayleigh-type scattering of phonons as has been successful in the past for ThO2 Dennett et al. (2021); Deskins et al. (2022). These two scattering processes exist in both seed thoria and U-doped thoria, and the corresponding linear parameters can be obtained by fitting the measured – profile of seed thoria to the KCM using only the first two terms. These optimized parameters, s3 and s/K, are then held constant in further model fitting of U-doped thoria.
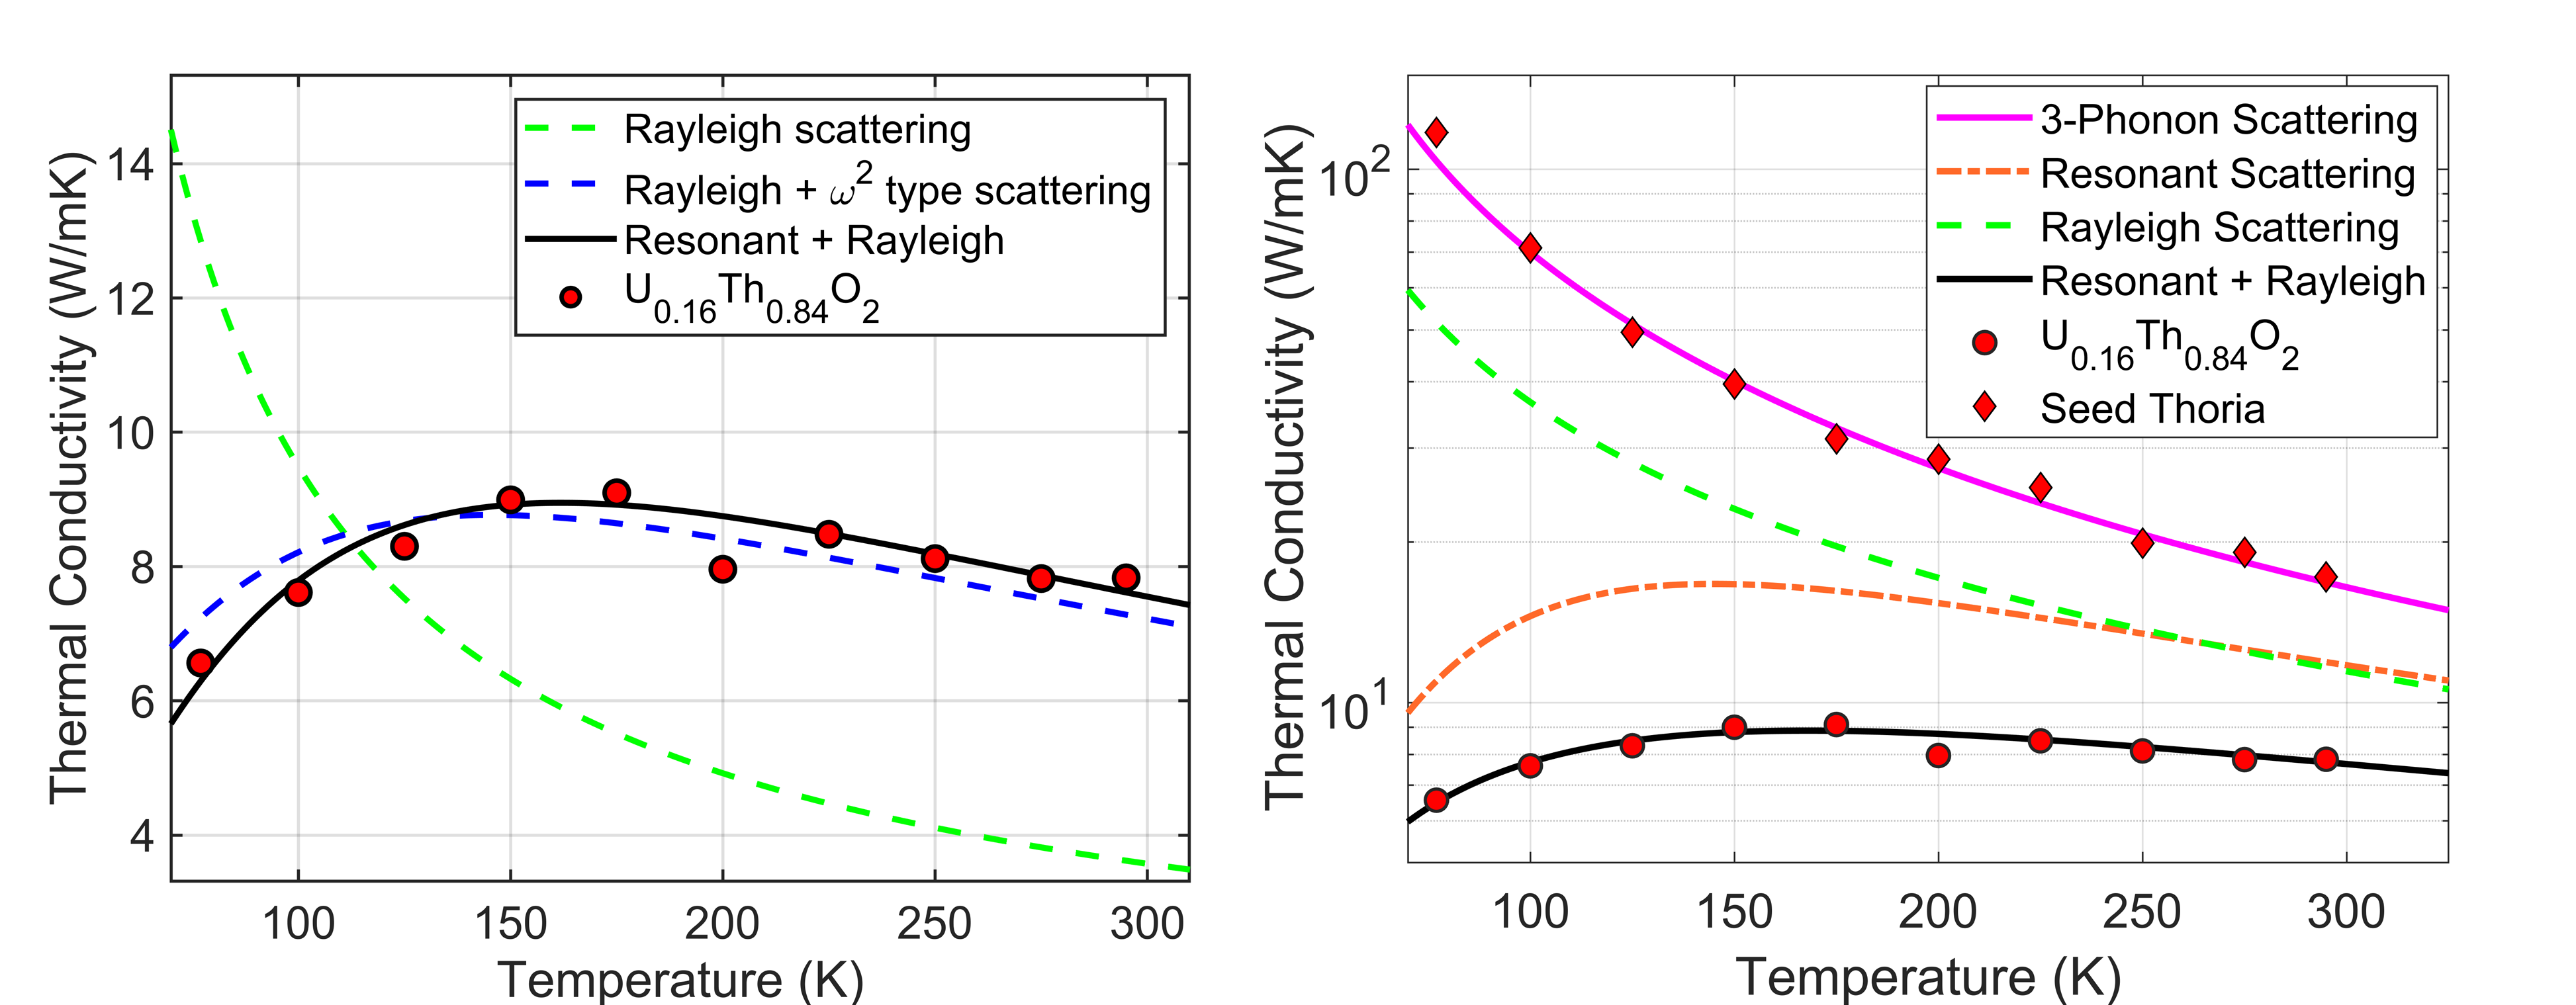
The scattering mechanisms attributed to U-doping are represented by the last two scattering terms. The third term in Eq. 3 describes phonon scattering by typical point defects using a general Rayleigh scattering expression with dependence Khafizov et al. (2019); Klemens (1955). Here, is the point defect scattering parameter, proportional to defect concentration Klemens (1955); Deskins et al. (2021). The dashed green line in fig. 3 (left) represents the best-fit KCM for 16% U-doped thoria with only the Rayleigh-type defect scattering term included in eq. 3. This functional form is qualitatively unable to capture the trend apparent in the experimental results, shown as red circles. The dashed blue line considers an alternate point defect scattering functional with an dependence as an empirical attempt to fit the data. As can be seen, such an empirical attempt is able to better capture the experimental trend, though some qualitative deviation is still present, particularly at low temperatures.
A number of alternative approaches to capture additional scattering mechanisms when insulators are doped have been applied with success in the past Maradudin (1966); Walker and Pohl (1963). We found best agreement with experiment when the additional scattering is represented by the last term in Eq. 3. This expression has been commonly used to capture phonon resonance scattering and accounts for the time-dependent oscillating harmonic perturbation due to impurities or electronic degrees of freedom that resonate with phonons. Here is the resonant frequency and is a temperature-dependent distribution function Verma (1972); Gofryk et al. (2014).
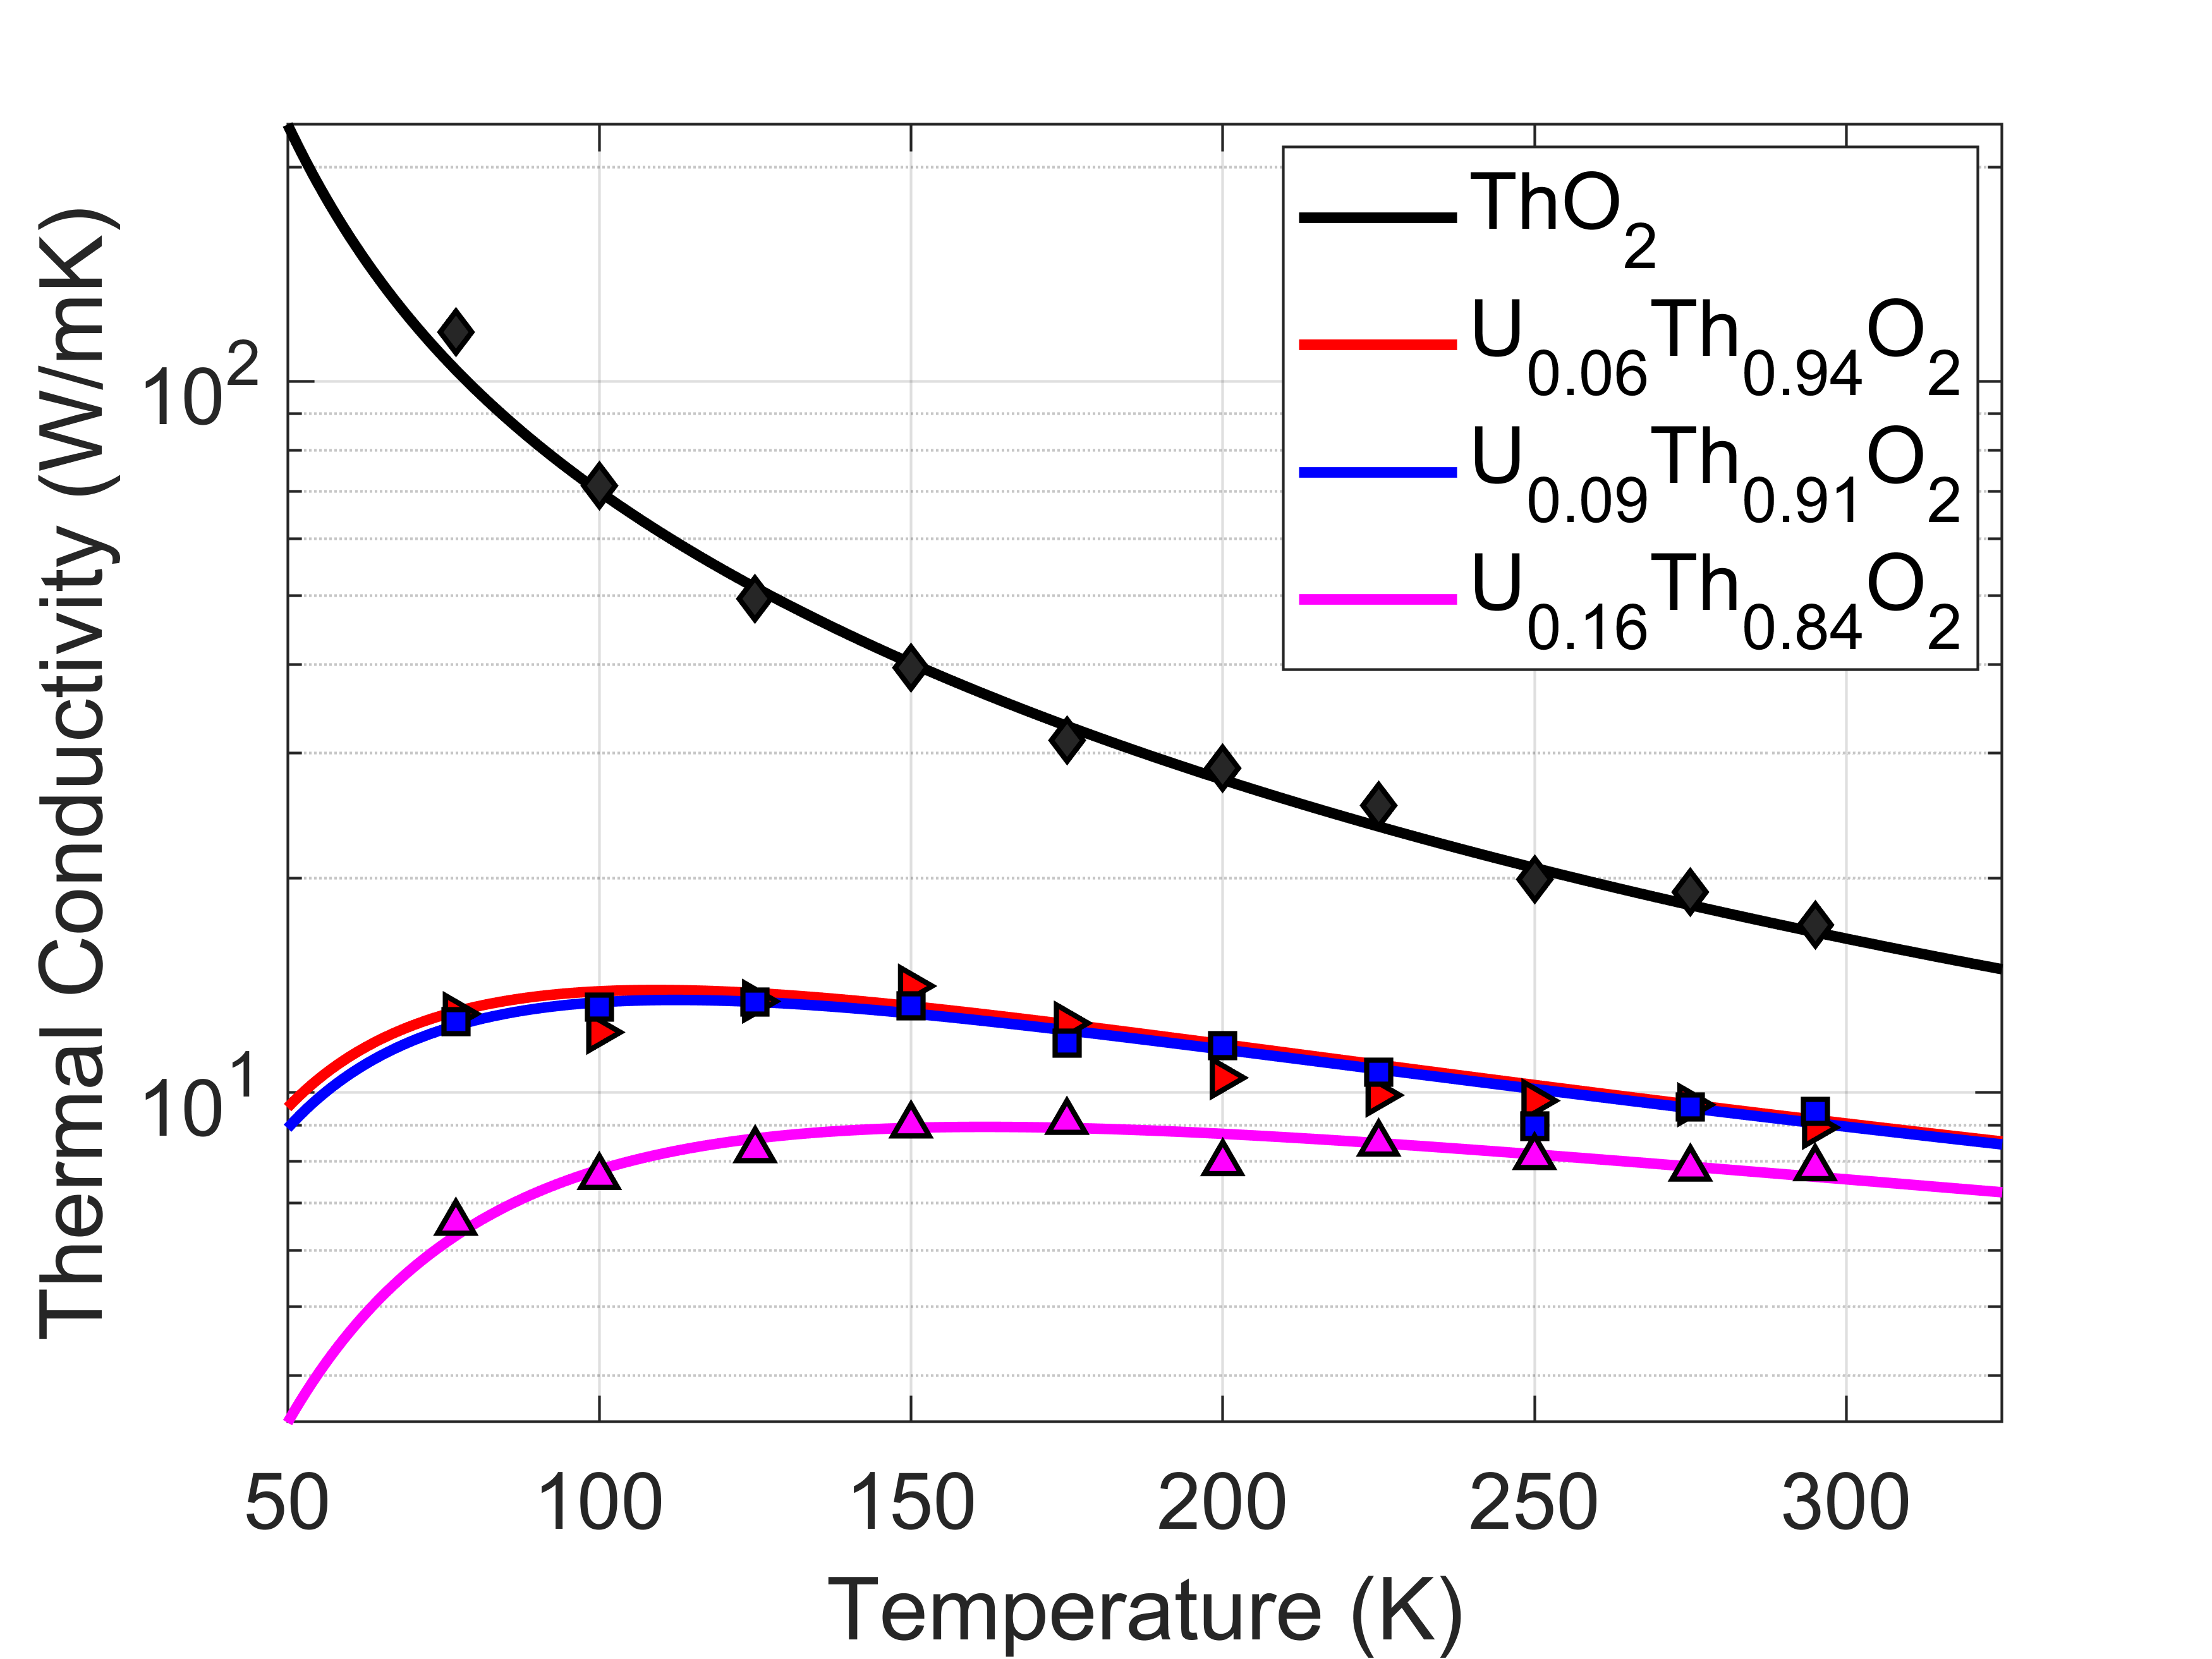
The solid black line in fig. 3 (right) shows the fully optimized KCM taking into account both Rayleigh-type and resonant point defect scattering for the 16% U-doped region, which clearly captures the temperature dependence of the thermal conductivity. Furthermore, comparing with Rayleigh-type scattering (dashed green line), resonant phonon scattering (dot-dashed red line) impacts thermal conductivity to the same magnitude in the temperature region above 250 K and more significantly below. In this optimization, and were used as local fitting parameters and as a global fitting parameter for all three doping levels simultaneously, while and are determined from the seed region and held constant. The best-fit KCM parameters for all samples are summarized in Table 1, with the optimized – profiles for all three U-doped thoria regions presented in Fig. 4. Clearly, not only does the optimized KCM provide a qualitative match to the experimental results, best-fit values for and also scale monotonically with the U doping level, as would be expected if additional scattering is uranium concentration driven. However, we find that , which captures the magnitude of resonant scattering effect scales non-linearly with uranium concentration, vary little between the 6% and 9% doping levels. Nevertheless, these features strongly suggest that resonant phonon scattering effects play a significant role in the UxTh1-xO2 system.
| ThO2 | U0.06Th0.94O2 | U0.09Th0.91O2 | U0.16Th0.84O2 | |
| B [s/K] | ||||
| Ai [s3] | ||||
| Cr [s-1] | ||||
| [THz] | ||||
While resonant phonon scattering related to the electronic structure of uranium has been previously studied, the measurements presented here provide the most direct evidence to date of the impact of this mechanism on phonon-mediated thermal transport. Doping uranium into the host thoria lattice introduces 5 electrons not found in the ground state of thorium, the multipoles of which have been previously reported to interact strongly with phonons Santini et al. (2009). The presence of resonant phonon scattering in pure UO2 has been confirmed by measuring the thermal conductivity of single crystal and polycrystalline UO2 down to the liquid helium temperature Moore and Mcelroy (1971); Gofryk et al. (2014). Comparing to the – profile measured on thoria with the same fluorite structure, these studies concluded that phonon scattering from the 5 electronic degrees of freedom is responsible for the significantly lower thermal conductivity in UO2.
We can compare the extracted parameters of the phonon transport model in this study to the ones presented by Gofryk and coworkers on pure UO2 for insight into the resonant scattering process Gofryk et al. (2014). In contrast to the model used here, Gofryk’s work considered a two energy-level system to describe the spins of uranium ions, therefore with multiple resonances. The phonon resonant energy, converted from the resonant frequency , is comparable: 2.5 meV here versus 3.5 meV for one of the UO2 resonances reported previously. The resonant scattering intensity , named the phonon-spin coupling constant in Gofryk’s work, is also at the same order of magnitude: up to s-1 for both resonances combined, doubling the value measured on the 16% U-doped thoria ( s-1). The smaller-than-expected difference between the lightly-U-doped and pure UO2 cases suggests that this resonant scattering process has a nonlinear dependence on doping level for high levels of U doping. Otherwise, the ratio observed here would suggest a saturation in reduction with 30-35% U-doping. We caution that only qualitative comparisons should be made between the bulk single crystal thermal conductivity measured in this work and the micro-crystal measurements made by Gofryk and coworkers. In the latter case, boundary scatting effects known to significantly impact low temperature thermal conductivity must be explicitly accounted for Gofryk et al. (2014) and radiative losses may also impact the as-measured values. In the case of the the millimeter-scale single crystals measured here, using thermal waves localized to linear distances in the tens of microns, boundary scattering should play no significant role Dennett et al. (2021).
The nonlinear dependence of resonant scattering on doping level can be extended to the low U doping region. With low U doping, differences between thermal transport in our 6% and 9% U-doped thoria are found negligible, but the difference between 6% U-doped thoria and pure thoria is significant, indicating an extreme sensitivity to the presence of any U-doping-induced resonant scattering. To further explore the effects of very low concentrations of 5 electrons, future studies should expand to samples with lower U doping levels. In related studies of other material systems, phonon resonant scattering has been observed at much lower impurity concentrations than studied here (e.g., 11019 cm-3 in Mn-doped GaN Bagheri et al. (2020), and Ni- and Cr-doped ZnSe Lonchakov et al. (2004), equivalently 0.1-0.5%). These values provide a reasonable reference for targeted doping percentage ranges for future investigation.
IV Conclusion
In this work, the thermal conductivity of 6%, 9%, and 16% U-doped thoria was experimentally measured in the temperature range 77–300 K. Measurements of a heterogeneous single crystal of U-doped ThO2 were enabled by the isolation of micron-scale isoconcentration regions and local thermal conductivity measurements using SDTR. The measured thermal conductivity was compared to calculations from a Klemens-Callaway conductivity model to investigate the phonon scattering mechanisms in detail. Phonon resonant scattering induced by U doping is strongly suggested and its effects are found to be more impactful on thermal conductivity than Rayleigh-type point defect scattering. Comparing the fitted parameters of our model to those reported in a similar material system with different doping percentages and in pure UO2, we hypothesize that the relationship between the resonant scattering intensity and the doping percentage is not linear, and it is likely that significant thermal conductivity reduction would appear with very low uranium doping percentages.
Acknowledgements.
This work was supported by the Center for Thermal Energy Transport under Irradiation (TETI), an Energy Frontier Research Center funded by the US Department of Energy, Office of Science, Office of Basic Energy Sciences. The isoconcentration region analysis work was supported by the Air Force Research Laboratory under award FA807518D0015.Data Availability Statement
The data that support the findings of this study are available from the corresponding author upon reasonable request.
References
- Mogensen and Tompsett. (2000) Nigel M. Sammes Mogensen, Mogens and Geoff A. Tompsett., “Physical, chemical and electrochemical properties of pure and doped ceria.” Solid State Ionics 129, 63–94 (2000).
- Pan et al. (2012) W. Pan, S. R. Phillpot, C. Wan, A. Chernatynskiy, and Z. Qu, “Low thermal conductivity oxides,” MRS Bulletin 37, 917––922 (2012).
- Zhao et al. (2016) L.-D. Zhao, G. Tan, S. Hao, J. He, Y. Pei, H. Chi, H. Wang, S. Gong, H. Xu, V. P. Dravid, C. Uher, G. J. Snyder, C. Wolverton, and M. G. Kanatzidis, “Ultrahigh power factor and thermoelectric performance in hole-doped single-crystal SnSe,” Science 351, 141–144 (2016).
- Hurley et al. (2022) D. H. Hurley, A. El-Azab, M. S. Bryan, M. W. D. Cooper, C. A. Dennett, K. Gofryk, L. He, M. Khafizov, G. H. Lander, M. E. Manley, J. M. Mann, C. A. Marianetti, K. Rickert, F. A. Selim, M. R. Tonks, and J. P. Wharry, “Thermal energy transport in oxide nuclear fuel,” Chem. Rev. 122, 3711–3762 (2022).
- Berman (1976) R. Berman, Heat conduction in solids (Oxford university press, 1976).
- Walker and Pohl (1963) C. T. Walker and R. O. Pohl, “Phonon scattering by point defects,” Phy. Rev. 131, 1433 (1963).
- Gibby (1971) R.L. Gibby, “The effect of plutonium content on the thermal conductivity of (U,Pu)O2 solid solutions,” J. Nucl. Mater. 38, 163–177 (1971).
- Ohmichi et al. (1981) T. Ohmichi, S. Fukushima, A. Maeda, and H. Watanabe, “On the relation between lattice parameter and O/M ratio for uranium dioxide-trivalent rare earth oxide solid solution,” J. Nucl. Mater. 102, 40–46 (1981).
- Klemens (1955) P. G. Klemens, “The scattering of low-frequency lattice waves by static imperfections,” Proc. Phys. Soc. A 68, 1113 (1955).
- Abeles (1963) B. Abeles, “Lattice thermal conductivity of disordered semiconductor alloys at high temperatures,” Phys. Rev. 131, 1906–1911 (1963).
- Slack (1961) G. A. Slack, “Thermal conductivity of CaF2, MnF2, CoF2, and ZnF2 crystals,” Phys. Rev. 122, 1451 (1961).
- Pohl (1962) R. O. Pohl, “Thermal conductivity and phonon resonance scattering,” Phys. Rev. Lett. 8, 481 (1962).
- Slack and Galginaitis (1964) G. A. Slack and S. Galginaitis, “Thermal conductivity and phonon scattering by magnetic impurities in CdTe,” Phys. Rev. 133, A253 (1964).
- Kundu et al. (2019) A. Kundu, F. Otte, J. Carrete, P. Erhart, W. Li, N. Mingo, and G. K. H. Madsen, “Effect of local chemistry and structure on thermal transport in doped gaas,” Phys. Rev. Mater. 3, 094602 (2019).
- Maradudin (1967) A. A. Maradudin, “Theoretical and experimental aspects of the effects of point defects and disorder on the vibrations of crystals—2,” in Solid State Phys., Vol. 19 (Academic Press, 1967) pp. 1–134.
- Mattuck and Strandberg. (1960) R.D. Mattuck and M. W. P. Strandberg., “Spin-phonon interaction in paramagnetic crystals.” Phys. Rev. 119, 1204 (1960).
- Bagheri et al. (2020) P. Bagheri, P. Reddy, J. H. Kim, R. Rounds, T. Sochacki, R. Kirste, M. Bockowski, R. Collazo, and Z. Sitar, “Impact of impurity-based phonon resonant scattering on thermal conductivity of single crystalline GaN,” Appl. Phys. Lett. 117, 082101 (2020).
- Herring and Kullberg. (2001) Philip E. MacDonald Kevan D. Weaver Herring, J. Stephen and Craig Kullberg., “Low cost, proliferation resistant, uranium–thorium dioxide fuels for light water reactors.” Nuclear engineering and design 203, 65–85 (2001).
- Dennett et al. (2020) C. A. Dennett, Z. Hua, A. Khanolkar, T. Yao, P. K. Morgan, T. A. Prusnick, N. Poudel, A. French, K. Gofryk, L. He, L. Shao, M. Khafizov, D. B. Turner, J. M. Mann, and D. H. Hurley, “The influence of lattice defects, recombination, and clustering on thermal transport in single crystal thorium dioxide,” APL Mater. 8, 111103 (2020).
- Deskins et al. (2021) W. R. Deskins, A. Hamed, T. Kumagai, C. A. Dennett, J. Peng, M. Khafizov, D. H. Hurley, and A. El-Azab, “Thermal conductivity of ThO2: Effect of point defect disorder,” J. Appl. Phys. 129, 075102 (2021).
- Dennett et al. (2021) C. A. Dennett, W. R. Deskins, M. Khafizov, Z. Hua, A. Khanolkar, K. Bawane, L. Fu, J. M. Mann, C. Marianetti, L. He, D. H. Hurley, and A. El-Azab, “An integrated experimental and computational investigation of defect and microstructural effects on thermal transport in thorium dioxide,” Acta Mater. 213, 116934 (2021).
- Jin et al. (2022) M. Jin, C. A. Dennett, D. H. Hurley, and M. Khafizov, “Impact of small defects and dislocation loops on phonon scattering and thermal transport in ThO2,” J. Nucl. Mater. 566, 153758 (2022).
- Deskins et al. (2022) W. R. Deskins, A. Khanolkar, S. Mazumder, C. A. Dennett, K. Bawane, Z. Hua, J. Ferrigno, L. He, J. M. Mann, M. Khafizov, D. H. Hurley, and A. El-Azab, “A combined theoretical-experimental investigation of thermal transport in low-dose irradiated thorium dioxide,” Acta Mater. 241, 118379 (2022).
- Rickert et al. (2022) K. Rickert, D. B. Turner, T. A. Prusnick, M. A. Velez, S. Vangala, and J. M. Mann, “The impact of feedstock size and composition on the hydrothermal growth of (U,Th)O2,” J. Crys. Growth 593, 126732 (2022).
- Rickert et al. (2019) K. Rickert, T. A. Prusnick, E. Hunt, M. M. Kimani, S. Chastang, D. L. Brooks, E. A. Moore, J. C. Petrosky, and J. M. Mann, “Inhibiting laser oxidation of UO2 via Th substitution,” J. Nucl. Mater. 517, 254–262 (2019).
- Hua et al. (2012) Z. Hua, H. Ban, M. Khafizov, R. Schley, R. Kennedy, and D. H. Hurley, “Spatially localized measurement of thermal conductivity using a hybrid photothermal technique,” J. Appl. Phys. 111, 103505 (2012).
- Hurley et al. (2015) D. H. Hurley, R. S. Schley, M. Khafizov, and B. L. Wendt, “Local measurement of thermal conductivity and diffusivity,” Rev. Sci. Instrum. 86, 123901 (2015).
- Maznev et al. (1995) A. A. Maznev, J. Hartmann, and M. Reichling, “Thermal wave propagation in thin films on substrates,” J. Appl. Phys. 78, 5266–5269 (1995).
- Hatori et al. (2005) K. Hatori, N. Taketoshi, and T. Baba, “Thermoreflectance technique to measure thermal effusivity distribution with high spatial resolution,” Rev. Sci. Instrum. 76, 114901 (2005).
- Mann et al. (2010) J. M. Mann, D. Thompson, K. Serivalsatit, T. M. Tritt, J. Ballato, and J. Kolis, “Hydrothermal growth and thermal property characterization of ThO2 single crystals,” Crystal Growth and Design 10, 2146 (2010).
- Xiao et al. (2022) E. Xiao, H. Ma, M. S. Bryan, L. Fu, J. M. Mann, B. Winn, D. L. Abernathy, R. P. Hermann, A. R. Khanolkar, C. A. Dennett, D. H. Hurley, M. E. Manley, and C. A. Marianetti, “Validating first-principles phonon lifetimes via inelastic neutron scattering,” (2022), arxiv.org/abs/2202.11041.
- Callaway (1959) J. Callaway, “Model for lattice thermal conductivity at low temperatures,” Phys. Rev. 113, 1046 (1959).
- Chauhan et al. (2021) V. S. Chauhan, J. Pakarinen, T. Yao, L. He, D. H. Hurley, and M. Khafizov, “Indirect characterization of point defects in proton irradiated ceria,” Materialia 15, 101019 (2021).
- Mathis et al. (2022) M. A. Mathis, A. Khanolkar, L. Fu, M. S. Bryan, C. A. Dennett, K. Rickert, J. M. Mann, B. Winn, D. L. Abernathy, M. E. Manley, D. H. Hurley, and C. A. Marianetti, “Generalized quasiharmonic approximation via space group irreducible derivatives,” Phys. Rev. B 106, 014314 (2022).
- Khafizov et al. (2014) M. Khafizov, I.-W. Park, A. Chernatynskiy, L. He, J. Lin, J. J. Moore, D. Swank, T. Lillo, S. R. Phillpot, A. El-Azab, and D. H. Hurley, “Thermal conductivity in nanocrystalline ceria thin films,” J. Am. Ceram. Soc. 97, 562–569 (2014).
- Ziman (2001) J. M. Ziman, Electrons and phonons: the theory of transport phenomena in solids (Oxford university press, 2001).
- Khafizov et al. (2019) M. Khafizov, J. Pakarinen, L. He, and D. H. Hurley, “Impact of irradiation induced dislocation loops on thermal conductivity in ceramics,” J. Am. Ceram. Soc. 102, 7533–7542 (2019).
- Maradudin (1966) A. A. Maradudin, “Theoretical and experimental aspects of the effects of point defects and disorder on the vibrations of crystals—1,” in Solid state physics, Vol. 18 (Academic Press, 1966) pp. 273–420.
- Verma (1972) N. G. S. Verma, “Phonon conductivity of trivalent rare-earth-doped gallium and aluminium garnets,” Phys. Rev. B 6, 3509 (1972).
- Gofryk et al. (2014) K. Gofryk, S. Du, C. R. Stanek, J. C. Lashley, X.-Y. Liu, R. K. Schulze, J. L. Smith, D. J. Safarik, D. D. Byler, K. J. McClellan, B. P. Uberuagu, B. L. Scott, and D. A. Andersson, “Anisotropic thermal conductivity in uranium dioxide,” Nat. Commun. 5, 1–7 (2014).
- Santini et al. (2009) P. Santini, S. Carretta, G. Amoretti, R. Caciuffo, N. Magnani, and G. H. Lander, “Multipolar interactions in -electron systems: The paradigm of actinide dioxides,” Rev. Mod. Phys. 81, 807 (2009).
- Moore and Mcelroy (1971) J. P. Moore and D. L. Mcelroy, “Thermal conductivity of nearly stoichiometric single-crystal and polycrystalline UO2,” J. Am. Ceram. Soc. 54, 40 (1971).
- Lonchakov et al. (2004) A. T. Lonchakov, V. I. Sokolov, and N. B. Gruzdev, “An unusually strong resonant phonon scattering by 3- impurities in II–VI semiconductors,” physica status solidi (c) 1, 2967 (2004).