Revealing the hidden dynamics of confined water in acrylate polymers: Insights from hydrogen-bond lifetime analysis
Abstract
Polymers contain functional groups that participate in hydrogen bond (H-bond) with water molecules, establishing a robust H-bond network that influences bulk properties. This study utilized molecular dynamics (MD) simulations to examine the H-bonding dynamics of water molecules confined within three poly(meth)acrylates: poly(2-methoxyethyl acrylate) (PMEA), poly(2-hydroxyethyl methacrylate) (PHEMA), and poly(1-methoxymethyl acrylate) (PMC1A). Results showed that H-bonding dynamics significantly slowed as the water content decreased. Additionally, the diffusion of water molecules and its correlation with H-bond breakage were analyzed. Our findings suggest that when the H-bonds between water molecules and the methoxy oxygen of PMEA are disrupted, those water molecules persist in close proximity and do not diffuse on a picosecond timescale. In contrast, the water molecules H-bonded with the hydroxy oxygen of PHEMA and the methoxy oxygen of PMC1A diffuse concomitantly with the breakage of H-bonds. These results provide an in-depth understanding of the impact of polymer functional groups on H-bonding dynamics.
I Introduction
Poly(2-methoxyethyl acrylate) (PMEA) has gathered significant attention as a polymeric material with a high degree of blood compatibility. [1, 2] It is hypothesized that the formation of a hydration layer on the polymer surface may be the primary contributor to its blood compatibility. In particular, the presence of loosely interacting water molecules on its surface is thought to play a crucial role in its ability to inhibit protein adsorption and denaturation in the event of contact with blood, which is a well-known precipitant of thrombus formation. [3] The molecular-level insights of the interaction and dynamics of water at the surface of PMEA are thus sought to understand and improve the functions of the polymer surfaces. Specifically, accurate characterization of the motional time scale of water molecules confined within a polymer matrix is crucial since these water molecules in the proximity of the polymer surface are known to play a significant role in the underlying mechanism of blood compatibility.
Experimentally, differential scanning calorimetry (DSC) measurements revealed the presence of three distinct states of water in PMEA: free water, which freezes at 0∘C; intermediate water, which crystallizes near -40∘C during the temperature increase process; and non-freezing water, which does not freeze even at -100∘C. [4] Furthermore, the hydration state of water molecules in PMEA was investigated through infrared (IR) spectroscopy. [5, 6, 7] The H-bonding bands of the carbonyl group in PMEA were detected, signifying the presence of H-bonded non-freezing water molecules. The water molecules that interact with the oxygen of the methoxy group in PMEA are believed to exhibit an anomalous mobility, which is characterized as intermediate water. In addition, the detection of water molecules possessing a H-bonding structure similar to that of bulk water implies the existence of free water. However, capturing more precise pictures of water molecules confined within polymers remains challenging, since the dynamical states of water are diverse as classified into non-freezing water ( s), intermediate water ( s), and free water ( s), with their respective timescales determined through nuclear magnetic resonance (NMR) measurements. [8, 9]
Molecular dynamics (MD) simulations serve as a formidable method to achieve an in-depth comprehension of the structural and dynamic features of water molecules confined within PMEA. To this end, various MD simulations of hydrated PMEA have been conducted. [10, 11, 12, 13, 14, 15, 16] A particular focus is to investigate the molecular structure and vibrational spectra of water molecules at the water/polymer interface [14] and within hydrated PMEA. [15] In studies by Kuo et al., MD simulations were utilized to classify water molecules confined within PMEA based on their H-bonding interactions with polymer oxygen. [17, 18, 19, 20] It was proposed that non-bound water (NBW) denotes water molecules devoid of H-bonds with polymer oxygen, while those exhibiting a single H-bond were denoted as one-bound water (BW1), and those displaying a double H-bond were denoted as two-bound water (BW2). Additionally, the proportion of BW2, BW1, and NBW was found to exhibit a similar dependence on water content as the proportion of non-freezing water, intermediate water, and free water, as determined through DSC analysis.

However, the characterization of the time scale of H-bond rearrangements in individual water molecules has yet to be thoroughly scrutinized. This study aims to shed light on the dynamics of H-bonding of water molecules confined within PMEA by focusing on the acceptor oxygen as the bonding counterpart and categorizing the dynamic properties of water molecules. The impact of side-chain terminal groups and side-chain length on H-bonding and water molecule diffusion is also examined through simulations of hydrated PMEA analogues, such as poly(2-hydroxyethyl methacrylate) (PHEMA) and poly(1-methoxymethyl acrylate) (PMC1A) by varying the water content. The diffusivity of water molecules confined within polymers is further characterized and compared with that of bulk supercooled water. [21] The study analyzes how the confinement effect enhances the cage-effect and non-Gaussian behavior in single-particle displacement, which are frequently observed in supercooled water. Furthermore, the correlation between the diffusion of water molecules and H-bond breakage is analyzed. Therefore, this study presents a comprehensive discussion of the effects of the functional group on H-bonding and water molecule diffusion in hydrated PMEA and its analogues.
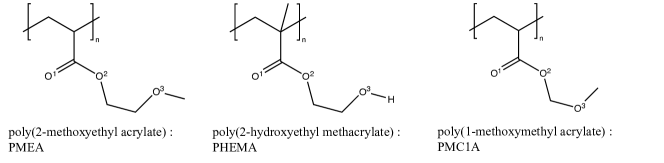
II Simulation details
The structure of the polymer studied in this paper is shown in Fig. 1. In this study, we conducted MD simulations of PMEA and its structural analogues, PHEMA and PMC1A. Each polymer features a side-chain possessing three oxygen atoms, namely, the carbonyl oxygen (), ether-like oxygen( ), and methoxy or hydroxy oxygen (), as denoted in Fig. 1. The structure of PHEMA is different from that of PMEA in that it has a methyl group on the backbone and a hydroxyl group at the terminal of the side chain instead of a methoxy group. PMC1A, on the other hand, is different from PMEA in terms of the number of methylene groups between the and sites. It is worth mentioning that both PHEMA and PMC1A exhibit inferior blood compatibility compared to PMEA and lack intermediate water molecules. [2, 22]
Each polymer was created by J-OCTA [23] using the OPLS-AA force field. [24] The polymer chain was atactic with a 1:1 steric control and a degree of polymerization of 50. A hydrogen atom was placed at each terminal of the polymer molecules, and number of polymer molecules in the simulation box was 20. Water molecules were modeled using the TIP4P/2005 model [25] and were added to the box to achieve mass water contents ranging from 3 to 90 wt% under periodic boundary conditions. Note that the saturated water content of PMEA in the experimental conditions has been reported to be 9 wt%. [4] MD simulations were performed using GROMACS [26] and initial molecular configurations were created using PACKMOL. [27] Initially, the ensemble calculation was performed for 10 ns at a temperature of 300 K and pressure of 1 bar. For PHEMA, a subsequent ensemble simulation was conducted for 10 ns at 300 K and 1000 bar to eliminate any cavities that may have arisen from the high hydrophilicity of PHEMA during the first step calculation. The ensemble was then utilized for a 5 ns annealing at 1000 K. Afterward, the system’s box size was determined via equilibration at 300 K and 1 bar, followed by a product run in the ensemble for up to 500 ns at 300 K. The time step was set to 1 fs, and temperature and pressure were controlled using the Nosé–Hoover thermostat [28, 29] and the Parrinello–Rahman barostat, [30] respectively.
III Results and discussion
III.1 H-bond definition and size of water cluster

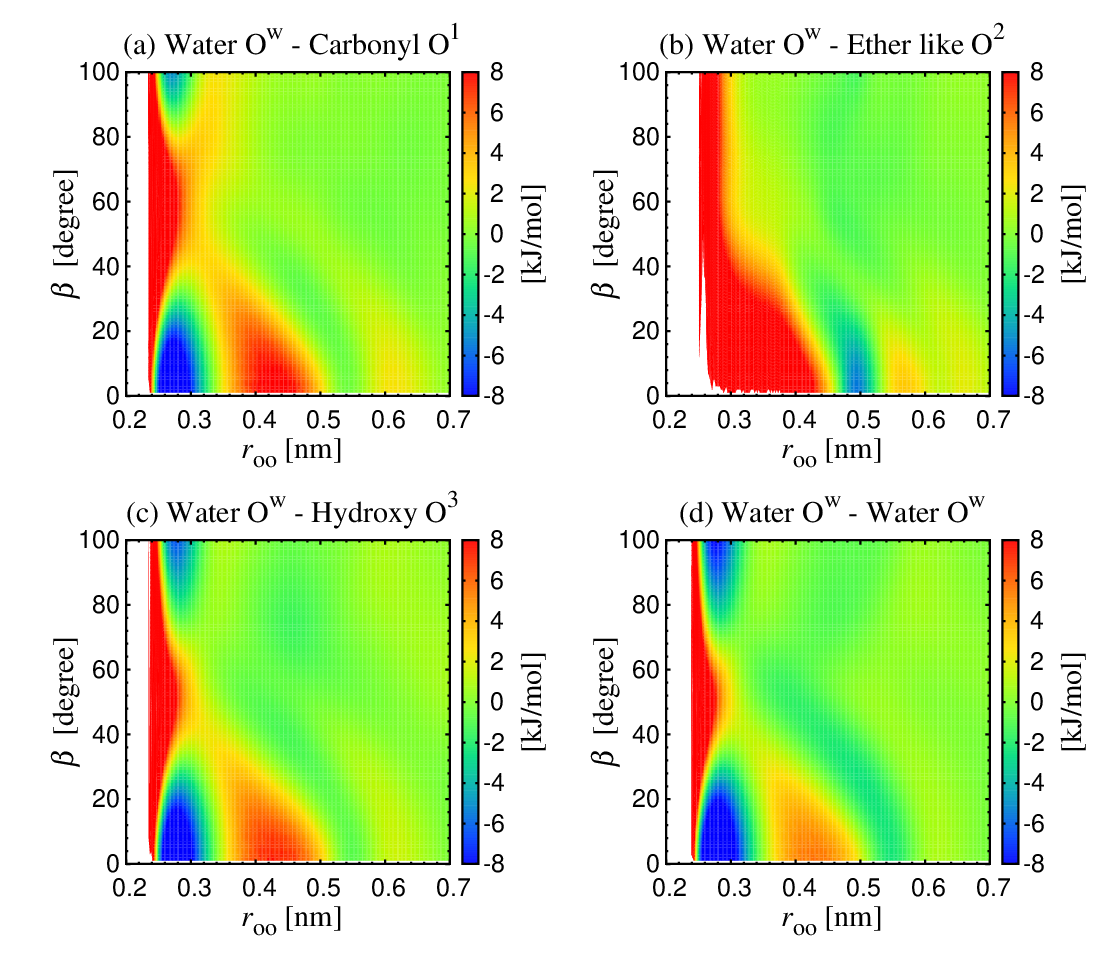
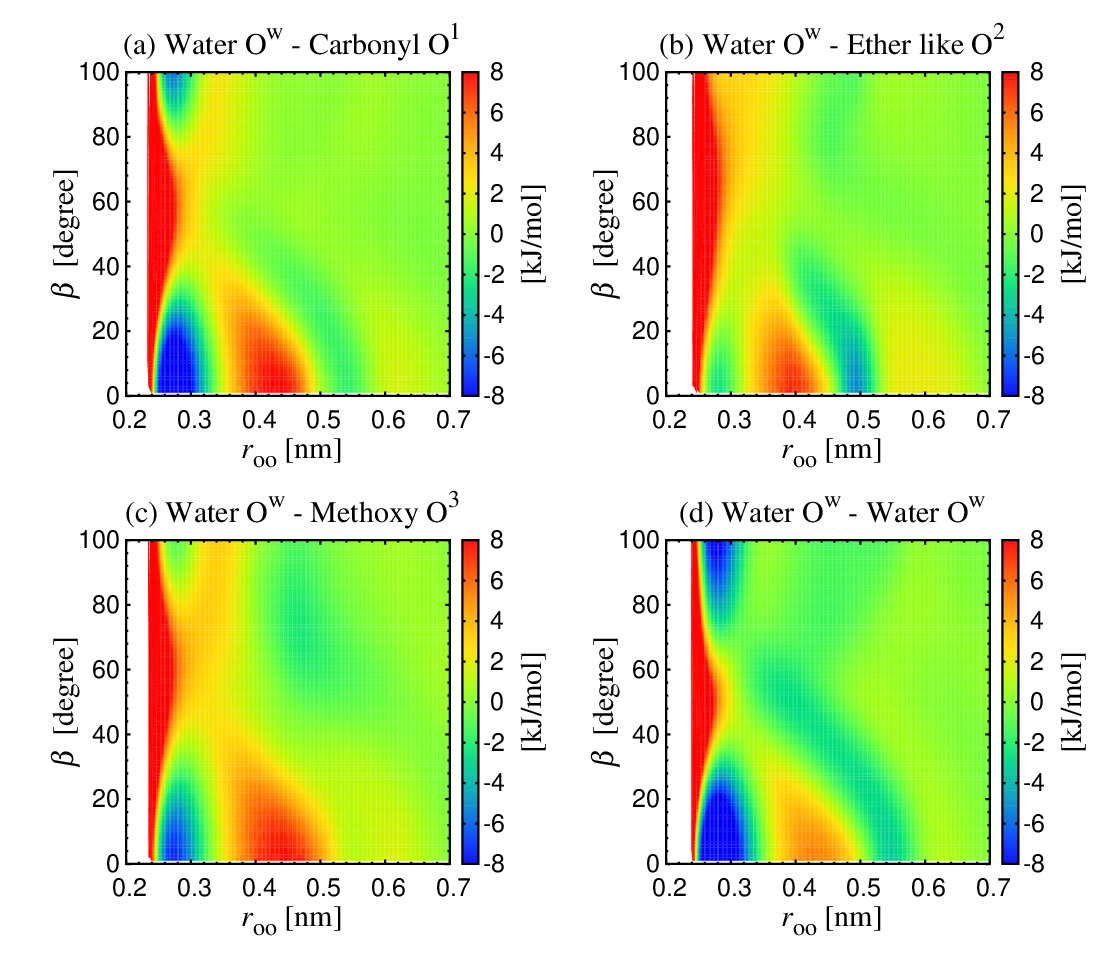
To examine the state of H-bond in water molecules confined within polymers, we calculated the distance and angle distribution function, , using the O-O distance, , and the angle of O-OH, . [31, 32, 33] The expression represents the averaged number of oxygen atoms present in the partial spherical shell with and , located at a distance and angle from one of the hydrogen atoms of the donor, where is the molecular number density of the system. We then derived a 2-dimensional (2D) potential of mean force (PMF) between water molecule oxygen () and each polymer oxygen (, , ) or water molecule oxygen (), by setting .
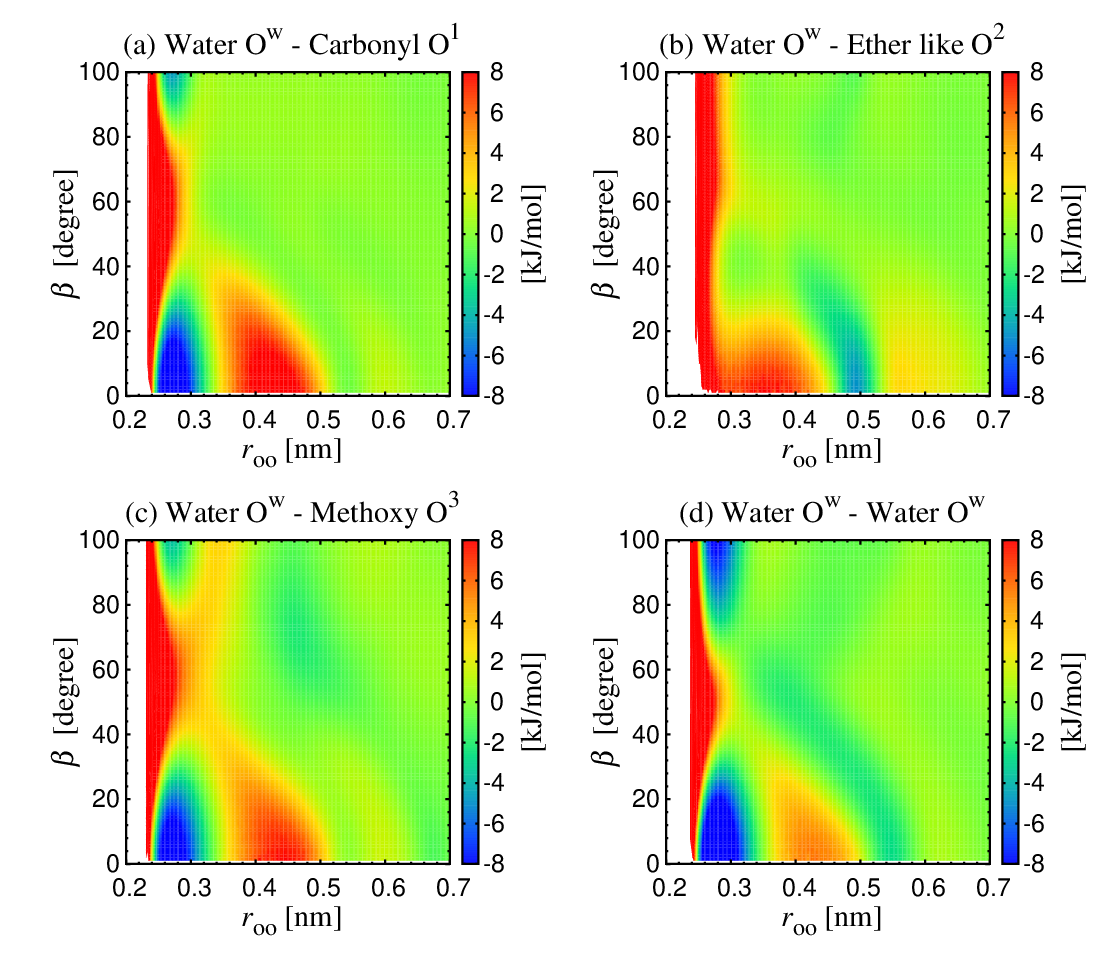
Figure 2 displays the 2D PMF of PMEA-water system at 9 wt%. The results of the PHEMA and PMC1A systems are presented in Fig. S1 and Fig. S2 of supplementary material, respectively. The 2D PMF remains unaltered upon variation in water content for each polymer system (data not shown). As indicated in Fig. 2, the state of H-bond is determined by the energetically stable region, which is defined as . It is noteworthy that the most stable region between and ether-like oxygen was observed in the second coordination shell outside the H-bond region, and the common tendency is seen with PHEMA and PMC1A in Figs. S1(b) and S2(b). Henceforth, we consider the carbonyl oxygen (), the methoxy or hydroxy oxygen (), and the water oxygen () as H-bond acceptor oxygen.
To understand the water dynamics in the confined systems, it is crucial to characterize the size of water clusters in the polymer-water system. We calculated the size of water cluster using a criterion based on the H-bond length, as used in a previous study. [17] Water molecules are considered to belong to the same cluster if they satisfy H-bond length of nm. Figure 3 shows the accumulated percentage of water molecules as a function of the size of the water cluster at various water contents. All polymer-water systems exhibit small clusters of less than 10 water molecules at 3 wt%. As the water content increases, the water molecules begin to aggregate, resulting in an increase in the cluster size. Eventually, the clusters connect with each other to form large clusters of approximately molecules at 30 wt%. Interestingly, PHEMA shows a smaller cluster size at water contents below 15 wt% compared to PMEA and PMC1A. This is attributed to the hydrophilic nature of PHEMA, which hinders water molecules clustering. The smaller cluster size results in a lower porosity, which may contribute to lower mobility of water molecules compared to PMEA and PMC1A.
III.2 H-bond lifetime
The H-bond time correlation function is represented as
| (1) |
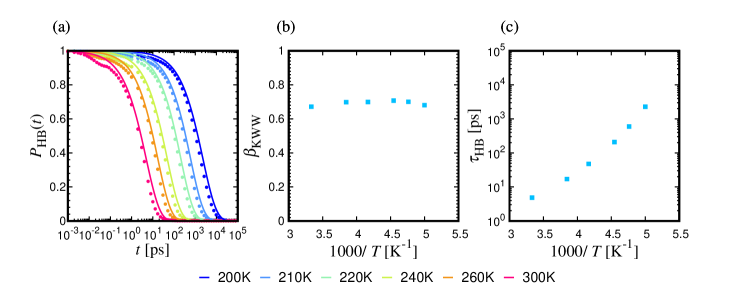
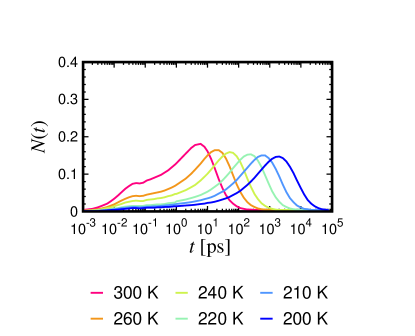
where denotes the H-bond operator, such that equals unity if the water molecule acting as the donor and the acceptor oxygen is H-bonded at time and zero if the bond is not present. [34, 35, 36, 37] The symbol represents the ensemble average over all possible pairs of H-bonds at the initial time 0. The was calculated for each acceptor oxygen, and the results are shown in Fig. 4. The relaxation of significantly slows down as the water content decreases and is found to exhibit a stretched exponential decay. Thus, was fitted by the Kohlrausch–Williams–Watts (KWW) function, . The exponent characterizes how much the decay is stretched compared to the exponential decay of . The values of the exponent are displayed in Fig. S3 of supplementary material. For comparison, we also calculated the of TIP4P/2005 liquid water system at 1 g/cm3 and temperatures ranging from 300 K to 200 K. Figure S4(a) and S4(b) of supplementary material display the temperature dependence of and , respectively.
The integral of characterizes the H-bond lifetime ,
| (2) |
By using the stretched exponential form, was estimated by the mean relaxation time as with the Gamma function . It should be noted that when equals to 1, is the samel as .
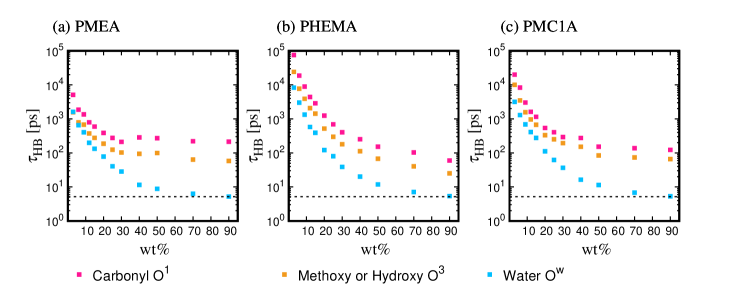
The water content dependence of is displayed in Fig. 5. Overall, as the water content decreases, increases in all polymer-water systems, indicating a slowing down in H-bond dynamics, which is similar to the time scale observed in supercooled water (see Fig. S4(c) of supplementary material that provides the temperature dependence of in bulk water). On the other hand, as the water content increases, ultimately reached a constant value. Note that of is nearly equal to that of bulk water at 1 g/cm3 and 300 K, ps. Furthermore, the values of were found to be ranked in the order of . The hydrophilicity of the functional groups notably enhances at low water contents. Specifically, in PHEMA, becomes approximately 10 times larger than that of PMEA and PMC1A, indicating the strong affinity of water to PHEMA resulting from the persistent H-bond between water molecules and the polymer. In contrast, in the PMEA system, for the methoxy in PMEA displays a relaxation faster than the other acceptors, the carbonyl and water , particularly at water contents lower than 9 wt%, as shown in Fig. 4(a)-(c). Note that the methoxy has a smaller value of compared to the other acceptors (see Fig. S3(a) of supplementary material). A more stretched exponential decay of results in of that is comparable to that of at low water contents. These observations demonstrate unique H-bonding interactions between water molecules and the methoxy gourp of PMEA.
III.3 Classification of water molecule states
| Classification | acceptor oxygen species | ||
|---|---|---|---|
| 1 | 2 | ||
| UW | (Unstable Water) | N | (N, ) |
| FDW | (Fast Dynamics Water) | () | |
| IDW | (Intermediate Dynamics Water) | () | |
| SDW | (Slow Dynamics Water) | ||
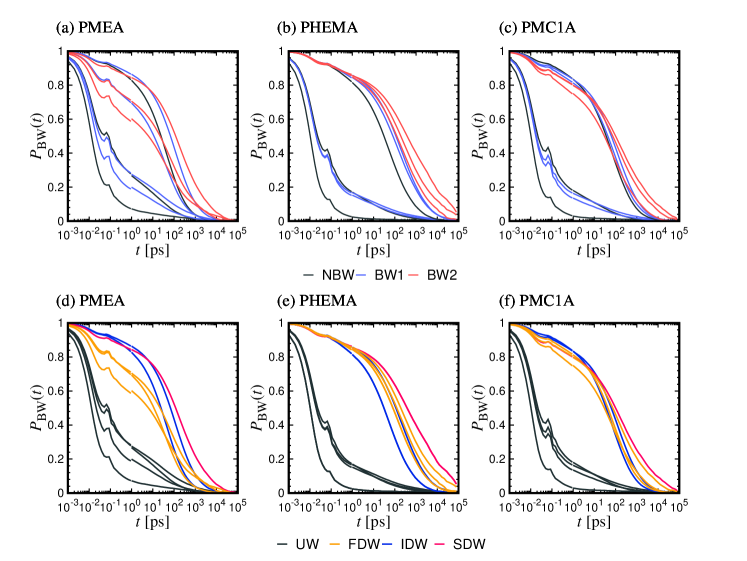
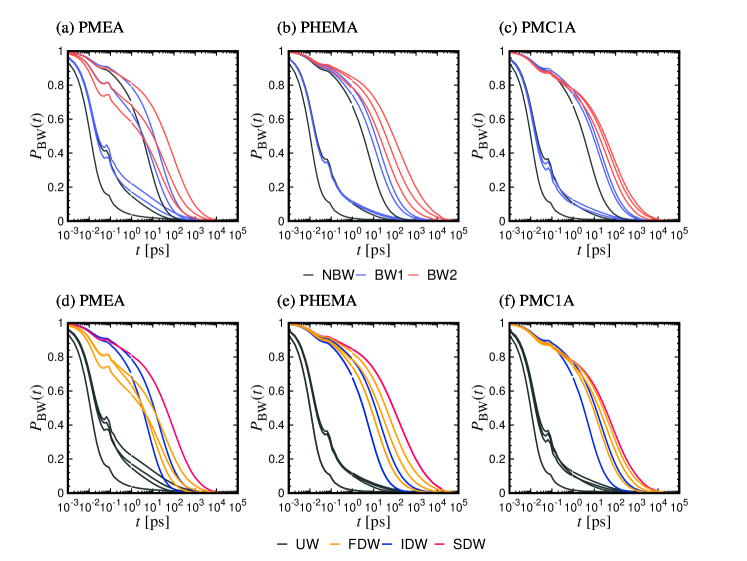
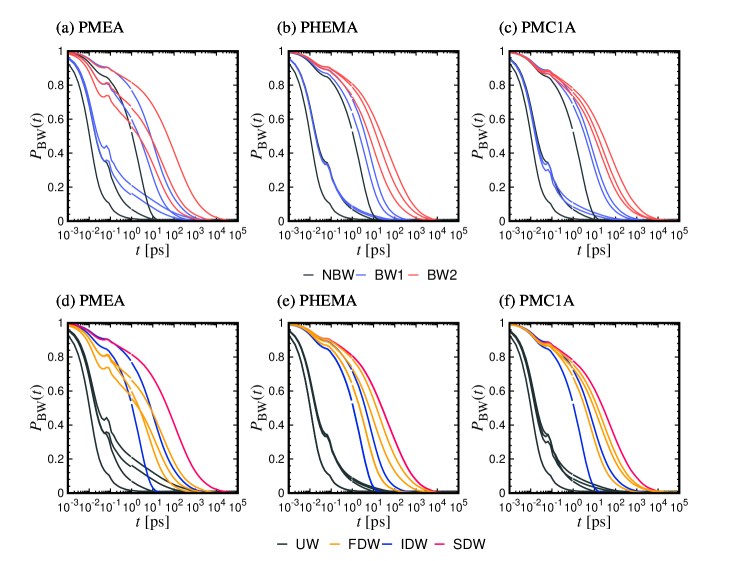
The H-bond time correlation function is further examined to elucidate the dynamics of water molecules in more detail. Each water molecule has four possible states based on its H-bond acceptor oxygen (or the absence), namely , , and , or no H-bond (N). Since a single water molecule has two donor hydrogen atoms, there are a total of 10 possible states for each water molecule when considering the overlapping combinations. Thus, the H-bond operator is expanded to , which is unity when water molecule is H-bonded with acceptor oxygen and also H-bonded with acceptor oxygen at time and zero otherwise. Note that 10 states can be classified into three water molecules based on the number of H-bonds with the polymer: NBW, BW1, and BW2 (note that the H-bond with is not counted in the classification into NBW, BW1, and BW2) [18, 19, 20]. The time correlation function of is analogous to Eq. (1) and expressed by
| (3) |
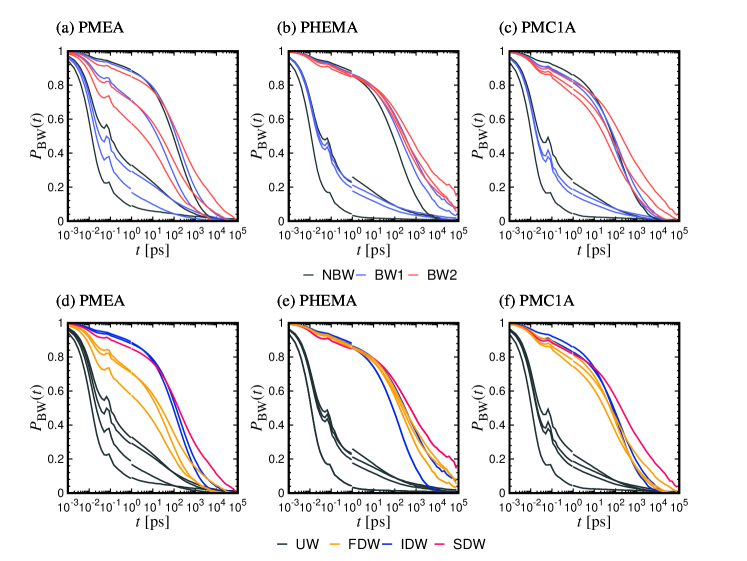
At 9 wt%, the results of of 10 water molecule states are plotted in Fig. 6. In addition, Figs. S5, S6, and S7 of supplementary materials show at other water contents, 3 wt%, 30 wt%, and 90 wt%, respectively.
The results show that the relaxation curves can be categorized into two modes: a slow relaxation mode and a fast relaxation mode with a small tail. Additionally, the intermediate relaxation mode was observed in PMEA’s . However, the NBW, BW1, and BW2 classification (as shown in Fig. 6(a)-(c)) is insufficient to distinguish between the relaxation modes. The relaxation of BW1 may overlap with those of BW2 and NBW, and BW2 and NBW correspond roughly to fast and slow modes, respectively. Moreover, the intermediate relaxation mode observed in PMEA’s requires further clarification. A more detailed classification may be necessary, and one possible approach is to compare the water molecule states in PMEA with those in PHEMA and PMC1A.
We propose a novel classification for based on the H-bond lifetime time , taking into account the significant difference in between and in PMEA (see Fig. 5(a)). The new classification, presented in Table. 1, mainly classifies acceptor oxygen species 1 in the order of N, , , and . It results in three stable types of water: FDW (Fast Dynamics Water), IDW (Intermediate Dynamics Water), and SDW (Slow Dynamics Water) based on H-bonds with , , and , respectively. We also define an Unstable Water (UW) state where at least one of the donor hydrogen atoms does not form an H-bond, causing the state to relax very rapidly.
As shown in Fig. 6(d)-(f), our proposed classification better characterizes the relaxations behavior of . The SDW state displays the slowest relaxation due to its two H-bonds with . While the relaxation of IDW is comparable to that of SDW, IDW shows a greater dependence on the water content when compared to SDW (see Figs. S5-S7 of supplementary material). Moreover, our results indicate that the relaxation of FDW, which is attributed to the H-bond with , is faster in PMEA compared to SDW and IDW. It is important to note that the H-bond lifetime of PMEA was significantly different between and (see again Fig. 5(a)), which should be considered to classify . Besides, FDW displays a relaxation behavior more analogous to that of SDW and IDW in the cases of PHEMA and PMC1A.
III.4 Water molecule diffusion
The mean square displacement (MSD) was calculated to evaluate the diffusion of water molecules in each polymer-water system. The MSD is expressed by
| (4) |
where represents the displacement vector of oxygen atom of water molecule between two times and , and is the number of water molecules.
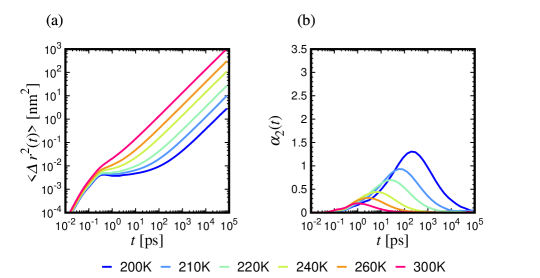
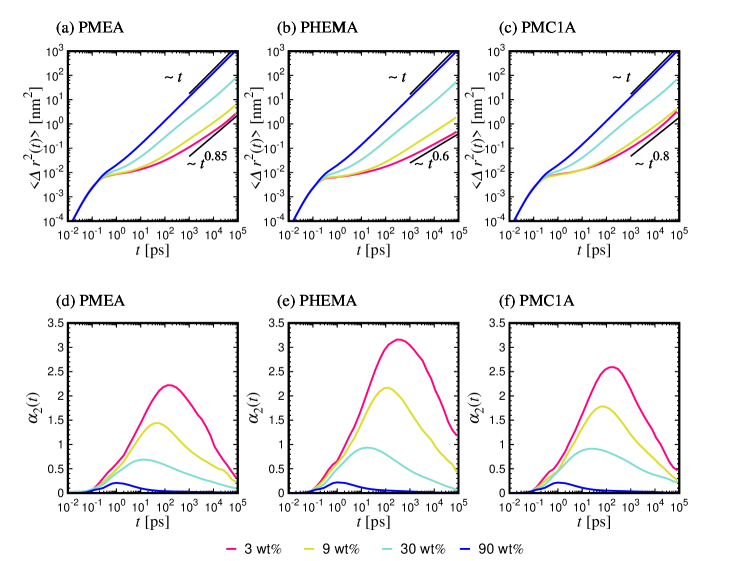
Figure 7 presents the MSD of water molecules in each system studied. To provide a point of reference, Fig. S8(a) of supplementary material displays the temperature dependence of MSD in bulk supercooled water. In the short time regime ( ps), the MSD exhibits a proportional relationship with , which indicate the ballistic motion without colliding with other molecules. The second regime is a time region of approximately to ps, where the MSD shows a plateau that is more prominent with decreasing water content. This plateau represents the “cage-effect” observed also in supercooled water, where water molecules are confined by H-bonds for a significant duration (see also Fig. S8(a) of supplementary material). [38, 39, 40, 41, 42, 43, 44, 45] Finally, in the long-time regime, the cage-effect weakens and the diffusivity of water molecules will be described by proportional to . However, the sub-diffusive behavior with was observed at longer times. This sub-diffusivity can be attributed to the low mobility of polymer side chains that create a heterogeneous environment, causing less water molecule diffusion compared to that of bulk water. [46, 47, 48, 49, 50, 51] In fact, Fig. 3 shows that at water contents below 15 wt%, most of water molecules are isolated and confined within the polymer matrix. This confinement effect is particularly pronounced in PHEMA due to its high hydrophilicity, resulting in the sub-diffusive behavior with the exponent at 3 wt%, which is lower than those observed in PMEA and PMC1A. In contrast, the increase in the water content leads to the formation of water molecule clusters and greater connectivity, as depicted in Fig. 3. Therefore, it is thought that the larger the connection of water molecules, the easier it is to establish a path for diffusion.
The non-Gaussian parameter (NGP) was also calculated to assess the deviation of the displacement of water molecules in polymers-water system from the Gauss distribution. The NGP is expressed by
| (5) |
where is the fourth-order moment of displacement between 0 and . The NGP in supercooled water has been extensively studied and has been found to exhibit a significant level of non-Gaussianity as the temperature decreases, suggesting the presence of dynamic heterogeneity. [39, 40, 41, 42, 43, 45]
The results of are presented in Fig. 7. The of bulk supercooled water is found in Fig. S8(b) of supplementary material. The value of starts from 0 at short times, corresponding to the ballistic regime in the MSD, and increases at intermediate times, where the MSD exhibits the plateau due to the cage-effect. The peak of is reached when escaping the cage-effect in the MSD. The peak height of increases as the water content is lowered. This indicates the significant non-Gaussianity of the displacement of water molecules when water molecules are surrounded in the highly heterogeneous environment created by the polymer matrix. After the peak, converges to 0, corresponding to the diffusive behavior. Interestingly, the order of the maximum peak height in and the sub-diffusively of MSD corresponds to the trend of the H-bond lifetime , where PMEA has the shortest lifetime and PHEMA has the longest. This suggests that the anomalous water dynamics confined within the polymer matrix is related to the strength and lifetime of the H-bonds between water and polymer.
III.5 Correlation between H-bond breakage and water diffusion
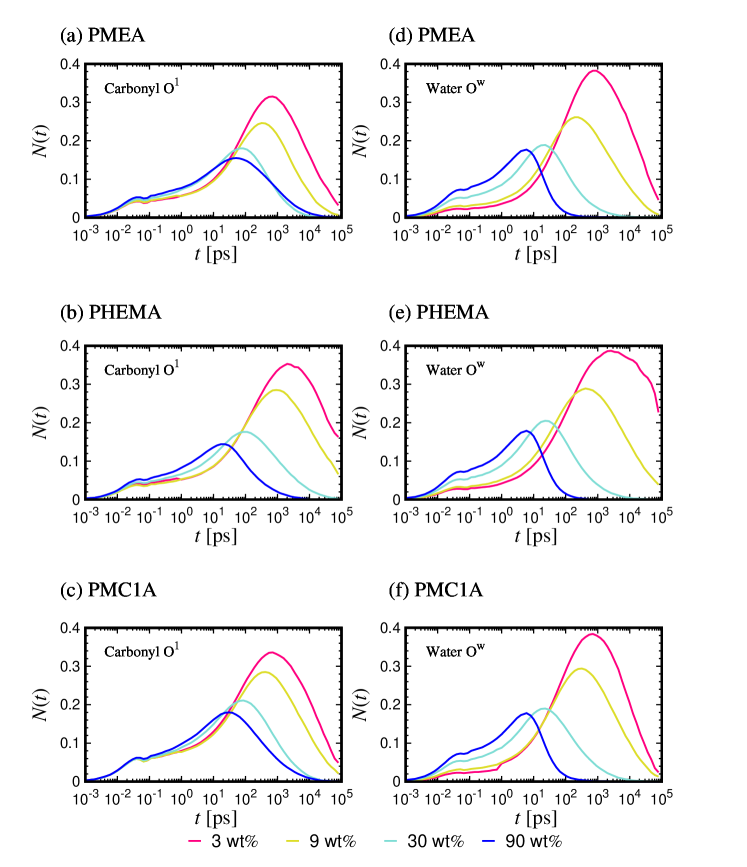
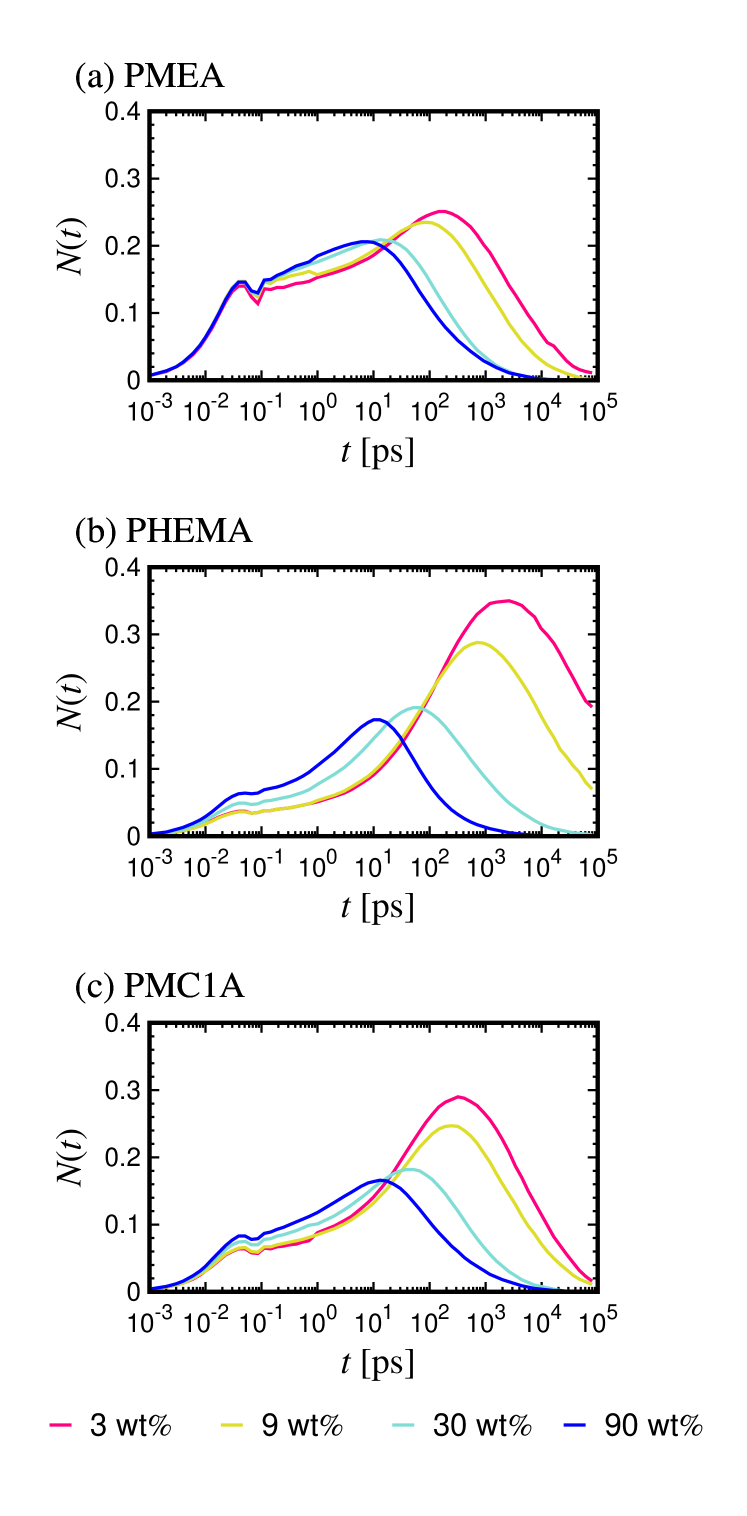
The correlation between diffusion of water molecules was investigated to determine the impact of H-bond breakage on the diffusion of two H-bonded water molecules. In fact, H-bond networks can hinder the water diffusion. Conversely, when two water molecules break an H-bond, they may form it again if they have not diffused away from each other. To evaluate the contribution of the water molecule that does not diffuse after H-bond breakage, a time correlation function was proposed, which is defined as
| (6) |
Here, is an index function that takes the value of unity if the distance between oxygen atoms and is less than 0.35 nm and 0 otherwise. [35, 36, 52, 53, 54] It should be noted that even if the O-O distance is close and equals 1, is 1 when the H-bond is broken at . Consequently, represents the conditional probability that a water molecule and an acceptor oxygen remain in close proximity at time , even after H-bond breakage, provided that they were H-bonded at . At short times, is anticipated to exhibit an ascending trend following the H-bond breakages, whereas should approach to 0 due to water molecule diffusion at long times.
Figure 8 depicts of the water molecule that is H-bonding with the methoxy or hydroxy oxygen (). Results of corresponding to the carbonyl oxygen () and water oxygen () can be found in Fig. S9 of supplementary material. Additionally, Fig. S10 of supplementary material displays the temperature dependence of in bulk water for comparison. As illustrated in Fig. 8, the peak of occurs at approximately the H-bond lifetime , and becomes more prominent as water content decreased. The maximum values of at low water contents are higher for PHEMA, followed by PMC1A and PMEA, corresponding to larger H-bond lifetimes of . This observation can be attributed to the low diffusivity of the water molecules near polymers due to water and polymer interactions, despite the H-bond being broken. In contrast, in supercooled water, as the temperature decreases, the peak of becomes less pronounced, indicating the relatively higher mobility of water molecules upon breaking their H-bonds, rather than remaining in their original positions, as demonstrated in Fig. S10 of the supplementary material. Notably, the behavior of of the methoxy oxygen in PMEA exhibits distinct characteristics. As illustrated in Fig. 8(a), exhibits a discernible fraction of persisting over a timescale of approximately ps, irrespective of water content. This observation suggests that following the H-bond breakages, water molecules H-bonded with do not diffuse instantly, but rather exhibit rotational motions, indicating weak binding of water molecules in the visinity of in PMEA. In contrast, the persistence of on the picosecond timescale is not observed in Fig. 8(b) and (c) for PHEMA and PMC1A, indicating that a water molecule leaves the polymer surface upon breakage of the H-bond.
IV Conclusion
In this study, MD simulations were conducted to investigate the dynamic properties of water molecules confined within poly(meth)acrylates, including PMEA, PHEMA, and PMC1A. The mobility of water molecules confined in polymers was found to be significantly slower than that in ordinary bulk water, and highly dependent on the water content. As the water content decreases, the H-bond lifetime increases, approaching values observed in bulk supercooled water. Additionally, the conventional classification of H-bond correlation function based on the number of H-bonds with polymeric oxygen was insufficient in describing the behavior of water molecules in PMEA. Instead, classifying the behavior of water molecules based on H-bond acceptors proved to be more effective.
The diffusive behavior of water molecules was analyzed by the MSD and NGP methods, commonly employed in the study of supercooled water. The results indicate the sub-diffusive and non-Gaussian behavior in single particle displacements, which are attributed to the limited mobility of water molecules confined within the polymer matrix. Moreover, the H-bonds of the methoxy oxygen in PMEA were observed to break more rapidly than in PHEMA and PMC1A at low to medium water contents, but the water molecule and the methoxy group involved remain in close proximity to one another.
The characteristic behaviors of water molecules in the proximity of the polymer surface were observed through simulations and are consistent with experimental results, which suggest the specific role of the PMEA methoxy group noted often within the context of “intermediate water”. [5, 6, 7] Specifically, the present study has revealed that the H-bond dynamics of the methoxy oxygen in PMEA, characterized by a time scale of - ps, is one order of magnitude faster than that observed in other polymers, such as PHEMA and PMC1A. Remarkably, the time scale of water molecules H-bonded with the methoxy oxygen in PMEA approximates to that of “intermediate water” characterized by NMR spectroscopy, which may be linked to a potential mechanism underlying protein denaturing adsorption. Nevertheless, the precise relationship between the dynamics of water molecules with intermediate time scales and blood compatibility of PMEA remains to be elucidated. Further studies are needed to fully understand the underlying mechanism of protein denaturing adsorption, which is largely attributed to the presence of water molecules in the proximity of the polymer surface.
Supplementary Material
See supplementary material for 2D PMF of PHEMA and PMC1A (Figs. S1 and S2), water content dependence of exponent (Fig. S3), H-bond correlation function and lifetime of bulk supercooled water (Fig. S4), at water contents, 3 wt%, 30 wt%, and 90 wt% (Figs. S5, S6, and S7), MSD and NGP of bulk supercooled water (Fig. S8) of carbonyl oxygen and water oxygen (Fig. S9), and of bulk supercooled water (Fig. S10).
Acknowledgements.
This work was supported by JSPS KAKENHI Grant-in-Aid for Scientific Research on Innovative Areas: Aquatic Functional Materials (No. JP22H04542). This work was also partially supported by the Fugaku Supercomputing Project (No. JPMXP1020200308) and the Data-Driven Material Research Project (No. JPMXP1122714694) from the Ministry of Education, Culture, Sports, Science, and Technology. K.K. acknowledges Professor Takashi Kato (University of Tokyo) and Professor Masaru Tanaka (Kyushu University) for valuable discussions. The numerical calculations were performed at Research Center of Computational Science, Okazaki Research Facilities, National Institutes of Natural Sciences (Project: 21-IMS-C058).AUTHOR DECLARATIONS
Conflict of Interest
The authors have no conflicts to disclose.
Data availability statement
The data that support the findings of this study are available from the corresponding author upon reasonable request.
References
- Tanaka et al. [2000a] M. Tanaka, T. Motomura, M. Kawada, T. Anzai, Yuu Kasori, T. Shiroya, K. Shimura, M. Onishi, and Akira Mochizuki, “Blood compatible aspects of poly(2-methoxyethylacrylate) (PMEA)—relationship between protein adsorption and platelet adhesion on PMEA surface,” Biomaterials 21, 1471–1481 (2000a).
- Tanaka et al. [2002] M. Tanaka, A. Mochizuki, N. Ishii, T. Motomura, and T. Hatakeyama, “Study of Blood Compatibility with Poly(2-methoxyethyl acrylate). Relationship between Water Structure and Platelet Compatibility in Poly(2-methoxyethylacrylate-co-2-hydroxyethylmethacrylate),” Biomacromolecules 3, 36–41 (2002).
- Tanaka and Mochizuki [2004] M. Tanaka and A. Mochizuki, “Effect of water structure on blood compatibility— thermal analysis of water in poly(meth)acrylate,” J. Biomed. Mater. Res. A 68A, 684–695 (2004).
- Tanaka et al. [2000b] M. Tanaka, T. Motomura, N. Ishii, K. Shimura, M. Onishi, A. Mochizuki, and T. Hatakeyama, “Cold crystallization of water in hydrated poly(2-methoxyethyl acrylate) (PMEA),” Polym. Int. 49, 1709–1713 (2000b).
- Kitano et al. [2001] H. Kitano, K. Ichikawa, M. Fukuda, A. Mochizuki, and M. Tanaka, “The Structure of Water Sorbed to Polymethoxyethylacrylate Film as Examined by FT–IR Spectroscopy,” J. Colloid Interface Sci. 242, 133–140 (2001).
- Kitano et al. [2005] H. Kitano, S. Tada, T. Mori, K. Takaha, M. Gemmei-Ide, M. Tanaka, M. Fukuda, and Y. Yokoyama, “Correlation between the Structure of Water in the Vicinity of Carboxybetaine Polymers and Their Blood-Compatibility,” Langmuir 21, 11932–11940 (2005).
- Morita, Tanaka, and Ozaki [2007] S. Morita, M. Tanaka, and Y. Ozaki, “Time-Resolved In Situ ATR-IR Observations of the Process of Sorption of Water into a Poly(2-methoxyethyl acrylate) Film,” Langmuir 23, 3750–3761 (2007).
- Miwa et al. [2009] Y. Miwa, H. Ishida, H. Saitô, M. Tanaka, and A. Mochizuki, “Network structures and dynamics of dry and swollen poly(acrylate)s. Characterization of high- and low-frequency motions as revealed by suppressed or recovered intensities (SRI) analysis of 13C NMR,” Polymer 50, 6091–6099 (2009).
- Tsuruta [2010] T. Tsuruta, “On the Role of Water Molecules in the Interface between Biological Systems and Polymers,” J. Biomater. Sci. Polym. Ed. 21, 1831–1848 (2010).
- Nagumo et al. [2013] R. Nagumo, K. Akamatsu, R. Miura, A. Suzuki, N. Hatakeyama, H. Takaba, and A. Miyamoto, “Computational Chemistry Study on the Microscopic Interactions between Biomolecules and Hydrophilic Polymeric Materials,” J. Chem. Engn. Japan 46, 421–423 (2013).
- Nagumo et al. [2019] R. Nagumo, A. Shimizu, S. Iwata, and H. Mori, “Molecular dynamics study of the molecular mobilities and side-chain terminal affinities of 2-methoxyethyl acrylate and 2-hydroxyethyl methacrylate,” Polym. J. 51, 365–370 (2019).
- Nagumo, Matsuoka, and Iwata [2021] R. Nagumo, T. Matsuoka, and S. Iwata, “Interactions between Acrylate/Methacrylate Biomaterials and Organic Foulants Evaluated by Molecular Dynamics Simulations of Simplified Binary Mixtures,” ACS Biomater. Sci. Eng. 7, 3709–3717 (2021).
- Yasoshima et al. [2017] N. Yasoshima, M. Fukuoka, H. Kitano, S. Kagaya, T. Ishiyama, and M. Gemmei-Ide, “Diffusion-Controlled Recrystallization of Water Sorbed into Poly(meth)acrylates Revealed by Variable-Temperature Mid-Infrared Spectroscopy and Molecular Dynamics Simulation,” J. Phys. Chem. B 121, 5133–5141 (2017).
- Kishinaka, Morita, and Ishiyama [2019] S. Kishinaka, A. Morita, and T. Ishiyama, “Molecular structure and vibrational spectra at water/poly(2-methoxyethylacrylate) and water/poly(methyl methacrylate) interfaces: A molecular dynamics simulation study,” J. Chem. Phys. 150, 044707 (2019).
- Yasoshima et al. [2021] N. Yasoshima, T. Ishiyama, M. Gemmei-Ide, and N. Matubayasi, “Molecular Structure and Vibrational Spectra of Water Molecules Sorbed in Poly(2-methoxyethylacrylate) Revealed by Molecular Dynamics Simulation,” J. Phys. Chem. B 125, 12095–12103 (2021).
- Yasoshima, Ishiyama, and Matubayasi [2022] N. Yasoshima, T. Ishiyama, and N. Matubayasi, “Adsorption Energetics of Amino Acid Analogs on Polymer/Water Interfaces Studied by All-Atom Molecular Dynamics Simulation and a Theory of Solutions,” J. Phys. Chem. B 126, 4389–4400 (2022).
- Kuo et al. [2019] A.-T. Kuo, S. Urata, R. Koguchi, K. Yamamoto, and M. Tanaka, “Analyses of equilibrium water content and blood compatibility for Poly(2-methoxyethyl acrylate) by molecular dynamics simulation,” Polymer 170, 76–84 (2019).
- Kuo et al. [2020a] A.-T. Kuo, T. Sonoda, S. Urata, R. Koguchi, S. Kobayashi, and M. Tanaka, “Elucidating the Feature of Intermediate Water in Hydrated Poly(-methoxyalkyl acrylate)s by Molecular Dynamics Simulation and Differential Scanning Calorimetry Measurement,” ACS Biomater. Sci. Eng. 6, 3915–3924 (2020a).
- Kuo et al. [2020b] A.-T. Kuo, S. Urata, R. Koguchi, T. Sonoda, S. Kobayashi, and M. Tanaka, “Molecular Dynamics Study on the Water Mobility and Side-Chain Flexibility of Hydrated Poly(-methoxyalkyl acrylate)s,” ACS Biomater. Sci. Eng. 6, 6690–6700 (2020b).
- Kuo et al. [2021] A.-T. Kuo, S. Urata, R. Koguchi, T. Sonoda, S. Kobayashi, and M. Tanaka, “Effects of Side-Chain Spacing and Length on Hydration States of Poly(2-methoxyethyl acrylate) Analogues: A Molecular Dynamics Study,” ACS Biomater. Sci. Eng. 7, 2383–2391 (2021).
- Gallo et al. [2016] P. Gallo, K. Amann-Winkel, C. A. Angell, M. A. Anisimov, F. Caupin, C. Chakravarty, E. Lascaris, T. Loerting, A. Z. Panagiotopoulos, J. Russo, J. A. Sellberg, H. E. Stanley, H. Tanaka, C. Vega, L. Xu, and L. G. M. Pettersson, “Water: A Tale of Two Liquids,” Chem. Rev. 116, 7463–7500 (2016).
- Kobayashi et al. [2017] S. Kobayashi, M. Wakui, Y. Iwata, and M. Tanaka, “Poly(-methoxyalkyl acrylate)s: Nonthrombogenic Polymer Family with Tunable Protein Adsorption,” Biomacromolecules 18, 4214–4223 (2017).
- [23] “J-OCTA - an integrated system for multiscale modeling and simulation — JSOL Corporation,” https://www.j-octa.com/.
- Jorgensen, Maxwell, and Tirado-Rives [1996] W. L. Jorgensen, D. S. Maxwell, and J. Tirado-Rives, “Development and Testing of the OPLS All-Atom Force Field on Conformational Energetics and Properties of Organic Liquids,” J. Am. Chem. Soc. 118, 11225–11236 (1996).
- Abascal and Vega [2005] J. L. F. Abascal and C. Vega, “A general purpose model for the condensed phases of water: TIP4P/2005,” J. Chem. Phys. 123, 234505 (2005).
- Abraham et al. [2015] M. J. Abraham, T. Murtola, R. Schulz, S. Páll, J. C. Smith, B. Hess, and E. Lindahl, “GROMACS: High performance molecular simulations through multi-level parallelism from laptops to supercomputers,” SoftwareX 1–2, 19–25 (2015).
- Martínez et al. [2009] L. Martínez, R. Andrade, E. G. Birgin, and J. M. Martínez, “PACKMOL: A package for building initial configurations for molecular dynamics simulations,” J. Comput. Chem. 30, 2157–2164 (2009).
- Nosé [1984] S. Nosé, “A unified formulation of the constant temperature molecular dynamics methods,” J. Chem. Phys. 81, 511–519 (1984).
- Hoover [1985] W. G. Hoover, “Canonical dynamics: Equilibrium phase-space distributions,” Phys. Rev. A 31, 1695–1697 (1985).
- Parrinello and Rahman [1981] M. Parrinello and A. Rahman, “Polymorphic transitions in single crystals: A new molecular dynamics method,” J. Appl. Phys. 52, 7182–7190 (1981).
- Kumar, Schmidt, and Skinner [2007] R. Kumar, J. R. Schmidt, and J. L. Skinner, “Hydrogen bonding definitions and dynamics in liquid water,” J. Chem. Phys. 126, 204107 (2007).
- Kikutsuji, Kim, and Matubayasi [2018] T. Kikutsuji, K. Kim, and N. Matubayasi, “How do hydrogen bonds break in supercooled water?: Detecting pathways not going through saddle point of two-dimensional potential of mean force,” J. Chem. Phys. 148, 244501 (2018).
- Kikutsuji, Kim, and Matubayasi [2019a] T. Kikutsuji, K. Kim, and N. Matubayasi, “Consistency of geometrical definitions of hydrogen bonds based on the two-dimensional potential of mean force with respect to the time correlation in liquid water over a wide range of temperatures,” J. Mol. Liq. 294, 111603 (2019a).
- Rapaport [1983] D. Rapaport, “Hydrogen bonds in water: Network organization and lifetimes,” Mol. Phys. 50, 1151–1162 (1983).
- Luzar and Chandler [1996a] A. Luzar and D. Chandler, “Hydrogen-bond kinetics in liquid water,” Nature 379, 55–57 (1996a).
- Luzar and Chandler [1996b] A. Luzar and D. Chandler, “Effect of Environment on Hydrogen Bond Dynamics in Liquid Water,” Phys. Rev. Lett. 76, 928–931 (1996b).
- Luzar [2000] A. Luzar, “Resolving the hydrogen bond dynamics conundrum,” J. Chem. Phys. 113, 10663–10675 (2000).
- Gallo et al. [1996] P. Gallo, F. Sciortino, P. Tartaglia, and S.-H. Chen, “Slow Dynamics of Water Molecules in Supercooled States,” Phys. Rev. Lett. 76, 2730–2733 (1996).
- Sciortino et al. [1996] F. Sciortino, P. Gallo, P. Tartaglia, and S. H. Chen, “Supercooled water and the kinetic glass transition,” Phys. Rev. E 54, 6331–6343 (1996).
- Giovambattista et al. [2004] N. Giovambattista, M. G. Mazza, S. V. Buldyrev, F. W. Starr, and H. E. Stanley, “Dynamic Heterogeneities in Supercooled Water,” J. Phys. Chem. B 108, 6655–6662 (2004).
- Kawasaki and Kim [2017] T. Kawasaki and K. Kim, “Identifying time scales for violation/preservation of Stokes-Einstein relation in supercooled water,” Sci. Adv. 3, e1700399 (2017).
- Kawasaki and Kim [2019a] T. Kawasaki and K. Kim, “Spurious violation of the Stokes–Einstein–Debye relation in supercooled water,” Sci. Rep. 9, 8118 (2019a).
- Kawasaki and Kim [2019b] T. Kawasaki and K. Kim, “Classification of mobile- and immobile-molecule timescales for the Stokes–Einstein and Stokes–Einstein–Debye relations in supercooled water,” J. Stat. Mech. 2019, 084004 (2019b).
- Kikutsuji, Kim, and Matubayasi [2019b] T. Kikutsuji, K. Kim, and N. Matubayasi, “Diffusion dynamics of supercooled water modeled with the cage-jump motion and hydrogen-bond rearrangement,” J. Chem. Phys. 150, 204502 (2019b).
- Teboul and Kerasidou [2019] V. Teboul and A. P. Kerasidou, “Specific properties of supercooled water in light of water anomalies,” Mol. Simul. 45, 304–309 (2019).
- Saxton [1994] M. Saxton, “Anomalous diffusion due to obstacles: A Monte Carlo study,” Biophysical J. 66, 394–401 (1994).
- Bagchi [2005] B. Bagchi, “Water Dynamics in the Hydration Layer around Proteins and Micelles,” Chem. Rev. 105, 3197–3219 (2005).
- Sung and Yethiraj [2008] B. J. Sung and A. Yethiraj, “Lateral Diffusion of Proteins in the Plasma Membrane: Spatial Tessellation and Percolation Theory,” J. Phys. Chem. B 112, 143–149 (2008).
- Bellissent-Funel et al. [2016] M.-C. Bellissent-Funel, A. Hassanali, M. Havenith, R. Henchman, P. Pohl, F. Sterpone, D. van der Spoel, Y. Xu, and A. E. Garcia, “Water Determines the Structure and Dynamics of Proteins,” Chem. Rev. 116, 7673–7697 (2016).
- Chong and Ham [2016] S.-H. Chong and S. Ham, “Anomalous Dynamics of Water Confined in Protein–Protein and Protein–DNA Interfaces,” J. Phys. Chem. Lett. 7, 3967–3972 (2016).
- Tan et al. [2018] P. Tan, Y. Liang, Q. Xu, E. Mamontov, J. Li, X. Xing, and L. Hong, “Gradual Crossover from Subdiffusion to Normal Diffusion: A Many-Body Effect in Protein Surface Water,” Phys. Rev. Lett. 120, 248101 (2018).
- Xu and Berne [2001] H. Xu and B. J. Berne, “Hydrogen-Bond Kinetics in the Solvation Shell of a Polypeptide,” J. Phys. Chem. B 105, 11929–11932 (2001).
- Xu, Stern, and Berne [2002] H. Xu, H. A. Stern, and B. J. Berne, “Can Water Polarizability Be Ignored in Hydrogen Bond Kinetics?” J. Phys. Chem. B 106, 2054–2060 (2002).
- Mondal, Ghanta, and Bandyopadhyay [2022] S. Mondal, K. P. Ghanta, and S. Bandyopadhyay, “Dynamic Heterogeneity at the Interface of an Intrinsically Disordered Peptide,” J. Chem. Inf. Model. 62, 1942–1955 (2022).
Supplementary Material
Revealing the hidden dynamics of confined water in acrylate
polymers:
Insights from hydrogen-bond lifetime analysis
Kokoro Shikata,1 Takuma Kikutsuji,1 Nobuhiro Yasoshima,1,2 Kang Kim,1 and Nobuyuki Matubayasi1
1)Division of Chemical Engineering, Graduate School of Engineering Science, Osaka University, Osaka 560-8531, Japan 2)Department of Information and Computer Engineering, National Institute of Technology, Toyota College, 2-1 Eiseicho, Toyota, Aichi, 471-8525, Japan