supplement.pdf
Magnetoelectrocaloric effect of multiferroic
Abstract
We report an experimental demonstration of the magnetoelectrocaloric effect (MECE) in multiferroic . The temperature of the magnetic material changes when an external electric field is suddenly changed. MECE is the largest below the ordering temperature of Gd moments and modifiable by a magnetic field, suggesting that the ferroelectric transition affects MECE. The observed MECE shows a higher energy efficiency than typical magnetocaloric effects and adiabatic nuclear demagnetization. The present findings provide a proof of concept of MECE in multiferroics.
Various cooling methods based on magnetocaloric effect (MCE) and adiabatic nuclear demagnetization (AND) have been investigated due to increasing demand for highly energy-efficient cooling devices applicable to hydrogen liquefaction and quantum computers. While MCE and AND, exploiting entropy changes with the magnetic-field application and removal, are used in laboratories, the current-driven magnetic cooling methods have some disadvantages: the electric current to apply the magnetic field consumes energy; superconducting magnets are bulky; and shielding of the magnetic field is required in some cases. The magnetic refrigeration using permanent magnets needs additional maintenance for the mobile system and causes mechanical vibration and noise.
Recently, the multicaloric effect, more than one type of caloric effects simultaneously driven by a single external field (magnetic, electric, or stress), has attracted much attention [1, 2, 3]. A multicaloric effect termed magnetoelectrocaloric effect (MECE) is expected not only to enhance MCE and electrocaloric effect (ECE) but also to achieve high tunability since other external fields modify the phase transition temperature to optimize the caloric effect [3].
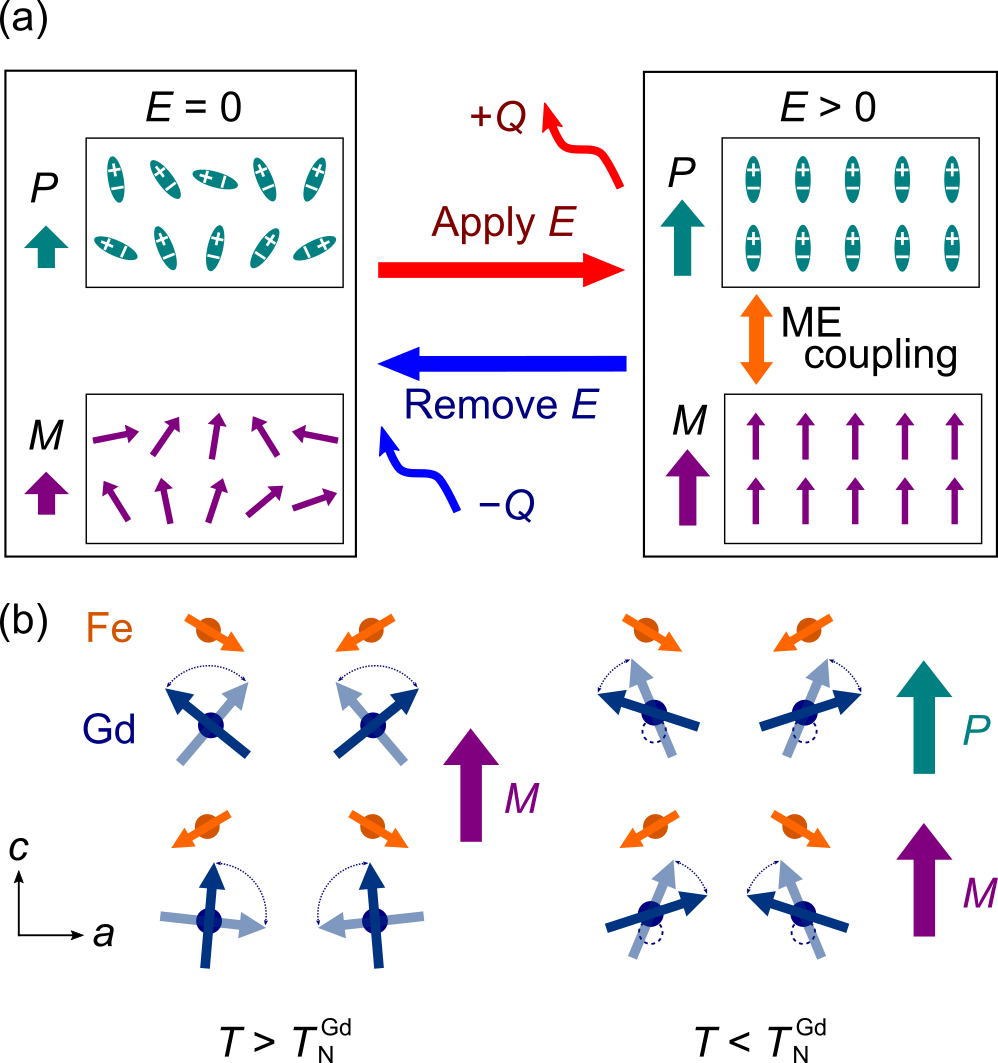
The MECE is anticipated in multiferroic materials, where the magnetism and electricity are strongly correlated. A schematic illustration of MECE in a multiferroic material with a term in the free energy is shown in Fig. 1(a). At zero field (left panel in Fig. 1(a)), the system is in a heavily fluctuating state. When an electric field is applied, the entropy of the electric dipole moments decreases since they are aligned. The magnetic entropy is also reduced through the ME coupling (right panel in Fig. 1(a)). The reduced entropy is transferred to the lattice system, resulting in a temperature rise in the adiabatic condition. With the removal of the electric field, the electric and magnetic dipole moments must regain the entropy from the lattice system.
Due to the strong ME coupling, MECE provides an opportunity to control the entropy in both electric and magnetic systems with an electric field. As no electric current is necessary, the energy dissipation due to Joule heating is expected to be smaller than that in MCE and AND. Despite some theoretical predictions [4, 5, 6, 7, 8], experimental direct measurements of the MECE have been scarcely reported. In this paper, we report an observation of MECE in a multiferroic .
is known to possess the controllability of magnetism and ferroelectric polarization by electric fields and magnetic fields , respectively [9]. Fe spins () are antiferromagnetically arranged below = 661 K [10] with tiny canting to induce weak magnetic moment along the axis in the setting (see the left panel of Fig. 1(b)) [11, 12]. Gd spins () with negligible anisotropy are antiferromagnetically arranged at = 2.5 K [13]. Canting of Gd spins contributes to , which is antiparallel to that induced by canted Fe spins. Below , symmetric exchange striction due to Gd-Fe interaction modifies the distance between these ions to generate polarization along the axis. The ferroelectric transition hence coincides with the antiferromagnetic transition of Gd spins. Most of the magnetic entropy of Gd spins is released around [14]. These features make a promising candidate for the observation of MECE.
A single crystal of was grown by the floating zone method in an oxygen atmosphere. The phase purity was confirmed by powder X-ray diffraction. The crystallographic orientation was determined by X-ray Laue photographs. The crystal rod was cut and polished to obtain smooth faces of (001) for the parallel-plate capacitor structure. The dimensions of the processed sample for measurements of MECE ( and ) were approximately () . Heat-treatment-type silver paste was deposited on both the large surfaces of the sample to form electrodes for the measurement of and . To measure - hysteresis loops and temperature dependence of in , and fields are applied along the and axes, respectively. was measured by a superconducting quantum interference device magnetometer (MPMS, Quantum Design) with a measurement probe capable of the application of an electric field with an electrometer (model 6517A, Keithley). was simultaneously measured using the Q mode of the electrometer. Heat capacity measurements were performed by using heat capacity option of a super conducting magnet PPMS, Quantum Design. The peak temperature of the specific heat in zero magnetic field suggested that of the crystal was 2.25 K.
For a direct measurement of MECE of in the adiabatic condition, we construct an experimental setup, as shown in Fig. 2(a), which was attached to the probe to load into a PPMS. The sample temperature was monitored every 50 ms by a temperature controller (model 340, Lake Shore Cryotronics) and a calibrated resistance thermometer (CX-1030-BR-HT, Lake Shore Cryotronics), which was thermally contacted to the sample by grease. Heat-bath temperature was also monitored with another thermometer on the heat bath. Lead wires made of manganin provided structural support for hanging the sample and the thermometer in vacuum. Gold films of 3000 Å thickness were sputtered on the both sides of the sample to apply an electric field parallel to the axis. The chamber atmosphere was evacuated to 1 Pa with a cryogenic pump in order to maintain the adiabatic condition of the sample. The relaxation of the sample temperature was dominated by the thermal conduction through the manganin wires. A magnetic field was applied along the axis. Each MECE measurement started after the sample was cooled from a temperature above with = 0.
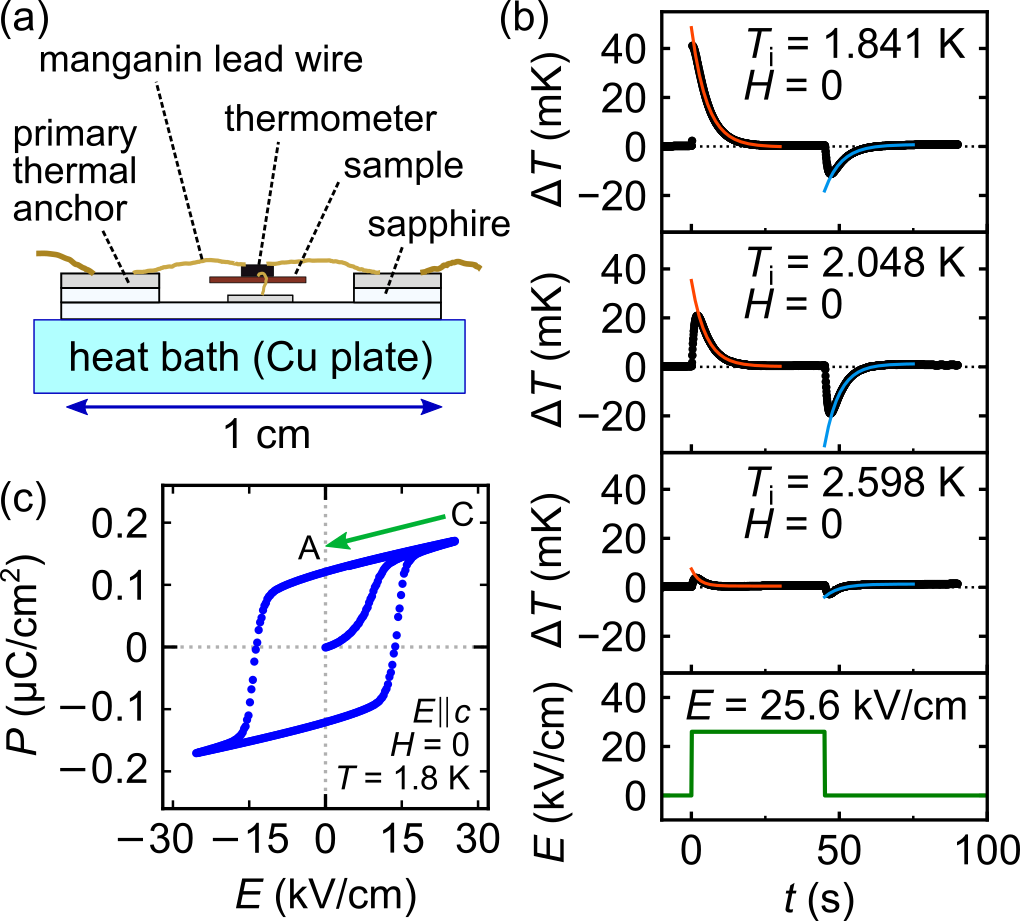
In Fig. 2(b), we present time dependence of temperature change of the sample at zero field for various initial temperatures (). We observe a sharp exothermic (endothermic) peak upon the application (removal) of , which is followed by an exponential relaxation to the initial temperature. The relaxation excludes the Joule heating effect. We confirm the identical temperature changes in the opposite electric field [15], which is consistent with the mechanism that the MECE is independent of the direction of . A negligible temperature change is observed for = 2.6 , indicating the Gd-spin origin of this MECE effect.
We note that the temperature increase in the exothermal process is larger than the magnitude of the temperature decrease in the endothermal process (see the top panel of Fig. 2(b), for example). This partly stems from the dissipation by the domain wall motion in the -application process.
To capture the -driven evolution of , we show an isothermal - loop at 1.8 K in Fig. 2(c). The maximum of the - hysteresis is the same as applied in the MECE measurement, which surpasses the coercive electric field (~13 kV/cm) to fully polarize the ferroelectric domain. The fully polarized state is maintained at = 0 after the removal of below (green arrow in Fig. 2(c)).
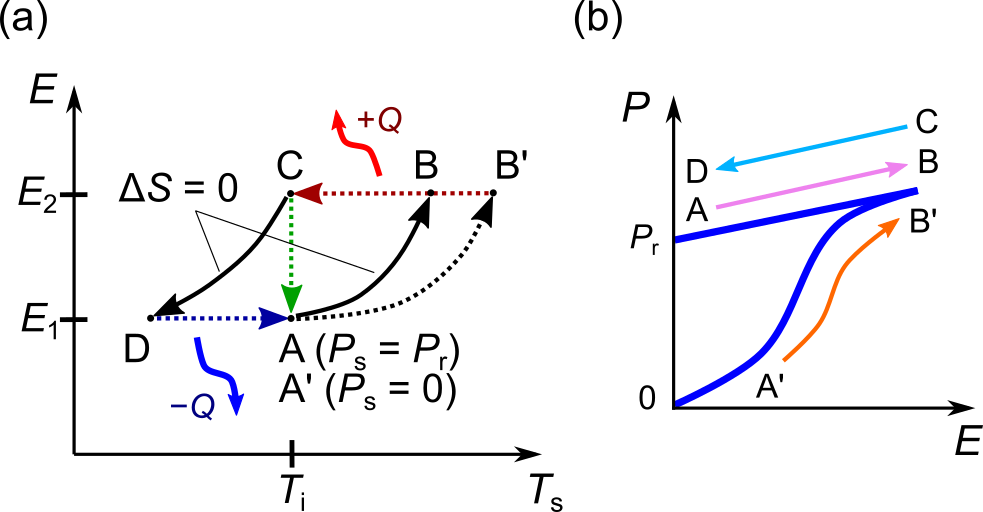
The heating and cooling of the sample through MECE can be described in the - diagram (Fig. 3(a)). Corresponding - curve in the adiabatic condition is also shown in Fig. 3(b). Arrows represent the -change process and following thermal relaxation process. In the ideal isentropic process, where the ferroelectric monodomain state is maintained, the temperature increase with the application of can be represented by path A-B. Path B-C represents the temperature relaxation to the heat bath temperature due to thermal conductance of manganin wires. C-D and D-A represent in the -removal process and the following temperature relaxation, respectively. When the initial state is not polarized due to multidomain cancellation of (state A’ in Fig. 3(a)), the additional heating in the -application process warms up the system to state B’.
The entropy change through MECE can be estimated directly from the temperature changes on path B-C (B’-C) and D-A as
| (1) |
where is the total heat capacity of the sample and thermometer at . To obtain the temperature change at states B, B’, and D, we extrapolate the temporal change by an exponential function to the moment of the -change, as shown in Fig. 2(b). In our experimental setup, the heat capacity of the thermometer is negligibly small compared to that of the sample [15]. We also estimate the entropy change on the isothermal path C-A (green line in Fig. 3(a)) by using Maxwell’s relations as
| (2) |
where () is the initial (final) value of the applied electric field, and is the volume. is calculated from the isothermal - loop at various temperatures (see Supplement).
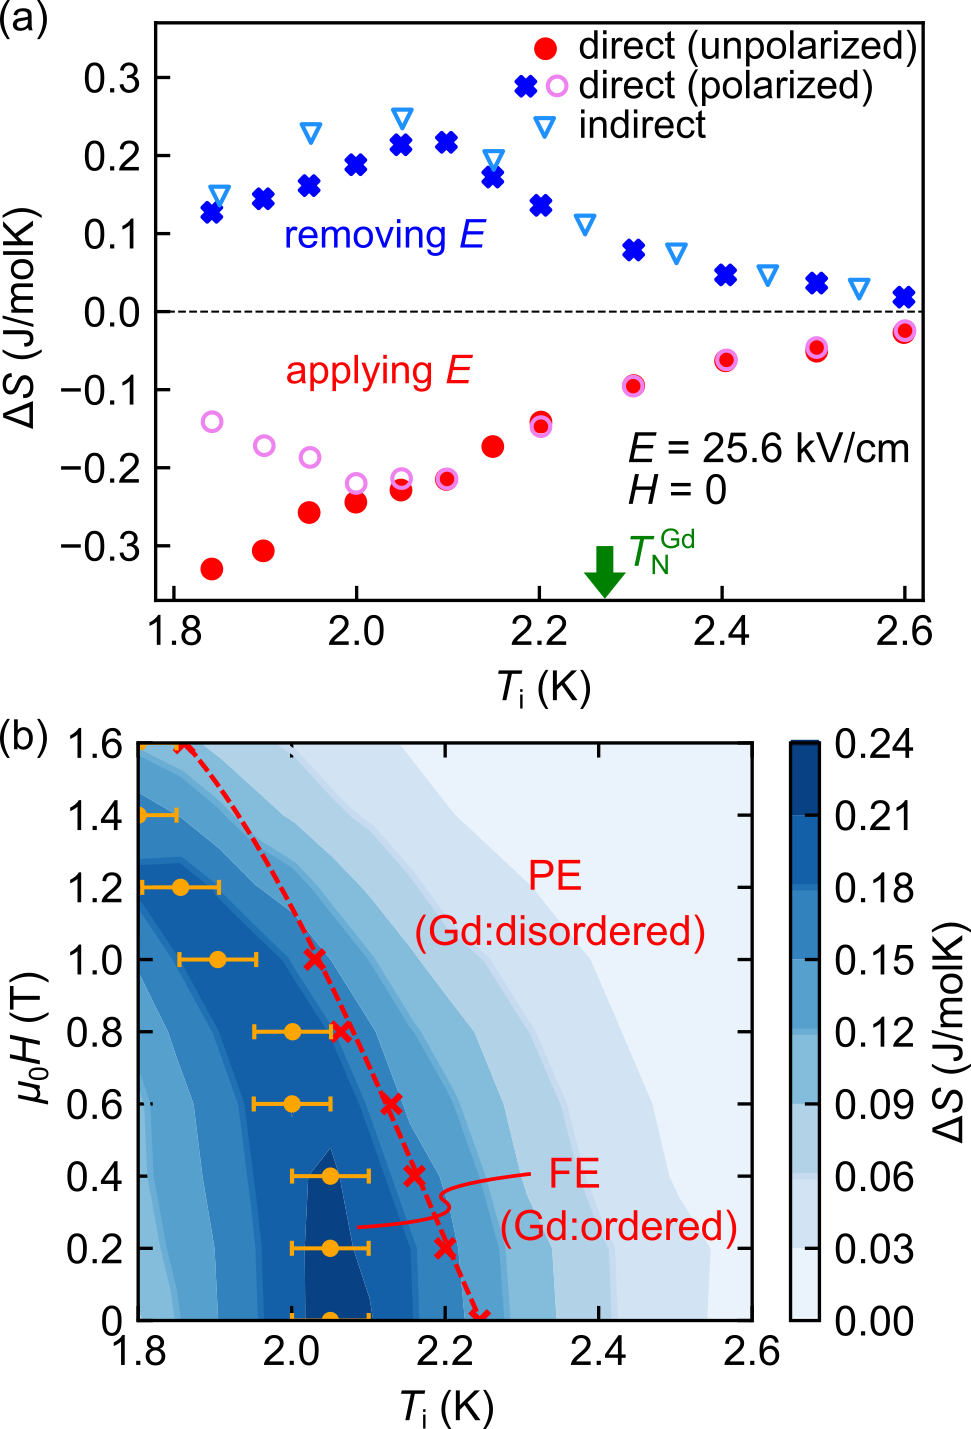
Figure 4(a) summarizes the estimated entropy changes. Significant entropy changes are observed below , suggesting that the entropy change originates from the ordering of Gd spins. For the endothermal processes, both estimations show a good agreement with each other, indicating that the isentropic condition (path D-A) is well satisfied. Temperature dependence of the decrease in entropy with the application of an electric field along the light red arrow in Fig. 3(b) after the sample is polarized with = 25.6 kV/cm (light red open circles in Fig. 4(a)), is nearly consistent with the increase in entropy with the removal of (blue crosses), which also suggests that the entropy change arises from MECE. This is because both paths A-B and C-D go through the same path in the adiabatic - hysteresis (Fig. 3(b)).
in the -removal process becomes the largest at = 2.05 K. The reduction of S below the temperature is consistent with a prediction that should be zero at the absolute zero temperature because spins have no kinetic energy. It presumably explains the deviation of the entropy decrease (red circle in Fig. 4(a)) in the -application at the lowest temperature, = 1.85 K.
There is a gap between on path A-B and on path A’-B’ in the -application process in Fig. 4(a). The additional heating when starting from the unpolarized state is owing to the electric work for domain reversal [15]. The discrepancy between the two cases appears below 2 K and increases as the temperature is lowered, which qualitatively agrees with the estimated work by . Besides, the entropy change is independent of the domain state of Fe spins [15]. This result shows that it is enough to discuss the ferroelectric domain and magnetic domain of Gd moments since the domain and the domain simultaneously change under the fixed phase (0 or ) of staggered alignment of Fe moments [9]. In the context of MCE (ECE), domain rotation and magnetic (electric) domain walls are reported to contribute to heating and cooling [16, 17, 18, 19, 20, 21, 22, 23].
We observe a large MECE in the ferroelectric (FE) phase, where Gd spins are ordered, in the - phase diagram (Fig. 4(b)). MECE is reduced in the paraelectric (PE) phase. The temperature where MECE is maximized decreases as a larger magnetic field is applied, in accord with the reduction of the FE transition temperature determined by the specific heat measurement [15]. We do not observe any apparent anomalies associated with the spin flop transition where both Gd and Fe spins rotate by 90 degrees at 0.5 T [9] (see SI Fig. S12).
Temperature dependence of magnetization in electric fields (SI Fig. S8) suggests that an electric field enhances antiferromagnetic ordering of Gd moments only below the ferroelectric transition temperature [15]. Altogether, the electric field does not switch the disordered state (Fig. 1(b) left) to the ordered state (Fig. 1(b) right) but does suppress spin fluctuation in the ordered state. This interpretation is consistent with the results that the MECE peaks at a lower temperature than the ferroelectric phase boundary and that much smaller MECE is observed in the paraelectric phase (Fig. 4(b)). Besides, the peak of MECE shifts to a lower temperature along the PE-FE phase boundary as the applied magnetic field increases, demonstrating that a magnetic field expands the operating temperature of MECE. By applying the optimum magnetic field for the refrigerant temperature, we can exploit the cooling effect for a wider range of temperature. The expansive operating temperature is desired for an effective Ericsson refrigeration cycle [24].
| Refrigeration mechanisms | Materials [Ref.] | (K) | (kV/cm) | (T) | () | (%) |
|---|---|---|---|---|---|---|
| MECE | [This work] | 2 | 25.6 | 0.012 | 1270 | |
| MCE | [14] | 5 | 2 | 0.28 | 14 | |
| MCE | [26] | 5 | 2 | 0.03 | 1.2 | |
| MCE | [27] | 5 | 2 | 0.25 | 11 | |
| MCE | [28] | 294 | 2 | 12.7 | 580 | |
| AND | [25, 29] | 0.02 | 5.5 |
Table 1 compares MECE in with MCE and adiabatic nuclear demagnetization (AND) of several rare-earth compounds. For evaluation of the different refrigeration mechanisms, we calculate energy-efficiency [30], where is removed heat per unit volume and is work done to apply or remove the electric/magnetic field. or , where is the unit volume of the sample. value of MECE is obtained by the direct measurement, while those of MCE and AND are estimated based on the previous literature reporting the temperature dependence of the heat capacity in a magnetic field and zero field. MECE shows a larger than MCE and AND do despite smaller . One must note that materials showing small s sometimes show higher efficiency [30]. Nevertheless, the present result implies that MECE is potentially applicable to energy-efficient cooling devices. The electric-field-driven entropy change may enable a higher-frequency refrigeration cycle than the magnetic-field driven cases, possibly compensating for small . In addition, an electric field can be applied locally to refrigerants. This may offer an advantage for local cooling.
In conclusion, we successfully demonstrated the MECE of multiferroic in the experimental direct method. MECE shows a peak just below the ferroelectric transition temperature where an electric field suppresses the fluctuation of Gd moments. A magnetic field modulates the temperature at which MECE is maximized. The comparison between MECE, MCE, and AND reveals a high energy efficiency of MECE. Our research provides new insights to investigate new low energy-cost refrigeration techniques by using multicaloric effects.
T. K. was financially supported by MEXT Leading Initiative for Excellent Young Researchers (JPMXS0320200135), JSPS KAKENHI Grant-in-Aid for Young Scientists B (No. 21K13874). This work was partly supported by JSPS KAKENHI Grant-in-Aid for Scientific Research on Innovative Areas ”Quantum Liquid Crystals” (No. JP19H05826) and No. 19H01835. Measurements of X-ray Laue photographs, , MECE were performed utilizing facilities of the Institute for Solid State Physics, the University of Tokyo. The measurement of heat capacity was carried out at the Cryogenic Research Center, the University of Tokyo.
References
- Starkov and Starkov [2014] A. S. Starkov and I. A. Starkov, Multicaloric effect in a solid: New aspects, Journal of Experimental and Theoretical Physics 119, 258 (2014).
- Lu et al. [2010] S. G. Lu, Z. Fang, E. Furman, Y. Wang, Q. M. Zhang, Y. Mudryk, K. A. Gschneidner, V. K. Pecharsky, and C. W. Nan, Thermally mediated multiferroic composites for the magnetoelectric materials, Applied Physics Letters 96, 102902 (2010).
- Moya et al. [2014] X. Moya, S. Kar-Narayan, and N. D. Mathur, Caloric materials near ferroic phase transitions, Nature Materials 13, 439 (2014).
- Edström and Ederer [2020] A. Edström and C. Ederer, Prediction of a giant magnetoelectric cross-caloric effect around a tetracritical point in multiferroic , Phys. Rev. Lett. 124, 167201 (2020).
- Cazorla and Íñiguez [2018] C. Cazorla and J. Íñiguez, Giant direct and inverse electrocaloric effects in multiferroic thin films, Phys. Rev. B 98, 174105 (2018).
- Vopson [2012] M. M. Vopson, The multicaloric effect in multiferroic materials, Solid State Communications 152, 2067 (2012).
- Takeuchi and Sandeman [2015] I. Takeuchi and K. Sandeman, Solid-state cooling with caloric materials, Physics Today 68, 48 (2015).
- Stern-Taulats et al. [2018] E. Stern-Taulats, T. Castán, L. Mañosa, A. Planes, N. D. Mathur, and X. Moya, Multicaloric materials and effects, MRS Bulletin 43, 295 (2018).
- Tokunaga et al. [2009] Y. Tokunaga, N. Furukawa, H. Sakai, Y. Taguchi, T.-h. Arima, and Y. Tokura, Composite domain walls in a multiferroic perovskite ferrite, Nature Materials 8, 558 (2009).
- Treves [1965] D. Treves, Studies on orthoferrites at the weizmann institute of science, Journal of Applied Physics 36, 1033 (1965).
- Dzyaloshinsky [1958] I. Dzyaloshinsky, A thermodynamic theory of “weak” ferromagnetism of antiferromagnetics, Journal of Physics and Chemistry of Solids 4, 241 (1958).
- Moriya [1960] T. Moriya, Anisotropic superexchange interaction and weak ferromagnetism, Phys. Rev. 120, 91 (1960).
- Ges et al. [1987] A. Ges, V. Doroshev, N. Kovtun, G. Troitskij, V. Fedotova, and V. Khmara, study of the ordening of the gadolinium subsystem in , Fizika Tverdogo Tela 29, 3436 (1987).
- Das et al. [2017] M. Das, S. Roy, and P. Mandal, Giant reversible magnetocaloric effect in a multiferroic single crystal, Phys. Rev. B 96, 174405 (2017).
- [15] See Supplemental Material at [URL] for details.
- F.R.S. and Rhodes [1949] E. S. F.R.S. and P. Rhodes, Xlv. magneto-thermal effects in ferromagnetics, The London, Edinburgh, and Dublin Philosophical Magazine and Journal of Science 40, 481 (1949).
- Amaral and Amaral [2010] J. Amaral and V. Amaral, On estimating the magnetocaloric effect from magnetization measurements, Journal of Magnetism and Magnetic Materials 322, 1552 (2010), proceedings of the Joint European Magnetic Symposia.
- Samanta and Das [2006] T. Samanta and I. Das, Negligible influence of domain walls on the magnetocaloric effect in , Phys. Rev. B 74, 132405 (2006).
- Karthik and Martin [2011] J. Karthik and L. W. Martin, Effect of domain walls on the electrocaloric properties of thin films, Applied Physics Letters 99, 032904 (2011).
- Ma et al. [2015] Y.-B. Ma, K. Albe, and B.-X. Xu, Lattice-based monte carlo simulations of the electrocaloric effect in ferroelectrics and relaxor ferroelectrics, Phys. Rev. B 91, 184108 (2015).
- Pandya et al. [2019] S. Pandya, G. A. Velarde, R. Gao, A. S. Everhardt, J. D. Wilbur, R. Xu, J. T. Maher, J. C. Agar, C. Dames, and L. W. Martin, Understanding the role of ferroelastic domains on the pyroelectric and electrocaloric effects in ferroelectric thin films, Advanced Materials 31, 1803312 (2019).
- Wang et al. [2014] J. Wang, M. Liu, Y. Zhang, T. Shimada, S.-Q. Shi, and T. Kitamura, Large electrocaloric effect induced by the multi-domain to mono-domain transition in ferroelectrics, Journal of Applied Physics 115, 164102 (2014).
- Li et al. [2013] B. Li, J. B. Wang, X. L. Zhong, F. Wang, B. L. Liu, and Y. C. Zhou, Domain wall contribution to the electrocaloric effect in nanoparticle: a phase-field investigation, Journal of Nanoparticle Research 15, 1427 (2013).
- Chaturvedi et al. [2011] A. Chaturvedi, S. Stefanoski, M.-H. Phan, G. S. Nolas, and H. Srikanth, Table-like magnetocaloric effect and enhanced refrigerant capacity in composite materials, Applied Physics Letters 99, 162513 (2011).
- Ôno et al. [1980] K. Ôno, S. Kobayasi, M. Shinohara, K. Asahi, H. Ishimoto, N. Nishida, M. Imaizumi, A. Nakaizumi, J. Ray, Y. Iseki, S. Takayanagi, K. Terui, and T. Sugawara, Two-stage nuclear demagnetization refrigerator, Journal of Low Temperature Physics 38, 737 (1980).
- Midya et al. [2011] A. Midya, S. N. Das, P. Mandal, S. Pandya, and V. Ganesan, Anisotropic magnetic properties and giant magnetocaloric effect in antiferromagnetic crystals (, , , and ), Phys. Rev. B 84, 235127 (2011).
- Dey et al. [2017] K. Dey, A. Indra, S. Majumdar, and S. Giri, Cryogenic magnetocaloric effect in zircon-type (, , , and ), J. Mater. Chem. C 5, 1646 (2017).
- Dan’kov et al. [1998] S. Y. Dan’kov, A. M. Tishin, V. K. Pecharsky, and K. A. Gschneidner, Magnetic phase transitions and the magnetothermal properties of gadolinium, Phys. Rev. B 57, 3478 (1998).
- Andres and Bucher [1972] K. Andres and E. Bucher, Nuclear cooling in , Journal of Low Temperature Physics 9, 267 (1972).
- Moya et al. [2015] X. Moya, E. Defay, V. Heine, and N. D. Mathur, Too cool to work, Nature Physics 11, 202 (2015).