11email: leemker@strw.leidenuniv.nl 22institutetext: Max-Planck-Institut für Extraterrestrische Physik, Giessenbachstrasse 1, 85748 Garching, Germany 33institutetext: Université Paris-Saclay, CNRS, Institut d’Astrophysique Spatiale, 91405 Orsay, France 44institutetext: Physics Institute, Space Research and Planetary Sciences, University of Bern, Sidlerstrasse 5, CH-3012 Bern, Switzerland 55institutetext: Anton Pannekoek Institute for Astronomy, University of Amsterdam, Science Park 904, 1090 GE Amsterdam, The Netherlands
A major asymmetric ice trap in a planet-forming disk
Abstract
Context. Most well-resolved disks observed with ALMA show signs of dust traps. These dust traps set the chemical composition of the planet forming material in these disks, as the dust grains with their icy mantles are trapped at specific radii and could deplete the gas and dust at smaller radii of volatiles.
Aims. In this work we analyse the first detection of nitric oxide (NO) in a protoplanetary disk. We aim to constrain the nitrogen chemistry and the gas-phase C/O ratio in the highly asymmetric dust trap in the Oph-IRS 48 disk.
Methods. We use ALMA observations of NO, CN, \ceC2H, and related molecules in the Oph-IRS 48 disk. We model the effect of the increased dust-to-gas ratio in the dust trap on the physical and chemical structure using a dedicated nitrogen chemistry network in the thermochemical code DALI. Furthermore, we explore how ice sublimation contributes to the observed emission lines. Finally, we use the model to put constraints on the nitrogen containing ices.
Results. NO is only observed at the location of the dust trap but CN and \ceC2H are not detected in the Oph-IRS 48 disk. This results in an CN/NO column density ratio of and thus a low C/O ratio at the location of the dust trap. Models show that the dust trap cools the disk midplane down to 30 K, just above the NO sublimation temperature of 25 K. The main gas-phase formation pathways to NO though OH and NH in the fiducial model predict NO emission that is an order of magnitude lower than is observed. The gaseous NO column density can be increased by factors ranging from 2.8 to 10 when the \ceH2O and \ceNH3 gas abundances are significantly boosted by ice sublimation. However, these models are inconsistent with the upper limits on the \ceH2O and OH column densities derived from Herschel PACS observations and the upper limit on CN derived from ALMA observations. As the models require an additional source of NO to explain its detection, the NO seen in the observations is likely the photodissociation product of a larger molecule sublimating from the ices. The non-detection of CN provides a tighter constraint on the disk C/O ratio than the \ceC2H upper limit.
Conclusions. We propose that the NO emission in the Oph-IRS 48 disk is closely related to the nitrogen containing ices sublimating in the dust trap. The non-detection of CN constrains the C/O ratio both inside and outside the dust trap to be if all nitrogen initially starts as \ceN2 and , consistent with the Solar value, if (part of) the nitrogen initially starts as N or \ceNH3.
Key Words.:
astrochemistry – protoplanetary disks – ISM: molecules – submillimeter: planetary systems – stars: individual: Oph-IRS 481 Introduction
Almost all bright and well-resolved disks observed with ALMA show dust traps seen as rings or cavities possibly generated by forming planets in the disk (e.g., van der Marel et al., 2016; Huang et al., 2018; Long et al., 2018; Andrews, 2020). These dust traps are the result of a local maximum in the gas pressure, causing the dust to drift to these regions (Whipple, 1972; Pinilla et al., 2012). These pressure maxima can be caused by planet but also by e.g. dead zones, magnetic fields, gravitational instability, Rossby wave instability, or snowlines (e.g., Stevenson & Lunine, 1988; Boss, 1997; Paardekooper & Mellema, 2006; Rice et al., 2006; Regály et al., 2012; Zhu et al., 2012; Meheut et al., 2013; Alexander et al., 2014; Suzuki et al., 2016; Stammler et al., 2017). Once dust traps are formed, trapped dust pebbles may continue to grow to planetesimals, comets, and planets.
These dust traps can affect the global chemical composition of the planet forming material, as the dust grains beyond the major snowlines are covered in icy mantles (McClure et al., 2020). Therefore, they trap ices at specific radii in the disk making the dust traps act as ice traps. The freeze-out and desorption of the major volatiles, \ceH2O, \ceNH3, and CO, at their respective snowlines changes the chemical composition of the gas and dust (e.g., Öberg et al., 2011; Pinilla et al., 2017; Öberg & Bergin, 2021; van der Marel et al., 2021b). Inside the water snowline in a smooth disk, the C/O ratio of the gas is expected to be close to the stellar value as all major volatiles are in the gas-phase, whereas outside the \ceCO2 or CO snowlines, the C/O ratio in the gas is higher because oxygen is locked up in the icy mantles. Similarly, the C/O ratio of the ices changes across the snowlines and is expected to be low compared to the gas. However, if a dust trap is present in the disk, this C/O ratio may change as a result of transport of icy pebbles. One extreme example of such a dust trap is the Oph-IRS 48 disk, hereafter the IRS 48 disk, making it a unique laboratory to study icy chemistry in disks.
The relative volatile carbon to oxygen budget in disks can be traced by the emission of [C I], [O I] observed by the PACS instrument on Herschel (Thi et al., 2010; Fedele et al., 2013; Howard et al., 2013), and \ceC2H as these carbon species only become bright when the C/O ratio exceeds unity (Bergin et al., 2016; Kama et al., 2016; Bergner et al., 2019; Miotello et al., 2019; Bosman et al., 2021; Guzmán et al., 2021). Other tracers of the C/O ratio are the ratio of CS to SO (Dutrey et al., 2011; Semenov et al., 2018; Facchini et al., 2021; Booth et al., 2021; Le Gal et al., 2021) and the less explored CN to NO ratio (e.g., Hily-Blant et al., 2010; Daranlot et al., 2012; Le Gal et al., 2014). The commonly observed CN radical is destroyed by atomic oxygen (Cazzoletti et al., 2018), whereas NO is enhanced if the gas is oxygen-rich because it is mainly formed through the reaction
| (1) |
(Millar et al., 1991). NO is destroyed by photodissociation and the reaction
| (2) |
Therefore, NO is expected to be bright when the gas-phase C/O ratio is low (Schwarz & Bergin, 2014).
Ices, which have a low C/O ratio, are nitrogen poor as % of the total available nitrogen is not identified in ices and could thus be in the form of gas-phase N or \ceN2 (Öberg et al., 2011; Boogert et al., 2015). The main carrier of nitrogen is \ceNH3, which typically has an abundance of only 5% compared to \ceH2O (Boogert et al., 2015). Other nitrogen bearing ices seen in the comet 67P are HCN (21% w.r.t. \ceNH3), \ceN2 (13%) and HNCO, \ceNH2CHO, and \ceCH3CN (all %), and ammonia salts (Rubin et al., 2019; Altwegg et al., 2020, 2022).
An extreme example of an asymmetric dust trap is the IRS 48 dust disk (van der Marel et al., 2013). The large mm-sized dust is concentrated in an arc in the south of this disk, possibly due to a vortex generated by a massive companion. Recent work has shown many complex organic molecules (COMs) such as \ceCH3OH and \ceCH3OCH3 but also smaller species like SO and, for the first time in a disk, \ceSO2 and NO, are seen in the gas-phase at the location of the dust trap (van der Marel et al. 2021a, hereafter Paper I, Booth et al. 2021, hereafter Paper II; Brunken et al. 2022, hereafter Paper II). The excitation temperature of \ceCH3OH and \ceH2CO of 100-200 K indicates that these molecules are thermally sublimated just inside the water snowline (Paper I and II). Furthermore, the detections of SO and \ceSO2 and the non-detection of CS point to a low C/O ratio of (Booth et al., 2021). Therefore, the dust trap is an ice trap, making this disk a unique laboratory to study the ice content in this disk. The snowlines of these COMs are most likely at the dust cavity edge that is heated by stellar radiation. The detection of NO further points to the presence of nitrogen bearing ices on the dust.
ALMA dust polarization observations together with VLA data show that the dust surface density in the IRS 48 dust trap is very high at g cm -2 (Ohashi et al., 2020). Together with the low gas surface density of 0.07 g cm -2 at this location (van der Marel et al., 2016), the local gas-to-dust ratio in this disk region is instead of the nominal gas-to-dust ratio of 100 in the ISM. In contrast to the large mm-sized grains, the small micron-sized dust and the gas traced by CO isotopologs are seen throughout the full 360 of the disk (e.g., Geers et al., 2007; van der Marel et al., 2013; Bruderer et al., 2014; van der Marel et al., 2016). Modelling of these CO isotopologue observations have constrained the IRS 48 disk mass to be as low as M⊙ (van der Marel et al., 2016) with an inclination of 50 and a position angle of 100 (Bruderer et al., 2014) based on \ce^12CO observations.
IRS 48 is likely is an A type star with a stellar luminosity of 14.3 L⊙ using a dereddening slope of (Brown et al., 2012; Follette et al., 2015). The high visual extinction of makes a precise measurement uncertain. Schworer et al. (2017) inferred a 3 times higher stellar luminosity as more flux was attributed to the star instead of a AU inner disk, and a higher visual extinction of together with a dereddening slope of were used. Given the high extinction and for consistency with previous work modelling the IRS 48 disk, we use a stellar luminosity of 14.3 L⊙. The star is located in the Ophiuchus star forming cloud at a distance of 135 pc (Gaia Collaboration et al., 2018).
In this paper we analyse the impact of the dust trap on the chemistry in the IRS 48 disk and in particular focus on the detection of NO. To complement this we search for other carbon and nitrogen bearing species and combine these with upper limits on OH, \ceH2O, CN, \ceC2H, \ceN2O, \ceNO2, and \ceNH2OH in Sect. 2. We model the molecular abundances using a thermochemical model where we explore different scenarios in Sect. 4. Finally, the observational and modelling results are discussed in Sect 5, and the conclusions are summarized in Sect. 6.
| Molecule | Transition(a) | (s-1) | (K) | Frequency (GHz) | Int. flux(b) (mJy km s-1) | Channel width (km s-1) | Channel rms (mJy beam-1) | Beam | Ref. |
|---|---|---|---|---|---|---|---|---|---|
| NO(b) | 36 | 350.689 | \ceCH3OH blend | 1.7 | (1) | ||||
| NO(b) | 36 | 350.691 | \ceCH3OH blend | 1.7 | (1) | ||||
| NO(b) | 36 | 350.695 | \ceCH3OH blend | 1.7 | (1) | ||||
| NO(c) | 36 | 351.044 | 31 | 1.7 | (1) | ||||
| NO(c) | 36 | 351.052 | 23 | 1.7 | (1) | ||||
| NO(c) | 36 | 351.052 | 16 | 1.7 | (1) | ||||
| \ceN2O | 127 | 351.668 | 1.7 | (2) | |||||
| \ceNO2(d) | 29 | 348.821 | 1.7 | (2) | |||||
| \ceNH2OH(d) | 76 | 352.298 | 1.7 | (2) | |||||
| CN(e) | 33 | 340.248 | 1.0 | 1.8 | (3) | ||||
| CN(e) | 33 | 340.248 | 1.0 | 1.8 | (3) | ||||
| CN(e) | 33 | 340.249 | 1.0 | 1.8 | (3) | ||||
| \ceC2H(f) | 42 | 349.338 | 1.7 | 1.0 | (4) | ||||
| \ceC2H(f) | 42 | 349.339 | 1.7 | 1.0 | (4) | ||||
| \ce^13CO | 11 | 330.588 | 0.5 | 2.2 | (3) | ||||
| cont.(g) | 0.89 mm | 336 | 0.18 | 0.056 | (3) |
-
•
Notes. (a) Quantum numbers are formatted for NO as and line strengths taken from CDMS and Varberg et al. 1999, \ceNH2OH as (CDMS, Tsunekawa, 1972), \ceN2O as (JPL, Burrus & Gordy, 1956), \ceNO2 as (JPL, Bowman & de Lucia, 1982; Semmoud-Monnanteuil et al., 1989), CN as (CDMS, Skatrud et al., 1983), \ceC2H as (CDMS, Sastry et al., 1981), and \ce^13CO as (CDMS Klapper et al., 2000). (b) Disk integrated flux within the Keplerian mask. Blended lines are corrected for their expected line strength by scaling the total integrated flux with neglecting the dependence on , unless denoted otherwise. (b). Detected but blended with the two other NO lines at 350.7 GHz and a methanol line. (c) Blended with the two other NO lines at GHz. (d) Only the line that is expected to be brightest is listed. This line is blended with two weak 266 K line, that are neglected for the calculation of the integrated flux. (e) Blended with another CN line at 340.2 GHz. (f) Blended with another \ceC2H line at 349.3 GHz. (g) Unit of the integrated continuum flux is Jy.
-
•
References (1) ALMA project code: 2017.1.00834.S (Paper II). (2) ALMA project code: 2017.1.00834.S (this work). (3) ALMA project code: 2013.1.00100.S (this work). (4) ALMA project code: 2017.1.00834.S (van der Marel et al., 2021b).
2 Observations and methods
2.1 Data
We use ALMA observations covering transitions of \ce^13CO, NO, \ceN2O, \ceNO2, \ceNH2OH, CN, and \ceC2H. Only \ce^13CO and NO are detected. A summary of the transitions covered with ALMA, details of the observations, and an overview of the line strengths obtained from the CDMS and JPL databases is presented in Table 1 (Pickett et al., 1998; Müller et al., 2001, 2005; Endres et al., 2016).
Six emission lines of NO with upper energy levels of 36 K at 350.7 GHz (3 lines), 351.04 GHz (1 line), and 351.05 GHz (2 lines) were observed as part of the ALMA project 2017.1.00834.S (PI: A. Pohl; see Table 1; Ohashi et al. 2020). Additionally, the data cover transitions of \ceN2O, \ceNO2, and \ceNH2OH. This data set has a sensitivity of 1.2 mJy beam-1 channel-1 and a spectral resolution of 1.7 km s-1. The imaging is described in detail in Paper I and II.
The CN , , and transitions with K at 340.248 GHz (2 lines) and 340.249 GHz (1 line), and \ce^13CO transition with K at 330.588 GHz in Band 7 have not been published before. These two molecules were targeted as part of the ALMA program 2013.1.00100.S (PI: N. van der Marel). The IRS 48 disk was observed on June 14 2015 for 27 minutes on-source with 41 antennas and baselines ranging from 21.4 m to 783.5 m. The spectral windows covering the CN and the \ce^13CO transitions have a resolution of 282.23 kHz (0.25 km s-1). Both were self-calibrated using CASA version 4.2.2 (McMullin et al., 2007) with 4 rounds of phase calibration down to a solution interval of 24 s and subsequently 1 round of amplitude calibration with a solution interval of 48 s. This increased the signal-to-noise ratio on the continuum from 217 to 804. The continuum and the \ce^13CO are both detected and were imaged using the clean function in casa with used-defined masks and Briggs weighing with robust . The images were cleaned to a noise threshold of 3 the rms that was measured in the line-free channels. The CN emission is imaged using natural weighing (equivalent to robust = 2.0) to maximize the sensitivity but it is not detected. Furthermore, the CN data were binned to 1 km s-1 and the \ce^13CO to 0.5 km s-1 bins. The resulting 0.89 mm continuum image has a spatial resolution of with the position angle of the beam indicated within the brackets, and a sensitivity of Jy beam-1. The \ce^13CO and CN images have a spatial resolution of and and a sensitivity of 2.2 mJy beam-1 and 1.8 mJy beam-1, respectively.
In addition to the ALMA observations, we also use the observations of the IRS 48 disk in the Herschel PACS DIGIT survey (Fedele et al., 2013). These observations cover \ceH2O and OH far infrared lines in the spectral range of m, but neither of these molecules is detected, with \ceH2O fluxes lower than W m-2 and OH fluxes lower than W m-2. A full description of the data reduction is reported in Fedele et al. (2013). As the spaxels of the Herschel PACS data are much larger than the IRS 48 disk, only a disk integrated analysis is done using these \ceH2O and OH data.
2.2 Data analysis
To increase the signal to noise ratio of the NO and \ce^13CO integrated intensity (moment 0) maps, as well as that of the ALMA data covering the lines that are not detected, we use a Keplerian mask (Teague, 2020)111https://github.com/richteague/keplerian_mask. The mask for each line is created using a stellar mass of 2 M⊙, an position angle of 100, an inclination of 50, a distance of 135 pc, and a source velocity of 4.55 km s-1 (Bruderer et al., 2014). Furthermore, the mask for the moment 0 maps has a large maximum radius of to avoid any loss of diffuse emission in the outer disk. Additionally, the mask is smoothed with a beam 1.5 times larger than the spatial resolution of the data and assumes all emission is coming from the disk midplane. Finally, the line width in the mask is calculated as to encompass both the \ce^13CO (presented in this work) and the previously published line (van der Marel et al., 2016). For the uncertainty on the integrated fluxes, a Keplerian mask with a smaller outer radius of , fitting the \ce^13CO and transitions, is used. This ensures that we include all pixels that could have emission but as few of those without as possible. Furthermore, in the case of the blended NO lines at 351.05 GHz, we use the union of two Keplerian masks centred at the frequencies of the NO lines at 351.043 GHz and 351.051 GHz.
The error on the integrated intensity maps are calculated using the channel rms :
| (3) |
with the spectral resolution of the image cube in km s-1 and the number of channels in the Keplerian mask in that pixel. To increase the signal to noise ratio of the radial profile, the average over an 100 wedge is taken, following van der Marel et al. (2021a). This wedge is centred an position angle of 192°, close to the disk minor axis in the south to encompass the emission of the dust, NO, \ce^13CO, and \ceCH3OH. The error on this radial profile is propagated from that on the integrated intensity map:
| (4) |
with the number of independent beams in 1 radial bin within the wedge, and the number of pixels used in that bin. For the azimuthal profile, the same equation is used but then with the number of beams and pixels in 1 azimuthal bin in a ring.
The error on the integrated flux, , and the upper limits on the integrated fluxes of the non-detections are calculated as follows:
| (5) |
for an extended region, and as follows:
| (6) |
for the spectra within 1 beam. The factor of 1.1 accounts for the 10% absolute flux calibration error of ALMA which is necessary to include when comparing data from different observing projects, is the total number of pixels included in the Keplerian mask and is the number of pixels per beam. For the data used in this work . In the case of a non-detection, a 3 upper limit is used.
| Molecule | (K) | (cm-2) | (cm-2) |
|---|---|---|---|
| NO (north) | 40 | ||
| NO (north) | 100 | ||
| NO (south) | 40 | ||
| NO (south) | 100 | ||
| \ceN2O | 40 | ||
| \ceN2O | 100 | ||
| \ceNO2 | 40 | ||
| \ceNO2 | 100 | ||
| \ceNH2OH | 40 | ||
| \ceNH2OH | 100 | ||
| CN | 40 | ||
| CN | 100 | ||
| \ceC2H | 40 | ||
| \ceC2H | 100 | ||
| OH | no constraint | ||
| OH | 150 | ||
| OH | |||
| \ceH2O | no constraint | ||
| \ceH2O | 150 | ||
| \ceH2O |
-
•
Notes. The upper limits on the column densities of \ceN2O, \ceNH2OH, \ceOH, and \ceH2O derived in the extended region covered by the Keplerian mask are derived assuming an emitting region of sr, similar to NO. This is because these species are expected to be closely related to the emitting region of NO. The emitting regions of CN and \ceC2H are assumed to be sr (3.4 square arcseconds) and sr (7.0 square arcseconds), respectively, using the area covered in the Keplerian mask. The peak column densities are derived using a spectrum within 1 beam at the location where the emission is brightest.
2.3 Column densities
To compare our observations to other disks and disk models, we convert the (upper limits on) the velocity integrated fluxes to a column density following e.g., Goldsmith & Langer (1999):
| (7) |
with the column density of the upper energy level , the integrated flux, the Einstein coefficient, the speed of light, the Planck constant and the emitting region. The column density of the upper level is set by the total column density, , of the molecule assuming local thermodynamical equilibrium (LTE) and optically thin emission. The total column density then follows from
| (8) |
with the partition function at excitation temperature , the degeneracy of the upper energy level, the energy, and the Boltzmann constant. The column density for each molecule is computed four times: we compute for two different assumed excitation temperatures and for two different regions in the disk. The first temperature of 40 K corresponds to the assumed excitation temperature of NO in Paper II and the second temperature of 100 K corresponds to the excitation temperature of methanol (Paper I) in the IRS 48 disk. The excitation temperature of NO cannot be derived from the observations as all detected NO lines have an upper energy level energy of K.
For the two regions, the column density within 1 beam () and within an extended region () are computed. The column density within 1 beam is computed using the spectrum extracted from the brightest pixel. To compute column densities, the physical size of the beam area is used. For comparison to other work, the column density is also calculated in an extended region, , using the total flux in the small Keplerian mask listed in Table 1 and an assumed emitting region. For the molecules that are directly related to the dust trap (\ceNO, N2O, NO2, NH2OH, H2O, and OH) an emitting area of sr (0.6 square arcseconds, typically 10 times smaller than that covered by the Keplerian mask) is used as done in Paper I, II, and Booth et al. (2021), while for the molecules where this is not necessarily the case (CN and \ceC2H) the area covered by the Keplerian mask is used ( sr, equivalent to 3.41 square arcseconds, and sr equivalent to 7.0 square arcseconds, respectively). An overview of the resulting column densities at 40 and 100 K is presented in Table 2, the column densities at a range of temperatures are presented in Fig. 14.

3 Observational results
3.1 Detected lines
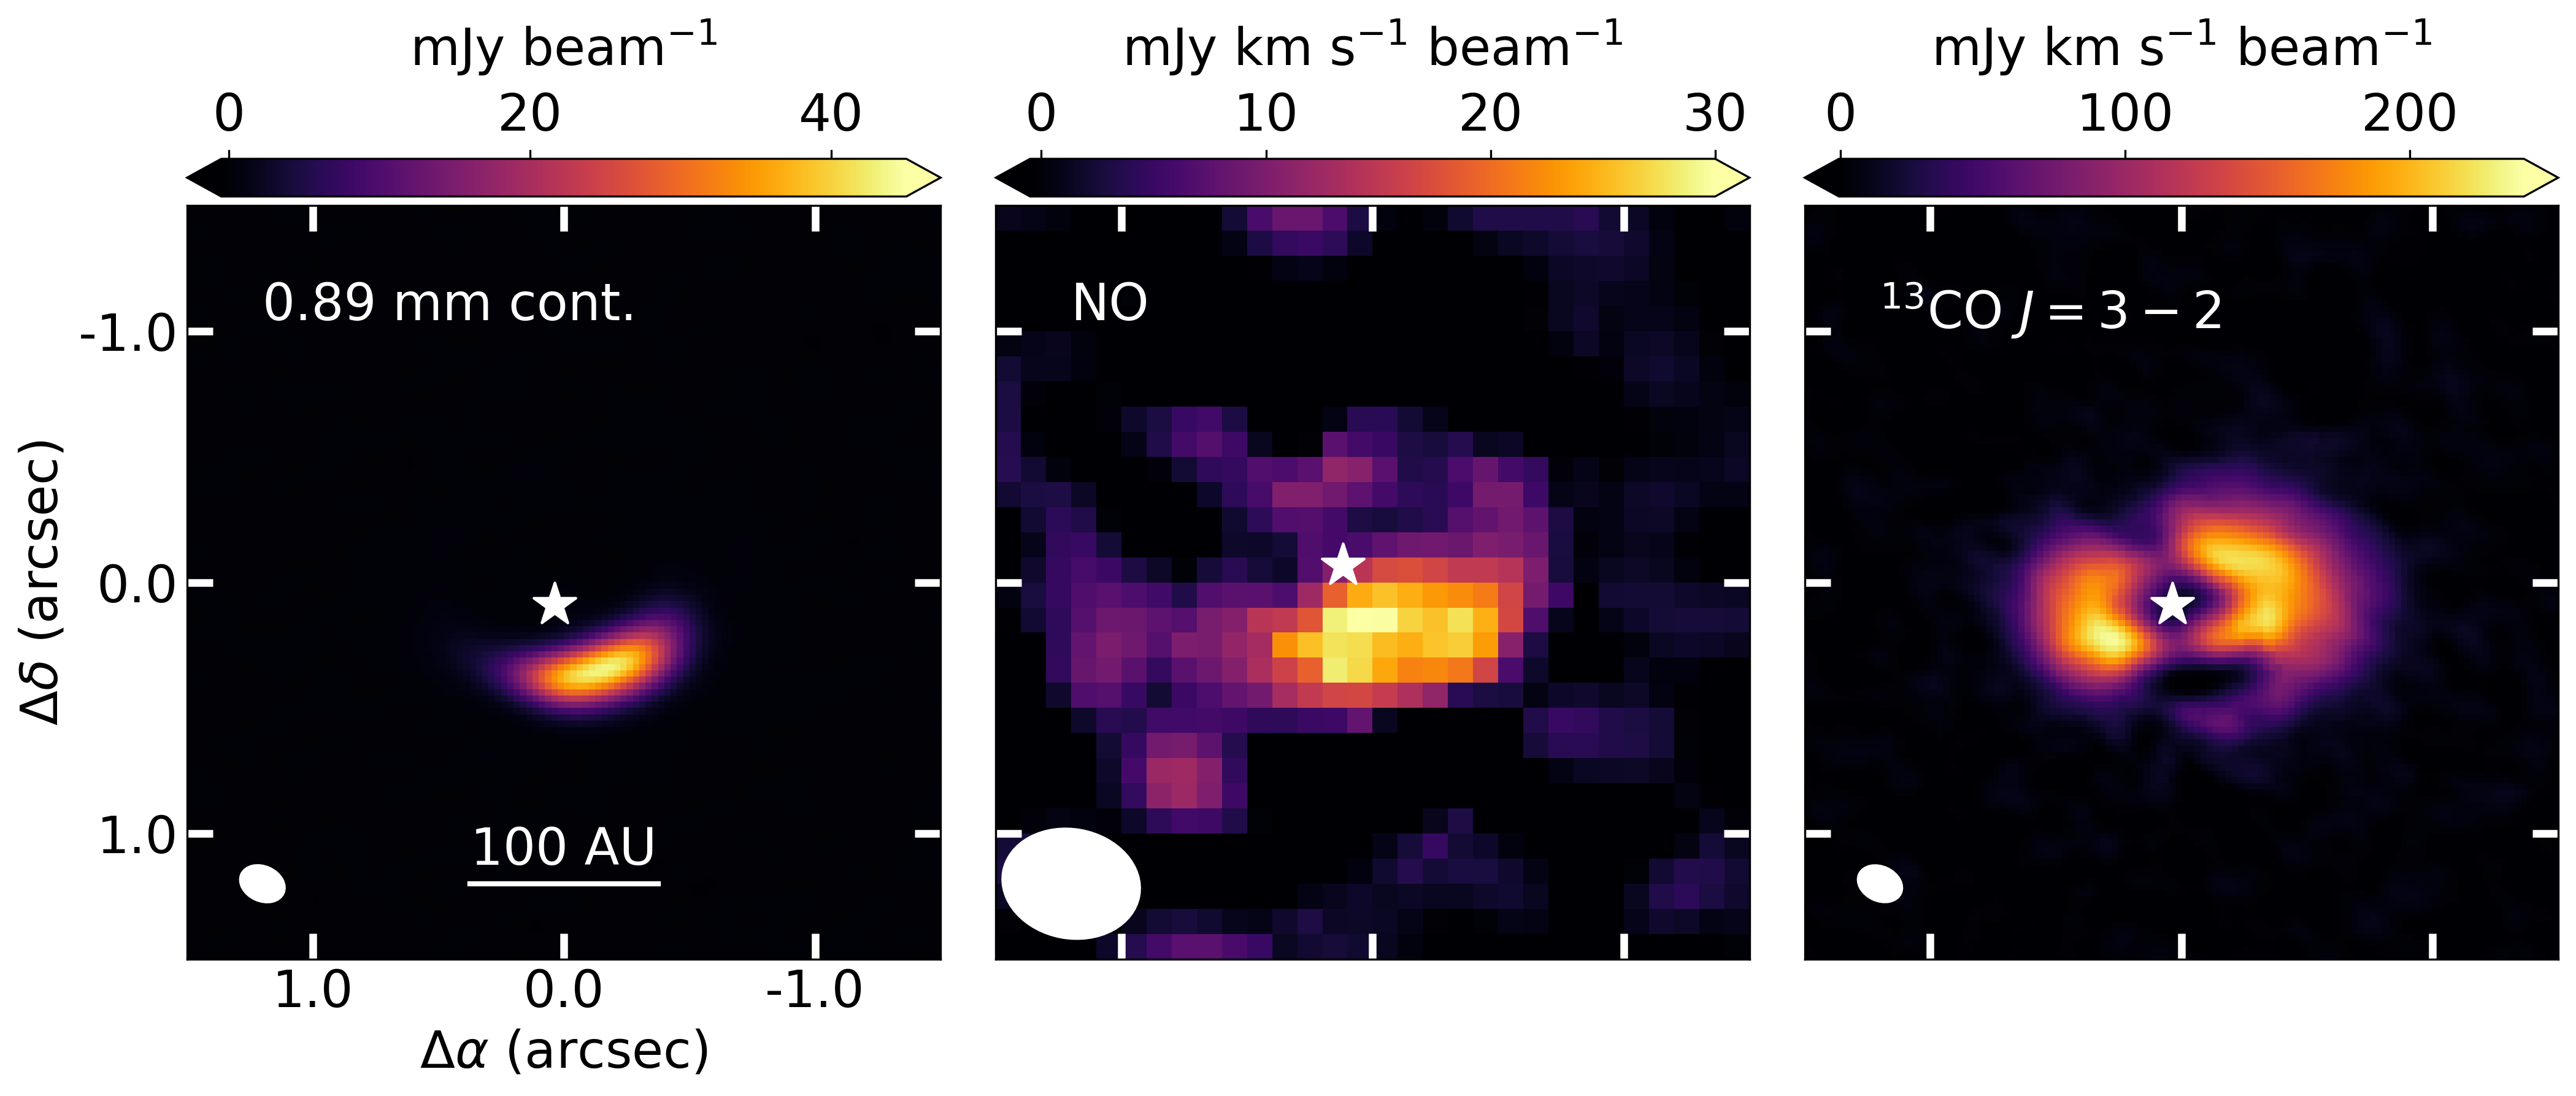
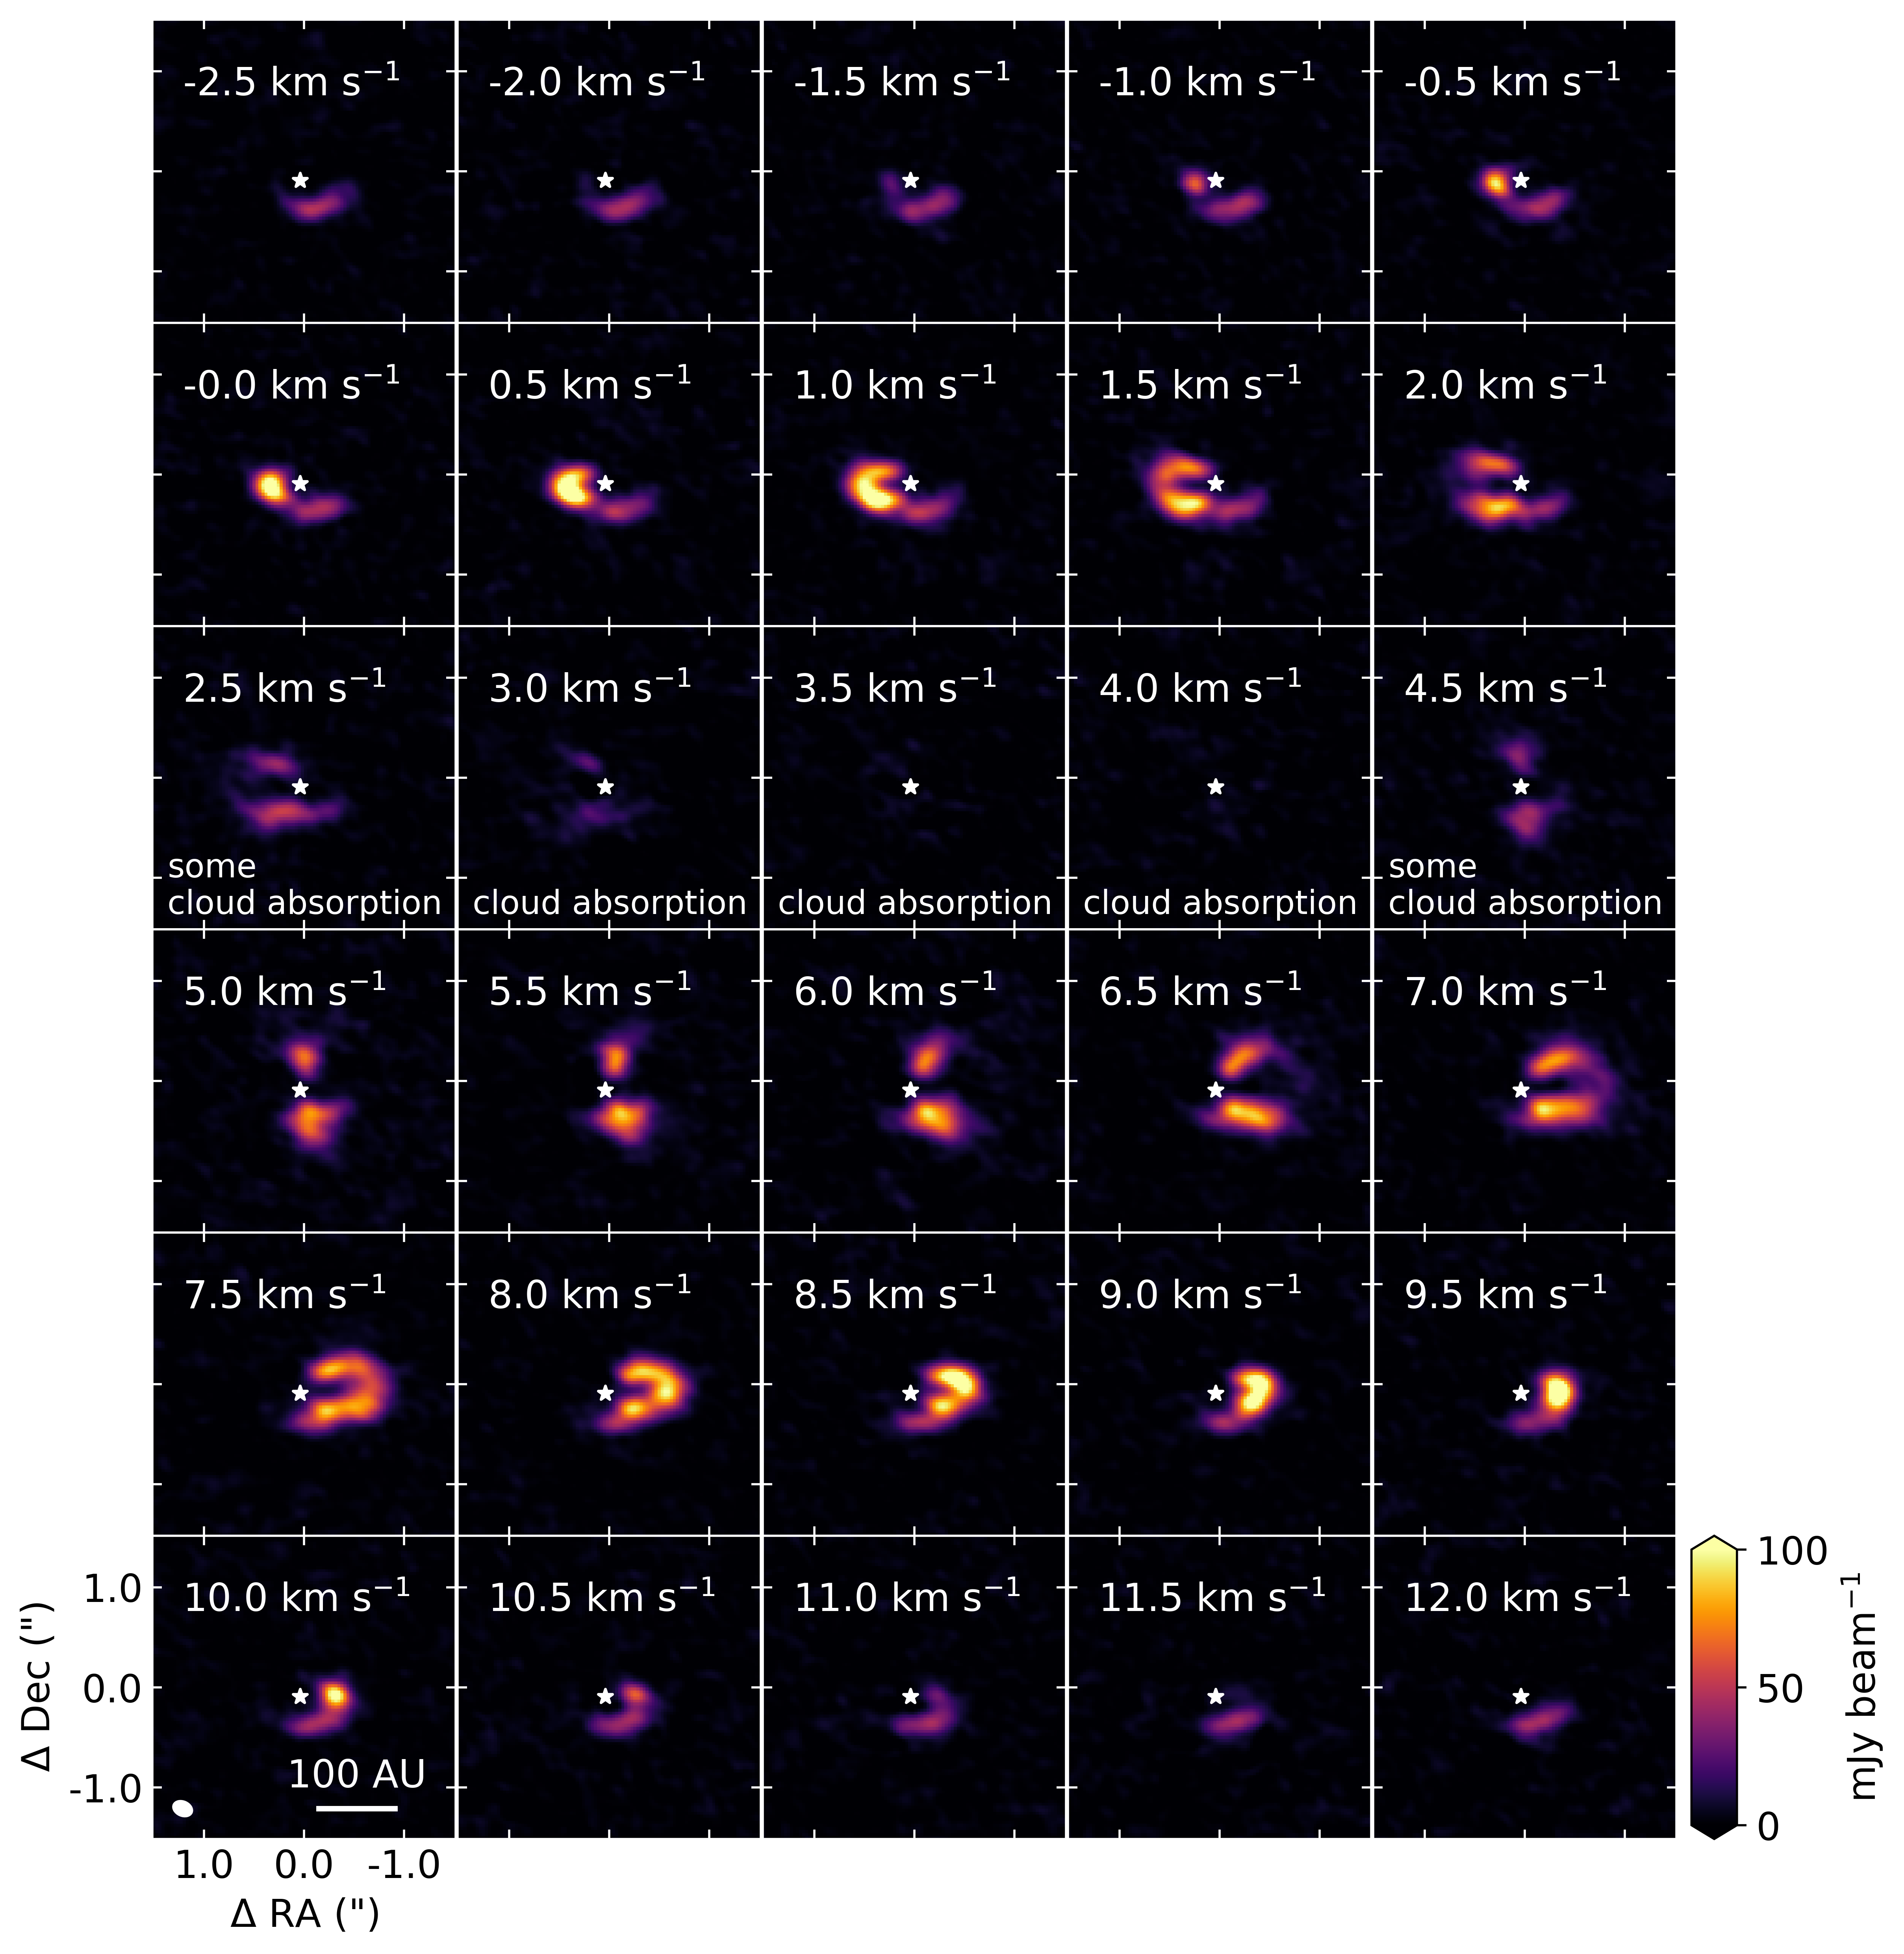
The observational results are presented in Fig. 1 and 2. We detect the 0.89 mm continuum, the \ce^13CO transition and six transitions of NO and provide upper limits for \ceCN, N2O, NO2, NH2OH, and \ceC2H. The three NO lines at 350.7 GHz are blended with the transition of \ceCH3OH (Paper II, see left panel in Fig. 2). Therefore, we focus on the three NO lines at 351.1 GHz, that are blended with themselves but not with emission from other molecules (see right panel in Fig. 2). A spectrum in units of K can be found in Fig. 15.
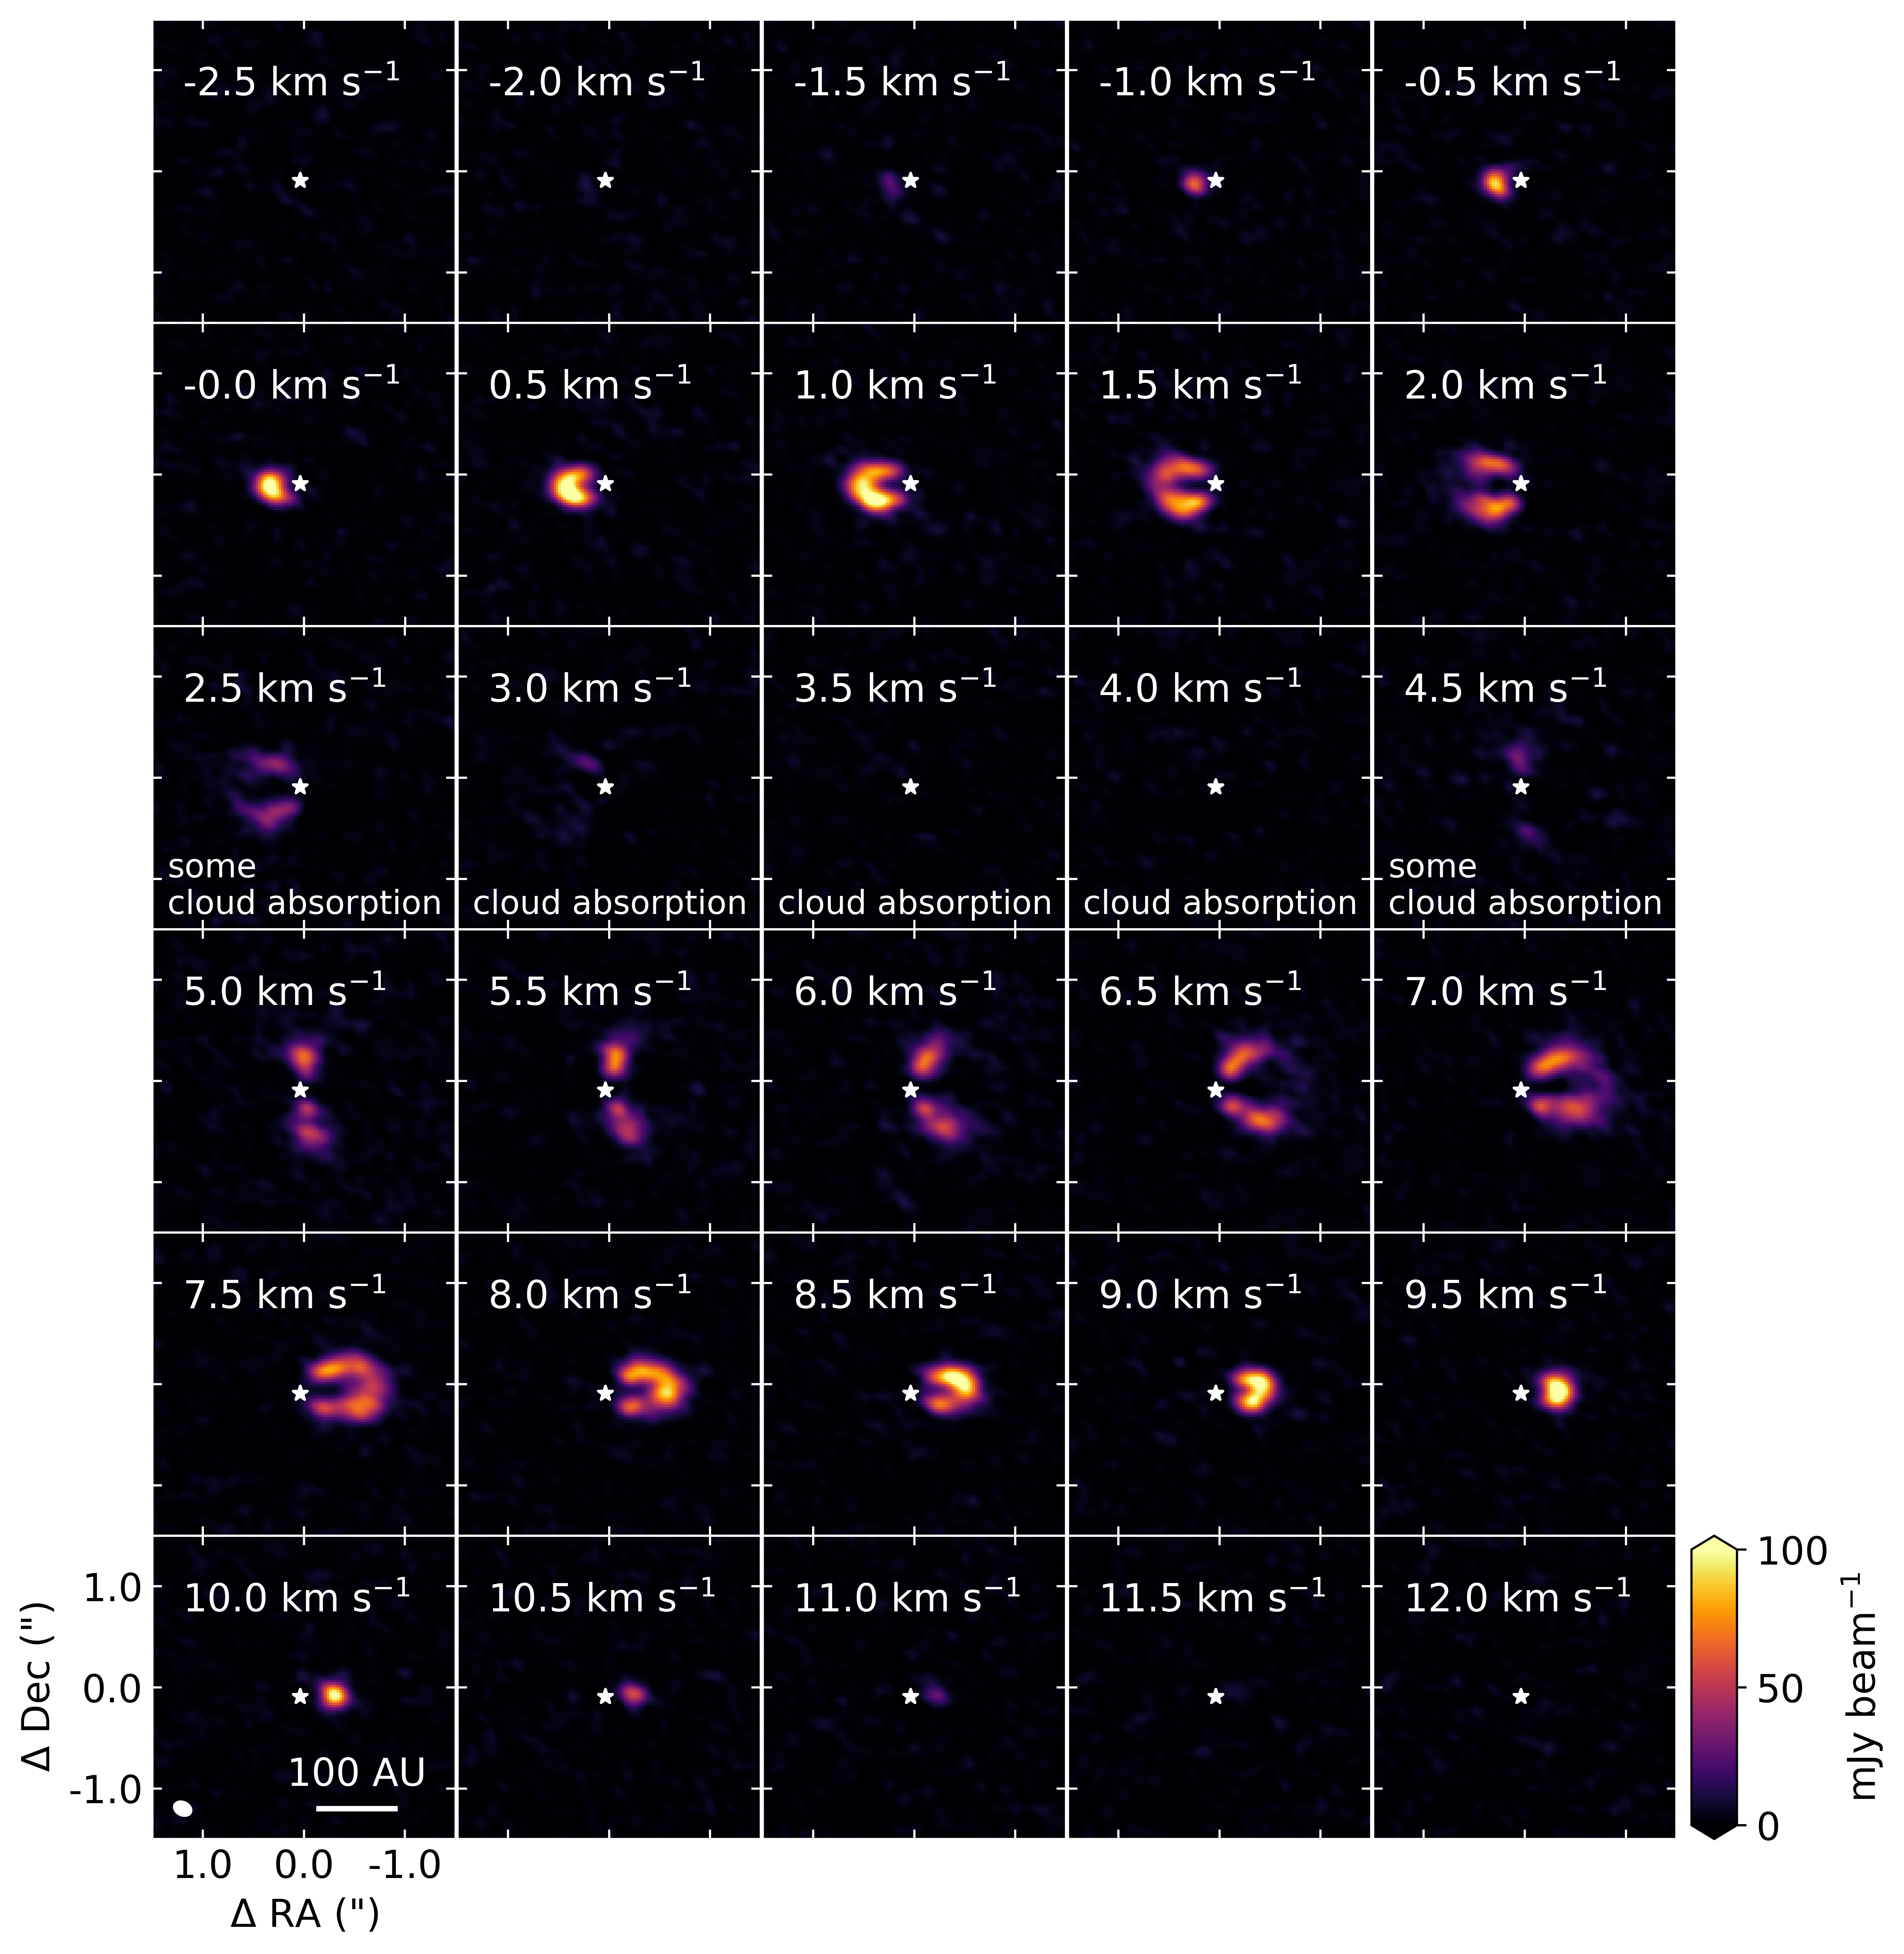
The Keplerian masked integrated intensity maps of these three NO lines, together with the Keplerian masked \ce^13CO transition and the 0.89 mm continuum are presented in Fig. 1. Both the NO and the continuum emission are only detected in the south of the IRS 48 disk, where the dust trap is located. In contrast, the \ce^13CO emission does not show this asymmetry. Thus, there is no indication that the IRS 48 gas disk is azimuthally asymmetric apart from cloud absorption along the minor axis (Bruderer et al., 2014; van der Marel et al., 2016). The lack of \ce^13CO emission at the location of the dust trap is likely due to \ce^13CO and continuum optical depth effects and not due to a lack of \ce^13CO gas at that location (see Fig. 16; Isella et al. 2016; Weaver et al. 2018). Additionally, the 25 AU gas cavity in this disk is also seen in the \ce^13CO transition (van der Marel et al., 2016). The emission from COMs and NO is (close to) optically thin as this depression at the location of the dust trap is not seen in those moment 0 maps. The small depression of \ce^13CO emission along the disk minor axis is likely due to foreground cloud absorption at km s-1 that is seen in the \ce^13CO channel maps (Fig. 17) and in the \ce^12CO transition (van Kempen et al., 2009; Bruderer et al., 2014).
To further investigate the emission in the dust trap, radial profiles are presented in Fig. 3. These profiles are extracted from an 100 wide wedge centred around a position angle of 192 east of north, following Paper I. The NO and methanol emission peak at the same location as the continuum. Furthermore, the emission of NO and methanol decreases slightly or stays relatively constant towards the position of the star due to the large beam of the NO and methanol observations. The steep decrease in the \ce^13CO emission towards the star is indicative of the 25 AU gas cavity that is also seen in the \ce^12CO, \ce^13CO, and \ceC^18O transitions as these all have a high spatial resolution compared to that of the NO and methanol observations (Bruderer et al., 2014; van der Marel et al., 2016). The azimuthal profile is presented in Fig. 18.
3.2 NO column density
The peak NO column density derived in this work is cm-2 and the NO column density assuming all NO emission is emitted from the same region as the continuum ( sr) is cm-2 for an assumed K. As the NO and continuum emission are unresolved in the radial direction, the true emitting area may be smaller than this value. The NO column densities found in this work are a factor of 4-10 lower than the value of cm-2 found in Paper II. The analysis in Paper II was done using a spectrum in K. This spectrum was computed by applying the Rayleigh Jeans law to the data cube and then integrating the emission over an sr region, instead of the regular method of first applying the Rayleigh Jeans law and then averaging over these pixels. As the region used to compute the spectrum was 5 times larger than the ( sr) ALMA beam, the fluxes and hence the column densities reported in Paper II are overestimated by a factor of 5. The corrected NO spectrum in K is presented in Fig. 15. The abundance ratios reported in Paper II are not affected by this inconsistency as the difference of a factor of 5 drops out.

3.3 Upper limits on nitrogen bearing molecules and C/O ratio
N2O, \ceNO2, and \ceNH2OH are expected to be closely linked to the chemistry of NO as \ceNH2OH is the product of its hydrogenation on icy grains and \ceN2O and \ceNO2 are the by-products (Congiu et al., 2012; Fedoseev et al., 2012) but none of these are detected. In Table 2, the upper limits on their column densities are reported for two different temperatures of 40 and 100 K, following the excitation temperature used to model the NO in Paper II and the excitation temperature found for \ceCH3OH in Paper I. As the NO lines listed in Table 1 all have an upper energy level of 36 K, its excitation temperature is not tightly constrained. Increasing the assumed excitation temperature of NO to 100 K increases the (upper limit) on its column density by a factor 2. For both temperatures, the upper limits on the \ceN2O, \ceNO2, and \ceNH2OH column densities are comparable to the NO column density at the dust trap.
In contrast to many other disks, CN is not detected in the IRS 48 disk and its peak column density is constrained to be cm-2 assuming a temperature of 40 K. This is a factor of lower than the peak CN column densities derived for the five disks that were observed as part of the MAPS large program with masses times larger than that of the IRS 48 disk (Bergner et al., 2021; Öberg et al., 2021; Zhang et al., 2021). Our assumed emitting region is similar to the emitting region of \ce^13CO as both CN and \ce^13CO are expected to trace large radial extents of the disk (e.g., Law et al., 2021; Nomura et al., 2021), though some radial differences may be expected (Cazzoletti et al., 2018; van Terwisga et al., 2019; Paneque-Carreño et al., 2022). A CN/NO ratio of is found. This points to a low C/O ratio, consistent with that found from the CS/SO ratio Booth et al. (2021). This conclusion is strengthend by the non-detection of \ceC2H, a molecule that becomes abundant when C/O (Bergin et al., 2016; Bergner et al., 2019; Miotello et al., 2019; Bosman et al., 2021). We will further explore this qualitatively in Sect. 4.2 and 4.4, and Appendix B.2.2 using thermo-chemical disk models.

3.4 Upper limits on \ceH2O and OH
Far-infrared lines of \ceH2O and OH are covered in the Herschel DIGIT survey using the PACS instrument (Fedele et al., 2013). Similar to the carbon and nitrogen bearing molecules CN, \ceC2H, N2O, NO2, and \ceNH2OH, the IRS 48 disk shows no detection of \ceH2O and OH lines. We revisited these upper limits using the LTE model of Fedele et al. (2013), assuming that the emission originates from a slab with homogeneous column density and temperature, and including line opacity effects (see Bruderer et al. 2010 for further details). The emitting area of \ceH2O and OH is assumed to be that of the trap (5000 AU2 or sr). This allows us to convert the non-detection into constraints on the column density of \ceH2O and OH, and temperature. The joint constraints on the column density above the optically thick dust are presented in Fig. 4 using the 3 and 5 upper limits.
In this figure, two regimes can be distinguished, depending on the assumed temperature. First, if the temperature of the \ceH2O and OH emitting regions is K, no constraint can be put and the trap can be rich in \ceH2O and OH. On the other hand, if the temperature exceeds 200 K, both the \ceH2O and OH column densities are constrained to be cm-2, with \ceH2O and OH far-IR lines being optically thin. The excitation temperature of \ceH2CO of K derived in Paper I shows that there is a layer of gas above the dust trap where the gas reaches these high temperatures and \ceH2CO can exist. Furthermore, \ceH2O is expected to be frozen out on the dust grains if the temperature is lower than K based on its 5770 K binding energy (Fraser et al., 2001). Therefore, the temperature range of K is likely the most relevant range for our analysis given the complementary observations. Finally, the Herschel PACS observations only probe the column of \ceH2O and OH above the optically thick dust at m, therefore the full \ceH2O and OH column density may be higher than the upper limits derived here.

4 Models
The observations show a clear north-south asymmetry in the NO emission that is possibly related to the dust trap. To investigate the origin of this asymmetry and the chemical composition of the gas and ice in the IRS 48 disk we run a grid of thermochemical models using DALI (Bruderer et al., 2012; Bruderer, 2013). We test 3 scenarios: (1) a fiducial model, (2) a model with sublimating \ceH2O and/or \ceNH3 ice, and (3) a model with sublimating NO ice.
The models are based on the previously published, azimuthally symmetric IRS 48 disk model with a fixed gas density and a high dust surface density in the dust trap (Bruderer et al., 2014; van der Marel et al., 2016), see Fig. 3 and Fig. C.1 in Paper I. We improve on this model by modelling the chemistry in the dust trap (south side) and the non-dust trap (north side) of the disk separately using the model parameters in Table 3 for models 1-3. In particular, we model the effect of the ice trap by increasing the initial abundance of gas-phase species to O/H and N/H ratios above the typical ISM values, mimicking their enhanced abundances due to radial drift and subsequent sublimation.
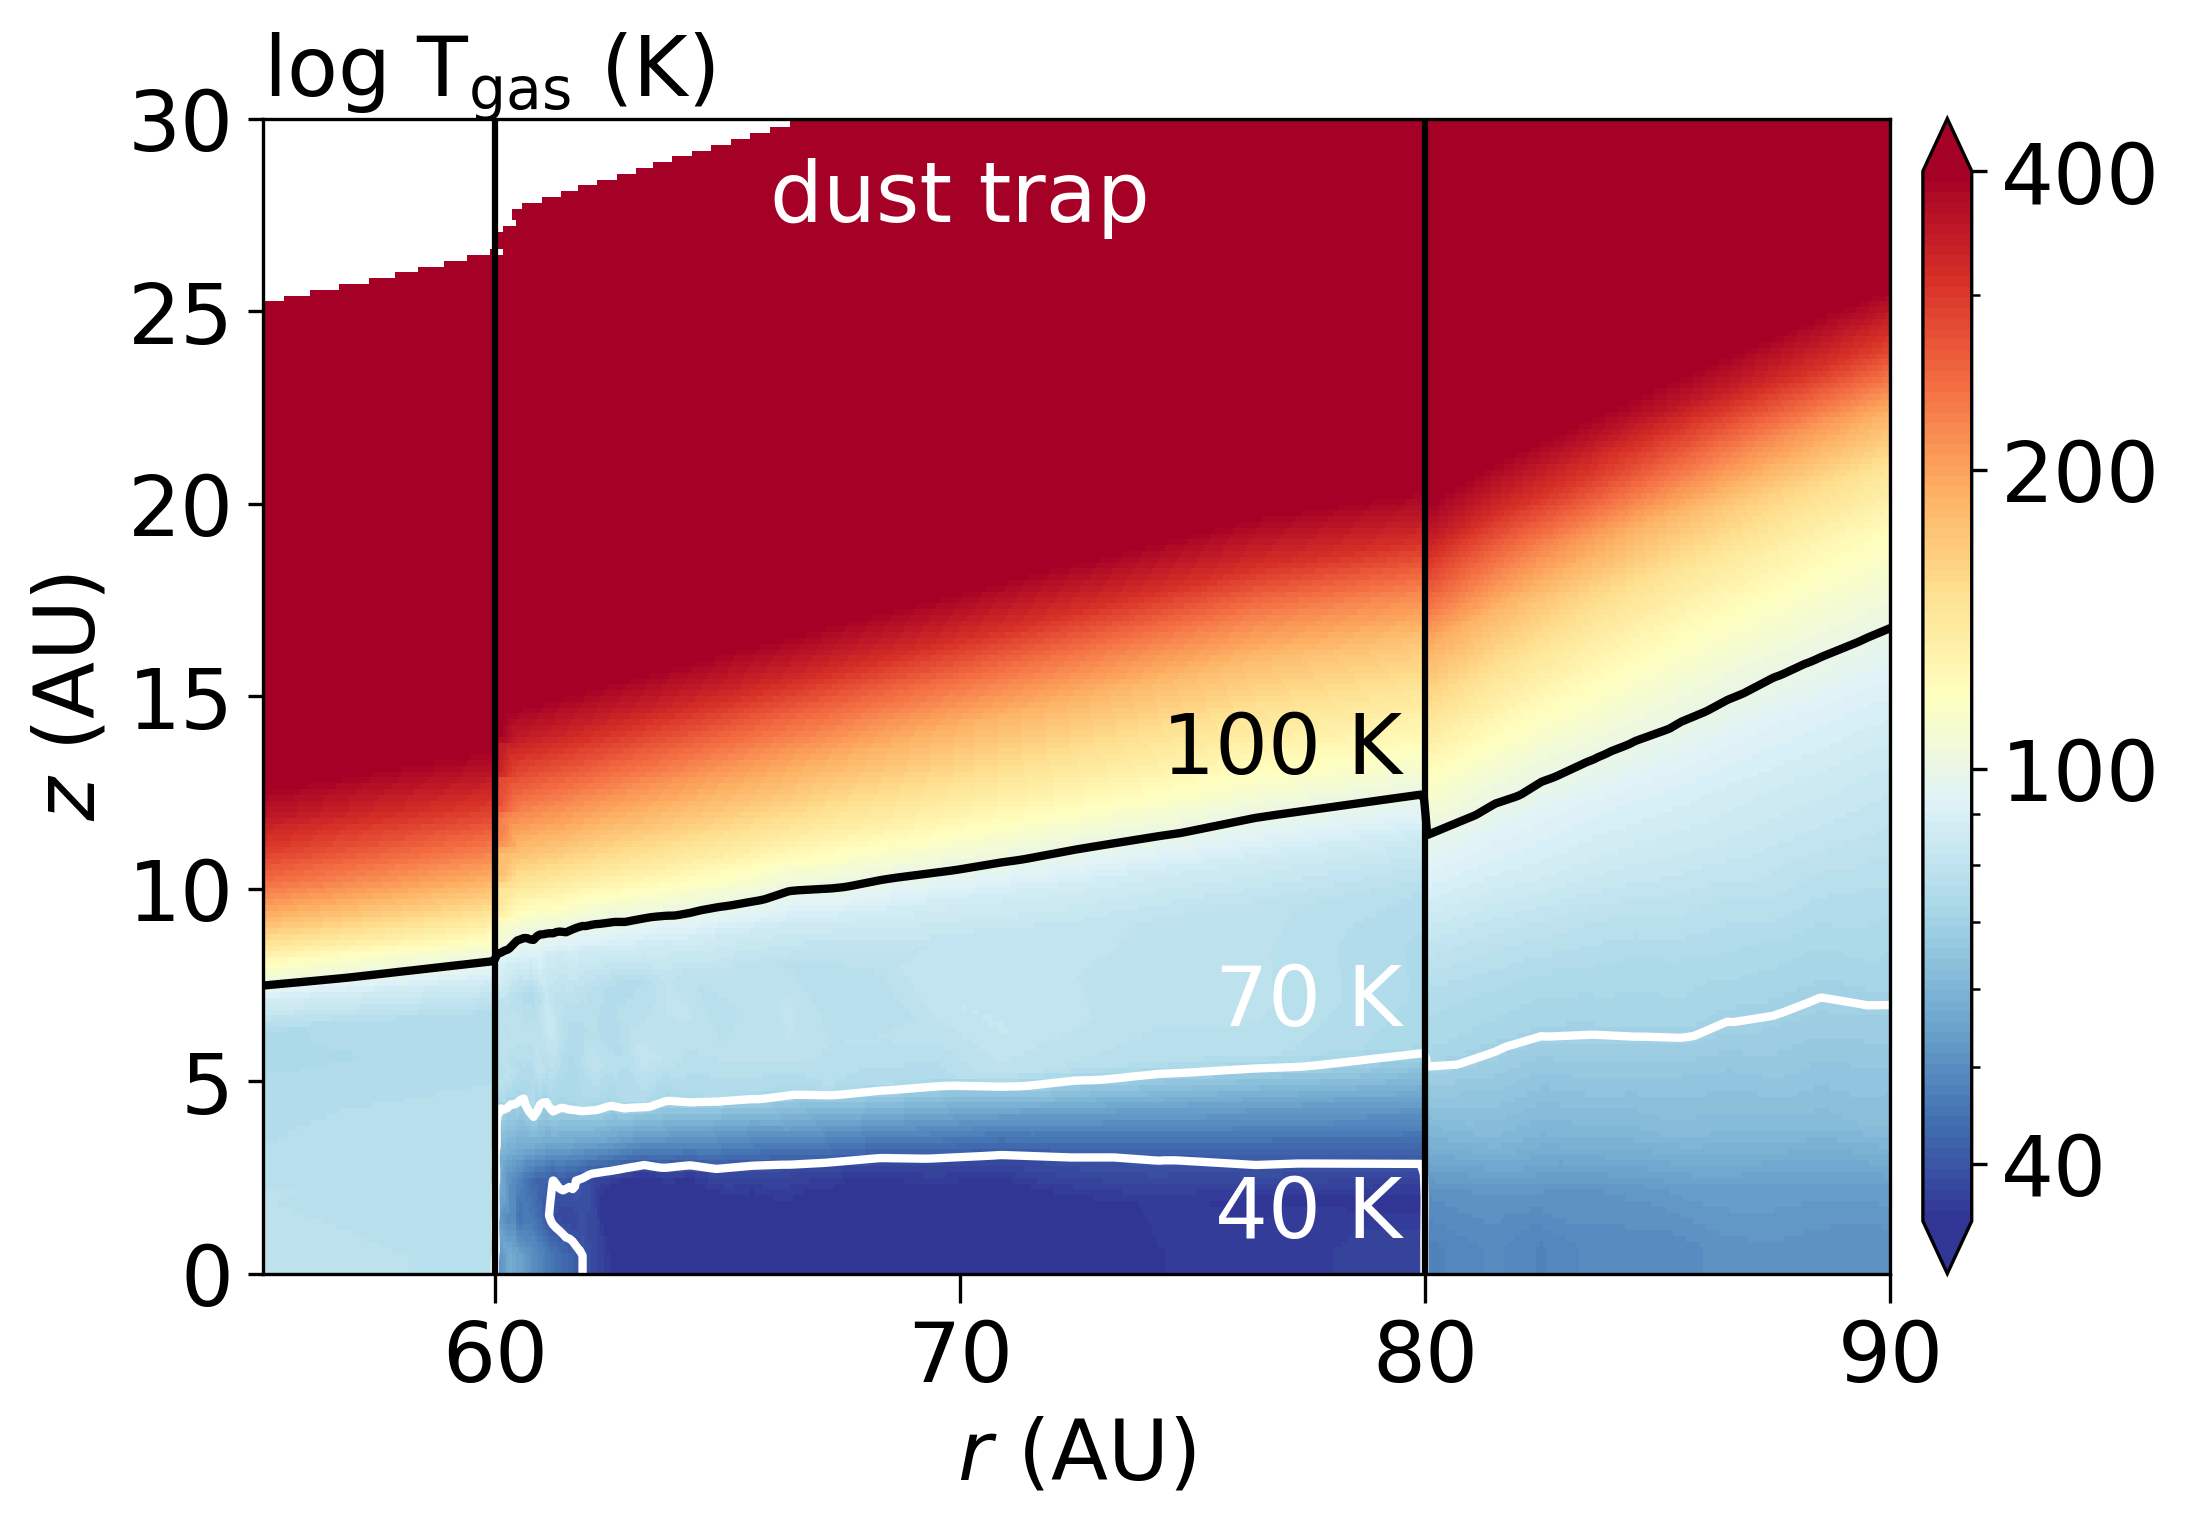
The typical gas number density at the dust trap edge is cm-3 and the corresponding dust number density 222Defined as , with the mass density in g cm-3 (van der Marel et al., 2016; Ohashi et al., 2020). in that region increases up to cm-3. Furthermore, the large dust is settled to the disk midplane with a scale height that is a factor of 0.1 of that of the gas and small dust. The midplane dust temperature in Fig. 6 increases from 52 K at the inner edge of the dust trap at 60 AU to 58 K at 60.3 AU and then decreases to 31 K at 64 AU and increases slightly to 38 K at the outer edge at 80 AU. A full description of the model is given in Appendix B together with an overview of the gas and dust density, temperature and the UV field in Fig. 20. A cartoon of the gas and dust distribution is presented in Fig. 5. First, we investigate the effect of the dust trap on the model in Sect. 4.1. Second, the effects of sublimating \ceH2O and \ceNH3 ices are investigated in Sect. 4.2. Third, the effect of additional NO in the disk is explored in Sect. 4.3.

The chemical abundances are computed using an updated version of the nitrogen chemistry network first presented in Visser et al. (2018), Cazzoletti et al. (2018), and Long et al. (2021), (for details see Appendix B.1.3). This network is suited to evaluate the abundance of nitrogen bearing species such as NO and CN, but also small hydrocarbons such as \ceC2H. This network includes freeze-out and desorption but it does not include any ice-phase chemistry except for the formation of \ceH2, H2O, CH4, NH3, and HCN ices. More complex nitrogen bearing molecules such as \ceN2O, NO2, and \ceNH2OH are not included in this network. Carbon bearing molecules up to \ceC2H3 (ethylenyl) are included in this model. The binding energy of \ceC2H3 is set to K to mimic the effect of \ceC2H3 being converted to other larger carbon-chain molecules that have a high binding energy. A lower binding energy results in gas-phase \ceC2H3 that photodissociates into smaller molecules producing unphysically high abundances of other molecules such as \ceC2H. \ceC2H3 thus acts as a sink of hydrocarbons in this model (Wei et al., 2019). For NO we use a binding energy of 1600 K, consistent with its 40-50 K desorption temperature in laboratory experiments (Collings et al., 2004; Garrod & Herbst, 2006; Wakelam et al., 2017). \ceNH2OH typically desorbs at a much higher temperature of K under laboratory conditions (Zheng & Kaiser, 2010; Congiu et al., 2012; Ioppolo et al., 2014; He et al., 2015; Fedoseev et al., 2016; Jonusas & Krim, 2016; Tsegaw et al., 2017). Using the Redhead equation (Redhead, 1962), a binding energy of K can be derived assuming an pre-exponential factor of s-1 (Congiu et al., 2012). Similarly, for \ceN2O the Redhead equation together with an assumed pre-exponential factor of s-1 and a measured peak desorption temperature of K under laboratory conditions results in a binding energy of K, consistent with the literature value (Congiu et al., 2012; Ioppolo et al., 2014).
The fiducial network starts with molecular initial conditions where all nitrogen starts in gas-phase \ceN2 with an abundance of w.r.t. hydrogen, and all oxygen is initially distributed over gas-phase CO ( w.r.t hydrogen) and \ceH2O ( w.r.t. hydrogen; see Table 3). The models start with all molecules initially in the gas-phase to mimic the very quick sublimation form the ices. The models are run time dependently up to 100 yr and yr inside the dust trap. These time scales correspond to the typical freeze-out time scale just above the dust trap at AU and AU, and the time scale on which the dust trap could have been formed based on hydrodynamical models (van der Marel et al., 2013), respectively. The default time scale is 100 yr. Outside the dust trap in the south and in the entire north side of the disk, the disk chemistry is evolved to 1 Myr, the typical disk formation timescale of a protoplanetary disk. As the youngest Keplerian rotating disks are detected in Class 0 objects with an approximate age on the order of yr (Evans et al., 2009; Tobin et al., 2012; Murillo et al., 2013) and the typical disk life time is Myr (e.g., Haisch et al., 2001). Evolving the disk for shorter (0.5 Myr) or longer (up to 10 Myr) timescales does not change the NO column density in the south side of the disk outside the dust trap by more than 1.4%.
Synthetic images are made using the raytracer in DALI to compare the models to the observations. The excitation temperature in each cell is calculated explicitly, without assuming LTE, using the collisional rate coefficients for NO with He, scaled down with a factor 1.4 to account for collisions with \ceH2 from the LAMDA database (Varberg et al., 1999; Schöier et al., 2005; Lique et al., 2009). The images cubes are then convolved to the beam of the observations. The DALI raytracer does not take line blending into account. Instead, the three NO lines at GHz were raytraced separately and added afterwards. This is appropriate if these NO lines are optically thin, which is the case for all models except those with a very high initial NO abundance.
4.1 Dust trap cools the disk midplane

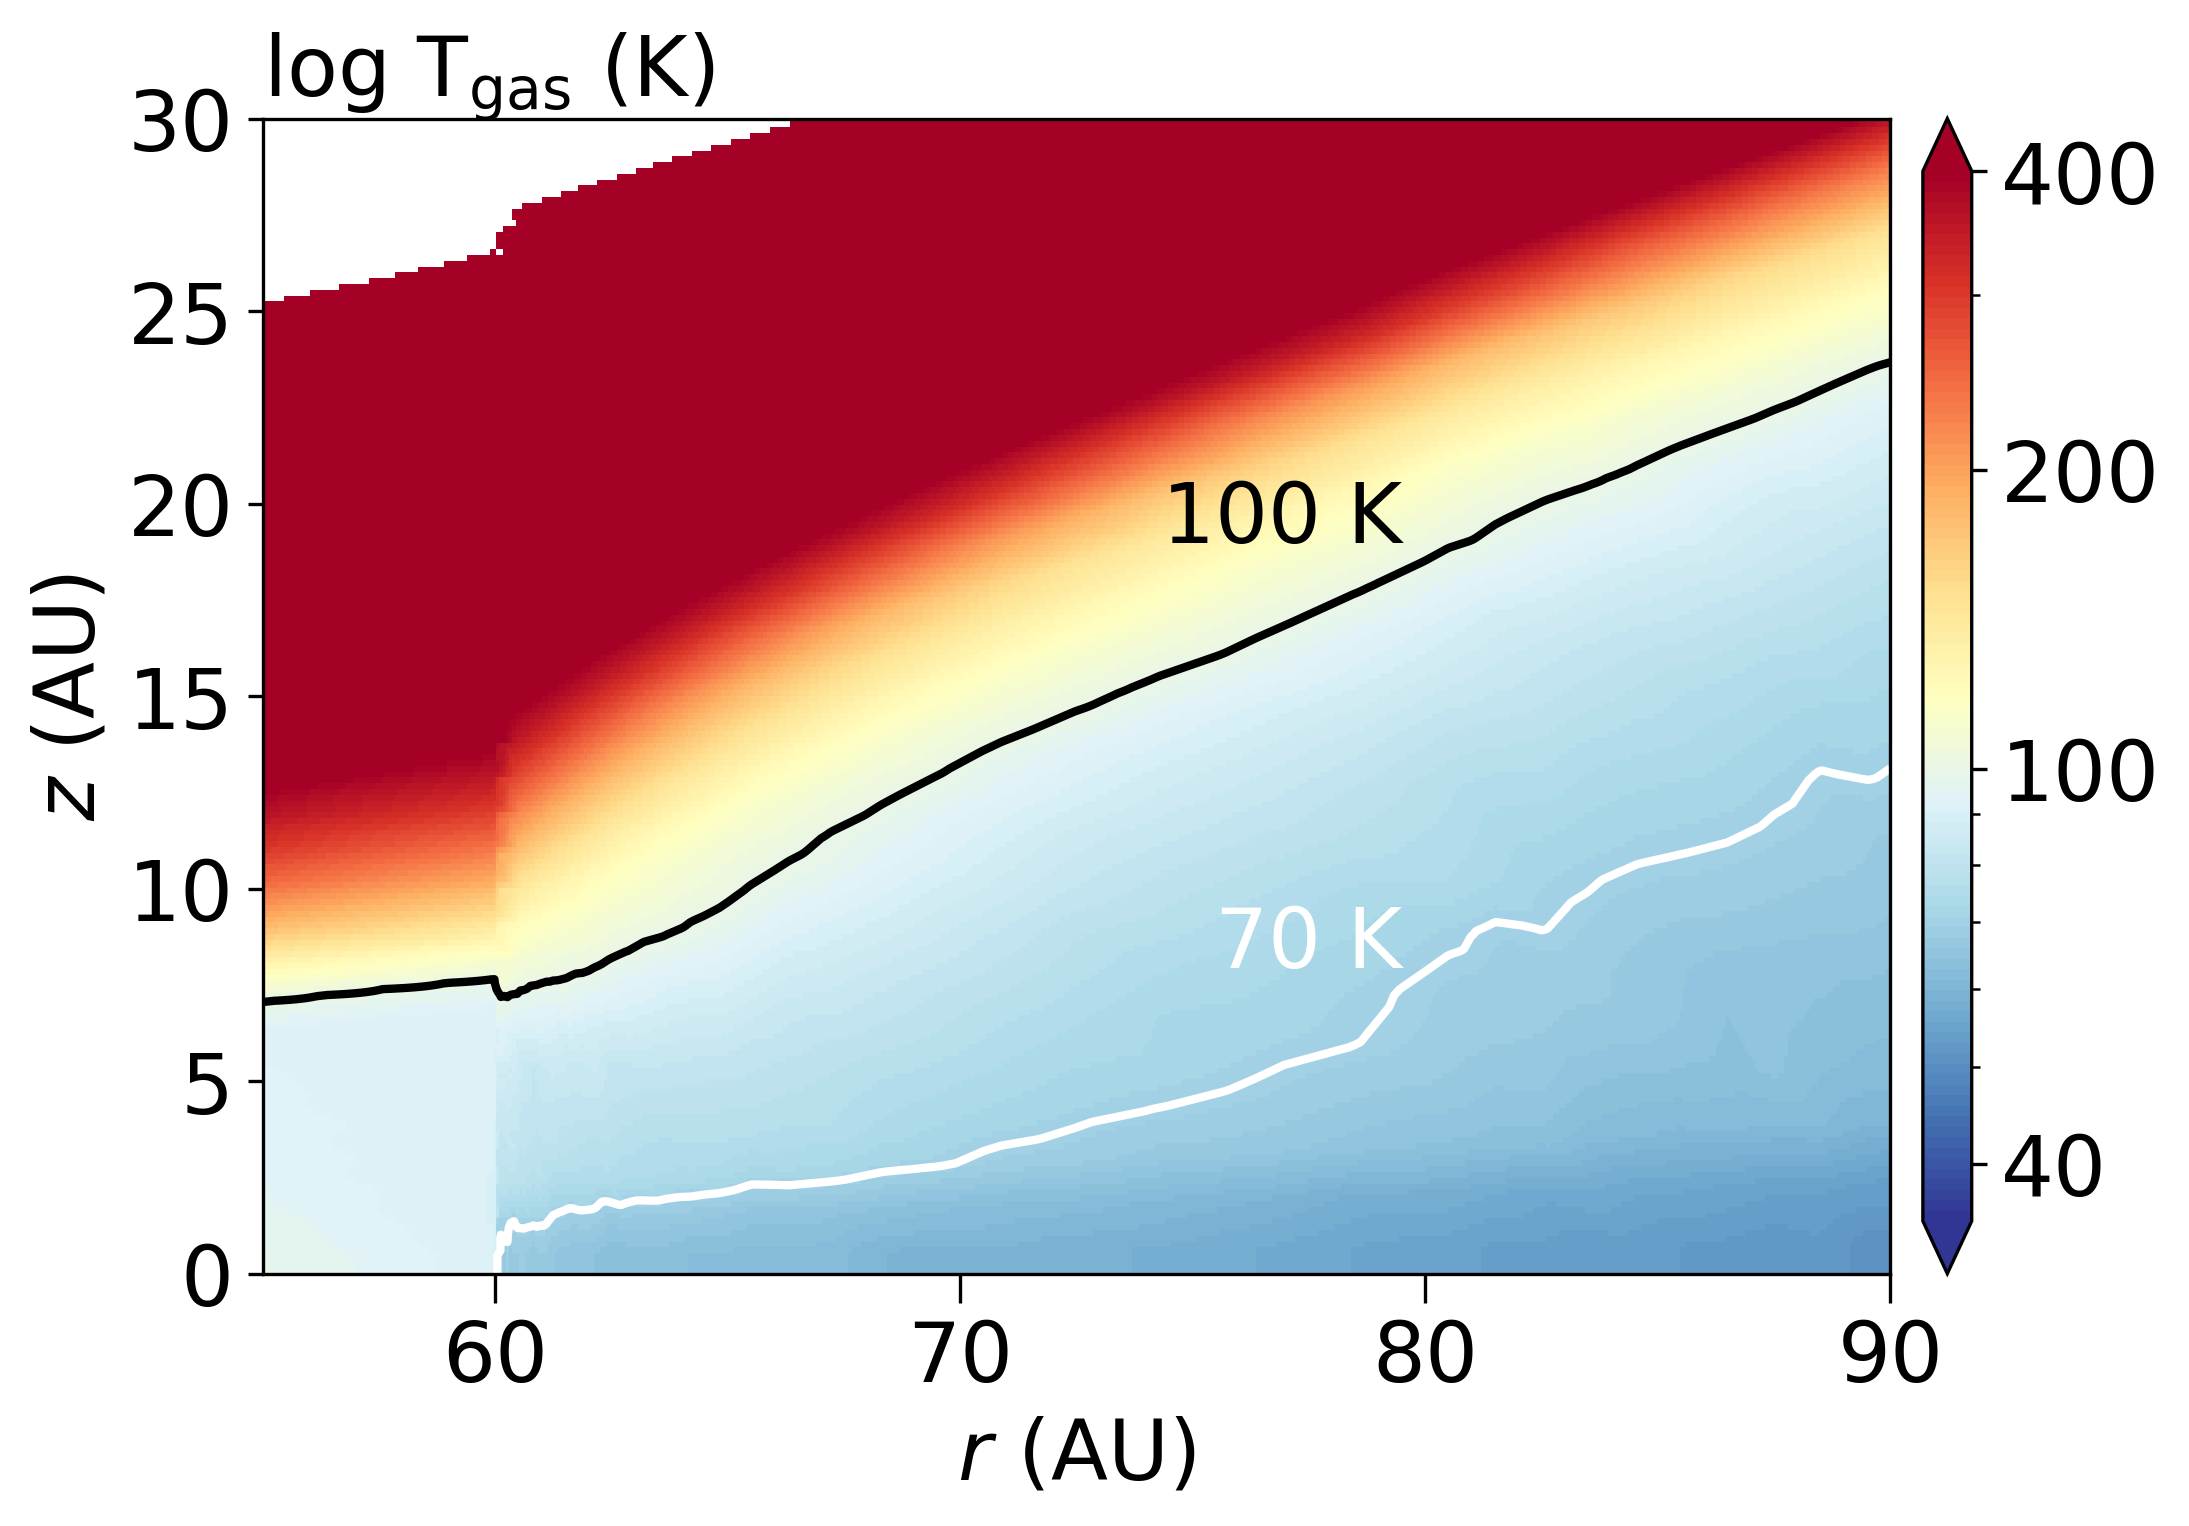
The resulting gas temperature structure in the dust trap (south) and the non-dust trap side (north) are presented in Fig. 7. The gas temperature is up to 32 K lower inside the bulk of the dust trap than it is in the same disk region without the dust trap. This is due to the very high dust density of the large grains in the dust trap shielding the UV radiation that heats the disk. Therefore, despite their 30-60 times lower opacity to UV radiation, the large grains absorb almost all UV that is incident on the dust trap, lowering the temperature. Notably, a small jump of 5 K in the temperature is seen at 60.3 AU due to the intense radiation field (see Fig. 6). Furthermore, both sides of the disk are too warm for CO freeze-out (at K).
The 32 K drop in the dust temperature in the dust trap is not sufficiently cold for NO freeze-out ( K in the dust trap). As the non-dust trap side is warmer, NO is not freezing out in the IRS 48 disk model. The dust trap could still contain ices that have formed from NO in earlier phases, for example, \ceN2O, \ceNO2, and \ceNH2OH that are products formed in NO hydrogenation experiments and have larger binding energies (Congiu et al., 2012; Yıldız et al., 2013; Fedoseev et al., 2012, 2016) but as \ceN2O, \ceNO2, and \ceNH2OH are not included in the chemical network, their contributions cannot be studied directy with our model. Therefore, the dust trap can contain a reservoir of nitrogen bearing ices build up from the colder earlier phases.
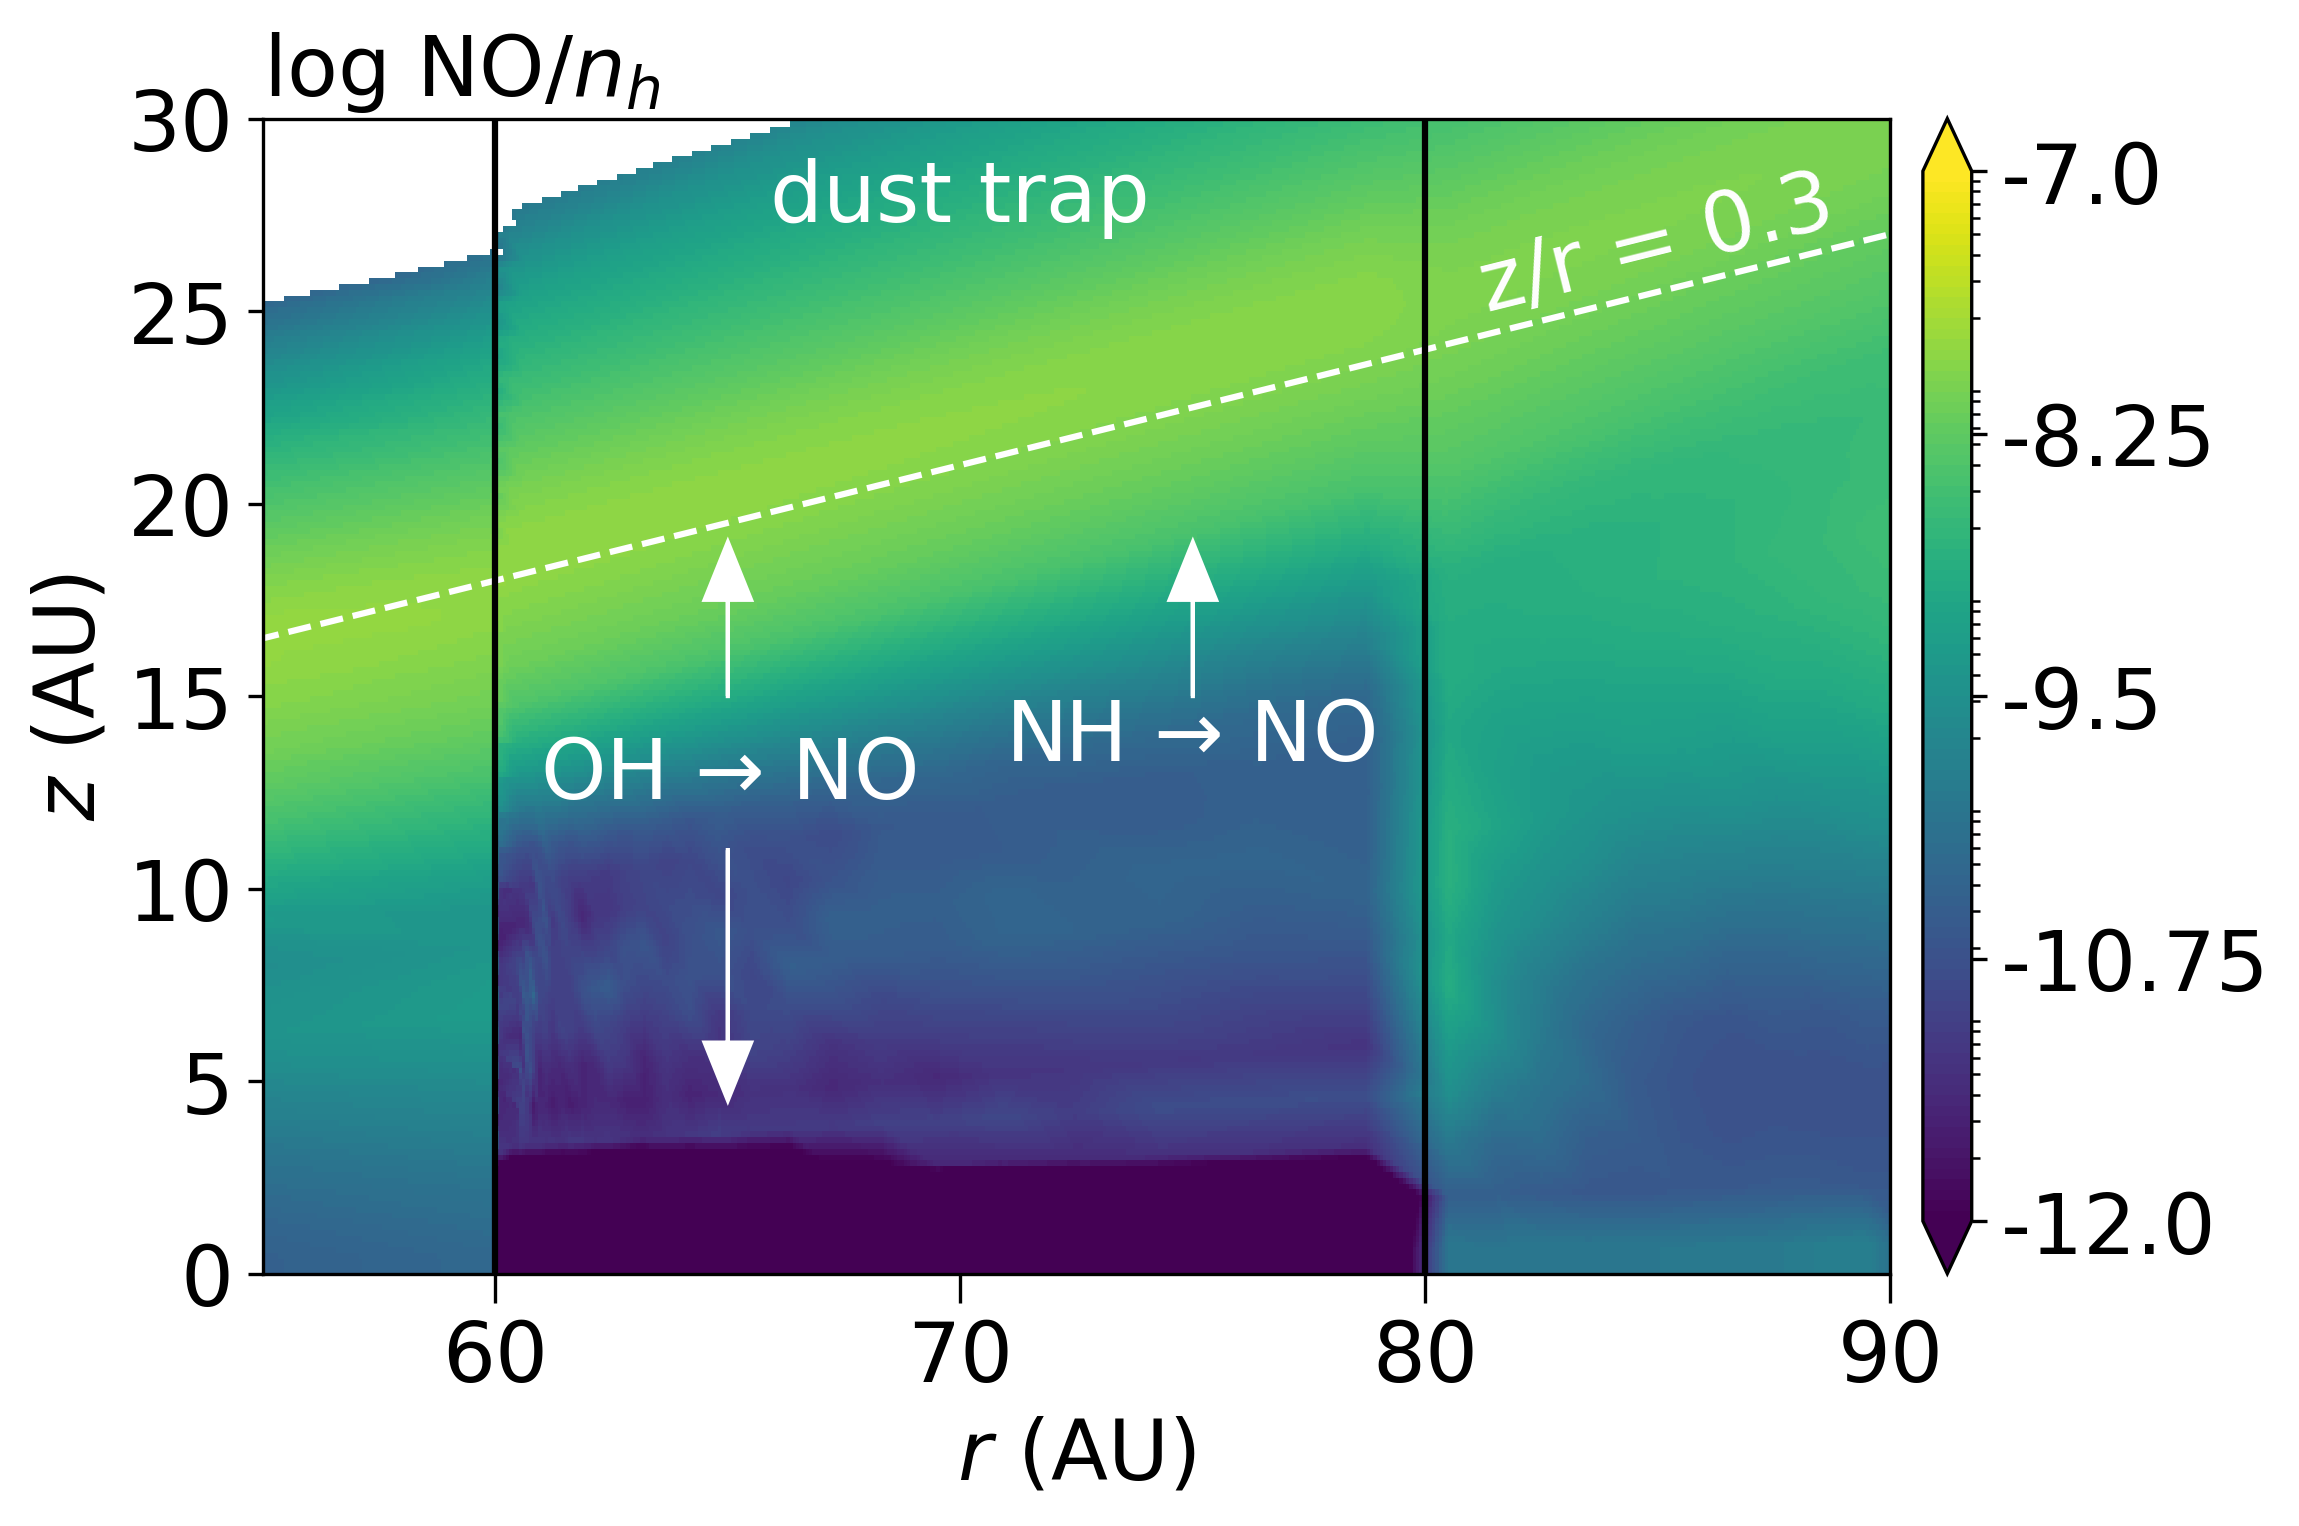
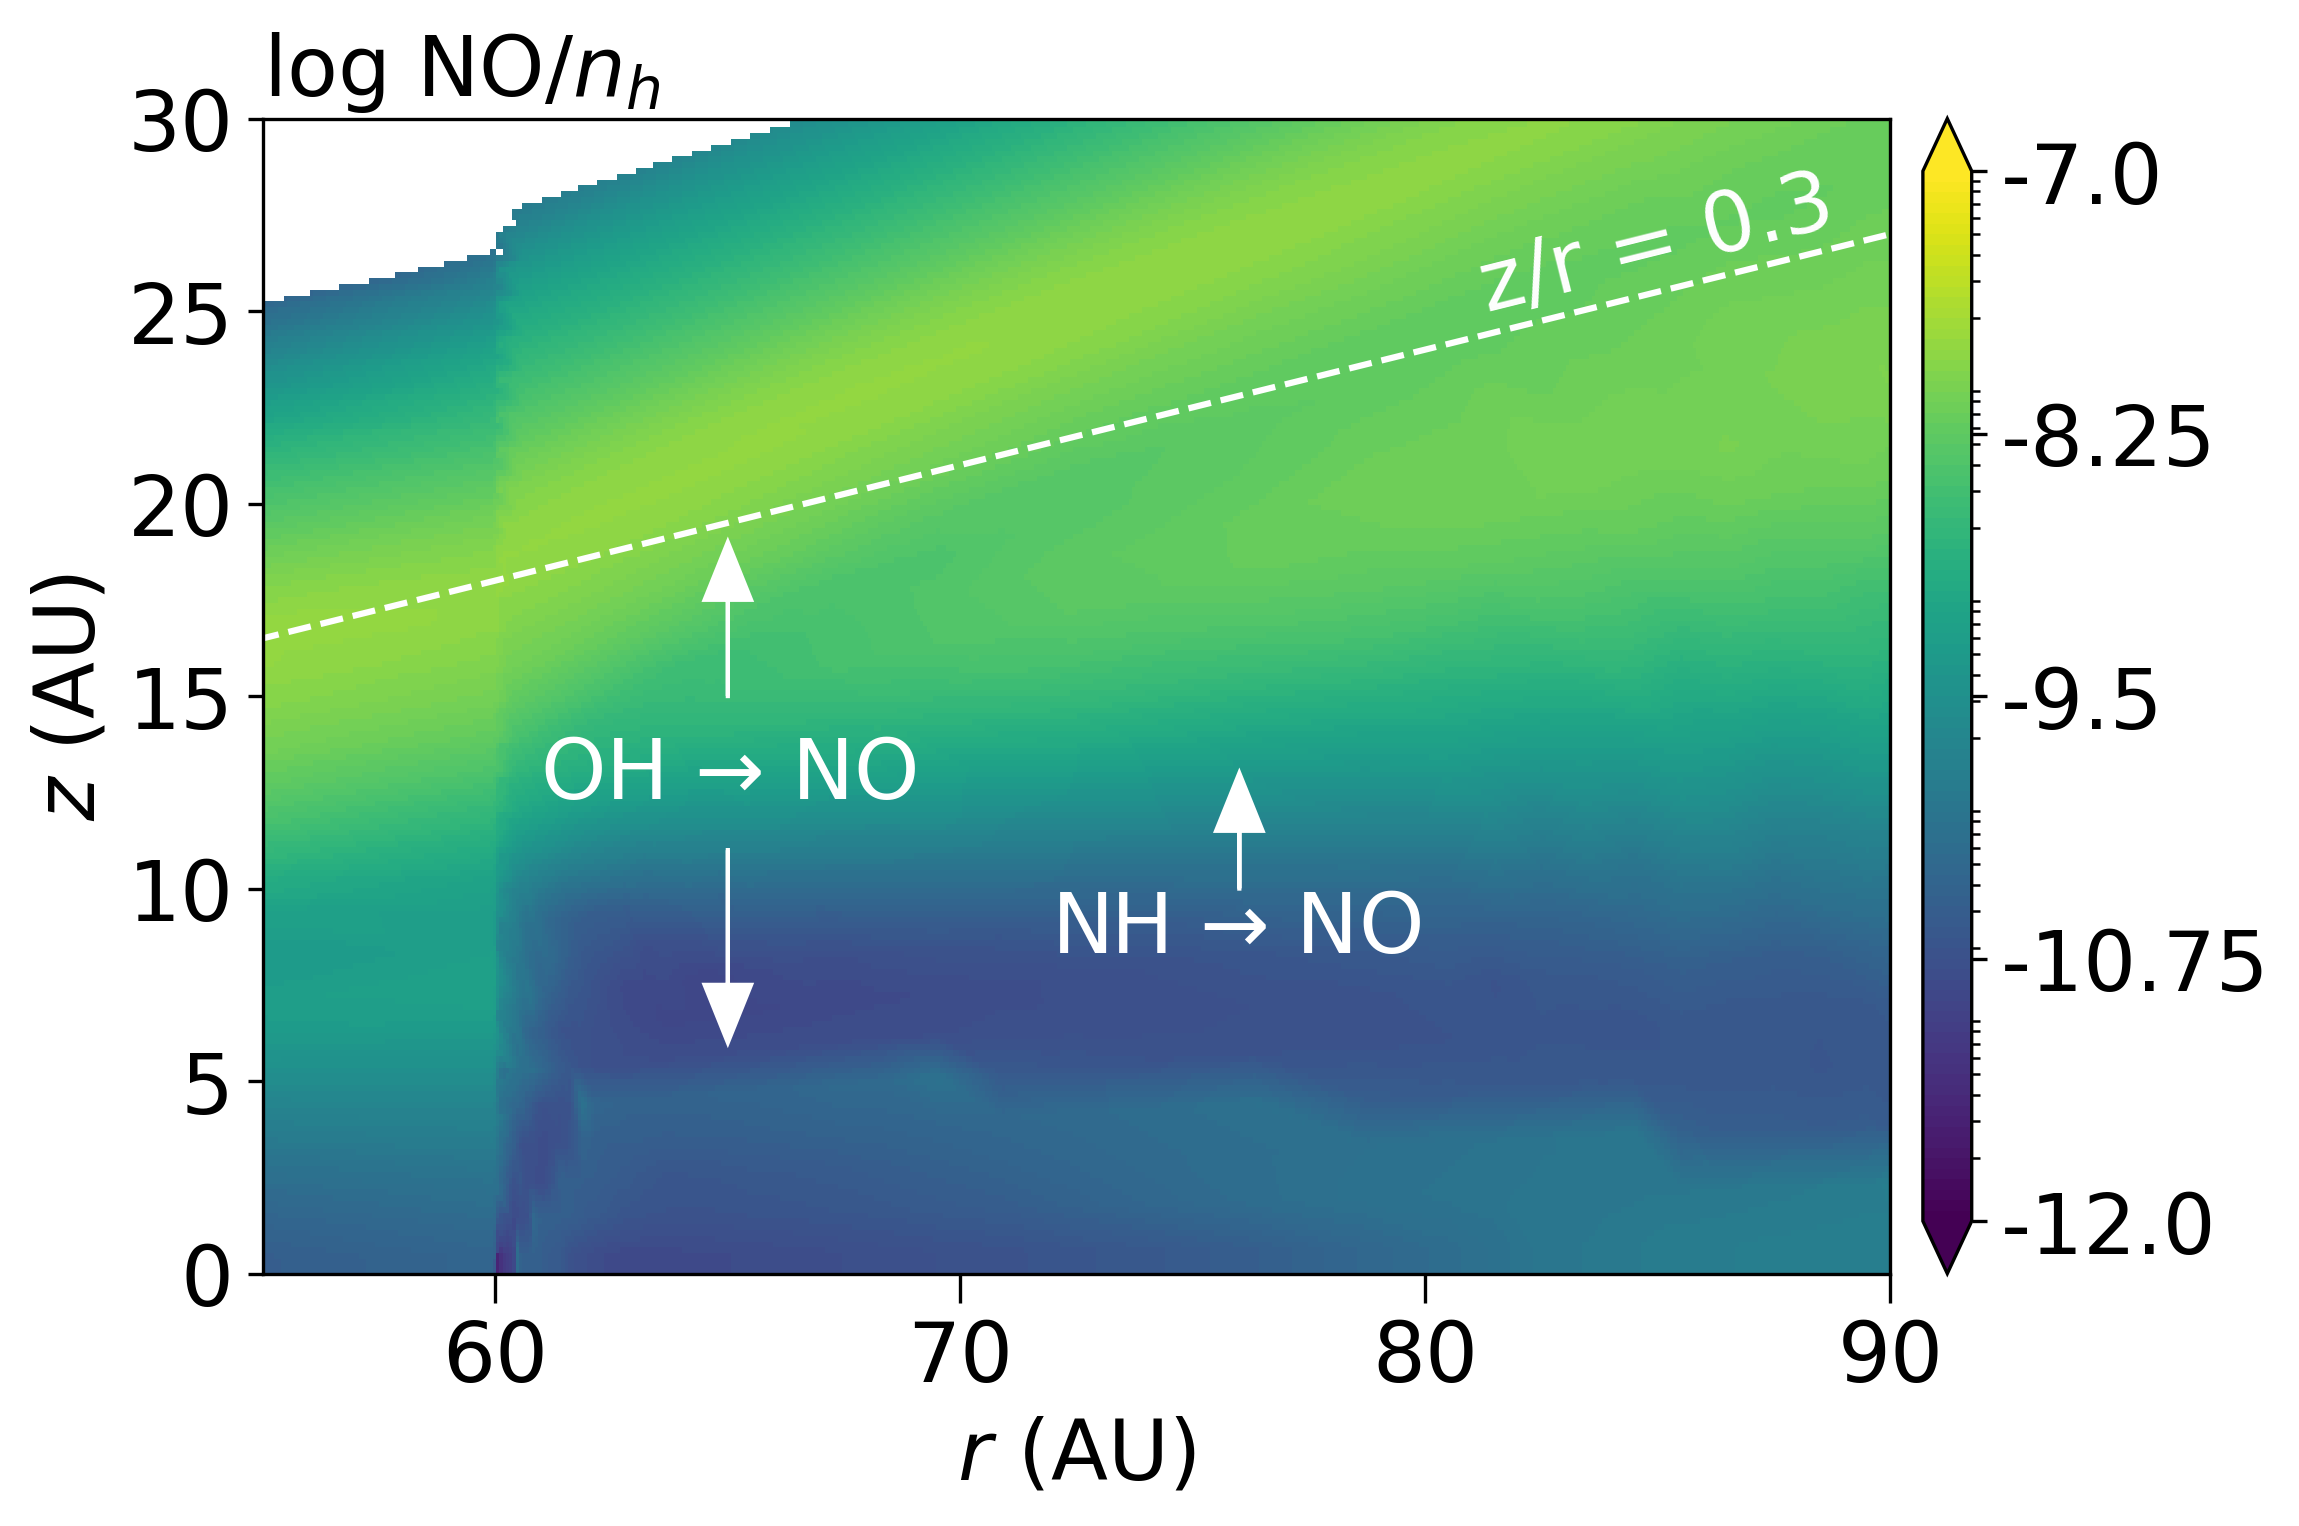
The NO abundance predicted by the dust-trap model is presented in the left panel of Fig. 8. The NO has a moderate abundance of in the surface layer at (indicated with the dashed white line). In the top half of this layer, NO is mainly formed in the gas through:
The OH is formed through the photodissociation of water as water photodissociates into OH, H, and O, where the latter reacts with molecular hydrogen to form more OH. In the lower half of the NO surface below , a second pathway through NH appears:
| (9) |
where NH is formed from the reaction of N with vibrationally excited \ceH2. Deeper down in the disk including the dust trap itself, the NO abundance decreases due to a lack of OH and NH, the two main ingredients needed to form NO. The main destruction path of NO is through photodissociation.
The NO abundance in the non-dust trap side of the model is presented in the right panel of Fig. 8. The formation and destruction pathways for NO are similar in the north side of the disk. The surface layer of NO splits into two layers: one where NO is mainly formed through OH and one where NO is mainly formed through NH. Furthermore, between the midplane and AU, an NO layer with an abundance of is present, indicated by the downward arrow in the right panel of Fig. 8. This layer is located just above the water snow surface, where some sublimating water photodissociates into OH and then forms NO. This layer can also be seen just above the dust trap in the dust trap model (left panel of Fig. 8).
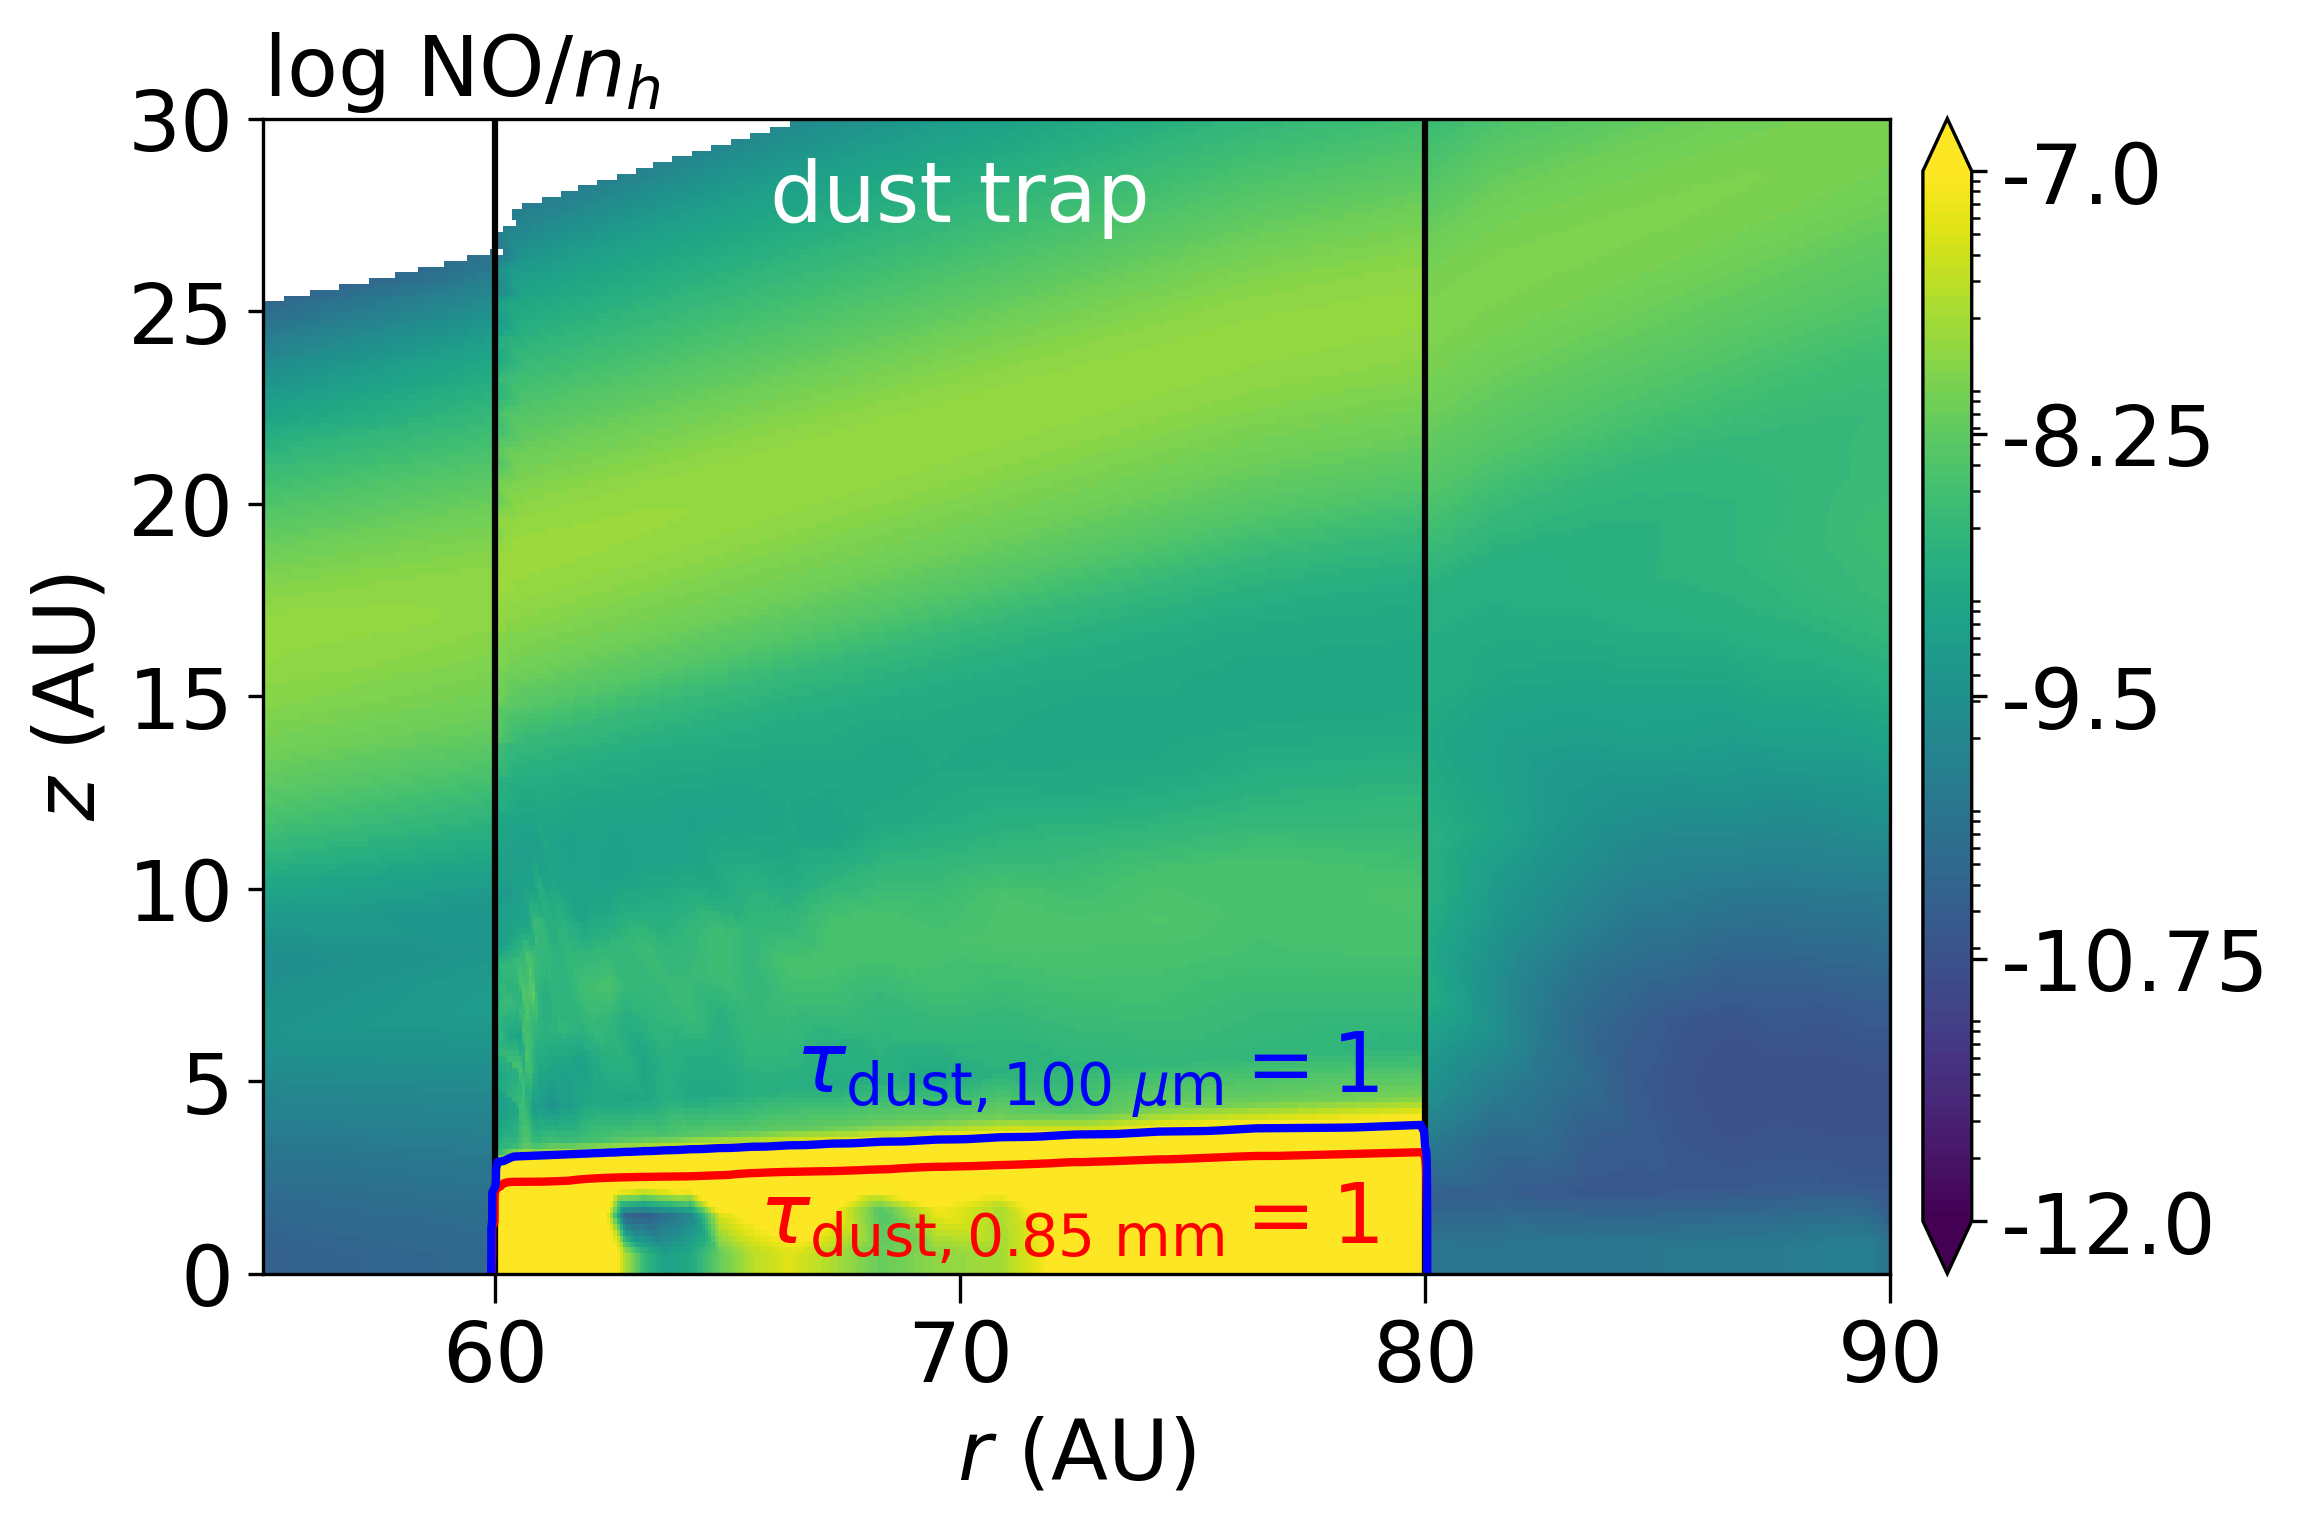
The column density and emission predicted by the model are compared to the observations in Fig. 9. The model column density in the non-dust trap side (dashed blue line) is times lower than the upper limit that is derived by the observations. Similarly, the emission predicted by the non-dust trap side is consistent with the non-detection of the NO in the north. On the other hand, the dust-trap side of the model underpredicts the NO column density by a factor of and the emission by a factor of 15. Furthermore, the dust trap model does not reproduce the characteristic shape of the NO emission that is only present at the location of the dust trap. Therefore, the NO abundance in the south needs to be enhanced compared to the fiducial model to explain the observations.
4.2 Effect of sublimating ices: \ceH2O and \ceNH3
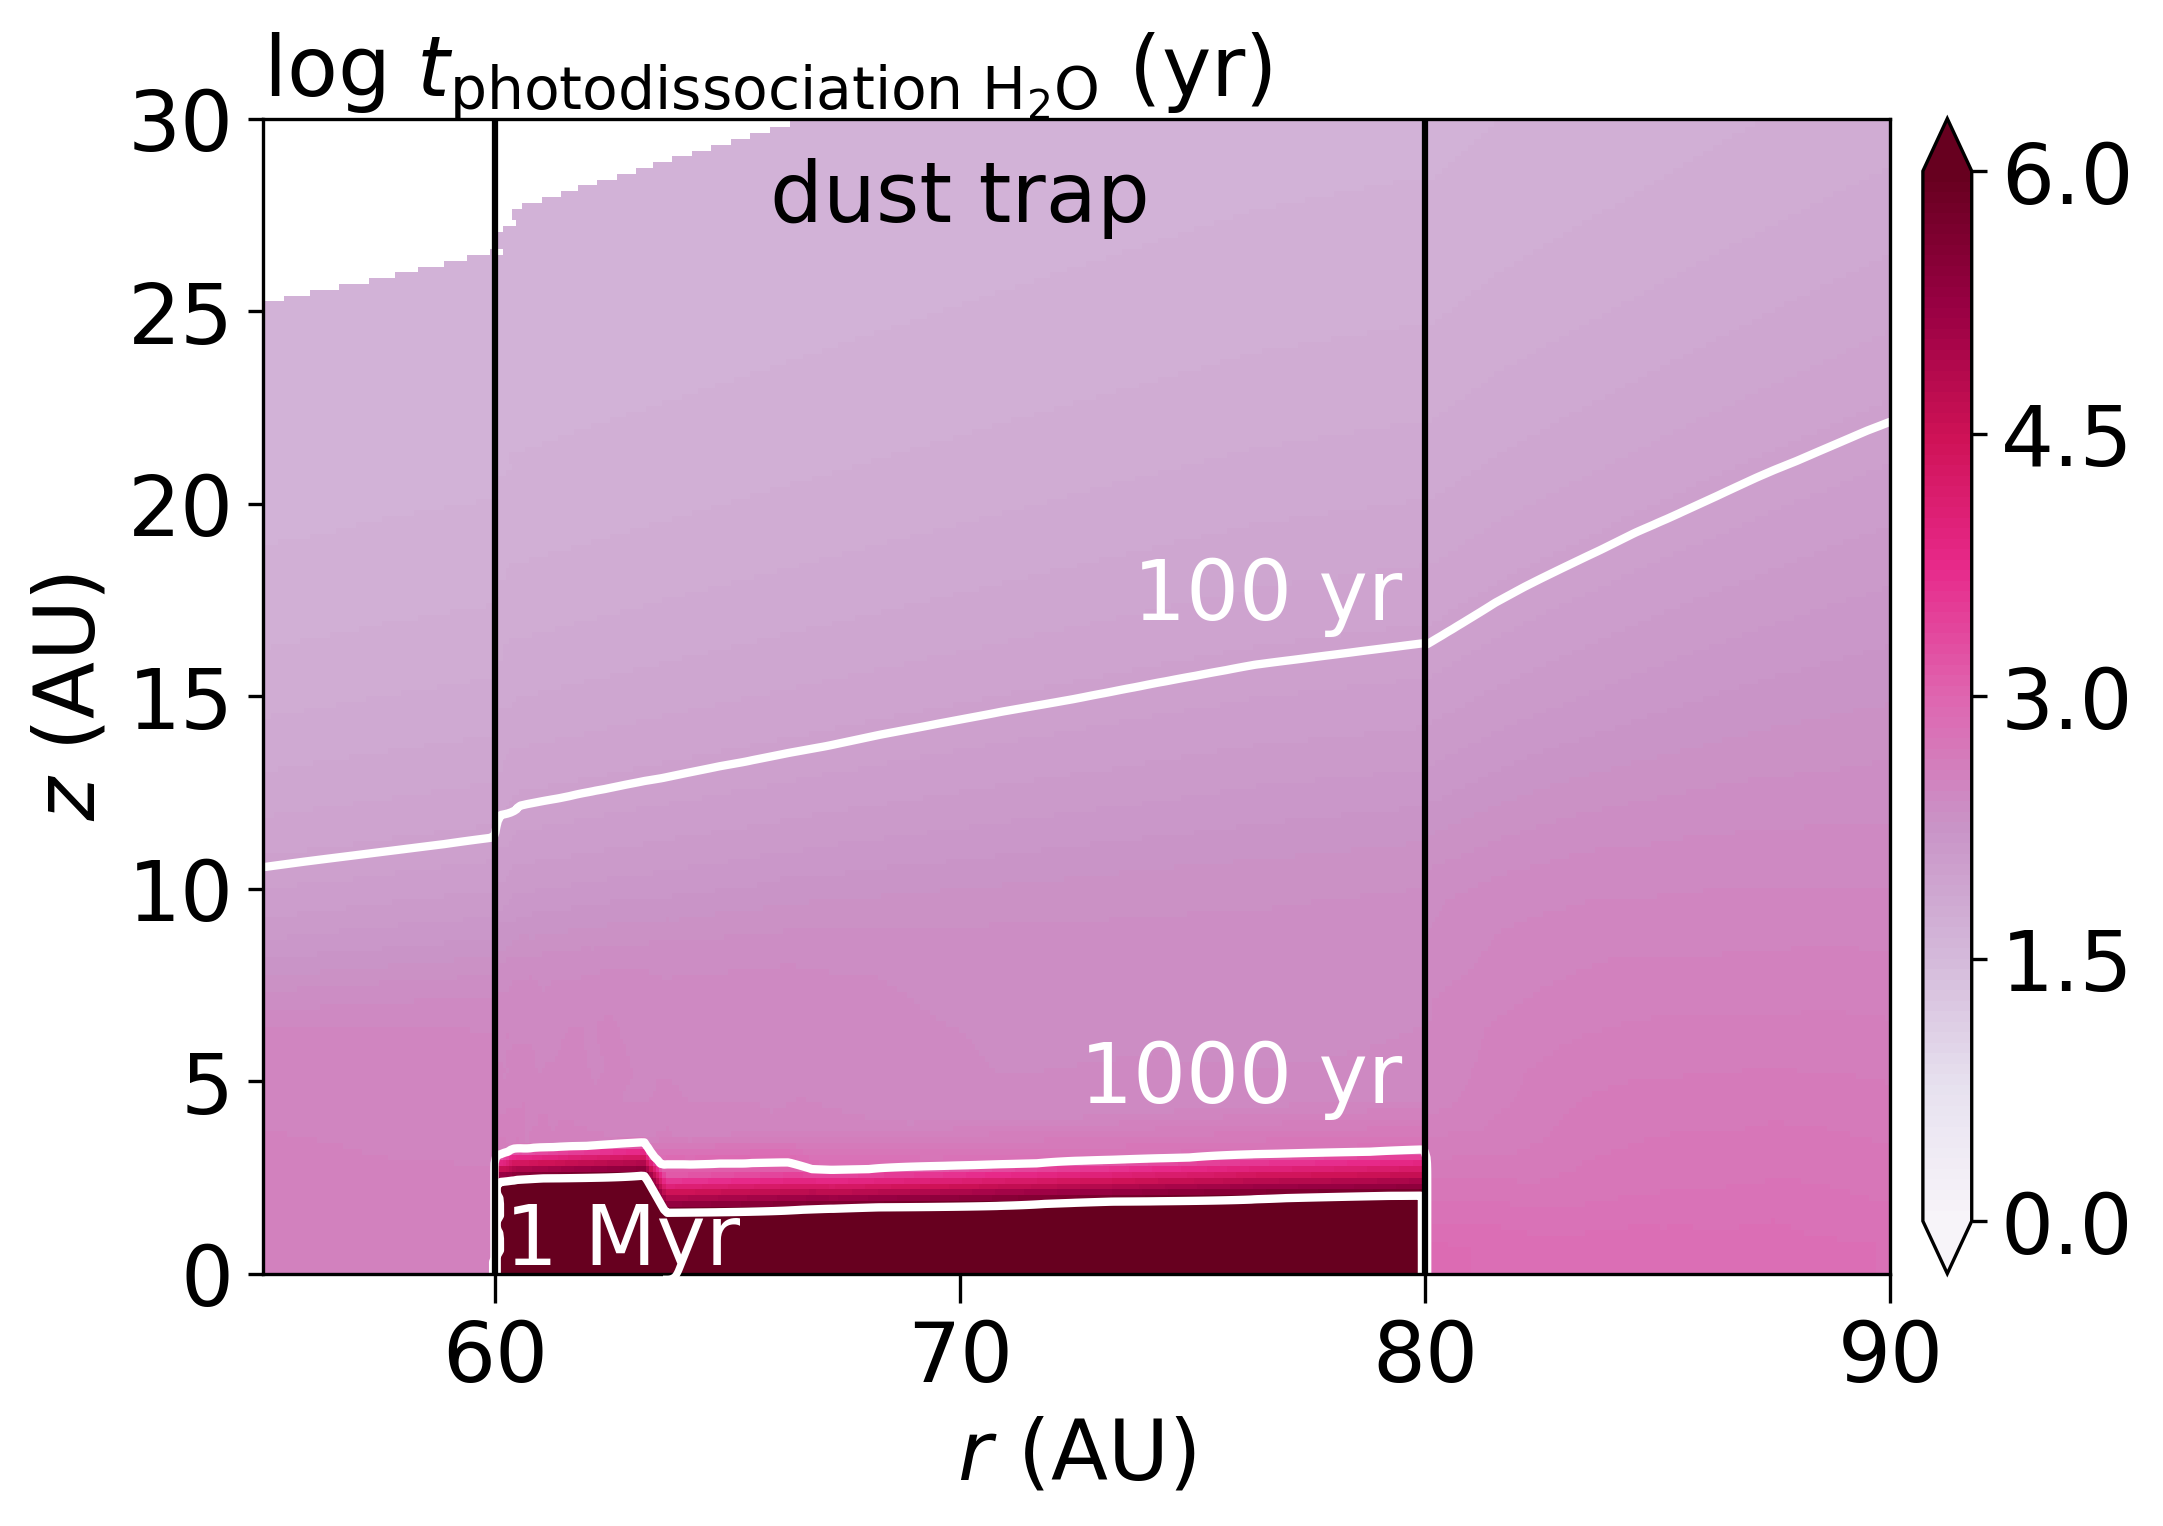

Observations of ices in young stellar objects and in comets show that oxygen is primarily locked up in water ice, whereas nitrogen is mostly in \ceNH3 ice (Boogert et al., 2015; Rubin et al., 2019). The gas-phase detections of \ceCH3OH, \ceH2CO, SO, \ceSO2, and other complex organic molecules in the IRS 48 disk show that the dust trap is an ice trap (Paper I and II, Booth et al., 2021). Therefore, \ceH2O ice is also likely sublimating above the dust trap. The photodissociation timescale of water is presented in Fig. 10 using a photodissociation rate attenuated by grown dust particles appropriate for protoplanetary disks:
| (10) |
with the photodissociation timescale, s-1 the photodissociation rate of \ceH2O, the second order exponential integral, the dust shielding factor for \ceH2O for large grains, and the visual extinction (Heays et al., 2017). Water dissociates in less than years just above the dust trap and in less than 100 years for the layers above the dust trap at AU, providing a reservoir of OH that is partially used to form NO.
Increasing the initial ice and thus gas-phase water abundance by a factor of 2 and 5 only increases the NO column density with a factor of , up to a peak column density of cm-2 as presented in the top left panel of Fig. 11. This is still an order of magnitude smaller than the NO column density found from the observations. Thus, much higher initial abundances of water ice, translating into enhanced gas-phase water would be needed to explain the NO column density. However, this is inconsistent with the upper limit on the warm \ceH2O and OH column density derived from the Herschel PACS observations, suggesting that a different formation pathway of NO is dominant.
The column density of warm ( K) water predicted by the fiducial model and the models with additional \ceH2O is a factor of higher than the upper limit derived from Herschel at that temperature, see Figs. 4, 25, and 26. Similarly, the warm OH column density is a factor of higher than its observed upper limit. Additionally, the upper limit on the CN column density constrains the minimum initial water abundance to be if all nitrogen starts as \ceN2 and if this is not the case. This is because lower water abundances overproduce the upper limit on the CN column density (see Fig. 23). Hence, the C/O is constrained to be (if all nitrogen starts as \ceN2) or (if some nitrogen starts as N or \ceNH3) at the dust trap. Thus, sublimating water alone cannot explain the high NO column density.
The second pathway to NO in the model is through NH. In the disk surface layers, NH is created by the reaction of N with vibrationally excited \ceH2, but in the dust trap it could be created through sublimating \ceNH3 that photodissociates. This is modelled as an additional gas-phase \ceNH3 abundance of . At the dust trap edge and in the bulk of the dust trap, the NO column density predicted by these models is a factor of lower than that derived from the observations (see second row in Fig. 11). Additionally, the highest initial \ceNH3 abundance of matches the upper limit on the CN column density so the abundance cannot be higher. Finally, the observed NO emission predicted by these models is an order of magnitude too low (second row of Fig. 11).
All in all, adding gas-phase water or adding gas-phase \ceNH3 leads to an increase in the NO column density, but neither pathway is sufficient to explain the observed NO emission because the level required is inconsistent with the upper limits on OH, \ceH2O, and CN. In astronomical ices the abundance of \ceNH3 with respect to water is typically 5% (Boogert et al., 2015). This is modelled by adding a water abundance of and and an \ceNH3 abundance that is 5% of that to the fiducial initial water abundance of and initial \ceNH3 abundance of 0 (i.e., increasing water by a factor of 2 and 5 and increasing \ceNH3 accordingly to and ). The results are very similar to just adding \ceNH3 and can be seen in the third row of Fig. 11. In summary, sublimating \ceH2O and/or \ceNH3 ices alone cannot explain the NO observations, even if the NO inside the dust trap would be mixed up to higher layers.
4.3 Effect of sublimating ices: additional NO
The formation pathways to form NO from simple molecules are not efficient enough to explain the observations. Here, we investigate the opposite scenario: NO is the photodissociation product of a larger molecule with an NO bond that is frozen out in the dust trap. As our chemical network does not include species like this, we model this scenario as an initial NO abundance of , and . The resulting column densities are presented in the bottom left panel of Fig. 11. An initial NO abundance of results in an NO column density that matches that of the observations between 60 and 62 AU, but it underpredicts the column density by a factor of 4 in the bulk of the dust trap. Increasing the NO abundance by one and two additional orders of magnitude results in an NO column density that increases that same amount up to a peak NO column density of cm-2 and cm-2 respectively.
Only the model with an initial NO abundance of matches the observed NO emission (see bottom right panel of Fig. 11). The three NO lines in this model are optically thick with optical depth of . As the raytracer in DALI does not do line blending, we raytraced these lines separately and added the intensities of these three lines. If line blending was taken into account, the expected intensity of the three blended NO lines would be at least the intensity of 1 NO line raytraced separately, and at most the sum of the three NO lines raytraced separately. As the three NO lines have similar line strengths, the predicted line intensity is expected to be a factor of lower when line blending is taken into account. In the observations, the 351.044 GHz line can marginally be separated from the other two at 351.052 GHz. Therefore, the true NO intensity expected from this is expected to be a factor lower than that plotted in the bottom right panel of Fig. 11. The NO intensity in the model with an initial NO abundance of is only marginally optically thick with a maximum optical depth of 0.3. In summary, a high initial NO abundance is needed to match the observations within a factor of .
The discrepancy in the column density needed in the models compared to that derived from the observations is likely due to the different emitting layers. Fig. 12 shows that most of the NO is distributed inside the dust trap where the dust hides the NO emission. The NO column density above the surface is a few cm-2, which is consistent with the observations within a factor of 5. This factor of 5 could be due to beam dilution indicating that the true emitting region of NO is 5 times smaller than that assumed in Sect. 3.2. Therefore, the NO column density is higher than the inferred value of cm-2. Another possibility is that the initial NO abundance in the IRS 48 disk is lower at and that the NO located below the optically thick dust is mixed up to higher layers, which is not included in our models. Possible parent molecules that could photodissociate into NO are considered in Sect. 5.
4.4 Chemical composition of the non-dust trap side
In this section the chemical composition of the north side of the IRS 48 disk is explored. As the large grains with their icy mantles are trapped in the south, the north side of the disk could be depleted in gas-phase water. This is modelled as an initial abundance of gas-phase water of , , and . As these models start without atomic oxygen initially present, the main oxygen reservoir is CO with an abundance of w.r.t. hydrogen. The overall carbon ( w.r.t. hydrogen) and nitrogen abundances ( w.r.t. hydrogen) are identical to the fiducial model and follow the typical ISM values. The resulting column densities are presented in Fig. 27, 28, and 29. Interestingly, the upper limit on the CN column density is more constraining than that of NO in the north and also more constraining than that of \ceC2H. Depleting \ceH2O by a factor of 2 increases the CN column density by that same factor causing the model to be slightly lower than the derived upper limit. Depleting water with a factor of increases the CN column density to cm-2 in the bulk of the dust trap. This is consistent with the CN upper limit if all nitrogen initially starts as \ceN2. On the other hand, if nitrogen starts as solely N, solely \ceNH3 or a mix of \ceN2, N, and \ceNH3, the CN constrains the water abundance to be at least . Therefore the C/O ratio in this disk region is if all nitrogen is initially in \ceN2 and if not all nitrogen is initially in \ceN2.
5 Discussion
5.1 Possible parent molecules of NO
The NO emission is only seen at the location of the dust trap in the observations, indicating that the NO is directly related to the dust trap. Additionally, modelling of the IRS 48 dust trap has shown that an additional source of NO relative to the fiducial model is needed to explain the observations. As the photodissociation timescale in these surface layers of the disk is short, this NO is likely the photodissociation product of a larger molecule that carries an NO bond and is frozen out in the dust trap.
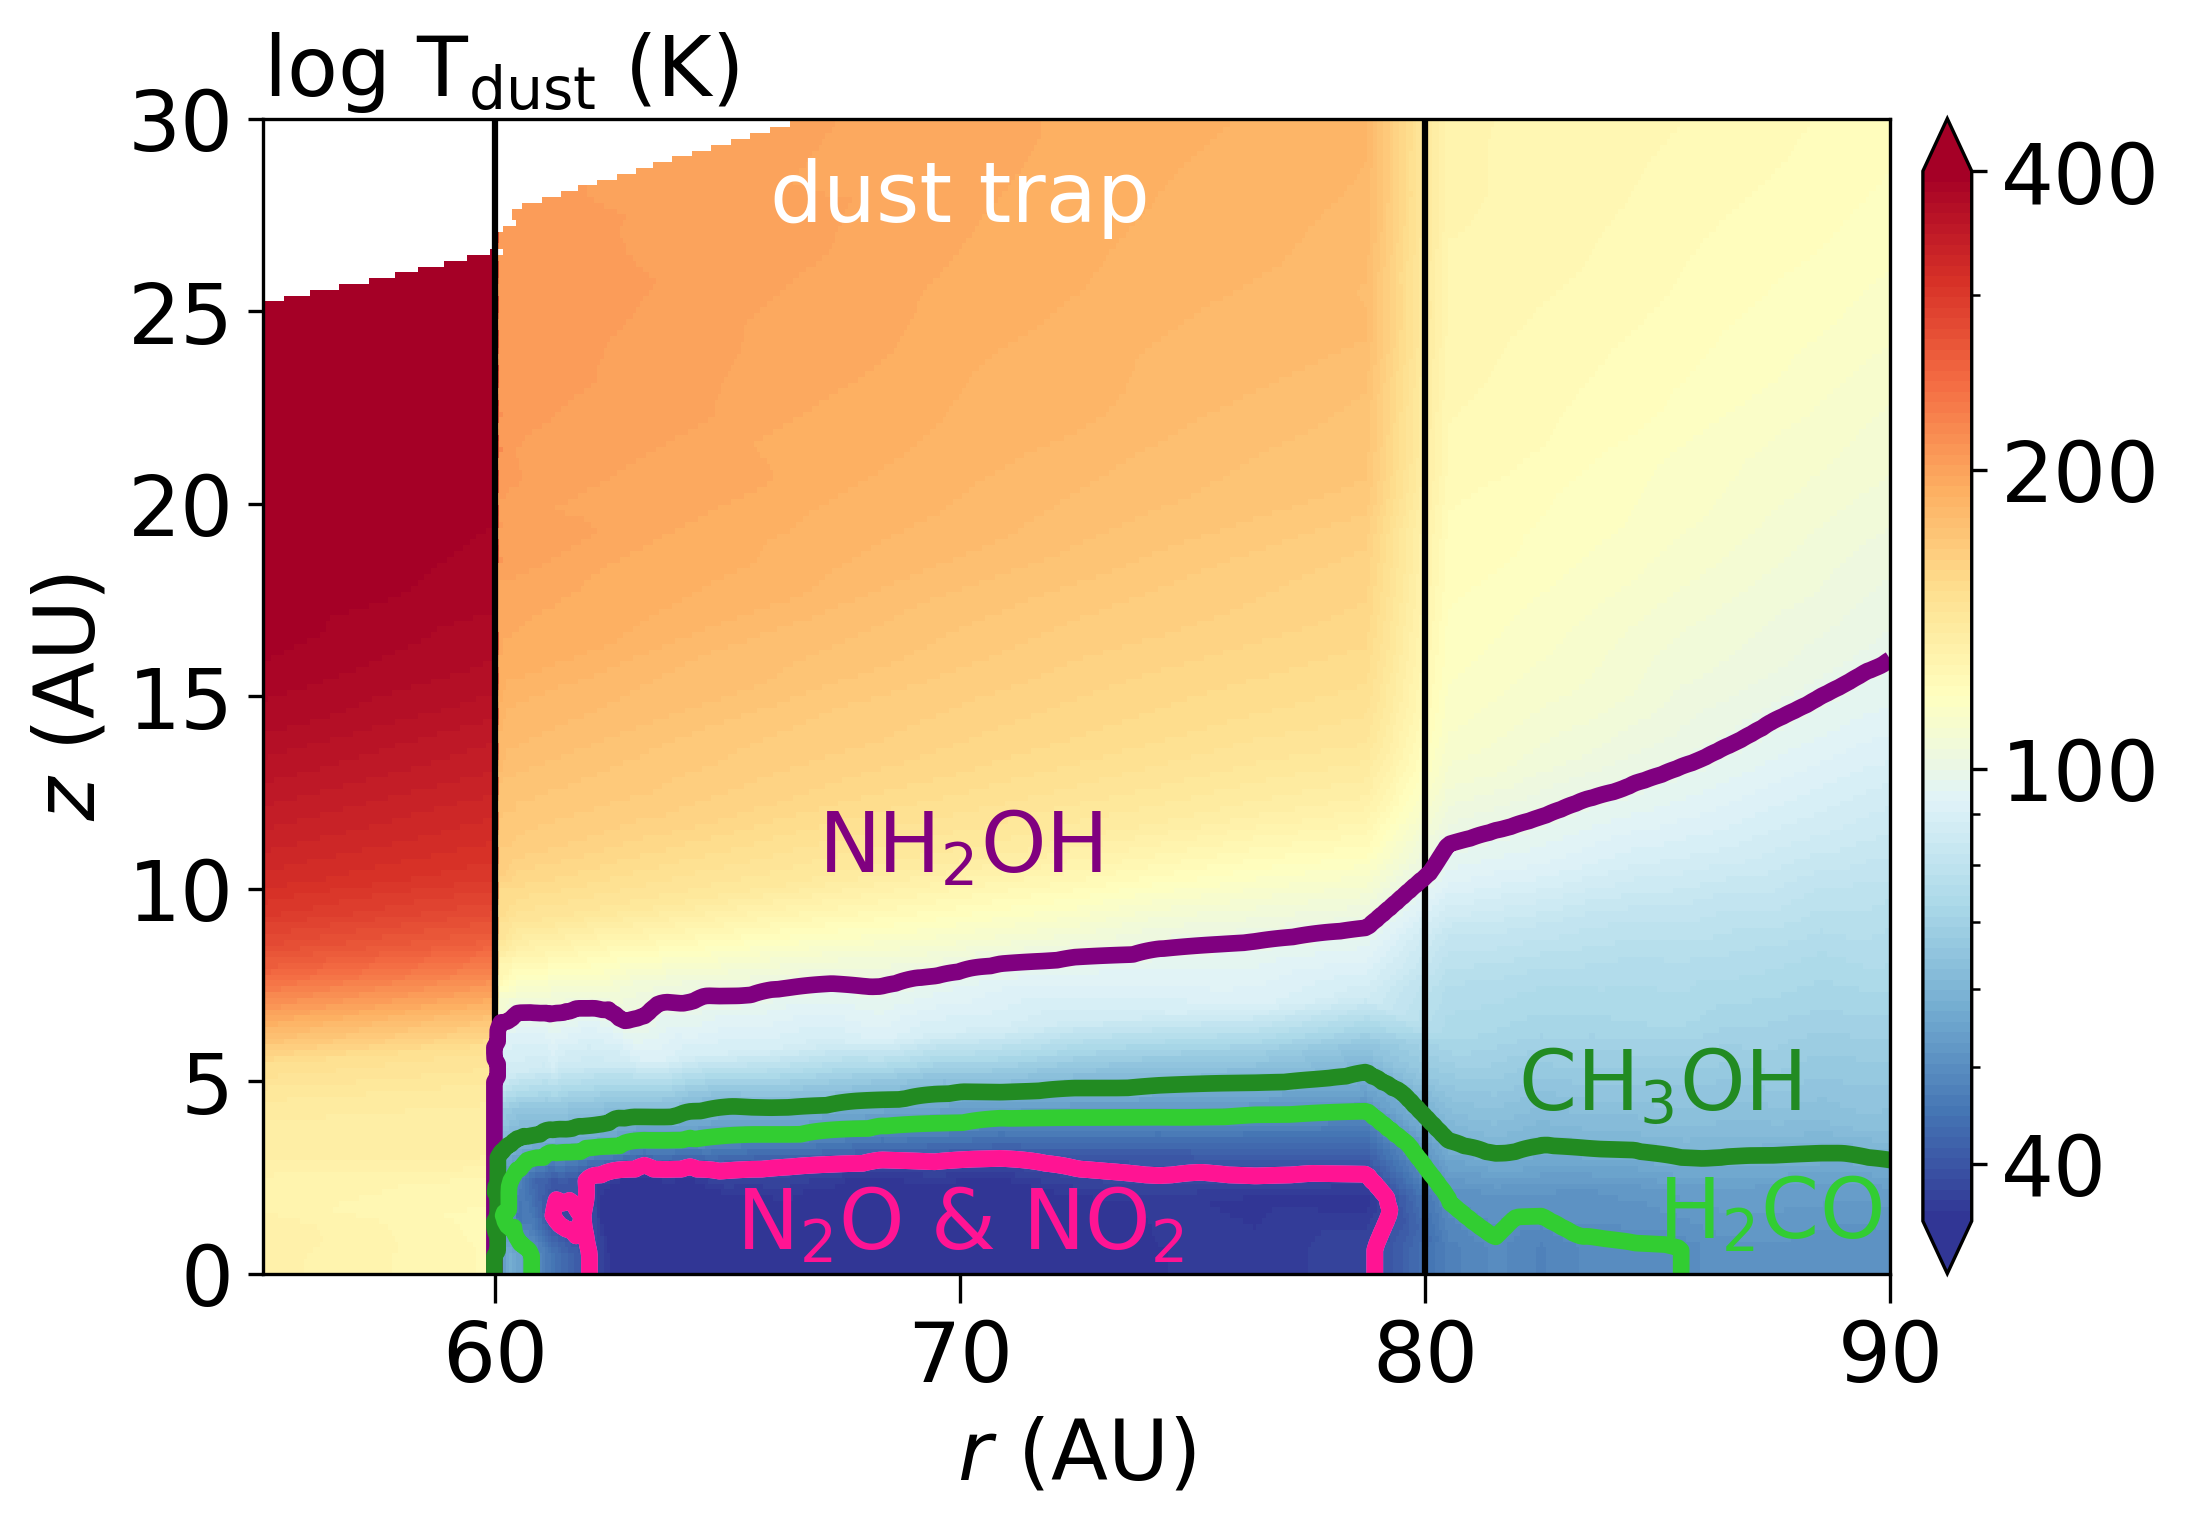
One candidate for this is \ceNH2OH that can be formed by hydrogenation of NO ice (Fedoseev et al., 2012). However, \ceNH2OH gas photodissociates primarily into \ceNH2 + OH (Betts & Back, 1965). The two-step photodissociation pathway to form NO is less efficient (Gericke et al., 1994; Fedoseev et al., 2016). Although \ceNH2OH has a higher binding energy of K (Penteado et al., 2017) than \ceCH3OH (3800 K), its snowline is only 5 AU higher, just above the region where \ceCH3OH is expected to be abundant in the models (see Fig. 13 and Paper I). The fact that \ceNH2OH is not detected in the IRS 48 disk with an upper limit on the column density that is 4 times lower than that of NO suggests that it is not present in the gas-phase. Furthermore, the only detection of \ceNH2OH in the ISM yields a low abundance of only a few (Rivilla et al., 2020). Therefore, \ceNH2OH, if present, likely remains frozen onto the dust grains. This together with only a minor route that produces NO after photodissociation, makes \ceNH2OH an unlikely parent molecule of the detected NO.
Three other molecules that photodissociate into NO are \ceN2O, \ceNO2, and HNO. No HNO lines are covered in our data so no constraint can be made on its column density. Its photodissociation cross section is s-1, which is 2 times smaller than that of NO. Therefore, HNO photodissociates slower than NO by that same factor. If HNO would be the parent molecule of NO, it would have to be at least twice as abundant to compensate for its faster photodissociation.
The upper limit on the \ceN2O column density is comparable to that of the detected NO emission in the south. Furthermore, the \ceN2O binding energy is K (Congiu et al., 2012; Ioppolo et al., 2014), which is lower than that of methanol. Therefore, if \ceN2O ice is present on the grains, it will sublimate and photodissociate in the gas into either NO + N or \ceN2 + O (van Dishoeck et al., 2006; Heays et al., 2017). As the photodissociation rate of \ceN2O is 5 times faster than that of NO, the formation of NO outpaces that of its destruction if \ceN2O photodissociation is the main pathway for NO. The additional atomic nitrogen slightly enhances the CN, but more importantly, the atomic nitrogen destroys part of the NO, lowering its column density compared to the NO = model by two orders of magnitude down to a peak value of cm-2. Therefore, \ceN2O could be the parent molecule of NO, but the high N abundance produced with it makes this unlikely.
NO2 is not detected with an upper limit that is an order of magnitude larger than that of NO. As it does photodissociate into NO, this could be the parent molecule of NO (van Dishoeck et al., 2006; Heays et al., 2017), but it cannot be excluded that other molecules not considered here are parents as well.
Another origin of the NO could be in \ceOCN- ice that has a typical abundance of 0.4% in low-mass young stellar objects and % w.r.t. \ceH2O in massive young stellar objects (van Broekhuizen et al., 2005; Öberg et al., 2011; Boogert et al., 2022). Additionally, \ceOCN- ice has recently been detected with an abundance of 0.3% w.r.t. \ceH2O in a cloud prior to star formation (McClure et al., 2023). \ceOCN- likely quickly reacts with hydrogen to form HNCO or possibly another molecule upon desorption. HNCO, as well as HCNO and HOCN have been detected in the gas-phase in molecular clouds (Marcelino et al., 2010). Photodissociation of HNCO could also lead to the formation of NO, but quantifying its contribution requires knowledge of its photodissociation cross section which has not been measured to date. In summary, multiple species that are frozen out on the grains in the IRS 48 dust trap could lead to the formation of NO in the gas-phase through photodissociation.
5.2 Comparison to other sources
In the IRS 48 disk we find NO/\ceN2O assuming that \ceN2O would emit at 100 K, similar to \ceCH3OH. This ratio is consistent with that of found in the giant molecular cloud Sgr B2(M) and (N) (Ziurys et al., 1994; Halfen et al., 2001) but it is inconsistent with the value of in the young protosolar analog IRAS 16293–2422B (Ligterink et al., 2018). This is interesting because both in IRAS 16293–2422B and in the IRS 48 disk the emission of many molecules is explained by sublimating ices. The difference in the NO/\ceN2O ratio could be due to chemical differences between the two sources.
In the comet 67P, most of the volatile nitrogen is locked up in \ceNH3 (Rubin et al., 2019) though its abundance is very low at only 0.67% compared to \ceH2O. Other nitrogen carriers in this comet include \ceN2 (13% all w.r.t. \ceNH3), HCN (21%), HNCO (4%), some minor contributions (%) of \ceNH2CHO, \ceCH3CN, and \ceHC3N. Furthermore, refractory ammonia salts (\ceNH_4^+X^-) or CHON particles in the dust grains on 67P may carry a large part of the total nitrogen budget (Rubin et al., 2019; Altwegg et al., 2020, 2022). Therefore, the NO emission in the IRS 48 disk could be enhanced by the sublimation of \ceNH3 but as we have shown with the models, this pathway alone is not sufficient to match the NO detection and the upper limit on the CN column density.
Another chemical difference between the IRS 48 disk and other sources arises from the \ceH2O to \ceCH3OH ratio, which is typically found to be in the ice on comets and on the dust around young stellar objects (Bottinelli et al., 2010; Boogert et al., 2015). In contrast, this ratio is only in the gas in the IRS 48 disk. This suggests that this ratio is very low in the ices in the IRS 48 dust trap or that the gas seen in the IRS 48 disk does not directly trace the ice abundances. The gas-phase \ceH2O to \ceCH3OH ratio could be modified compared to that in the ices due to photodissociation and (a lack of) subsequent formation. \ceH2O photodissociates 2 times slower than \ceCH3OH (Heays et al., 2017), increasing the expected \ceH2O to \ceCH3OH ratio in the gas w.r.t. that in the ice. Furthermore, \ceH2O is formed in the gas-phase through OH if the gas temperature exceeds 300 K, whereas \ceCH3OH does not have an efficient gas-phase formation route (Garrod et al., 2006; Geppert et al., 2006). This further increases the expected \ceH2O to \ceCH3OH ratio in the gas compared to that in the ice.
Additionally, this ratio is found to be 6 in the gas disk around the young outbursting source V883 Ori, using an \ceH_2^18O column density of cm-2 and an \ce^13CH3OH column density of cm-2 both scaled to their main isotopologues using \ce^12C/\ce^13C = 70 and \ce^16O/\ce^18O = 560 but uncorrected for the dust that may hide part of the line emission (Wilson & Rood, 1994; Milam et al., 2005; Lee et al., 2019; Tobin et al., 2023). The difference between the V883 Ori and IRS 48 disks could be due to a difference in the continuum optical depth. \ceH2O and \ceCH3OH are both observed at sub-mm wavelengths in the V883 Ori disk but in the IRS 48 disk \ceH2O observed at m and the \ceCH3OH observed at sub-mm wavelengths. Yet, the surface of the continuum at 100 m is located only 0.5 AU higher than that of the sub-mm. Therefore, the \ceH2O and \ceCH3OH observations probe up to very similar depths in the disk, suggesting that the optical depth of the 100 m continuum is underestimated or that there is a chemical difference between the IRS 48 dust trap and V883 Ori.
In the IRS 48 disk, our upper limit on the warm gaseous \ceH2O column density of cm-2 inside its snowline at 60 AU results in an upper limit on the abundance of w.r.t. hydrogen using the hydrogen column density of cm-2 at 60 AU in the DALI model based on the transition of \ceC^17O (Bruderer et al., 2014; van der Marel et al., 2016). This upper limit is consistent with the gas-phase \ceH2O abundance in the cold, photodesorbed reservoir located outside the water snowline in the HD 100546 and HD 163293 disks that is low due to radial drift. It is not consistent with the abundance of warm gas-phase water in the inner disk (inside the water snowline) of HD 163296 (Pirovano et al., 2022).
The lack of CN emission in this disk constrains its C/O ratio to be both inside and outside the dust trap. In the south, this is in line with the C/O ratio that is expected for gas dominated by sublimating ices (Öberg et al., 2011). Yet, in the north side of the disk where no direct evidence of sublimating ices is seen, a low C/O of is more surprising as gas depleted in volatiles has a high C/O ratio of . Therefore, the low C/O ratio suggests that also the gas in the north side of the disk could be affected by ices that sublimated and then photodissociated. If this is the case, the dust trap must be relatively old such that the gas in the disk has either mixed or the dust trap has at least made one more full orbit than the sub-Keplerian gas.
6 Conclusions
In this work, we investigated the chemical origin of the first detection of NO in a disk. The special case of the IRS 48 dust trap allows us to investigate its origin, as this disk is a unique laboratory for sublimating ices. The NO column density and emission were modelled using the thermochemical code DALI with a nitrogen chemistry network. The effects of sublimating \ceH2O and \ceNH3 ices were investigated as well as the effect of sublimation of larger molecules that carry an NO bond. In summary, we conclude:
-
NO in the observations is co-located with the IRS 48 dust trap in the south, and it is not detected in the north.
-
Models indicate that the dust temperature in the dust trap midplane is up to 30 K colder than the non-dust trap side of the disk.
-
The fiducial model for the north side of the disk is consistent with the observations, but the fiducial model for the south side (dust trap location) underpredicts the NO column density by an order of magnitude.
-
Sublimating water and/or \ceNH3 enhance the NO column density up to a factor of , but the observed NO emission is still not reproduced. These models overproduce the upper limits on \ceH2O, OH column densities. The upper limit on the CN emission constrains the \ceNH3 abundance to be . Therefore, the high NO column density cannot be explained by sublimation of these molecules.
-
An additional source of NO is needed to explain the observations. This is likely a molecule that carries an NO bond and freezes out in the dust trap midplane but sublimates in the higher layers of the disk. Possible candidates could be \ceN2O and HNCO.
-
The C/O ratio in this disk is both in the dust trap side and in the non-dust trap side due to the lack of CN emission, if not all nitrogen is initially in \ceN2. If all nitrogen is initially in \ceN2, the C/O ratio is .
The observed line emission from NO and COMs are co-spatial with the asymmetric dust trap in the IRS 48 disk. This coincidence strongly suggests a direct relation between the detected gas-phase molecules and mm dust grains which are expected host an ice reservoir. The first detection of NO in a protoplanetary disk opens a new opportunity for studying the C/O ratio in disks using NO and CN. Future observations targeting other nitrogen bearing molecules are needed to further constrain the parent molecule that is forming the NO and characterise the partitioning of volatile nitrogen in this disk.
Acknowledgements.
We thank the referee for the constructive comments. Furthermore, we would like to thank A. D. Bosman for the useful discussions. We acknowledge assistance from Allegro, the European ALMA Regional Centre node in the Netherlands. Astrochemistry in Leiden is supported by the Netherlands Research School for Astronomy (NOVA), by funding from the European Research Council (ERC) under the European Union’s Horizon 2020 research and innovation programme (grant agreement No. 101019751 MOLDISK), and by the Dutch Research Council (NWO) grant 618.000.001. BT acknowledges support from the Dutch Astrochemistry Network II, grant 648.000.022 from the Dutch Research Council (NWO). N.F.W.L. acknowledges funding by the Swiss National Science Foundation Ambizione grant 193453. This paper makes use of the following ALMA data: ADS/JAO.ALMA #2013.1.00100.S and #2017.1.00834.S. ALMA is a partnership of ESO (representing its member states), NSF (USA) and NINS (Japan), together with NRC (Canada), MOST and ASIAA (Taiwan), and KASI (Republic of Korea), in cooperation with the Republic of Chile. The Joint ALMA Observatory is operated by ESO, AUI/NRAO and NAOJ.References
- Alexander et al. (2014) Alexander, R., Pascucci, I., Andrews, S., Armitage, P., & Cieza, L. 2014, in Protostars and Planets VI, ed. H. Beuther, R. S. Klessen, C. P. Dullemond, & T. Henning, 475
- Altwegg et al. (2020) Altwegg, K., Balsiger, H., Hänni, N., et al. 2020, Nature Astronomy, 4, 533
- Altwegg et al. (2022) Altwegg, K., Combi, M., Fuselier, S. A., et al. 2022, MNRAS, 516, 3900
- Andrews (2020) Andrews, S. M. 2020, ARA&A, 58, 483
- Bergin et al. (2016) Bergin, E. A., Du, F., Cleeves, L. I., et al. 2016, ApJ, 831, 101
- Bergner et al. (2019) Bergner, J. B., Öberg, K. I., Bergin, E. A., et al. 2019, ApJ, 876, 25
- Bergner et al. (2021) Bergner, J. B., Öberg, K. I., Guzmán, V. V., et al. 2021, ApJS, 257, 11
- Betts & Back (1965) Betts, J. & Back, R. A. 1965, Canadian Journal of Chemistry, 43, 2678
- Boogert et al. (2022) Boogert, A. C. A., Brewer, K., Brittain, A., & Emerson, K. S. 2022, arXiv e-prints, arXiv:2210.12639
- Boogert et al. (2015) Boogert, A. C. A., Gerakines, P. A., & Whittet, D. C. B. 2015, ARA&A, 53, 541
- Booth et al. (2021) Booth, A. S., van der Marel, N., Leemker, M., van Dishoeck, E. F., & Ohashi, S. 2021, A&A, 651, L6
- Bosman et al. (2021) Bosman, A. D., Alarcón, F., Bergin, E. A., et al. 2021, ApJS, 257, 7
- Boss (1997) Boss, A. P. 1997, Science, 276, 1836
- Bottinelli et al. (2010) Bottinelli, S., Boogert, A. C. A., Bouwman, J., et al. 2010, ApJ, 718, 1100
- Bowman & de Lucia (1982) Bowman, W. C. & de Lucia, F. C. 1982, J. Chem. Phys., 77, 92
- Brown et al. (2012) Brown, J. M., Herczeg, G. J., Pontoppidan, K. M., & van Dishoeck, E. F. 2012, ApJ, 744, 116
- Bruderer (2013) Bruderer, S. 2013, A&A, 559, A46
- Bruderer et al. (2010) Bruderer, S., Benz, A. O., van Dishoeck, E. F., et al. 2010, A&A, 521, L44
- Bruderer et al. (2014) Bruderer, S., van der Marel, N., van Dishoeck, E. F., & van Kempen, T. A. 2014, A&A, 562, A26
- Bruderer et al. (2012) Bruderer, S., van Dishoeck, E. F., Doty, S. D., & Herczeg, G. J. 2012, A&A, 541, A91
- Brunken et al. (2022) Brunken, N. G. C., Booth, A. S., Leemker, M., et al. 2022, A&A, 659, A29
- Burrus & Gordy (1956) Burrus, C. A. & Gordy, W. 1956, Physical Review, 101, 599
- Cazzoletti et al. (2018) Cazzoletti, P., van Dishoeck, E. F., Visser, R., Facchini, S., & Bruderer, S. 2018, A&A, 609, A93
- Collings et al. (2004) Collings, M. P., Anderson, M. A., Chen, R., et al. 2004, MNRAS, 354, 1133
- Congiu et al. (2012) Congiu, E., Fedoseev, G., Ioppolo, S., et al. 2012, ApJ, 750, L12
- D’Alessio et al. (2006) D’Alessio, P., Calvet, N., Hartmann, L., Franco-Hernández, R., & Servín, H. 2006, ApJ, 638, 314
- Daranlot et al. (2012) Daranlot, J., Hincelin, U., Bergeat, A., et al. 2012, Proceedings of the National Academy of Science, 109, 10233
- Dutrey et al. (2011) Dutrey, A., Wakelam, V., Boehler, Y., et al. 2011, A&A, 535, A104
- Endres et al. (2016) Endres, C. P., Schlemmer, S., Schilke, P., Stutzki, J., & Müller, H. S. P. 2016, Journal of Molecular Spectroscopy, 327, 95
- Evans et al. (2009) Evans, Neal J., I., Dunham, M. M., Jørgensen, J. K., et al. 2009, ApJS, 181, 321
- Facchini et al. (2021) Facchini, S., Teague, R., Bae, J., et al. 2021, AJ, 162, 99
- Fedele et al. (2013) Fedele, D., Bruderer, S., van Dishoeck, E. F., et al. 2013, A&A, 559, A77
- Fedoseev et al. (2016) Fedoseev, G., Chuang, K. J., van Dishoeck, E. F., Ioppolo, S., & Linnartz, H. 2016, MNRAS, 460, 4297
- Fedoseev et al. (2012) Fedoseev, G., Ioppolo, S., Lamberts, T., et al. 2012, J. Chem. Phys., 137, 054714
- Fogel et al. (2011) Fogel, J. K. J., Bethell, T. J., Bergin, E. A., Calvet, N., & Semenov, D. 2011, ApJ, 726, 29
- Follette et al. (2015) Follette, K. B., Grady, C. A., Swearingen, J. R., et al. 2015, ApJ, 798, 132
- Fraser et al. (2001) Fraser, H. J., Collings, M. P., McCoustra, M. R. S., & Williams, D. A. 2001, MNRAS, 327, 1165
- Gaia Collaboration et al. (2018) Gaia Collaboration, Brown, A. G. A., Vallenari, A., et al. 2018, A&A, 616, A1
- Garrod et al. (2006) Garrod, R., Park, I. H., Caselli, P., & Herbst, E. 2006, Faraday Discussions, 133, 51
- Garrod & Herbst (2006) Garrod, R. T. & Herbst, E. 2006, A&A, 457, 927
- Geers et al. (2007) Geers, V. C., Pontoppidan, K. M., van Dishoeck, E. F., et al. 2007, A&A, 469, L35
- Geppert et al. (2006) Geppert, W. D., Hamberg, M., Thomas, R. D., et al. 2006, Faraday Discussions, 133, 177
- Gericke et al. (1994) Gericke, K. H., Lock, M., Schmidt, F., & Comes, F. J. 1994, J. Chem. Phys., 101, 1988
- Goldsmith & Langer (1999) Goldsmith, P. F. & Langer, W. D. 1999, ApJ, 517, 209
- Guzmán et al. (2021) Guzmán, V. V., Bergner, J. B., Law, C. J., et al. 2021, ApJS, 257, 6
- Hacar et al. (2020) Hacar, A., Bosman, A. D., & van Dishoeck, E. F. 2020, A&A, 635, A4
- Haisch et al. (2001) Haisch, Karl E., J., Lada, E. A., & Lada, C. J. 2001, ApJ, 553, L153
- Halfen et al. (2001) Halfen, D. T., Apponi, A. J., & Ziurys, L. M. 2001, ApJ, 561, 244
- Hartmann et al. (1998) Hartmann, L., Calvet, N., Gullbring, E., & D’Alessio, P. 1998, ApJ, 495, 385
- He et al. (2015) He, J., Vidali, G., Lemaire, J.-L., & Garrod, R. T. 2015, ApJ, 799, 49
- Heays et al. (2017) Heays, A. N., Bosman, A. D., & van Dishoeck, E. F. 2017, A&A, 602, A105
- Hily-Blant et al. (2010) Hily-Blant, P., Walmsley, M., Pineau Des Forêts, G., & Flower, D. 2010, A&A, 513, A41
- Howard et al. (2013) Howard, C. D., Sandell, G., Vacca, W. D., et al. 2013, ApJ, 776, 21
- Huang et al. (2018) Huang, J., Andrews, S. M., Dullemond, C. P., et al. 2018, ApJ, 869, L42
- Imanishi et al. (2001) Imanishi, K., Koyama, K., & Tsuboi, Y. 2001, ApJ, 557, 747
- Ioppolo et al. (2014) Ioppolo, S., Fedoseev, G., Minissale, M., et al. 2014, Physical Chemistry Chemical Physics (Incorporating Faraday Transactions), 16, 8270
- Isella et al. (2016) Isella, A., Guidi, G., Testi, L., et al. 2016, Phys. Rev. Lett., 117, 251101
- Jonusas & Krim (2016) Jonusas, M. & Krim, L. 2016, MNRAS, 459, 1977
- Kama et al. (2016) Kama, M., Bruderer, S., van Dishoeck, E. F., et al. 2016, A&A, 592, A83
- Klapper et al. (2000) Klapper, G., Lewen, F., Gendriesch, R., Belov, S. P., & Winnewisser, G. 2000, Journal of Molecular Spectroscopy, 201, 124
- Law et al. (2021) Law, C. J., Loomis, R. A., Teague, R., et al. 2021, ApJS, 257, 3
- Le Gal et al. (2014) Le Gal, R., Hily-Blant, P., Faure, A., et al. 2014, A&A, 562, A83
- Le Gal et al. (2021) Le Gal, R., Öberg, K. I., Teague, R., et al. 2021, ApJS, 257, 12
- Lee et al. (2019) Lee, J.-E., Lee, S., Baek, G., et al. 2019, Nature Astronomy, 3, 314
- Ligterink et al. (2018) Ligterink, N. F. W., Calcutt, H., Coutens, A., et al. 2018, A&A, 619, A28
- Lique et al. (2009) Lique, F., van der Tak, F. F. S., Kłos, J., Bulthuis, J., & Alexander, M. H. 2009, A&A, 493, 557
- Long et al. (2021) Long, F., Bosman, A. D., Cazzoletti, P., et al. 2021, A&A, 647, A118
- Long et al. (2018) Long, F., Pinilla, P., Herczeg, G. J., et al. 2018, ApJ, 869, 17
- Lynden-Bell & Pringle (1974) Lynden-Bell, D. & Pringle, J. E. 1974, MNRAS, 168, 603
- Marcelino et al. (2010) Marcelino, N., Brünken, S., Cernicharo, J., et al. 2010, A&A, 516, A105
- Maret et al. (2006) Maret, S., Bergin, E. A., & Lada, C. J. 2006, Nature, 442, 425
- Mathis et al. (1977) Mathis, J. S., Rumpl, W., & Nordsieck, K. H. 1977, ApJ, 217, 425
- McClure et al. (2020) McClure, M. K., Dominik, C., & Kama, M. 2020, A&A, 642, L15
- McClure et al. (2023) McClure, M. K., Rocha, W. R. M., Pontoppidan, K. M., et al. 2023, Nature Astronomy [arXiv:2301.09140]
- McMullin et al. (2007) McMullin, J. P., Waters, B., Schiebel, D., Young, W., & Golap, K. 2007, in Astronomical Society of the Pacific Conference Series, Vol. 376, Astronomical Data Analysis Software and Systems XVI, ed. R. A. Shaw, F. Hill, & D. J. Bell, 127
- Meheut et al. (2013) Meheut, H., Lovelace, R. V. E., & Lai, D. 2013, MNRAS, 430, 1988
- Milam et al. (2005) Milam, S. N., Savage, C., Brewster, M. A., Ziurys, L. M., & Wyckoff, S. 2005, ApJ, 634, 1126
- Millar et al. (1991) Millar, T. J., Bennett, A., Rawlings, J. M. C., Brown, P. D., & Charnley, S. B. 1991, A&AS, 87, 585
- Miotello et al. (2019) Miotello, A., Facchini, S., van Dishoeck, E. F., et al. 2019, A&A, 631, A69
- Müller et al. (2005) Müller, H. S. P., Schlöder, F., Stutzki, J., & Winnewisser, G. 2005, Journal of Molecular Structure, 742, 215
- Müller et al. (2001) Müller, H. S. P., Thorwirth, S., Roth, D. A., & Winnewisser, G. 2001, A&A, 370, L49
- Murillo et al. (2013) Murillo, N. M., Lai, S.-P., Bruderer, S., Harsono, D., & van Dishoeck, E. F. 2013, A&A, 560, A103
- Nomura et al. (2021) Nomura, H., Tsukagoshi, T., Kawabe, R., et al. 2021, ApJ, 914, 113
- Öberg & Bergin (2021) Öberg, K. I. & Bergin, E. A. 2021, Phys. Rep, 893, 1
- Öberg et al. (2021) Öberg, K. I., Guzmán, V. V., Walsh, C., et al. 2021, ApJS, 257, 1
- Öberg et al. (2011) Öberg, K. I., Murray-Clay, R., & Bergin, E. A. 2011, ApJ, 743, L16
- Ohashi et al. (2020) Ohashi, S., Kataoka, A., van der Marel, N., et al. 2020, ApJ, 900, 81
- Paardekooper & Mellema (2006) Paardekooper, S. J. & Mellema, G. 2006, A&A, 453, 1129
- Paneque-Carreño et al. (2022) Paneque-Carreño, T., Miotello, A., van Dishoeck, E. F., et al. 2022, A&A, 666, A168
- Penteado et al. (2017) Penteado, E. M., Walsh, C., & Cuppen, H. M. 2017, ApJ, 844, 71
- Pickett et al. (1998) Pickett, H. M., Poynter, R. L., Cohen, E. A., et al. 1998, J. Quant. Spec. Radiat. Transf., 60, 883
- Pinilla et al. (2012) Pinilla, P., Benisty, M., & Birnstiel, T. 2012, A&A, 545, A81
- Pinilla et al. (2017) Pinilla, P., Pohl, A., Stammler, S. M., & Birnstiel, T. 2017, ApJ, 845, 68
- Pirovano et al. (2022) Pirovano, L. M., Fedele, D., van Dishoeck, E. F., et al. 2022, arXiv e-prints, arXiv:2207.10744
- Redhead (1962) Redhead, P. A. 1962, Vacuum, 12, 203
- Regály et al. (2012) Regály, Z., Juhász, A., Sándor, Z., & Dullemond, C. P. 2012, MNRAS, 419, 1701
- Rice et al. (2006) Rice, W. K. M., Armitage, P. J., Wood, K., & Lodato, G. 2006, MNRAS, 373, 1619
- Rivilla et al. (2020) Rivilla, V. M., Martín-Pintado, J., Jiménez-Serra, I., et al. 2020, ApJ, 899, L28
- Rubin et al. (2019) Rubin, M., Altwegg, K., Balsiger, H., et al. 2019, MNRAS, 489, 594
- Salyk et al. (2013) Salyk, C., Herczeg, G. J., Brown, J. M., et al. 2013, ApJ, 769, 21
- Sastry et al. (1981) Sastry, K. V. L. N., Helminger, P., Charo, A., Herbst, E., & De Lucia, F. C. 1981, ApJ, 251, L119
- Schöier et al. (2005) Schöier, F. L., van der Tak, F. F. S., van Dishoeck, E. F., & Black, J. H. 2005, A&A, 432, 369
- Schwarz & Bergin (2014) Schwarz, K. R. & Bergin, E. A. 2014, ApJ, 797, 113
- Schworer et al. (2017) Schworer, G., Lacour, S., Huélamo, N., et al. 2017, ApJ, 842, 77
- Semenov et al. (2018) Semenov, D., Favre, C., Fedele, D., et al. 2018, A&A, 617, A28
- Semmoud-Monnanteuil et al. (1989) Semmoud-Monnanteuil, N., Colmont, J. M., Perrin, A., Flaud, J. M., & Camy-Peyret, C. 1989, Journal of Molecular Spectroscopy, 134, 176
- Skatrud et al. (1983) Skatrud, D. D., De Lucia, F. C., Blake, G. A., & Sastry, K. V. L. N. 1983, Journal of Molecular Spectroscopy, 99, 35
- Stammler et al. (2017) Stammler, S. M., Birnstiel, T., Panić, O., Dullemond, C. P., & Dominik, C. 2017, A&A, 600, A140
- Stevenson & Lunine (1988) Stevenson, D. J. & Lunine, J. I. 1988, Icarus, 75, 146
- Suzuki et al. (2016) Suzuki, T. K., Ogihara, M., Morbidelli, A., Crida, A., & Guillot, T. 2016, A&A, 596, A74
- Teague (2020) Teague, R. 2020, richteague/keplerian_mask: Initial Release
- Thi et al. (2010) Thi, W. F., Mathews, G., Ménard, F., et al. 2010, A&A, 518, L125
- Tobin et al. (2012) Tobin, J. J., Hartmann, L., Chiang, H.-F., et al. 2012, Nature, 492, 83
- Tobin et al. (2023) Tobin, J. J., van ’t Hoff, M. L. R., Leemker, M., et al. 2023, Nature, accepted
- Tsegaw et al. (2017) Tsegaw, Y. A., Góbi, S., Förstel, M., et al. 2017, Journal of Physical Chemistry A, 121, 7477
- Tsunekawa (1972) Tsunekawa, S. 1972, Journal of the Physical Society of Japan, 33, 167
- van Broekhuizen et al. (2005) van Broekhuizen, F. A., Pontoppidan, K. M., Fraser, H. J., & van Dishoeck, E. F. 2005, A&A, 441, 249
- van der Marel et al. (2021a) van der Marel, N., Booth, A. S., Leemker, M., van Dishoeck, E. F., & Ohashi, S. 2021a, A&A, 651, L5
- van der Marel et al. (2021b) van der Marel, N., Bosman, A. D., Krijt, S., Mulders, G. D., & Bergner, J. B. 2021b, A&A, 653, L9
- van der Marel et al. (2016) van der Marel, N., van Dishoeck, E. F., Bruderer, S., et al. 2016, A&A, 585, A58
- van der Marel et al. (2013) van der Marel, N., van Dishoeck, E. F., Bruderer, S., et al. 2013, Science, 340, 1199
- van Dishoeck et al. (2006) van Dishoeck, E. F., Jonkheid, B., & van Hemert, M. C. 2006, Faraday Discussions, 133, 231
- van Kempen et al. (2009) van Kempen, T. A., van Dishoeck, E. F., Salter, D. M., et al. 2009, A&A, 498, 167
- van Terwisga et al. (2019) van Terwisga, S. E., van Dishoeck, E. F., Cazzoletti, P., et al. 2019, A&A, 623, A150
- Varberg et al. (1999) Varberg, T. D., Stroh, F., & Evenson, K. M. 1999, Journal of Molecular Spectroscopy, 196, 5
- Visser et al. (2018) Visser, R., Bruderer, S., Cazzoletti, P., et al. 2018, A&A, 615, A75
- Wakelam et al. (2017) Wakelam, V., Loison, J. C., Mereau, R., & Ruaud, M. 2017, Molecular Astrophysics, 6, 22
- Walsh et al. (2015) Walsh, C., Nomura, H., & van Dishoeck, E. 2015, A&A, 582, A88
- Weaver et al. (2018) Weaver, E., Isella, A., & Boehler, Y. 2018, ApJ, 853, 113
- Wei et al. (2019) Wei, C.-E., Nomura, H., Lee, J.-E., et al. 2019, ApJ, 870, 129
- Whipple (1972) Whipple, F. L. 1972, in From Plasma to Planet, ed. A. Elvius, 211
- Wilson & Rood (1994) Wilson, T. L. & Rood, R. 1994, ARA&A, 32, 191
- Woodall et al. (2007) Woodall, J., Agúndez, M., Markwick-Kemper, A. J., & Millar, T. J. 2007, A&A, 466, 1197
- Yıldız et al. (2013) Yıldız, U. A., Acharyya, K., Goldsmith, P. F., et al. 2013, A&A, 558, A58
- Zhang et al. (2021) Zhang, K., Booth, A. S., Law, C. J., et al. 2021, ApJS, 257, 5
- Zheng & Kaiser (2010) Zheng, W. & Kaiser, R. I. 2010, The Journal of Physical Chemistry A, 114, 5251, pMID: 20373797
- Zhu et al. (2012) Zhu, Z., Nelson, R. P., Dong, R., Espaillat, C., & Hartmann, L. 2012, ApJ, 755, 6
- Ziurys et al. (1994) Ziurys, L. M., Apponi, A. J., Hollis, J. M., & Snyder, L. E. 1994, ApJ, 436, L181
Appendix A Observations


The NO column density together with the upper limits on the column densities of NO in the north, \ceN2O, \ceNO2, \ceNH2OH, CN, and \ceC2H for a range of temperatures is presented in Fig. 14. The details of this calculation are discussed in Sect. 2.3. The NO column density in this Figure is a factor of 5 larger than that found in Paper II due to an incorrect conversion to K in Paper II as explained in Sect. 3.2 (see Fig. 15 for the corrected spectrum). Finally, we present the channel maps of the \ce^13CO transition in Fig. 16 (before continuum subtraction) and Fig. 17 (after continuum subtraction).
The azimuthal profile of NO, \ceCH3OH, \ce^13CO and the 0.89 mm continuum emission are presented in Fig. 18. These profiles are extracted by averaging the intensity from a 60 AU wide ring located at a radius of 62 AU (i.e. averaging between 32 AU and 92 AU) to compare the emission profiles at the radial location of the dust trap. Similar to the radial profiles presented in Fig. 3 the NO and methanol peak at the location of the dust trap. The \ce^13CO emission drops at the continuum peak due to optical depth effects.

Appendix B DALI
The setup of the DALI models used in this work is described in detail in the following subsection. Additionally, the model results for different the CN column density for different C/O ratios are presented in Appendix B.2.2, the effect of the initial distribution of nitrogen are presented in Appendix B.2.1, and the time evolution is presented in Appendix B.2.4.
B.1 Model setup
B.1.1 Gas and dust density structure
The IRS 48 DALI disk model is based on the previously published gas and dust surface density model, that was used to reproduce the spatially resolved CO isotopologue emission. The model for the south side reproduces the \ce^13CO , \ce^13CO , \ceC^18O , and \ceC^17O emission and the total dust continuum flux at 0.44 mm and 0.89 mm within a factor of (Bruderer et al. 2014; van der Marel et al. 2016, Paper I). The \ceCO intensity is reproduced within a factor of by this model. The model for the north side dominates the 18.7 m continuum flux and reproduces the observations within a factor of (van der Marel et al. 2013).
In the radial direction, the gas surface density profile is that of the self-similar solution of a viscously evolving disk Lynden-Bell & Pringle (1974); Hartmann et al. (1998):
| (11) |
with the gas-surface density as a function of radius , the surface density at the characteristic radius , and the power-law exponent. This relation is used outside the dust sublimation radius that is located at 0.4 AU. Inside the dust sublimation radius, the gas number density is set to the ISM value of cm-3. The deep gas cavity that is seen in the IRS 48 disk is modelled by reducing the gas surface density between the sublimation radius and the cavity radius AU by a factor of , see Fig. 19. In the vertical direction, the gas follows a Gaussian distribution with a scale height defined as:
| (12) |
with the scale height at and the flaring index.

The deep 60 AU dust cavity that is seen in the observations is modelled by reducing the total (small large) dust density by a factor of between 1 and 60 AU. A small dusty inner disk is created by reducing the total dust density by a factor of with respect to that of a full disk between 0.4 and 1 AU.
The dust consists of two dust populations (D’Alessio et al. 2006) following an MRN distribution (Mathis et al. 1977). The small dust (m) follows the number density of the gas scaled with the gas-to-dust mass ratio . On the other hand, the large dust (mmm) is settled to the midplane by reducing its scale height with a factor of compared to the gas and small dust. This results in the following mass densities outside the dust trap (following Bruderer 2013):
| (13) | ||||
| (14) |
where sets the mass fraction of the large grains and indicates the latitude coordinate (pole: ; midplane: ).
The dust trap itself is modelled by modifying the dust density between 60 and 80 AU, as observations indicate a high surface density of large dust grains (van der Marel et al. 2013; Ohashi et al. 2020). As DALI is 2D and thus unable to produce azimuthal asymmetries, the IRS48 dust trap is simulated by producing models with and without a high-density dust ring. The density of large grains is increased by a factor of , whereas the small grains are decreased by that same factor following Paper I:
| (15) | ||||
| (16) |
The fraction of large grains, , that is used outside the dust trap is not included here as the small grains likely grew to larger sizes which is taken into account by . A value of 1000 results in a dust surface density of 6 g cm-2 at 60 AU, consistent with the dust surface density of 2-8 g cm-2 derived from polarization observations (Ohashi et al. 2020). In summary, two models are used: one for the non-dust trap (north) side of the disk and one for the dust trap (south) side, see also the right and left side of Fig. 5 respectively.
B.1.2 Stellar spectrum
The stellar spectrum is modelled as a 14.3 L⊙ star with an effective temperature of K following Paper I. The stellar accretion rate of M⊙ yr-1 (Salyk et al. 2013) is modelled by adding a K black body. We have updated the X-ray luminosity of IRS 48 as no X-rays have been detected with Chandra, resulting in an upper limit on the X-ray luminosity (not corrected for extinction) of erg s-1 (Imanishi et al. 2001).
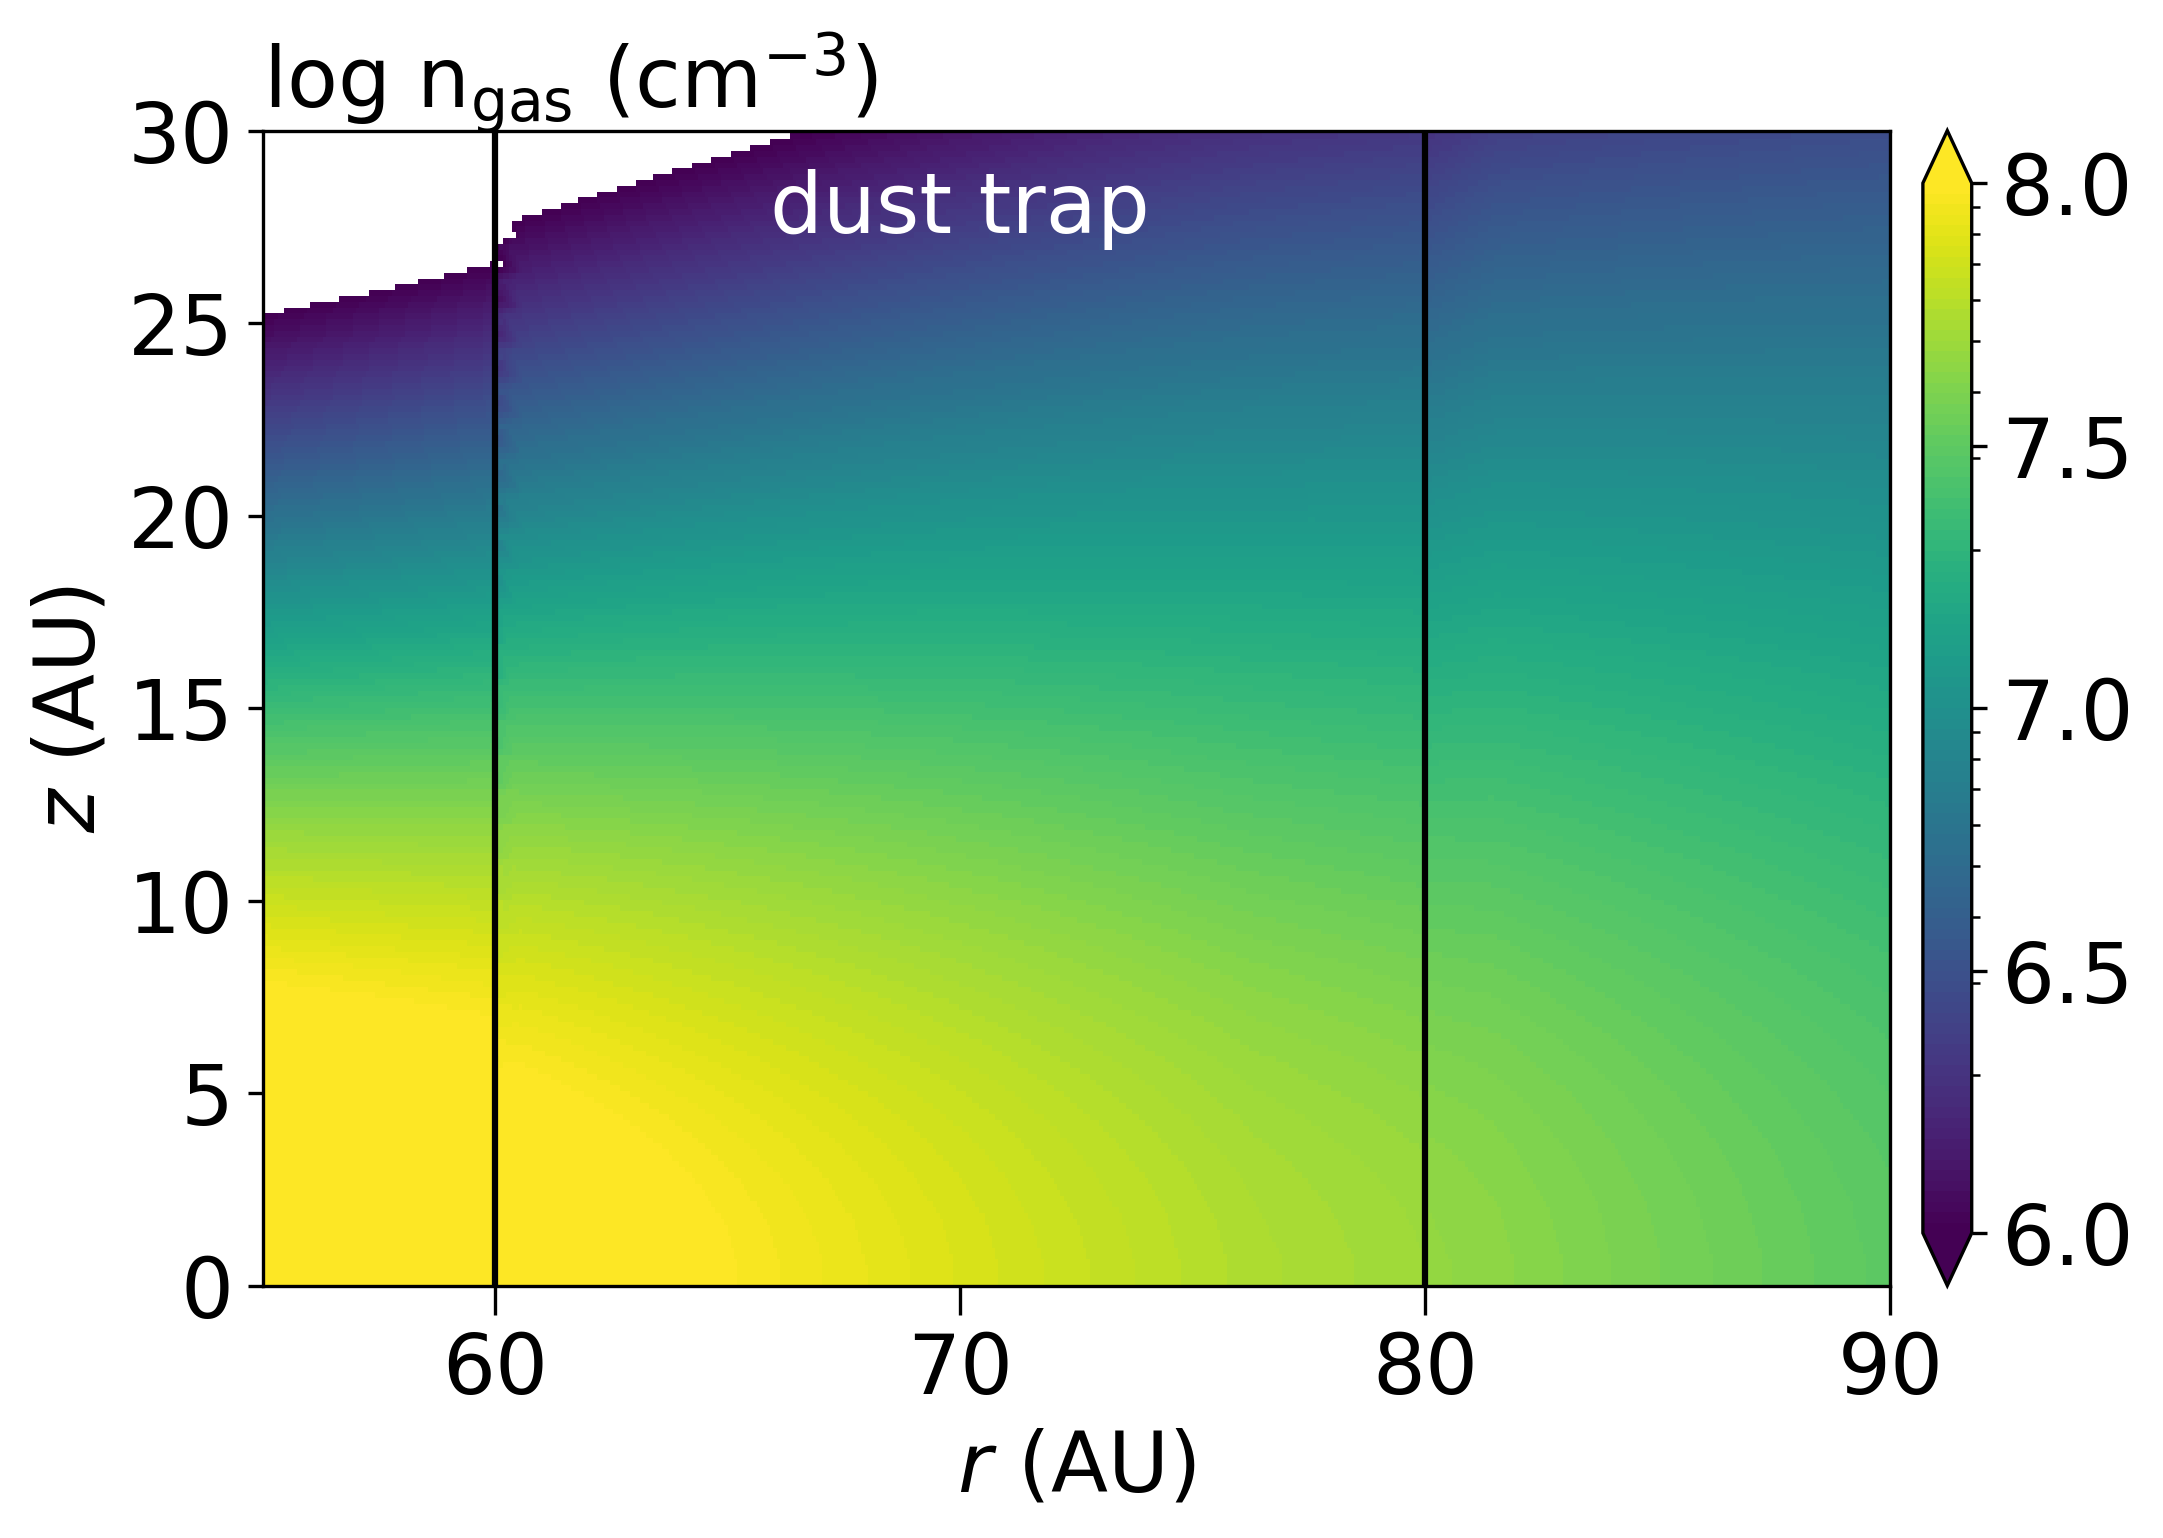
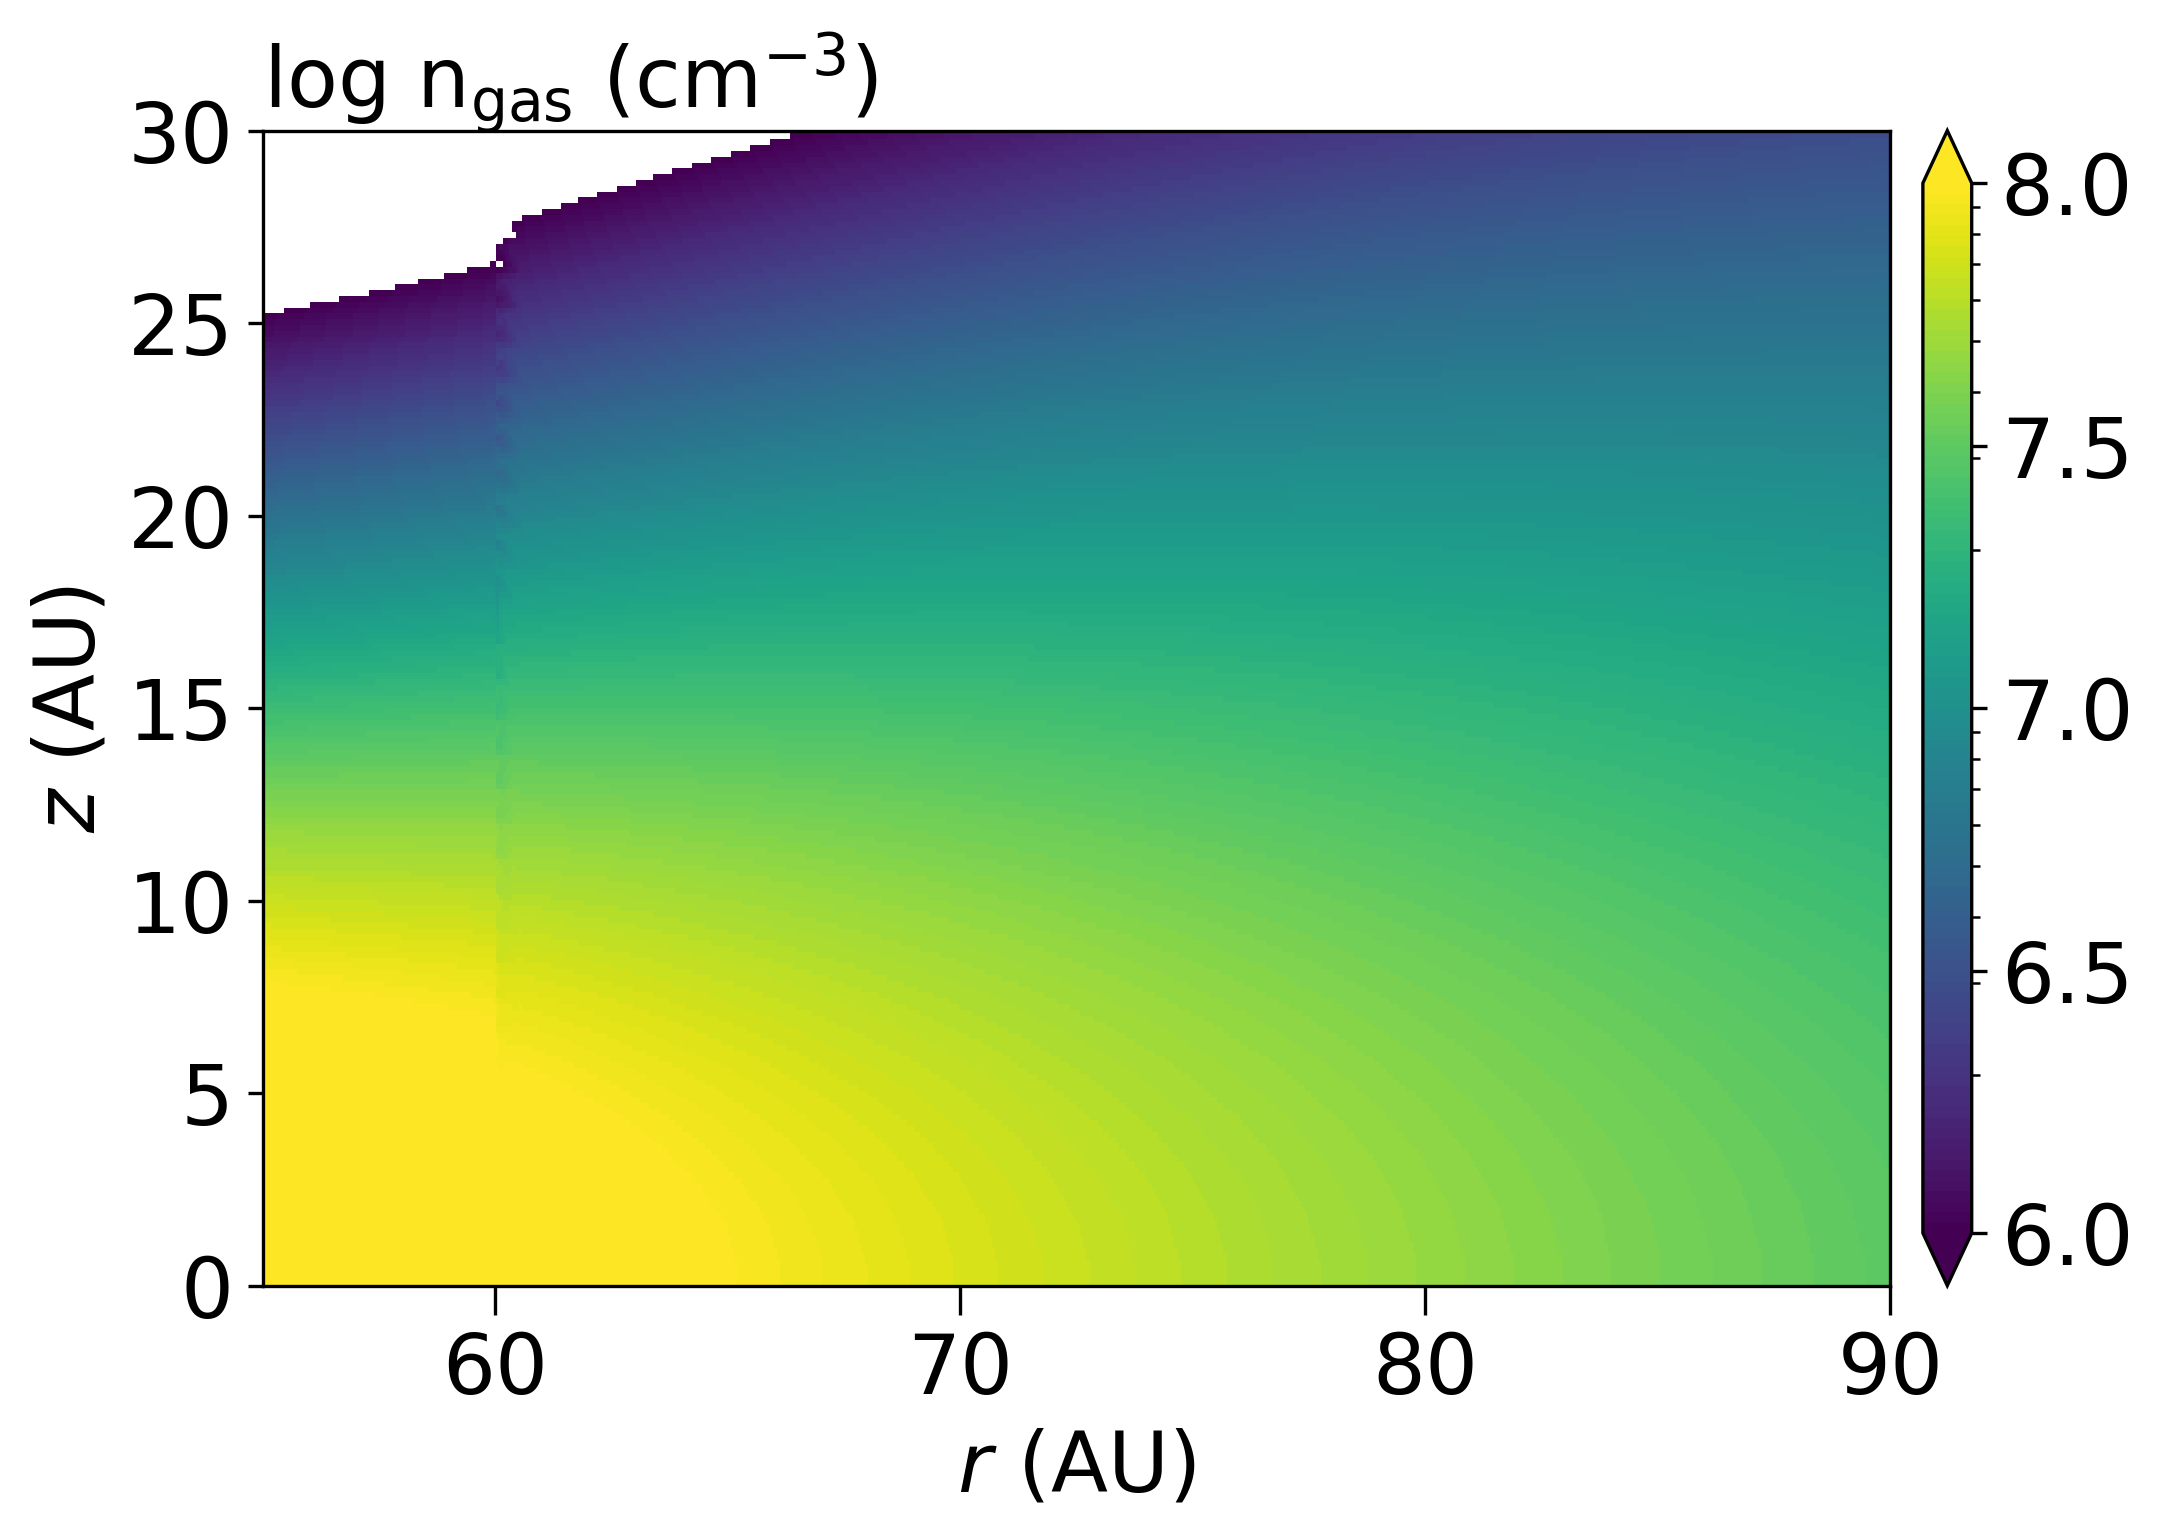
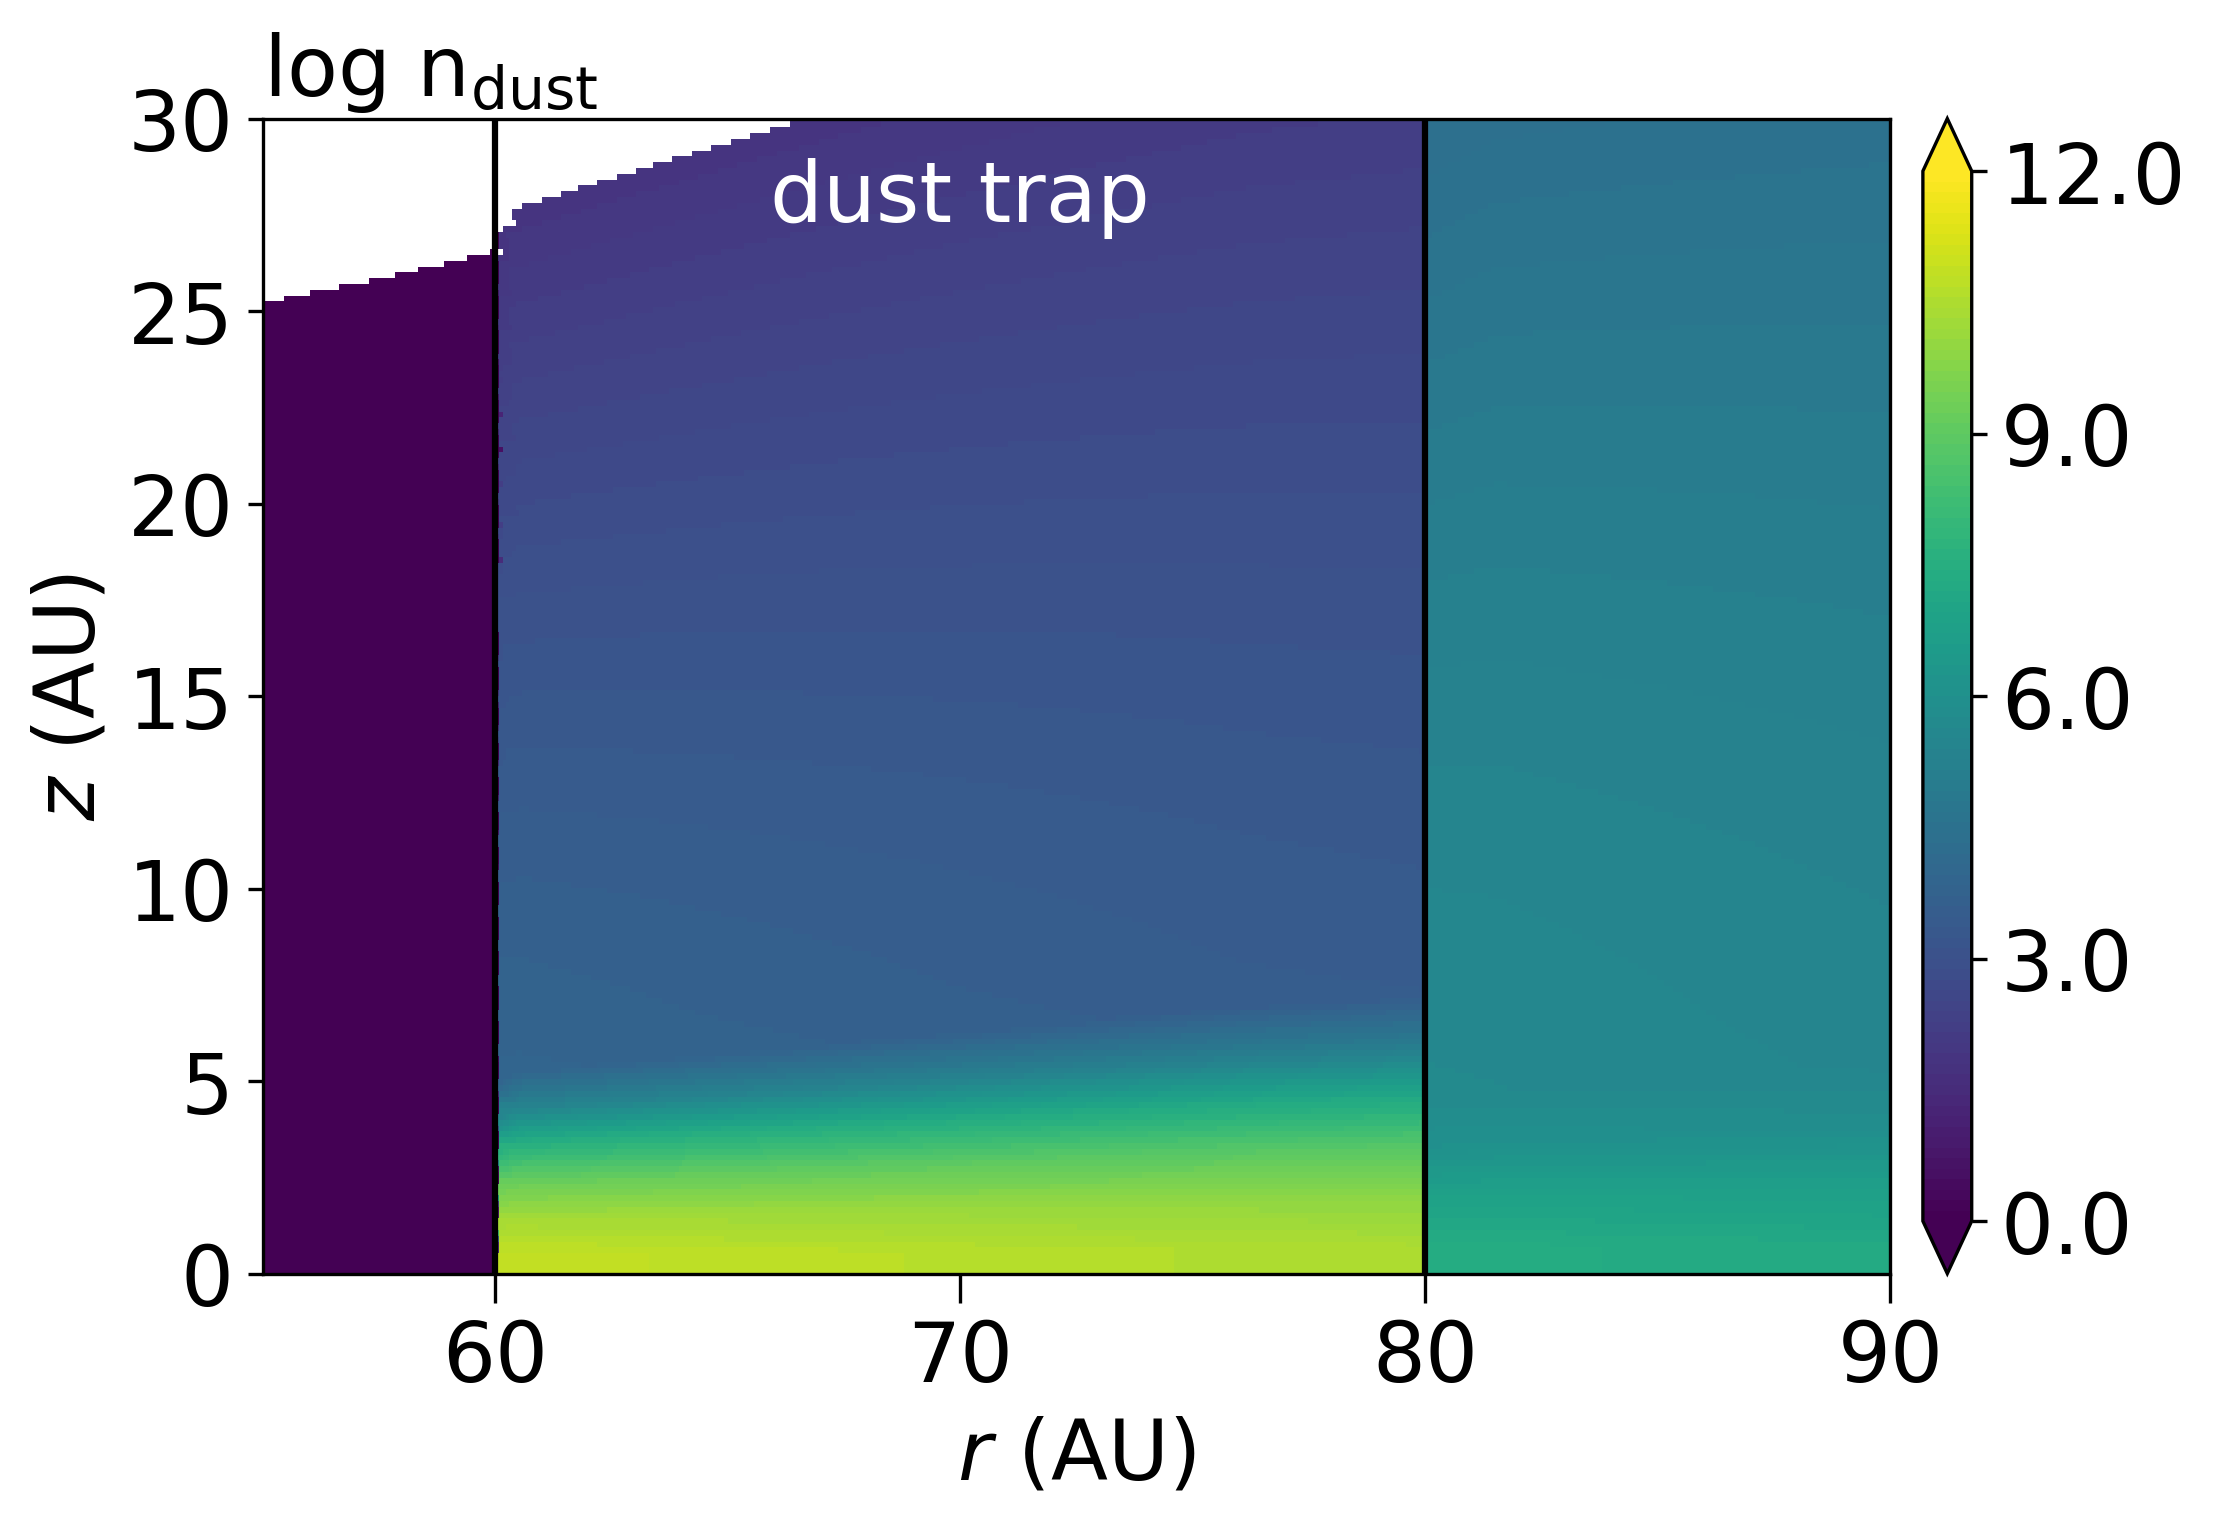
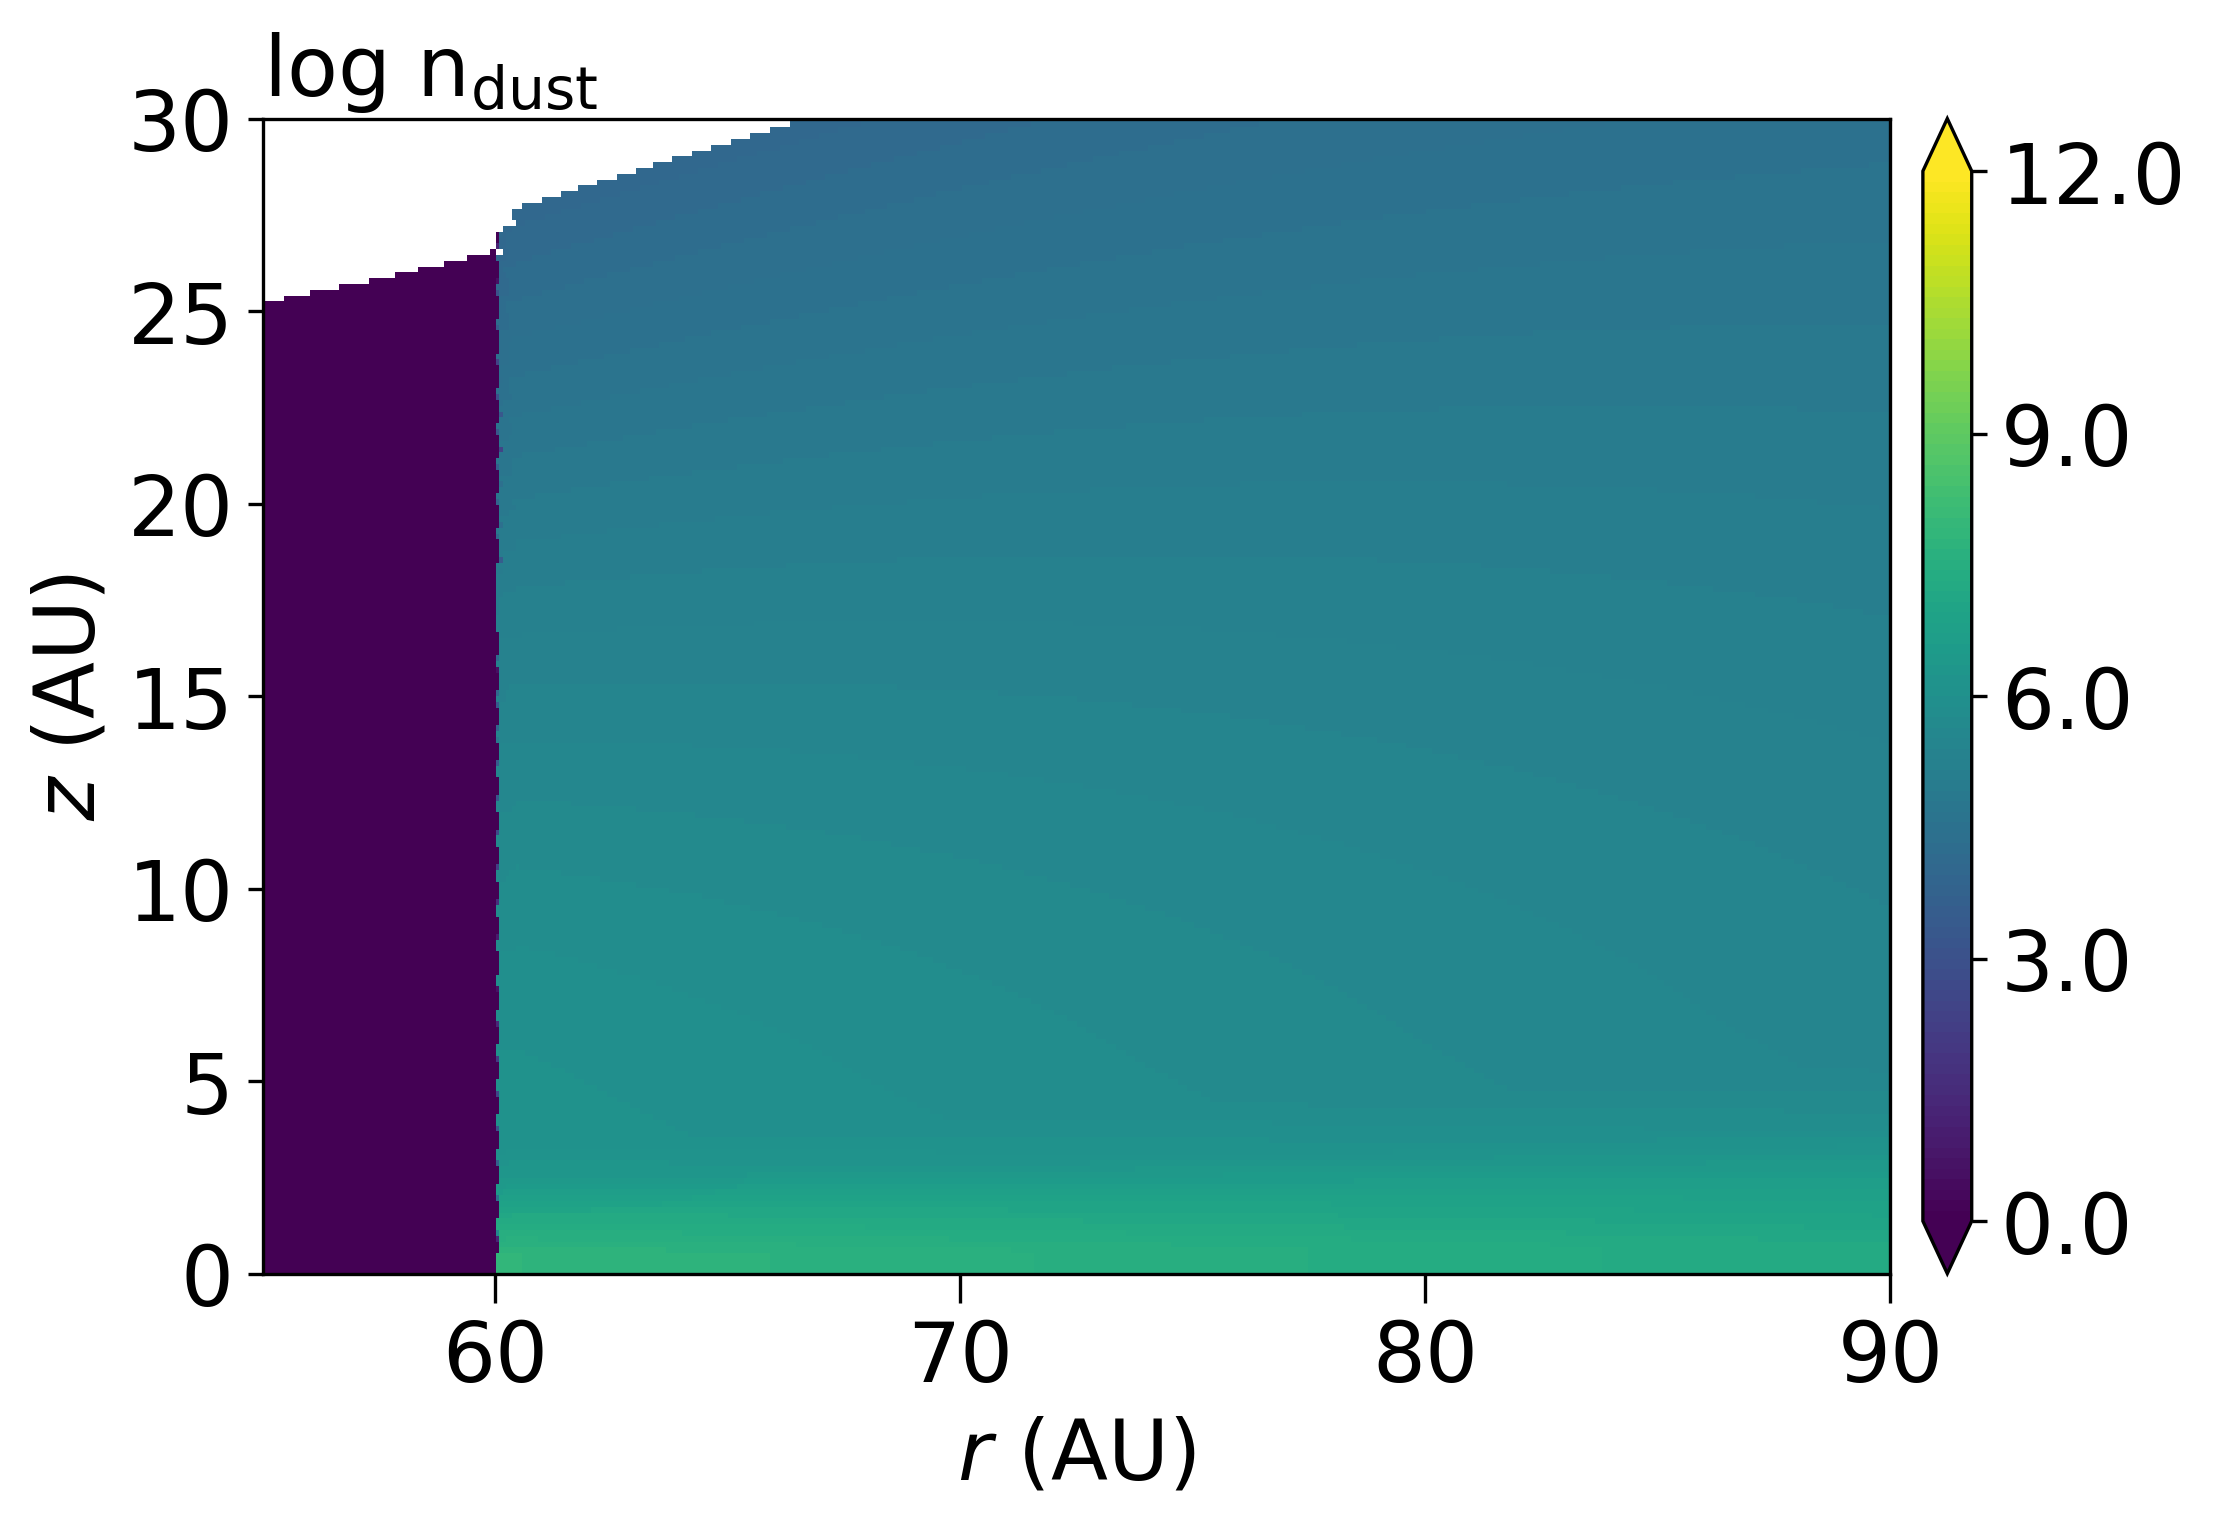
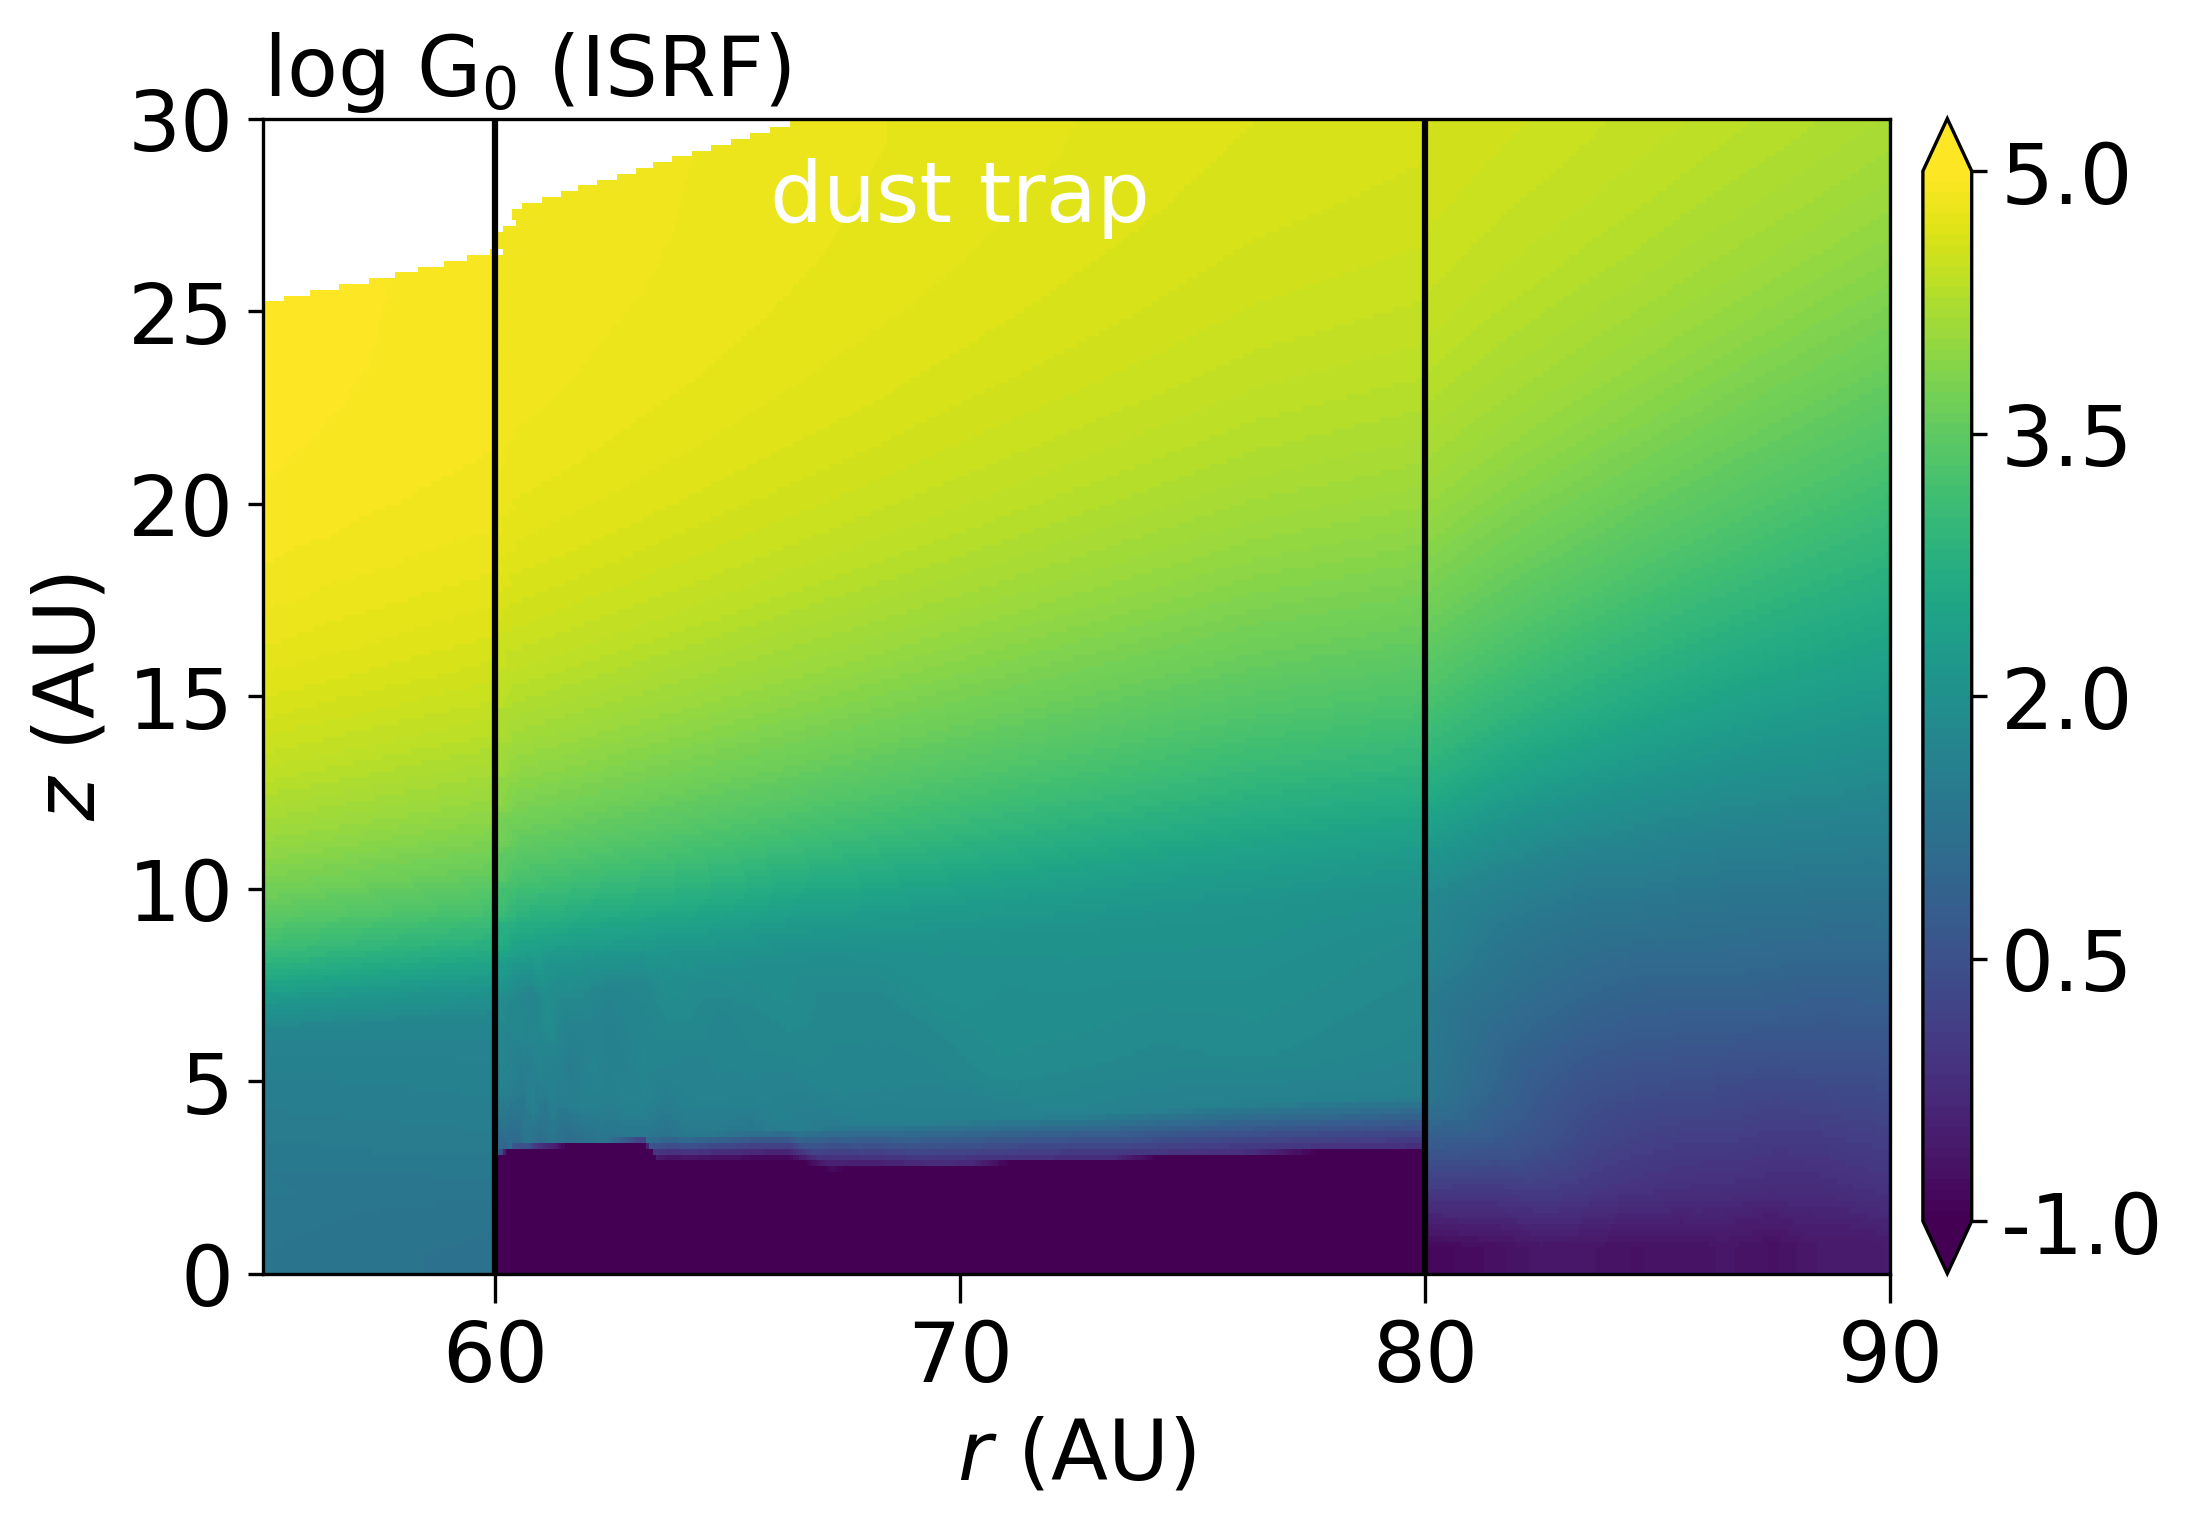
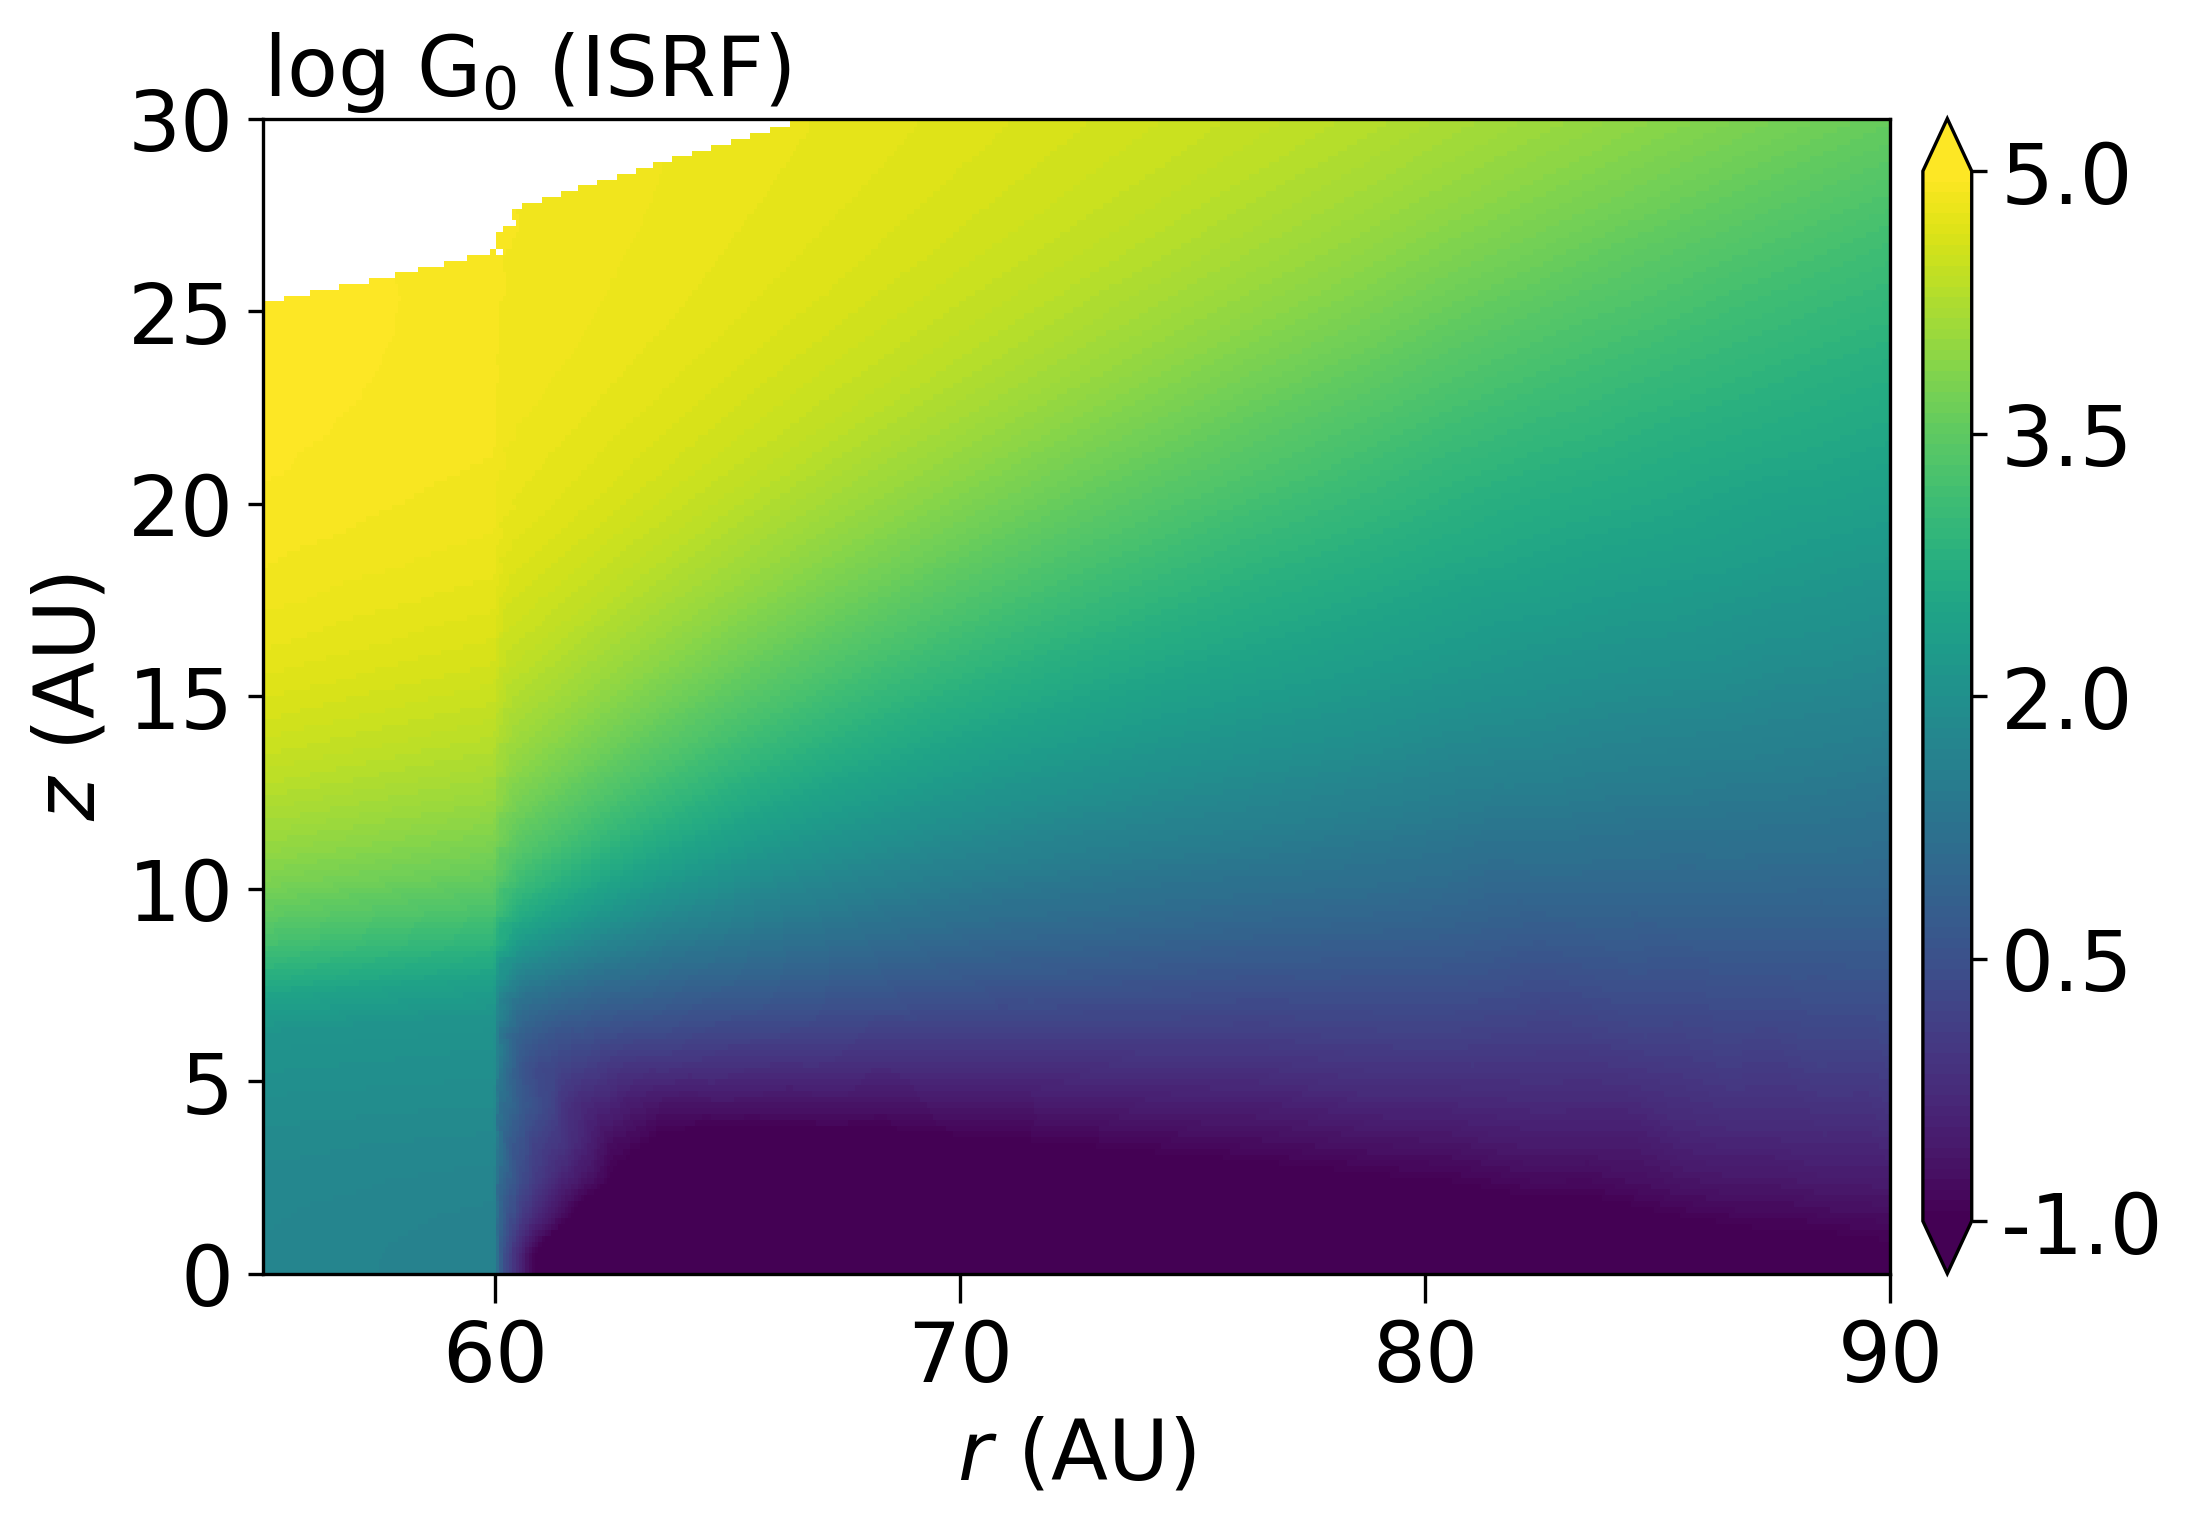
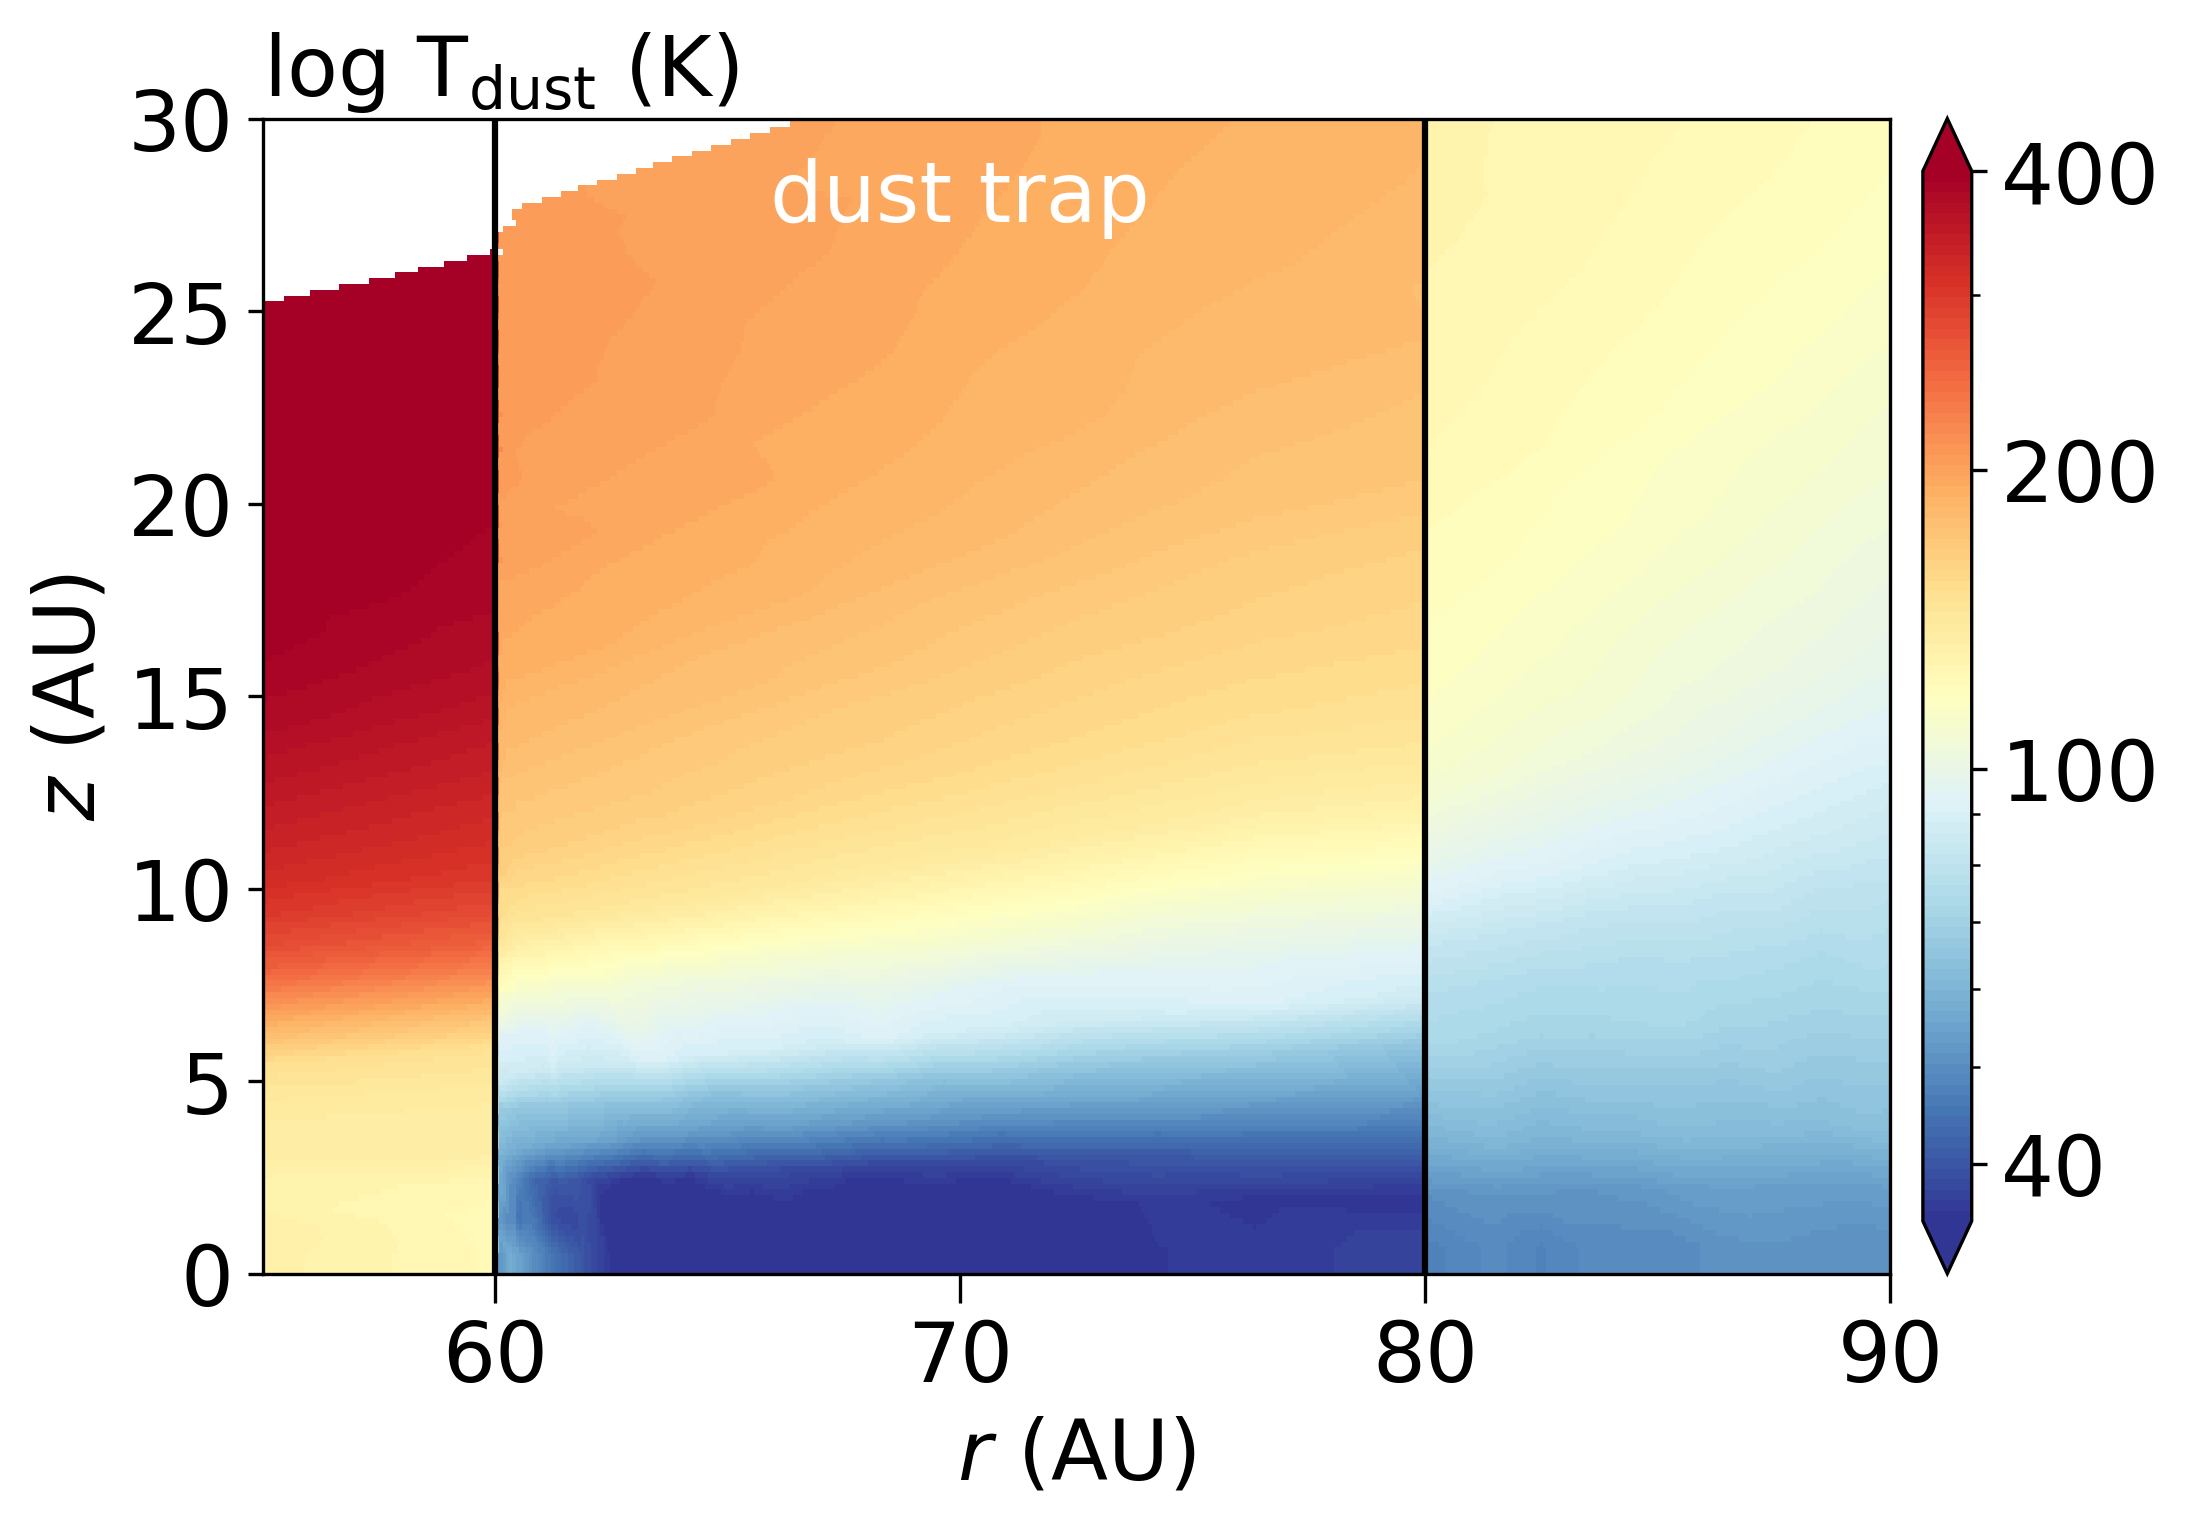
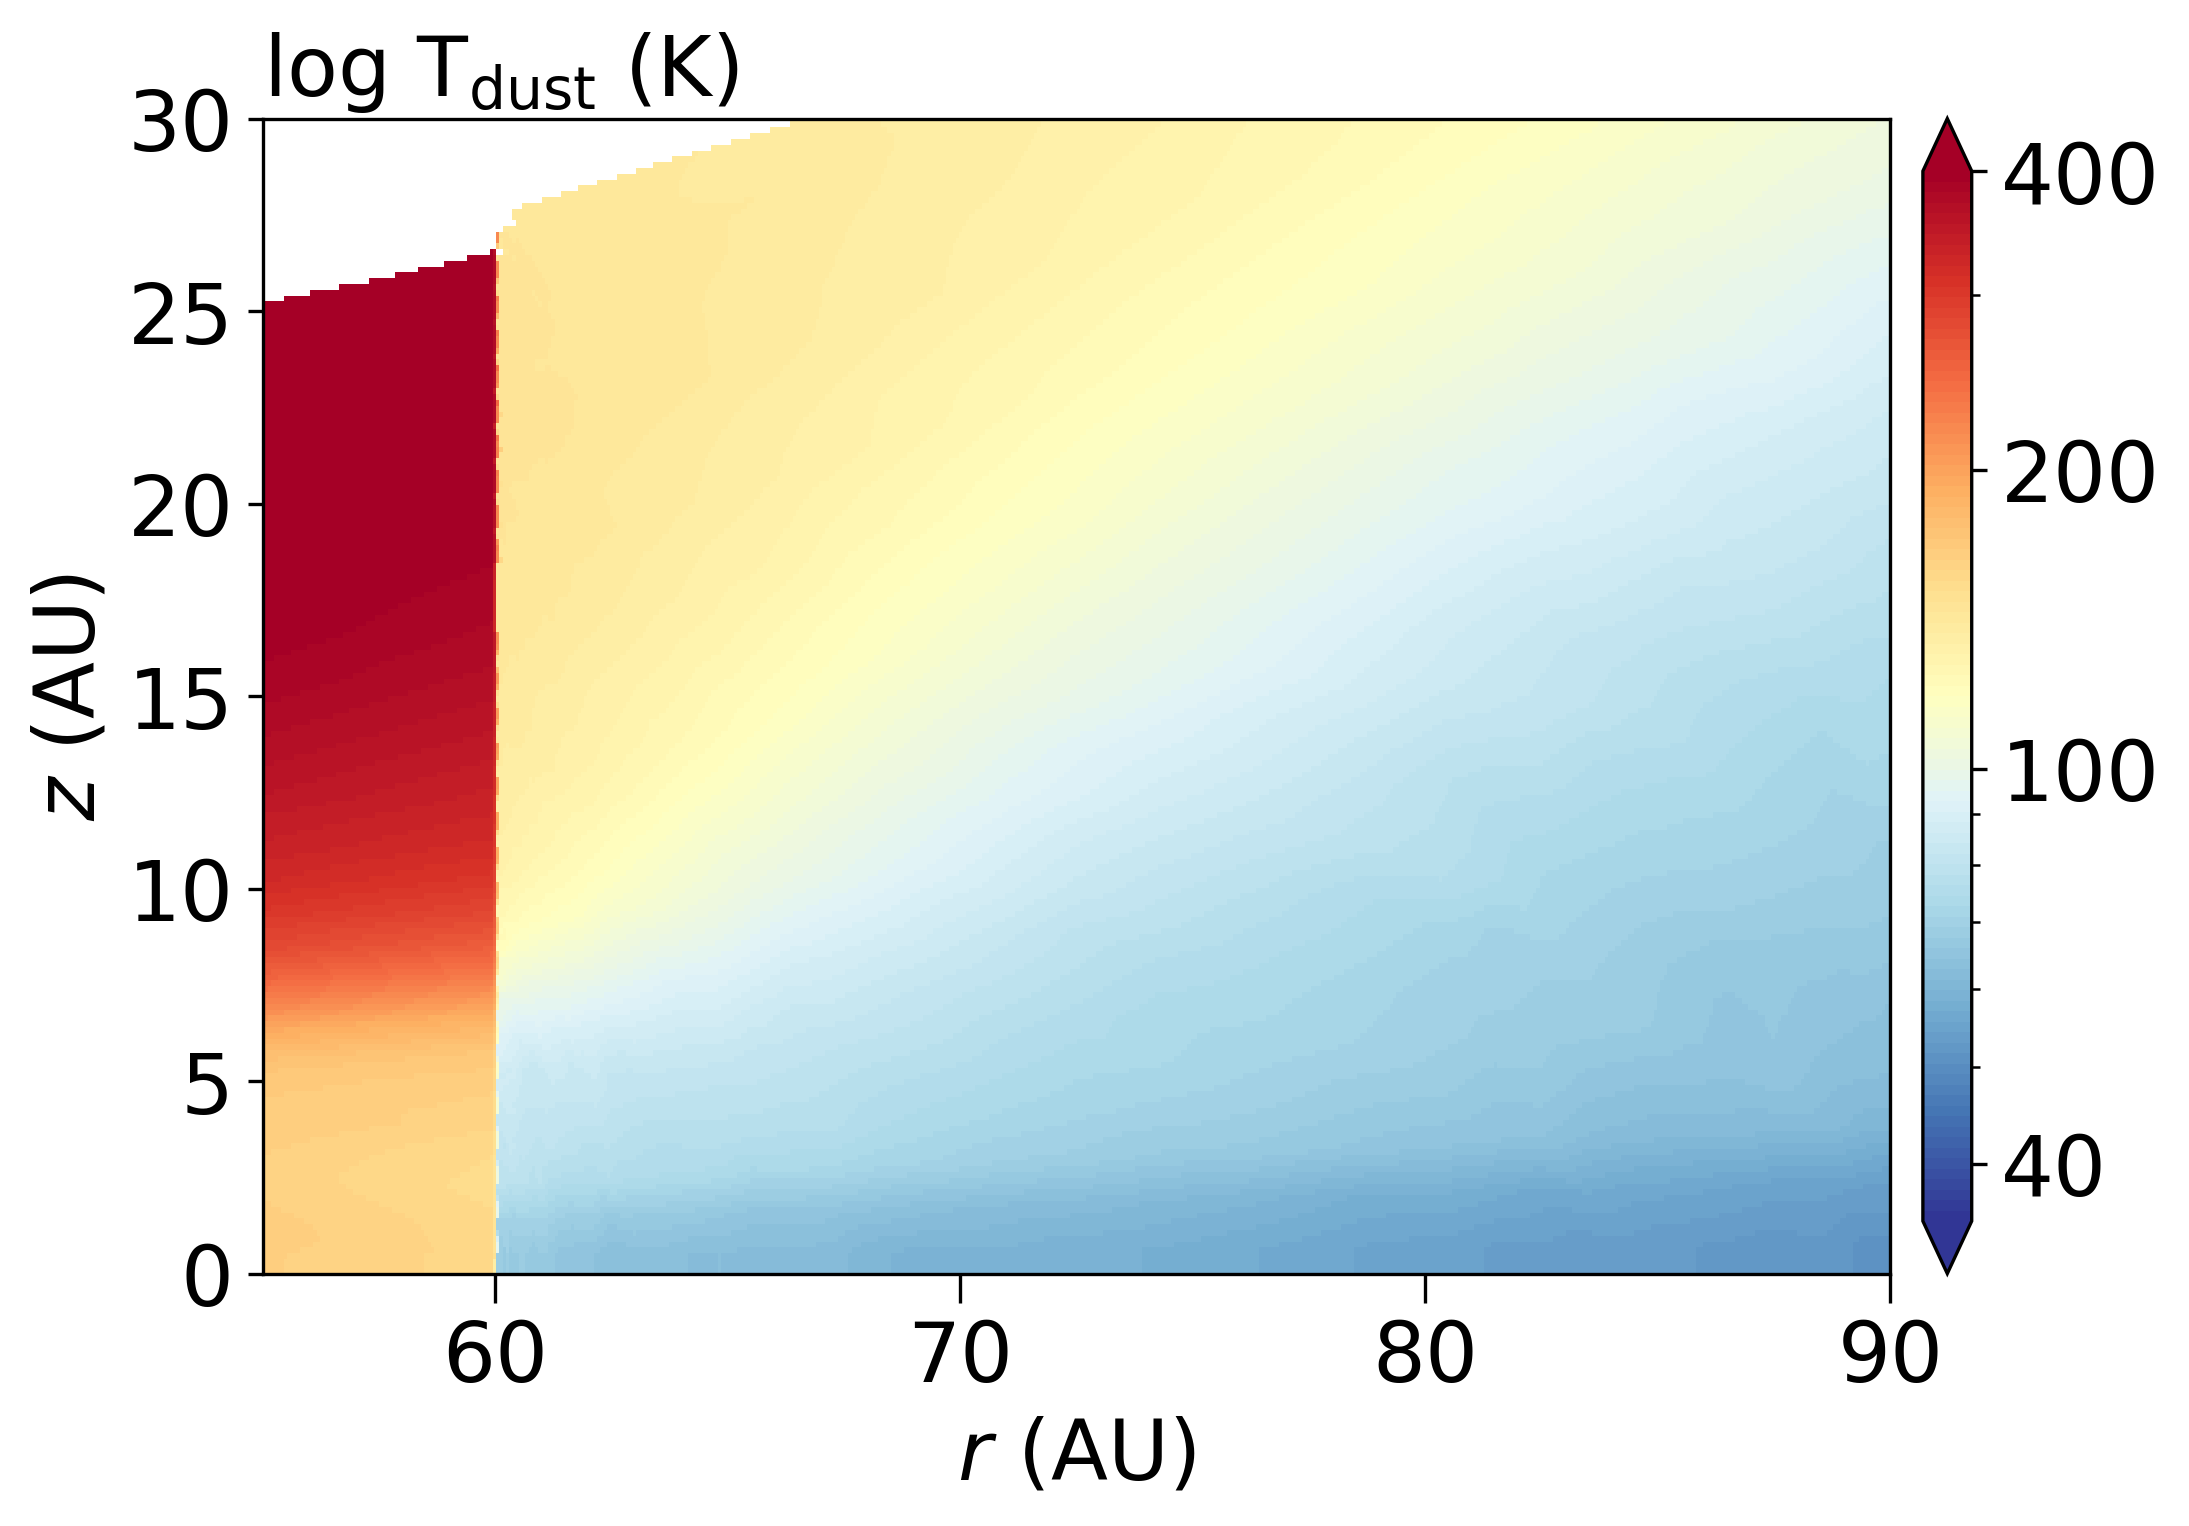
![[Uncaptioned image]](/html/2303.00768/assets/plot_overview_AS_H2O_more_photon_combi_allN2_tend95_and_tend135.png)
![[Uncaptioned image]](/html/2303.00768/assets/plot_overview_AS_JH2O_more_photon_combi_allN2_tend95_and_tend135.png)
![[Uncaptioned image]](/html/2303.00768/assets/plot_overview_AS_OH_more_photon_combi_allN2_tend95_and_tend135.png)
![[Uncaptioned image]](/html/2303.00768/assets/plot_overview_AS_JOH_more_photon_combi_allN2_tend95_and_tend135.png)
![[Uncaptioned image]](/html/2303.00768/assets/plot_overview_AS_CN_more_photon_combi_allN2_tend95_and_tend135.png)
![[Uncaptioned image]](/html/2303.00768/assets/plot_overview_AS_JCN_more_photon_combi_allN2_tend95_and_tend135.png)
![[Uncaptioned image]](/html/2303.00768/assets/plot_overview_AS_C2H_more_photon_combi_allN2_tend95_and_tend135.png)
![[Uncaptioned image]](/html/2303.00768/assets/plot_overview_AS_JC2H_more_photon_combi_allN2_tend95_and_tend135.png)
![[Uncaptioned image]](/html/2303.00768/assets/plot_overview_AS_NH3_more_photon_combi_allN2_tend95_and_tend135.png)
![[Uncaptioned image]](/html/2303.00768/assets/plot_overview_AS_JNH3_more_photon_combi_allN2_tend95_and_tend135.png)
B.1.3 Chemical network
The gas and dust temperature are calculated using the default chemical network in DALI that is based on the UMIST06 chemical network (Woodall et al. 2007; Bruderer 2013) and starts with atomic initial conditions. This network is relatively small and does not include the necessary reactions to model nitrogen bearing molecules such as NO and CN, and small hydrocarbons such as \ceC2H. Therefore, an updated version of the nitrogen chemistry network is used to calculate the molecular abundances using the temperature and density structure obtained in the previous step. This network was first presented in Visser et al. (2018); Cazzoletti et al. (2018); Long et al. (2021). For this updated version, we have added the and reactions with the energy barriers derived in Hacar et al. (2020). Furthermore, we have set the binding energy of \ceC2H3 ice to K as this is the largest carbon chain in the network that acts as a sink to model the effect of the formation of larger hydrocarbons that remain frozen out on the grains. Finally, this network is started with molecular initial conditions (see Table 3). For computational reasons, the first network is run in steady state and the second network is run to 100 yr, 1 kyr (inside the dust trap), or 1 Myrs (outside the dust trap), appropriate for the dust trap around IRS 48. The effect of the initial distribution of nitrogen is further discussed in Appendix B.2.1.
| Model parameter | dust trap side (south) | non-dust trap side (north) | Description |
| Physical structure | |||
| 0.4 AU | Sublimation radius. | ||
| 1 AU | Inner radius of the dust cavity. | ||
| 25 AU | Outer radius of the gas cavity. | ||
| 60 AU | Outer radius of the dust cavity. | ||
| 60 AU | - | Inner radius of the dust trap. | |
| 80 AU | - | Outer radius of the dust trap. | |
| 60 AU | Characteristic radius of the surface density profile. | ||
| 120 AU | Outer radius of the disk. | ||
| 0.25 g | Sets the gas surface density at the characteristic radius . | ||
| Mass of the disk. | |||
| 1 | Power law index of the surface density profile. | ||
| 0.14 | Scale height angle at the characteristic radius . | ||
| 0.22 | Flaring index of the disk surface density. | ||
| PAH abundance | 0.1 | Gas-phase abundance of PAHs w.r.t. to ISM value. | |
| Relative drop in gas density inside the gas cavity (). | |||
| Relative drop in dust density in the dusty inner disk w.r.t. the outer disk (). | |||
| Relative drop in dust density inside the dust cavity (). | |||
| Dust properties | |||
| 0.1 | Settling of large grains. | ||
| 0.85 | Mass-fraction of grains that is large. | ||
| 1000 | - | Increase of large dust grains inside the dust trap. | |
| 20 | Gas-to-dust mass ratio. | ||
| Stellar properties | |||
| 2 | Mass of the central star. | ||
| yr-1 | Mass accretion rate of the central star. | ||
| Stellar spectrum | |||
| 14.3 | Luminosity of the central star. | ||
| erg s-1 | X-ray luminosity of the central star. | ||
| K | Effective temperature of the central star. | ||
| K | Effective temperature of the X-ray radiation. | ||
| Cosmic ray ionization rate. | |||
| Observational geometry | |||
| Disk inclination ( is face-on). | |||
| 135 pc | Distance to the star. | ||
| Chemistry(3) | |||
| H | |||
| He | |||
| \ceH2 | |||
| \ceH2O | |||
| \ceCO | |||
| \ceN2 | |||
| \ceMg+ | |||
| \ceSi+ | |||
| \ceS+ | |||
| \ceFe+ | |||
- •
B.2 Model results
B.2.1 Initial distribution of nitrogen
The fiducial model discussed in the main text is initialized with all nitrogen in \ceN2. However, the initial distribution of nitrogen over the main nitrogen carries such as \ceN, N2, NH3 is unknown. Therefore, we run all models with initially all nitrogen in \ceN2 (fiducial models), all nitrogen initially in N following Fogel et al. (2011), all nitrogen in \ceNH3 following Maret et al. (2006) and Daranlot et al. (2012), and a mixture of these three. The mixture is based on the dark cloud model in Walsh et al. (2015) and consists of an initial atomic nitrogen abundance of , \ceN2 initially , and \ceNH3 initially with respect to hydrogen. All molecules start in the gas phase as the model is evolved for a short time.
An overview of the model results for different initial distributions of nitrogen and the effect of sublimating ices is presented in Fig. 22. The initial distribution of nitrogen has the most profound effect when NO gas is added to the initial conditions. Only when atomic nitrogen is initially absent, NO can survive. The reason for this is that NO is destroyed by atomic nitrogen to form \ceN2. The models that start with atomic nitrogen, \ceNH3 or a mixture of \ceN, NH3, and \ceN2 predict a higher NO column density when no sublimating ices are added to the initial conditions. Still these models underpredict the NO column density. Furthermore, this difference is diminished when the effect of sublimating \ceNH3, \ceNH3 & \ceH2O, and NO is modelled. Only in the case of sublimating water, the NO column density in the \ceN2 model is slightly lower than that in the other models. In summary, varying the initial distribution of nitrogen shows that the initial abundance of atomic nitrogen must be low to explain the observed NO emission.

B.2.2 Effect of evaporating ices on CN and \ceC2H
The dust trap in the IRS 48 disk is an ice trap. Sublimating \ceH2O and \ceNH3 cannot boost the NO column density to match the observations. In this section, their effect on the upper limits on CN and \ceC2H is investigated. The CN column density presented in Fig. 23 and is consistent with the upper limit derived from the observations for all models except those with an initial water abundance of or an initial \ceNH3 abundance . Furthermore, the CN column density is slightly lower for the models that start with all nitrogen initially in \ceN2. The reason for this is that the \ceN2 bond needs to be broken before CN can be formed in these models.
The results for the \ceC2H column density are presented in Fig. 24. The \ceC2H column density is sensitive to the C/O ratio in this disk as it decreases with an increasing abundance of water (first two rows of Fig. 24). The highest C/O ratio in the models explored here is 0.99, so just below a C/O ratio of 1 when \ceC2H is expected to become very bright (Bergin et al. 2016; Bergner et al. 2019; Miotello et al. 2019; Bosman et al. 2021). In summary, the CN emission places the strongest constraint on the C/O ratio in this disk. Deeper observations of both CN and \ceC2H are needed to pinpoint the C/O ratio to an accuracy better than .
Finally, the warm \ceH2O and OH column densities are presented in Fig. 25 and 26. Only the \ceH2O and OH in the regions with K are taken into account as this is the temperature range probed by the Herschel PACS observations. Even at these high OH columns, formation of NO through OH are not efficient enough to explain the observations further strengthening the hypothesis that the NO is the photodissociation product of a larger molecule.


B.2.3 Chemical composition of the non-dust trap side
The chemical composition of the non-dust trap side is modelled by varying the initial abundance of gas-phase water. The resulting NO, CN, and \ceC2H column densities are presented in Fig. 27, 28, and 29. Similar to the results in the dust trap, the NO and \ceC2H emission are not tightly constraining the disk C/O ratio. The CN indicates that the initial abundance of gas-phase water must be , setting the C/O ratio to be .


B.2.4 Time evolution
The NO column density after yr is presented in 30. The NO column density is relatively stable over a yr time period in the dust trap, except for the models where the initial \ceNH3 abundance is non-zero. in these cases, the NO column density in the outer parts of the dust trap decreases by a factor of a few up to an order of magnitude in the models where \ceNH3 is abundant.
