Meng, Sayer, Zhang, Shen, Li, and Liu
ROCO: A Roundabout Traffic Conflict Dataset
1 Abstract
Traffic conflicts have been studied by the transportation research community as a surrogate safety measure for decades. However, due to the rarity of traffic conflicts, collecting large-scale real-world traffic conflict data becomes extremely challenging. In this paper, we introduce and analyze ROCO - a real-world roundabout traffic conflict dataset. The data is collected at a two-lane roundabout at the intersection of State St. and W. Ellsworth Rd. in Ann Arbor, Michigan. We use raw video dataflow captured from four fisheye cameras installed at the roundabout as our input data source. We adopt a learning-based conflict identification algorithm from video to find potential traffic conflicts, and then manually label them for dataset collection and annotation. In total traffic conflicts and traffic crashes are collected from August to October . We provide trajectory data of the traffic conflict scenes extracted using our roadside perception system. Taxonomy based on traffic conflict severity, reason for the traffic conflict, and its effect on the traffic flow is provided. With the traffic conflict data collected, we discover that failure to yield to circulating vehicles when entering the roundabout is the largest contributing reason for traffic conflicts. ROCO dataset will be made public at https://github.com/michigan-traffic-lab/ROCO.
Keywords: traffic conflict, safety measure, roadside perception, safety analysis
2 Introduction
Improving traffic safety has been an essential and longstanding goal in transportation research for decades. Traffic accidents like crashes, are the dominant cause of fatalities, injuries, and property damage in the transportation sector. For better understanding of car crashes, large-scale crash data is required. However, due to the rarity of crash occurrences [1, 2] (around per mile), and the very limited data collection methods (in most cases, crash data are collected from police reports), it is very hard to acquire large amounts of crash data in a relatively short period. Additionally, the information contained in police reports often lacks necessary information, e.g., exact vehicle speed and maneuver before the crash happens.
Due to the limitations as mentioned in crash data acquisition, surrogate safety measures like traffic conflict have been widely studied and discussed. The term traffic conflict has no universal definition. In this paper, we use the definition given by NCHRP 219 [3]: "A traffic conflict is a traffic event involving two or more road users, in which one user performs some atypical or unusual action, such as a change in direction or speed, that places another user in jeopardy of collision unless an evasive maneuver is undertaken." Figure 1 shows a comparison between crashes and traffic conflicts. The traffic conflicts hold as the "missing link" between normal traffic behavior and accidents [4]. Many studies on the relationship between traffic conflicts and crashes have been conducted, including pyramid safety continuum [5], aetiology consistency [6], and causal model [7]. Since traffic conflicts occur more frequently, and typically no damage takes place, it is easier to acquire large amounts of traffic conflict data in smaller amounts of time. A variety of traffic conflict applications have been studied, including critical behavior analysis [8, 9, 10], before-after studies [11, 12, 13], identifying high-risk locations [14], and real-time safety prediction [15, 16, 17].
Though traffic conflict data is easier to acquire than crash data, several data-related issues still exist in traffic conflict research. One of the most critical issues is the lack of publicly available large-scale traffic conflict data. As it stands, transportation researchers and engineers need to collect traffic conflict data each themselves. Furthermore, since every research group uses their own data, as mentioned in [18], data inconsistency becomes an issue. Different conflict identification criteria lead to different analysis results, and it is difficult to discuss and generalize findings from different research because of this. Most traffic conflict data is collected through a roadside camera, or connected vehicles. Some factors that potentially contribute to traffic conflicts, such as the state of other surrounding vehicles, weather conditions, and lighting conditions may be unobserved in traffic conflict data. These unobserved factors might cause inaccurate modeling and analysis of traffic safety.
(a) 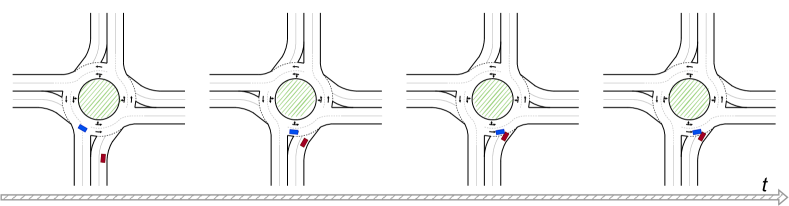
(b) 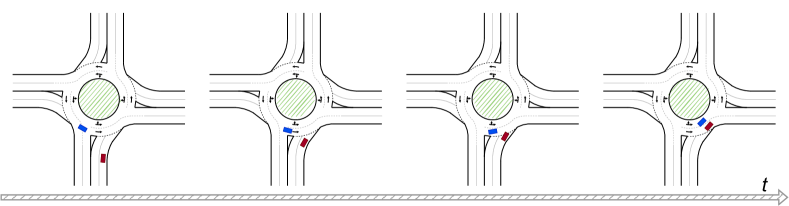
(c) 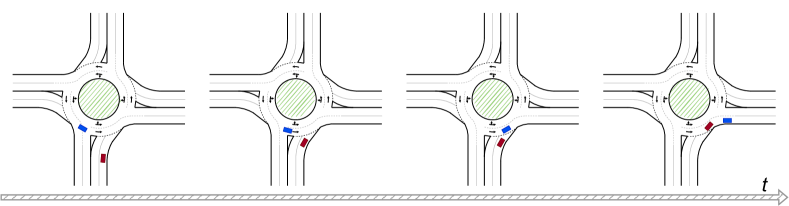
To overcome the aforementioned traffic conflict data issues, we propose ROCO, a new roundabout traffic conflict dataset. In order to collect rarely occurring traffic conflict data, we utilize pre-installed roadside cameras and an edge-cloud infrastructure 222Mcity sponsored research project N029385: Safe and Efficient Roundabouts by Artificial Intelligence and V2X Technology.. Four roadside fisheye cameras were installed on the four corners of the roundabout. Meanwhile, an edge-cloud infrastructure is deployed to stream the raw sensor data gathered from the roadside to the cloud-based Mcity Mobility Data Center in a 24/7 manner with low latency. [19, 20], as shown in Figure 2(a). The aforementioned roundabout where the ROCO data is collected is a two-lane roundabout at the intersection of State St. and W. Ellsworth Rd. (, ) in Ann Arbor, Michigan, U.S. Even with the video data collected, it is too time intensive to identify the traffic conflicts from normal traffic scenarios manually. Therefore, we developed a data collection and annotation pipeline that first uses a deep learning-based video processing algorithm for potential traffic conflict identification, and then we manually check and label all the video clips that were flagged as potentially containing traffic conflicts. The traffic conflict identification algorithm is a two-stage architecture. A modified SlowFast [21] network is adopted for each stage. The first-stage model identifies a significant portion of the video clips. The second-stage model performs a re-identification among the videos filtered from the first stage. After the second stage, about of filtered videos contain one or more traffic conflicts.
With the video clips filtered by the two-stage algorithm, we begin the verification and annotation work. We do not provide a quantitative definition for traffic conflicts, because the traffic conflict is a multi-dimensional problem [22, 23, 24]. It is very hard to provide a generalized explicit quantitative condition for traffic conflicts. Instead, we use exemplar-based annotation. We provide a few examples of each typical type of traffic conflict in the roundabout, and annotators qualitatively estimate the similarity between a potential conflict and existing exemplars. We design a taxonomy of traffic conflicts in terms of conflict severity, the reason for the traffic conflict, and the effect of the traffic conflict on the traffic flow in the roundabout. There are in total traffic conflict samples and traffic crash samples in the ROCO dataset. Further, we use a roadside perception system to extract the trajectory data from each video clip. With the full sensor coverage of the roundabout, all vehicles inside or near the roundabout are recorded. Lighting and weather conditions are also recorded for convenience in future research.
Some preliminary statistical results of the ROCO dataset are provided in this paper. One interesting finding is that the biggest reason for traffic conflicts is failure to yield to circulating vehicles when entering the roundabout. More than of the traffic conflicts we collected are caused by failure to yield. Further, although large vehicles, like trucks, are not very common in the roundabout, they cause a lot of the failure to yield cases (about of all failure-to-yield cases are caused by large vehicles).
(a) 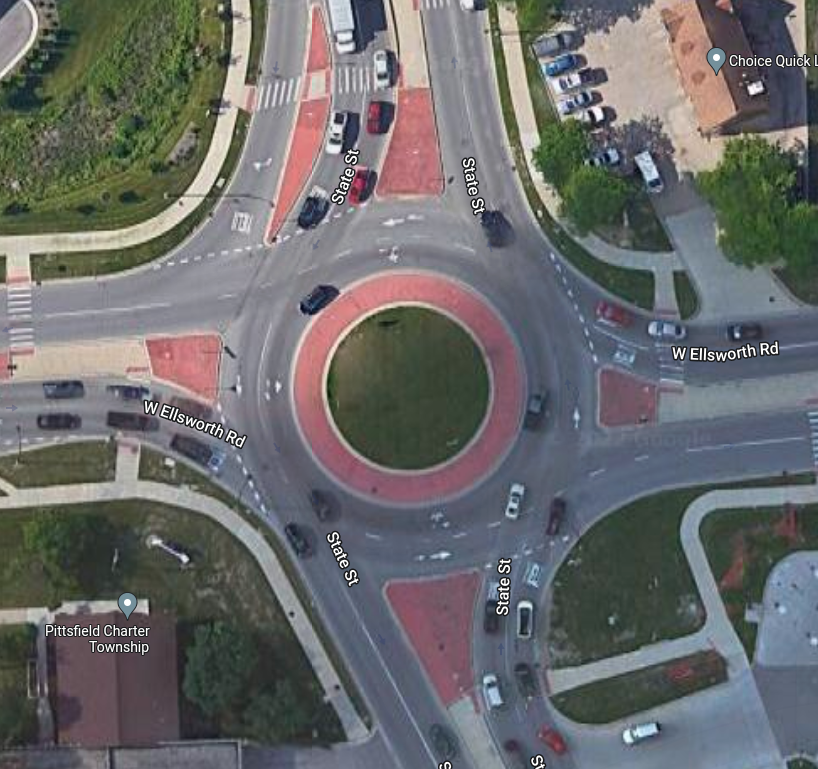 (b)
(b) 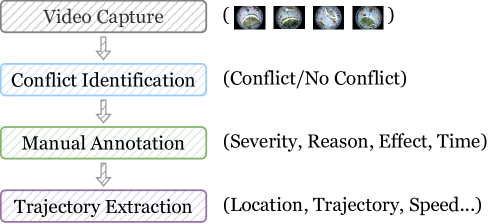
We believe that with ROCO dataset, transportation researchers will be able to easily access consistently labeled real-world traffic conflict data. Modeling traffic conflicts, as well as studying the relationship between crashes and conflicts, will provide guidance on how to improve roundabout traffic safety. Currently, we only collect data from one roundabout. In the future, however, we will continue to collect more traffic conflict data from multiple roundabouts and signalized intersections to improve the diversity and generalization of the dataset.
In summary, the main contributions of this paper are as follows:
-
1.
We present ROCO, a roundabout conflict dataset with rich contextual information, including surrounding vehicle states and weather conditions.
-
2.
We design a data collection pipeline for traffic conflicts, including a two-stage conflict identification framework and human verification and annotation.
-
3.
We perform statistical analysis on the ROCO dataset and discover patterns in traffic conflicts so that transportation agencies can take to improve roundabout safety and efficiency.
3 Related Work
Research on traffic safety analysis, especially the automatic detection of traffic conflicts, is an ever-progressing field. As this research progresses, so do the techniques and approaches which build upon the work of those before them. Just as traffic conflicts were first theorized, they can then be validated as a crash-predictive metric and used to analyze the roads around us.
3.1 Traffic conflict
The very first roots of traffic conflicts were envisioned in the 1930’s when Herbert W. Heinrich proposed that all safety-related accidents share common causes or origins with near-misses [25]. This idea can be specifically applied to traffic conflicts and crashes by assuming that a crash is a potential outcome from the initial state of a conflict (one in which two or more vehicles will collide should no evasive action be taken) [18, 26]. This definition has since been expanded on. Their use in traffic analysis has also increased as the problems with crash-based analysis are further realized.
Traffic conflicts are used as a surrogate to crash data for a number of reasons. Traffic conflicts happen much more often than crashes do [26, 27], although they are harder to identify; a crash is clearly defined by contact between two or more vehicles, but the identification of a traffic conflict is much more subjective [18]. However, they still allow us to find and utilize a much larger and more diverse set of data in traffic analyses. Another reason that traffic conflicts are used rather than crash data is that crash data is "inherently reactive" [18, 28], to obtain crash data a crash must occur. This can significantly delay improvements and changes to traffic control that prevent injuries and deaths. Additionally, crash data is often unreliable or not widely available [18, 28]. The data is often collected from police reports, which do not always include important factors like the exact location of the crash or accurate vehicle speeds. Police reports also do not account for all crashes, as many go unreported [29].
Traffic conflicts are believed to serve as an accurate or reasonable crash precursor [26]. If traffic conflicts occur when one or more road user performs an evasive action to avoid a collision or crash, then it logically follows that the failure of this evasive action would result in a crash. This view is laid out by a number of different papers and models. This includes the pyramid safety continuum model which ranks all traffic events on how dangerous they are; they fall into three categories, undisturbed passages, traffic conflicts, and crashes [18, 30]. As well as in, among many others, [31] and [32], which both found a strong correlation between traffic conflicts and crashes in their respective studies.
Traffic conflicts are typically determined either by eye and a set of criteria that a study or group establishes, or by using a crash-predictive metric and an algorithm. Such metrics include TTC (time to collision) and PET (post-encroachment time). TTC is the amount of time before two or more vehicles collide should all conditions remain the same. TTC has been used widely, such as in [26] and [31]. PET is the time after one vehicle has left a potential collision point and the time that the other vehicle arrives there [18]. By setting a threshold value for TTC or PET, conflicts can be automatically detected.
Despite the clear benefits of traffic conflict analyses, traffic conflicts suffer from data and collection problems. First and foremost, there are no universal standards for traffic conflict identification [18]. This results in inconsistencies across studies. For conflicts detected by the algorithm, there must be a set of rules or standards that guide the computers decision, but these are determined nearly entirely by the researchers themselves [18]. Because of this, comparing the results of different studies and validating results becomes extremely challenging. Additionally, traffic conflict data, like crash data, is often collected in a short period of time. Data collection of just a few days or even weeks lacks the ability to account for seasonal, event-based, or weather-based changes in driver behavior and traffic volumes [33]. Which leads to biased assumptions of traffic conflict volumes across various times [18]. Understanding these flaws is key to seeing why more standardized data is necessary.
By setting specific standards or assembling a large pool of consistent data, as is done in this study, we give researchers access to data that can easily be compared and referenced against each other. This allows models to be validated and cross-referenced and overall improved. It additionally allows us to take a closer look at other variables that are often ignored or considered less important. These include lighting, weather, time of day, lane in the intersection or roundabout, etc.
3.2 Roadside perception
Roadside perception systems are an essential component in intelligent transportation systems, connected vehicles, and autonomous vehicles [34, 35, 36]. Compared to vehicle-side perception systems, roadside perception systems are more robust to occlusions and better at long-term event tracking and prediction [37]. [37] proposes a large-scale roadside d object detection dataset. A large-scale vehicle-infrastructure cooperative 3D object detection dataset is proposed in [38]. A roadside perception unit (RSPU) is developed by [39]. [19, 20] design and deploy a roadside perception system at a roundabout. Roadside cameras are also used in traffic conflict research [40]. In most cases, object locations and trajectories are extracted from the roadside perception system and then used for traffic conflicts. However, we directly use raw video as our input instead of trajectories. In our observation, the noise in the extracted trajectories has a negative impact on the traffic conflict identification. When we identified the traffic conflicts, we used the perception system for traffic conflict trajectory extraction.
4 Traffic Conflict Identification
In this section, we introduce how we identify and collect conflict data. As traffic conflicts are rare events, identifying traffic conflicts purely by hand is impractical. On the other hand, due to the fact that it is hard to give a quantitative description of traffic conflicts (compared with collisions, which we can define with physical contact between road users), purely relying on the algorithm to identify traffic conflicts is also not reliable. Therefore, we implement a traffic conflict identification algorithm to find potential traffic conflicts and then manually check them.
4.1 Input data
We first covert the video streams to short video clips, which are each seconds in length with a sample rate Hz. The resolution of the videos is set to . Due to the distortion of the fisheye cameras, vehicles at the opposite corner of the roundabout become tiny and unclear in the video. Therefore, we use the videos from four fisheye cameras independently instead of putting four videos from four cameras together for conflict identification.
4.2 Conflict identification algorithm
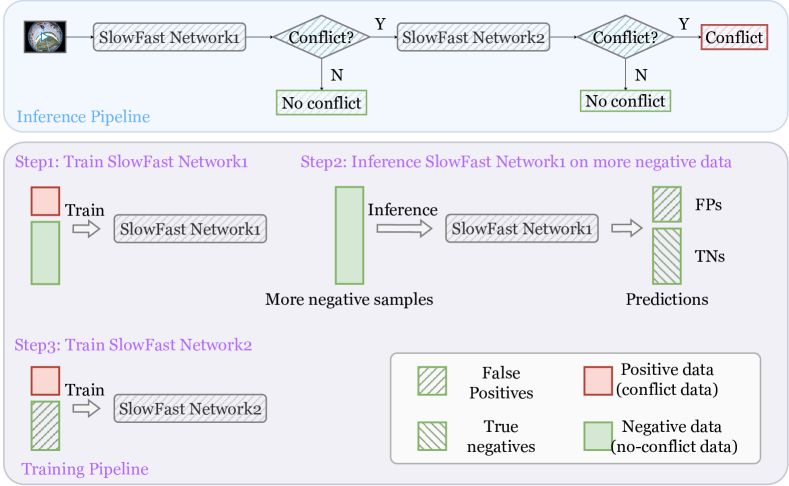
At first, we developed a rule-based algorithm to identify potential conflicts and manually check and annotate them, giving us initial traffic conflict samples. Then we use the traffic conflict samples to train a learning-based cascade framework for conflict identification. As shown in Figure 3, there are two stages in the cascade framework. The model architecture of the two stages is exactly the same, both are SlowFast [21] networks with binary classification (conflict or not) output. The SlowFast Network is a commonly-used video processing network. It takes raw videos as inputs. There are two pathways in the SlowFast Network: one slow pathway, operating at low frame rate to learn spatial features, and one fast pathway, operating at high frame rate to learn useful temporal information. The two networks have the same architecture, yet different parameters due to different training. During inference, only when both SlowFast Network1 and SlowFast Network2 predict the sample as a conflict, we take the final prediction as a conflict.
For training, as shown in Figure 3, we first construct a training set of SlowFast Network1 by assigning conflict videos as positive data, and randomly sampling negative data. Then we use this training set to train SlowFast Network1. Since traffic conflicts are very rare in real-world, the precision of the SlowFast Network1 is pretty low (). Most of the predictions of SlowFast Network1 are False Positives, which means most of the predicted conflict videos actually have no conflicts. To reduce the number of False Positives, we implement another network, SlowFast Network2, specifically for filtering the False Positives of SlowFast Network1. We infer SlowFast Network1 on more negative samples, and collect the False Positive samples. Then we construct a training set for SlowFast Network2: assigning conflict videos as positive data, and SlowFast Network1’s False Positives as negative data. Thus, the SlowFast Network2 is trained to tell the difference between real conflicts and SlowFast Network1’s False Positives.
We estimate the precision for both the first-stage model and the two-stage model. The precision is defined as
| (1) |
Here means number of True Positives, means number of False Positives, means False Negatives. Precision is the fraction of real conflicts among all the detected conflicts. For the first-stage model, the precision rate of the output videos is about . When we feed the output videos of the first-stage model into the second-stage model for re-identification, then the precision rate is improved to . With the help of the traffic conflict identification model, the annotation cost is reduced dramatically.
5 Data Annotation
5.1 Traffic conflict annotation and taxonomy
With the collected potential conflict samples, we design an annotation instruction for ROCO and work on annotating the potential conflict samples. We define three elements for a traffic conflict: the severity of the conflict, the reason for the conflict, and the effect of the conflict on the traffic flow.
Severity. For severity, we define three levels of severity in our conflict dataset. Level means that the data is a negative sample, there is no traffic conflicts in the clip. Some vehicles may violate a rule or law, but it does not place another user in jeopardy of collision. We do not consider this type of event as a traffic conflict. Level means that there is one or more traffic conflicts in the clip. Level means that a collision happens in the clip, there is physical contact between road users. We do not define further severity levels, since we do not find a universal representation for severity across the whole dataset, so we only apply the simplest metric. In the future, other safety metrics can be applied in the dataset.
(a)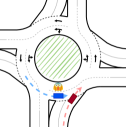 (b)
(b)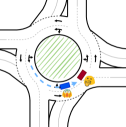 (c)
(c)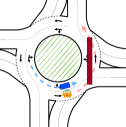 (d)
(d)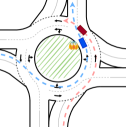
Reason. We divide the reasons for traffic conflicts in the roundabout to the following common categories:
-
•
(0) "Entering a roundabout without yielding to the circulating vehicles". According to roundabout laws in the state of Michigan, when entering a roundabout, the vehicle should yield to traffic circulating inside the roundabout and wait for a safe gap to enter. Failure to do so may cause a safety-critical event. An example of failure yield is shown in Figure 4(a).
-
•
(0*) "Large vehicles like bus/truck/trailer entering a roundabout without yielding to the circulating vehicles". This is a special case of Reason (0), and in our dataset, it has a higher priority than Reason (0). This means that if a large vehicle fails to yield and causes a traffic conflict, then it will be labeled as Reason (0*) instead of Reason (0). Since it is harder for large vehicles to enter the roundabout without interfering with circulating traffic, we make it a separate reason.
-
•
(1) "Unnecessary sudden braking/stop in the circle". When vehicles are circulating in the circle, they should not suddenly begin braking or stopping, unless there is an emergency. Sudden braking/stopping can result in rear-end crashes or near-crashes, as shown in Figure 4(b).
-
•
(2) "Truck/bus/trailer is too large and it interferes with other road users". Since some vehicles are too long or wide to comfortably fit in the roundabout, they may take up portions of both lanes. This can interfere with the other vehicles in the roundabout. Safety critical events between the large vehicle and surrounding vehicles can form, as shown in Figure 4(c).
-
•
(3) "Improper lane use". Leaving the roundabout at the wrong exit for a given lane, or crossing a lane in the roundabout disrupts the traffic flow, possibly causing a side-swipe collision. Figure 4(d) shows an example.
-
•
(4) "Other reasons". Many other reasons may cause a traffic conflict. These include traffic congestion and police vehicles/ambulances/firetrucks or other emergency vehicles. We put all these into the other reasons category.
From our observations, the reasons above cover most of the causes of traffic conflicts at this roundabout. For other roundabouts, the set of common reasons may need to be extended accordingly in the future. With these reasons for traffic conflicts, transportation researchers and government agencies might be able to better improve the driving education, traffic signs at roundabouts, etc to improve traffic safety.


Effect on the traffic flow. To better understand how traffic conflicts affect other vehicles, we annotate the effect of the traffic conflict on traffic flow in the roundabout. We divide the severity of the interference caused by the traffic conflict into four categories:
-
•
(0) Traffic flow is not affected. Even the vehicle causing the traffic conflict does not slow-down or stop. For example, a driver turns the steering wheel sharply to prevent a crash, but luckily no vehicle is around so no vehicle is forced to slow-down.
-
•
(1) One or two vehicles are forced to slow down due to the traffic conflict. This is one common scenario, since some vehicles slow down to avoid the conflict.
-
•
(2) One or two vehicles are forced to stop in the roundabout due to the traffic conflict. When the traffic conflict is severe, the driver might need to brake heavily to avoid the crash. Vehicles stopping in the roundabout are very dangerous to other upcoming vehicles.
-
•
(3) Three or more vehicles are forced to slow down or stop in the roundabout. This means that traffic in the roundabout is severely affected by the traffic conflict.
5.2 Vehicle detection and tracking system
Once we identified the video clips that contain traffic conflicts, we adopted a vehicle detection and tracking system for trajectory extraction. We re-use the roadside perception framework developed by [20, 19], except we replace the vehicle detector with a stronger YOLOX [41] detector. With the stronger detector, we are able to extract more accurate and robust trajectories. Figure 5 shows an example of the extracted trajectories for a traffic conflict.
5.3 Data collection and annotation efficiency
Currently, with the help of conflict identification algorithm, we manage to reduce the data collection and annotation cost significantly. The conflict identification algorithm inference speed is very fast compared to human annotation. With one NVIDIA RTX GPU, it takes around second inference time for a second video clip. For human annotation, we estimate that for one video clip, it requires one person seconds to determine whether there is a traffic conflict or not (identification), and an extra seconds to label the severity, reason, and effect of the traffic conflict. Table 1 illustrates the estimated cost for data collection and annotation of one traffic conflict data sample in ROCO. In ROCO, we estimate that in every video clips, there will be one video clip containing a traffic conflict, so if we purely rely on human annotation, it will cost about hours human labor to collect and annotate one traffic conflict. Fortunately, our traffic conflict identification algorithm is able to filter out most of the no-conflict video clips. With an identification precision around , in around video clips filtered from the identification algorithm, there is one video clip in it containing a traffic conflict. In this case, the estimated human labor cost is reduced to around s per sample. If we obtain a perfect traffic conflict identification algorithm, achieving precision, the human labor cost will be further reduced, but still, s per sample is required.
| Method | GPU time | Human identification time | Human labeling time | Total labor time |
|---|---|---|---|---|
| Pure human annotation | s | s | s | s |
| Our approach | s | s | s | s |
| Perfect identification | s | s | s | s |
6 Dataset Statistics and Analysis
This dataset contains video taken from the beginning August of until the end of October of . Each video that was flagged with a potential conflict was annotated with information such as whether there was a conflict/crash, reason for the conflict/crash, and the effect of the event on traffic flow.
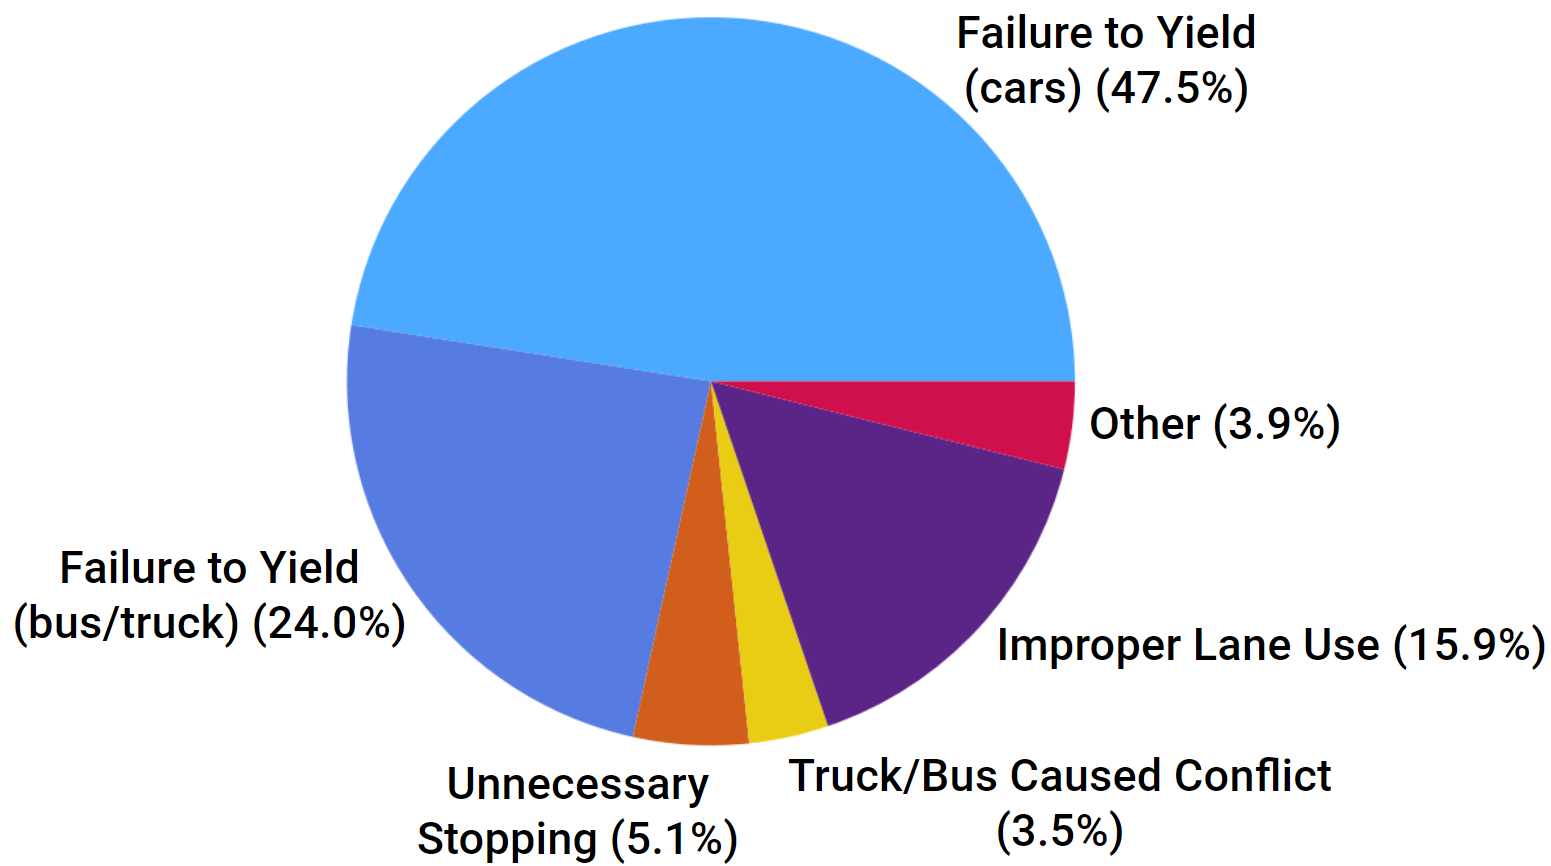
After having annotated and tagged each potential conflict, some basic statistics were run to analyze the results of the dataset. Overall there were crashes and traffic conflicts. Of the conflicts and crashes, the most common reason for the conflict was fail-to-yield to a vehicle already in the circle, followed by failure to yield by a truck, bus, or trailer, and the 3rd most common reason was improper lane use. All of the reasons and what percentage of conflicts and crashes they made up can be seen in Figure 6. These are interesting findings because all three reasons are fairly easy to prevent. In the case of failure to yield, perhaps drivers need more experience with roundabouts to learn about and get used to when to enter and when to wait. For improper lane use, drivers may need more education on roundabouts and the lanes, as well as additional or clearer signage at the roundabout.
Conflicts and crashes were also separated by hour of the day. This is shown in Figure 7(a). We can see that people tend to crash much more often in the afternoon hours than in the morning. Specifically between 3pm and 6pm; perhaps because of increased traffic in the afternoon. There also seems to be a large number of conflicts around noon. Something that is worth noting about this data is that no potential conflicts were flagged between midnight and 6am. This indicates that the camera or program may have trouble detecting vehicles and/or crashes when there is less light, although there are fewer drivers during the night which may partially account for this. Crashes and conflicts were also sorted by day of the week, as displayed in Figure 7(b). One interesting thing about this data is that Tuesday shows a much higher number of conflicts than does most of the rest of the work week. A fairly even number across the days would likely be expected. This may be explained by local events that aren’t accounted for.
(a)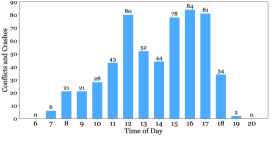 (b)
(b)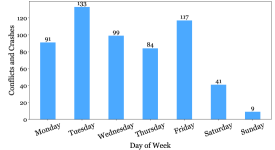
In order to better understand the effect on traffic flow of the different reasons for conflicts, several charts were created. These are the charts shown in Figure 8. They show the percentage of the conflicts with a given reason that had the given effect on traffic flow severity level. One interesting takeaway from this figure is that improper lane usage was most likely to result in an effect on traffic flow of severity 3, which means 3 or more cars slowed down or stopped. While all of the other reasons clearly show that the most likely effect on traffic flow was a severity of 1, only one or two cars slowed down.
(a)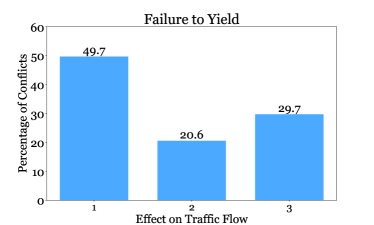 (b)
(b)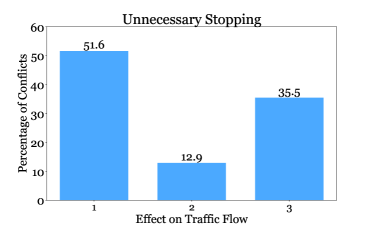
(c)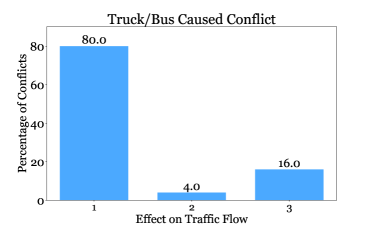 (d)
(d)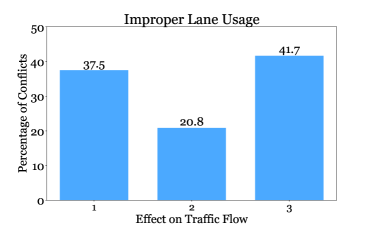
Overall the ROCO dataset contains crashes and traffic conflicts, the vast majority of which are caused by failure to yield to oncoming vehicles. These conflicts and crashes happen mostly during the afternoon around the 3pm to 6pm period; they also mostly occur on weekdays, with a peak on Tuesday. Most conflicts and crashes result in only a minor effect on traffic flow, while improper lane usage tends to have a more significant effect.
7 Limitation and Future Work
There are a few limitations of the ROCO dataset. The first one is the currently relatively small data size due to the human labor cost; The second one is the potential data bias problem brought by the traffic conflict identification algorithm we applied. We also discuss the data generalization to more traffic scenarios in this section.
7.1 Dataset size
Our current dataset only contains traffic conflicts and crashes. As discussed in the Data collection section, the human labor cost of identifying one traffic conflict in ROCO dataset is about seconds. Since traffic conflict is a very specialized type of event, we can only trust people with transportation knowledge for data annotation. We plan to further lower the human labor cost of data annotation so that large-scale traffic conflict data can be collected.
7.2 Potential data bias
Since we use a traffic conflict identification algorithm to identify potential traffic conflicts, it is possible that some data bias is introduced by the identification algorithm. For example, the algorithm might be more likely to identify traffic conflicts caused by ’fail to yield’ than other traffic conflict reasons. Since we do not have all the traffic conflicts at a certain time period, we are not able to estimate the data bias problem now. We will try to analyze the potential data bias issue in the future.
7.3 Generalization to other traffic scenes
Currently, we only collect traffic conflict data from one roundabout. For different roundabouts, or different intersections, the patterns and statistics on the traffic conflicts might be different. We plan to collect more traffic conflict data at different intersections and roundabouts to provide more diversity and coverage to the dataset.
8 Conclusion and Broader Impact
In this paper, we present ROCO, a roundabout traffic conflict dataset. Through adopting a traffic conflict identification algorithm, we manage to reduce the annotation cost to an affordable range. We provide a variety of labels for traffic conflicts, including severity, reason, and effect on traffic flow. Basic statistical analysis is performed with the data. We discover that failure to yield when entering the roundabout is the No. reason for traffic conflict in our dataset.
Unlike crash data, where one crash has to occur in order to obtain one crash data, traffic conflict data collection can be done without actual crashes happening. With the data collection and annotation pipeline, we believe that we can continue to provide more and more real traffic conflict data to the research community and government agencies. More analysis can be done by transportation researchers around the world when the ROCO dataset made public. Measures can be taken (e.g., make the traffic signs more clear) accordingly with the statistical analysis to prevent traffic conflicts, as well as potential crashes in the roundabout. Further, in autonomous vehicle development, testing the autonomous vehicles in the safety-critical scenarios is essential for reliability of autonomous vehicles. Our ROCO dataset might be able to serve as a safety-critical autonomous vehicles testing dataset.
9 Acknowledgements
The authors would like to thank Mcity at the University of Michigan, Ann Arbor for financial support. The authors also would like to thank all the members of Michigan Traffic Lab at University of Michigan, Ann Arbor. Their help in annotating the traffic conflict data is indispensable to the ROCO dataset and this paper.
10 Author contributions
The authors confirm their contribution to the paper as follows: study conception and design: Depu Meng, Shengyin Shen, Henry X. Liu; Data collection: Depu Meng, Owen Sayer, Rusheng Zhang, Shengyin Shen; Analysis and interpretation of results: Depu Meng, Owen Sayer; draft manuscript preparation: Depu Meng, Owen Sayer, Rusheng Zhang, Shengyin Shen, Houqiang Li, Henry X. Liu. All authors reviewed the results and approved the final version of the manuscript.
References
- Liu and Feng [2022] Liu, H. X. and S. Feng, "Curse of rarity" for autonomous vehicles. arXiv, 2022.
- Feng et al. [2021] Feng, S., X. Yan, H. Sun, Y. Feng, and H. X. Liu, Intelligent driving intelligence test for autonomous vehicles with naturalistic and adversarial environment. Nature communications, Vol. 12, No. 1, 2021, pp. 1–14.
- Glauz and Migletz [1980] Glauz, W. D. and D. J. Migletz, Application of traffic conflict analysis at intersections, 1980.
- Cooper [1977] Cooper, P., State-of-the-Art. Report on Traffic Conflicts Research in Canada. In Proceedings of the First Workshop on Traffic Conflicts, 1977.
- Hydén [1987] Hydén, C., The development of a method for traffic safety evaluation: The Swedish Traffic Conflicts Technique. Bulletin Lund Institute of Technology, Department, , No. 70, 1987.
- Tarko [2018] Tarko, A. P., Estimating the expected number of crashes with traffic conflicts and the Lomax Distribution–A theoretical and numerical exploration. Accident Analysis & Prevention, Vol. 113, 2018, pp. 63–73.
- Davis et al. [2011] Davis, G. A., J. Hourdos, H. Xiong, and I. Chatterjee, Outline for a causal model of traffic conflicts and crashes. Accident Analysis & Prevention, Vol. 43, No. 6, 2011, pp. 1907–1919.
- Madsen and Lahrmann [2017] Madsen, T. K. O. and H. Lahrmann, Comparison of five bicycle facility designs in signalized intersections using traffic conflict studies. Transportation research part F: traffic psychology and behaviour, Vol. 46, 2017, pp. 438–450.
- Beitel et al. [2018] Beitel, D., J. Stipancic, K. Manaugh, and L. Miranda-Moreno, Assessing safety of shared space using cyclist-pedestrian interactions and automated video conflict analysis. Transportation research part D: transport and environment, Vol. 65, 2018, pp. 710–724.
- Ma et al. [2018] Ma, Y., X. Qin, O. Grembek, and Z. Chen, Developing a safety heatmap of uncontrolled intersections using both conflict probability and severity. Accident Analysis & Prevention, Vol. 113, 2018, pp. 303–316.
- Brow [1994] Brow, G. R., Traffic conflicts for road user safety studies. Canadian Journal of Civil Engineering, Vol. 21, No. 1, 1994, pp. 1–15.
- Tarrall and Dixon [1998] Tarrall, M. B. and K. K. Dixon, Conflict Analysis for Double Left-Turn Lanes with Protected-Plus-Permitted Signal Phases. Transportation Research Record, Vol. 1635, No. 1, 1998, pp. 105–112.
- Ismail et al. [2010] Ismail, K., T. Sayed, and N. Saunier, Automated Analysis of Pedestrian–Vehicle Conflicts: Context for Before-and-After Studies. Transportation Research Record, Vol. 2198, No. 1, 2010, pp. 52–64.
- Tiwari et al. [1998] Tiwari, G., D. Mohan, and J. Fazio, Conflict analysis for prediction of fatal crash locations in mixed traffic streams. Accident Analysis & Prevention, Vol. 30, No. 2, 1998, pp. 207–215.
- Hossain et al. [2019] Hossain, M., M. Abdel-Aty, M. A. Quddus, Y. Muromachi, and S. N. Sadeek, Real-time crash prediction models: State-of-the-art, design pathways and ubiquitous requirements. Accident Analysis & Prevention, Vol. 124, 2019, pp. 66–84.
- Machiani and Abbas [2016] Machiani, S. G. and M. Abbas, Safety surrogate histograms (SSH): A novel real-time safety assessment of dilemma zone related conflicts at signalized intersections. Accident Analysis & Prevention, Vol. 96, 2016, pp. 361–370.
- Essa and Sayed [2018] Essa, M. and T. Sayed, Traffic conflict models to evaluate the safety of signalized intersections at the cycle level. Transportation Research Part C: Emerging Technologies, Vol. 89, 2018, pp. 289–302.
- Zheng et al. [2021] Zheng, L., T. Sayed, and F. Mannering, Modeling traffic conflicts for use in road safety analysis: A review of analytic methods and future directions. Analytic Methods in Accident Research, Vol. 29, 2021, p. 100142.
- Zhang et al. [0] Zhang, R., Z. Zou, S. Shen, and H. X. Liu, Design, Implementation, and Evaluation of a Roadside Cooperative Perception System. Transportation Research Record, Vol. 0, No. 0, 0, p. 03611981221092402.
- Zou et al. [2022] Zou, Z., R. Zhang, S. Shen, G. Pandey, P. Chakravarty, A. Parchami, and H. X. Liu, Real-time Full-stack Traffic Scene Perception for Autonomous Driving with Roadside Cameras, 2022.
- Feichtenhofer et al. [2019] Feichtenhofer, C., H. Fan, J. Malik, and K. He, Slowfast networks for video recognition. In Proceedings of the IEEE/CVF international conference on computer vision, 2019, pp. 6202–6211.
- Vogel [2003] Vogel, K., A comparison of headway and time to collision as safety indicators. Accident Analysis & Prevention, Vol. 35, No. 3, 2003, pp. 427–433.
- Guido et al. [2011] Guido, G., F. Saccomanno, A. Vitale, V. Astarita, and D. Festa, Comparing safety performance measures obtained from video capture data. Journal of Transportation Engineering, Vol. 137, No. 7, 2011, p. 481 – 491, cited by: 56.
- Laureshyn et al. [2017] Laureshyn, A., T. De Ceunynck, C. Karlsson, Å. Svensson, and S. Daniels, In search of the severity dimension of traffic events: Extended Delta-V as a traffic conflict indicator. Accident Analysis & Prevention, Vol. 98, 2017, pp. 46–56.
- Yorio and Moore [2017] Yorio, P. and S. Moore, Examining Factors that Influence the Existence of Heinrich’s Safety Triangle Using Site-Specific H&S Data from More than 25,000 Establishments: Examining Factors that Influence the Existence of Heinrich’s Safety Triangle. Risk Analysis, Vol. 38, 2017.
- Orsini et al. [2021] Orsini, F., G. Gecchele, R. Rossi, and M. Gastaldi, A conflict-based approach for real-time road safety analysis: Comparative evaluation with crash-based models. Accident Analysis & Prevention, Vol. 161, 2021, p. 106382.
- Glauz et al. [1985] Glauz, W. D., K. M. Bauer, and D. J. Migletz, EXPECTED TRAFFIC CONFLICT RATES AND THEIR USE IN PREDICTING ACCIDENTS. Transportation Research Record, 1985.
- Zheng et al. [2014a] Zheng, L., K. Ismail, and X. Meng, Traffic conflict techniques for road safety analysis: Open questions and some insights. Canadian Journal of Civil Engineering, Vol. 41, 2014a.
- Ye and Lord [2011] Ye, F. and D. Lord, Investigation of Effects of Underreporting Crash Data on Three Commonly Used Traffic Crash Severity Models. Transportation Research Record: Journal of the Transportation Research Board, Vol. 2241, 2011, pp. 51–58.
- Zheng et al. [2014b] Zheng, L., K. Ismail, and X. Meng, Shifted Gamma-Generalized Pareto Distribution model to map the safety continuum and estimate crashes. Safety Science, Vol. 64, 2014b, pp. 155–162.
- El-Basyouny and Sayed [2013] El-Basyouny, K. and T. Sayed, Safety performance functions using traffic conflicts. Safety Science, Vol. 51, No. 1, 2013, pp. 160–164.
- Xie et al. [2016] Xie, K., C. Li, K. Ozbay, G. Dobler, H. Yang, A.-T. Chiang, and M. Ghandehari, Development of a comprehensive framework for video-based safety assessment, 2016, pp. 2638–2643.
- Nofal and Saeed [1997] Nofal, F. and A. Saeed, Seasonal variation and weather effects on road traffic accidents in Riyadh City. Public Health, Vol. 111, No. 1, 1997, pp. 51–55.
- Chen et al. [2019] Chen, Q., S. Tang, Q. Yang, and S. Fu, Cooper: Cooperative perception for connected autonomous vehicles based on 3d point clouds. In 2019 IEEE 39th International Conference on Distributed Computing Systems (ICDCS), IEEE, 2019, pp. 514–524.
- Rauch et al. [2012] Rauch, A., F. Klanner, R. Rasshofer, and K. Dietmayer, Car2x-based perception in a high-level fusion architecture for cooperative perception systems. In 2012 IEEE Intelligent Vehicles Symposium, IEEE, 2012, pp. 270–275.
- Wang et al. [2020] Wang, T.-H., S. Manivasagam, M. Liang, B. Yang, W. Zeng, and R. Urtasun, V2vnet: Vehicle-to-vehicle communication for joint perception and prediction. In European Conference on Computer Vision, Springer, 2020, pp. 605–621.
- Ye et al. [2022] Ye, X., M. Shu, H. Li, Y. Shi, Y. Li, G. Wang, X. Tan, and E. Ding, Rope3D: TheRoadside Perception Dataset for Autonomous Driving and Monocular 3D Object Detection Task, 2022.
- Yu et al. [2022] Yu, H., Y. Luo, M. Shu, Y. Huo, Z. Yang, Y. Shi, Z. Guo, H. Li, X. Hu, J. Yuan, and Z. Nie, DAIR-V2X: A Large-Scale Dataset for Vehicle-Infrastructure Cooperative 3D Object Detection, 2022.
- Tsukada et al. [2020] Tsukada, M., T. Oi, M. Kitazawa, and H. Esaki, Networked roadside perception units for autonomous driving. Sensors, Vol. 20, No. 18, 2020, p. 5320.
- Autey et al. [2012] Autey, J., T. Sayed, and M. H. Zaki, Safety evaluation of right-turn smart channels using automated traffic conflict analysis. Accident Analysis & Prevention, Vol. 45, 2012, pp. 120–130.
- Ge et al. [2021] Ge, Z., S. Liu, F. Wang, Z. Li, and J. Sun, YOLOX: Exceeding YOLO Series in 2021, 2021.