Detector bandwidth and polarisation switching rates: spectrophotometric observations of the Sun by the Birmingham Solar Oscillations Network (BiSON)–Detector bandwidth and polarisation switching rates: spectrophotometric observations of the Sun by the Birmingham Solar Oscillations Network (BiSON)
Detector bandwidth and polarisation switching rates: spectrophotometric observations of the Sun by the Birmingham Solar Oscillations Network (BiSON)
Abstract
The Birmingham Solar Oscillations Network (BiSON) observes acoustic oscillations of the Sun. The dominant noise source is caused by fluctuations of Earth’s atmosphere, and BiSON seeks to mitigate this effect by combining multiple rapid observations in alternating polarisation states. Current instrumentation uses bespoke Pockels-effect cells to select the polarisation state. Here, we investigate an alternative off-the-shelf solution, a liquid crystal retarder, and discuss the potential impact of differences in performance. We show through electrical simulation of the photodiode-based detectors, and assessment of both types of polarisation device, that although the switching rate is slower the off-the-shelf LCD retarder is a viable replacement for a bespoke Pockels-effect cell. The simplifications arising from the use of off-the-shelf components allows easier and quicker instrumentation deployment.
keywords:
Instrumentation – instrumentation: detectors – instrumentation: photometers – techniques: spectroscopic – techniques: radial velocities – Sun: helioseismology1 Introduction
The Birmingham Solar Oscillations Network (BiSON) is a ground-based network of solar observatories, consisting of six sites measuring acoustic oscillations of the Sun (Hale et al., 2016; Hale, 2019). The instrumentation makes high-precision measurements of the Doppler velocity of the solar surface by making use of spectrophotometry – photometry of a spectral line. BiSON observes the D1 transition of potassium, which has a central wavelength of .
Photometry from the ground is challenging due to fluctuation of Earth’s atmosphere, known as atmospheric scintillation, which typically becomes the dominant noise source. In order to limit the effect of this source of noise it is necessary to restrict detector exposure times to generally (Osborn et al., 2015). Measurement of scintillation at the BiSON sites has shown that the point typically occurs at around , and occurs above (Hale et al., 2020).
The BiSON spectrophotometers mitigate this problem by rapidly switching the measurement wavelength between the red and the blue wings of the solar absorption line, and then normalising by the sum of the intensities at the two working points to form an intensity ratio, ,
| (1) |
where and are the intensities measured at the blue and red wings of the solar absorption line, respectively. It is this ratio measurement that is then integrated over an acquisition period of . The typical instrumental velocity sensitivity is per unit ratio (Elsworth et al., 1995). The level of reduction of scintillation noise is dependent on the switching rate, where higher switching rates produce better noise suppression but are more difficult to achieve.
Wavelength selection is controlled through polarisation switching. Both polarisation states are multiplexed through a single detector in order to avoid differences in noise, gain, or sensitivity. The detector has both a high gain requirement, and also a relatively high bandwidth requirement (in comparison to the few solar oscillations) due to the transient signal changes. The original detectors used in BiSON instrumentation in the early 1990s were designed and adjusted empirically to achieve optimisation. In Section 2 we take a formal approach to performance analysis through circuit simulation using SPICE, the industry standard electrical simulation tool, to determine detector noise levels, frequency response, and slew rate. In Section 3 we look at methods of electronically controlling light polarisation state. Existing BiSON instrumentation uses bespoke field-widened Pockels-effect cells. Many solar Zeeman spectropolarimetry projects have moved to using off-the-shelf Nematic Liquid Crystal (NLC) variable retarders in order to improve both switching rate and mechanical reliability (see, e.g., Zangrilli et al. 2006; Jaeggli et al. 2010; Beck et al. 2010; Harrington et al. 2010; Martínez Pillet et al. 2011; Guo et al. 2017; Parejo et al. 2019; Ren et al. 2020). However, NLCs are typically much slower to transition between states than Pockels-effect cells. A Ferro-electric Liquid Crystal (FLC) polarisation modulator (Gandorfer, 1999; Roelfsema et al., 2010; Rebolledo et al., 2018; Iglesias & Feller, 2019) can achieve switching rates comparable to a Pockels-effect cell, but has the disadvantage of being considerably more expensive than NLCs. Here, we look at only the more affordable NLCs as potential replacements for our Pockels-effect cells. Finally, in Section 4, we discuss the impact on BiSON spectrophotometer design and configuration (Hale et al., 2022), and the move from Pockels-effect cell to LC-based polarisation control.
2 Detector Simulation
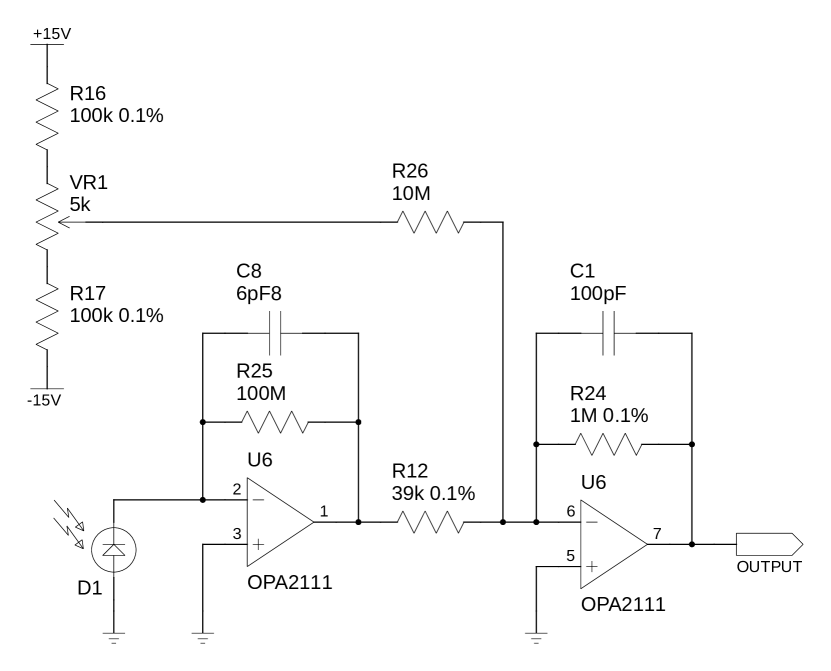
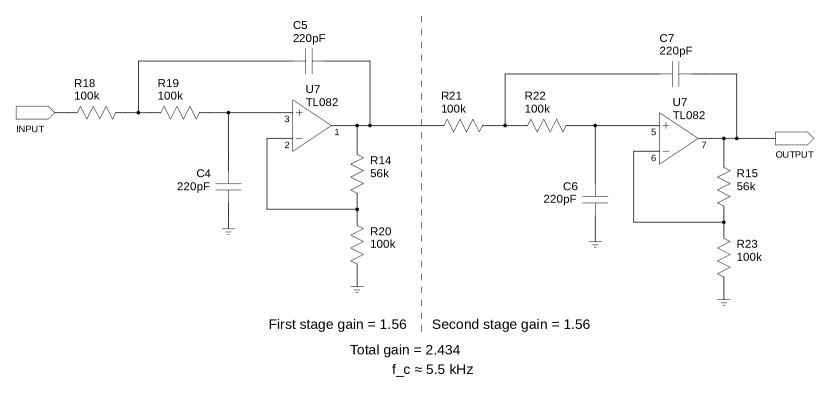
The detector schematic is shown in Figure 1. The circuit uses a transimpedance amplifier for initial photocurrent-to-voltage conversion, followed by a second stage voltage amplifier for additional gain. The scattering detectors receive between and of light depending on atmospheric conditions and the line-of-sight velocity offset of the spectral line (Hale 2019; Hale et al. 2022). The transimpedance amplifier requires a gain resistor to convert a few hundred of photocurrent to an output of a few . The second stage boosts this to a few hundred . The signal is then passed through a 4-pole low-pass Bessel filter, shown in Figure 2, which removes high-frequency noise and also provides a little more gain to boost the output dynamic range to between . The final signal is subsequently fed into a voltage-to-frequency converter, and the output pulses sent to a set of counters for acquisition and post-processing.
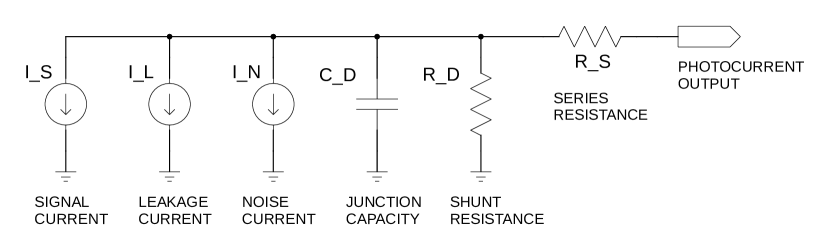
When simulating this circuit, the photodiode is broken down into an equivalent circuit of several discrete components (Graeme, 1996), shown in Figure 3. The model is simplified by ignoring both the leakage current and noise current, since the photodiode is operated in the low-noise photovoltaic mode of amplification, and in a high-gain environment the diode intrinsic noise becomes insignificant in comparison to that from the rest of the system. The series resistance is not stated by manufacturer, and so this has been assumed to be low at . The photodiode has a maximum junction capacitance of , and the shunt resistance is typically . The final photodiode model is that of a signal current source, a parallel capacitance, a parallel shunt resistance, and a series resistance. We can use this model along with SPICE (Nagel & Pederson, 1973; Nagel, 1975) simulation to analyse the performance of the BiSON detectors, determining noise levels, frequency response, and finally slew rate.
2.1 Noise Performance
In a high-gain environment the noise level is generally dominated by Johnson-Nyquist thermal noise from the gain resistance. Over a bandwidth at room temperature for a gain resistor this produces of thermal noise. The detector has a combined gain of after the initial current-to-voltage conversion, and so this means we can expect to obtain around of noise just from Johnson noise alone.
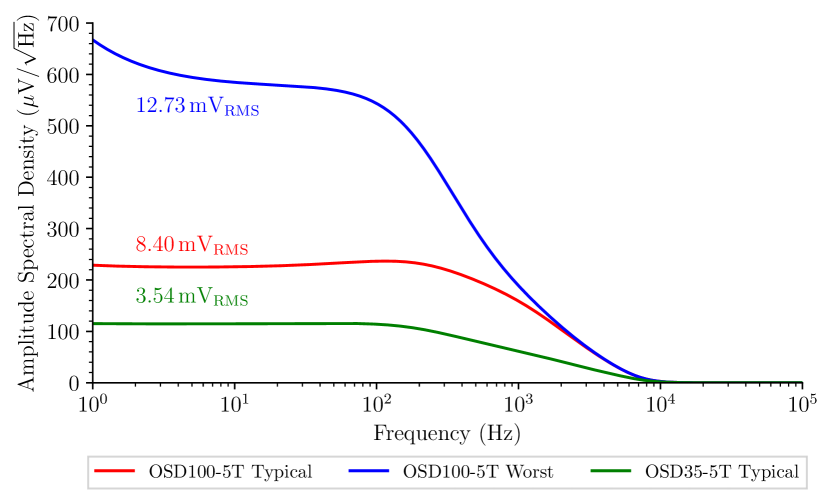
Another important source of noise in the circuit is produced by the operational amplifiers. The input bias current can become quite significant depending on the overall gain of the system. The input bias current is also temperature dependent, and so a low temperature coefficient is crucial for long term stability. Figure 4 shows the results of the noise analysis, using both typical and worst-case photodiode parameters provided by the manufacturer datasheet, and also for comparison a smaller photodiode. The noise level is Johnson-Nyquist limited, typically . Assuming a typical detector voltage output of , passing the noise through equation 1, and applying a velocity sensitivity of , this results in an electronic velocity noise level of the order of RMS. The line-of-sight velocity component due to oscillations of the Sun is of the order of and this is superimposed on the much larger, up to , components due to Earth’s rotation and the solar gravitational redshift (Elsworth et al., 1995).
2.2 Frequency Response
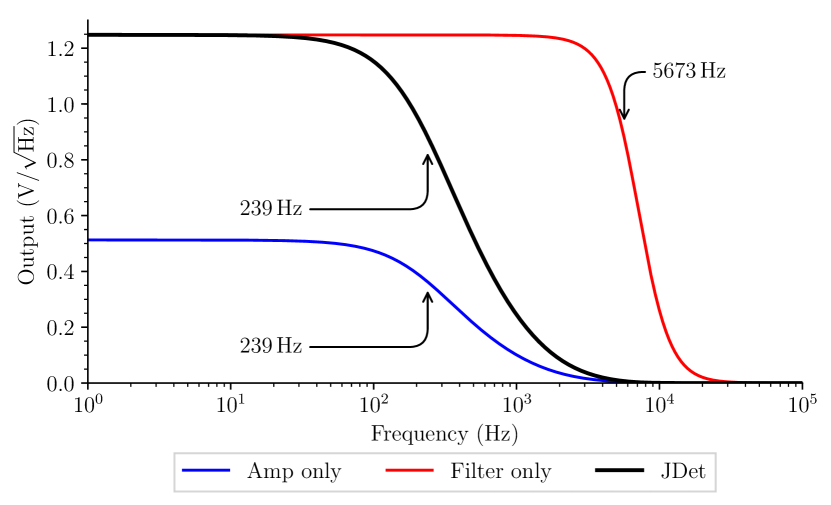
The SPICE simulation of frequency response is shown in Figure 5, including separately for both the amplifier-stage, and the filter-stage. Due to the very high gain of the initial transimpedance amplifier the bandwidth is just . The bandwidth of the Bessel low-pass filter is actually higher at than the bandwidth of the first stage amplifier, and so the filter is doing nothing except providing additional gain. It is possible that the filter was designed before the required gain and bandwidth were known. Since we know the total noise is dominated by the bandwidth-limited first stage transimpedance amplifier, the detector design could be simplified by removing the filter completely and increasing the gain of the second stage amplifier, eliminating more than half of the components.
2.3 Slew Rate and Transient Response
A transient can be considered an ideal square wave. The response of a circuit at high frequencies affects its processing of short-time events. Johnson & Graham (1993) describe a rule of thumb for the maximum practical frequency component as,
| (2) |
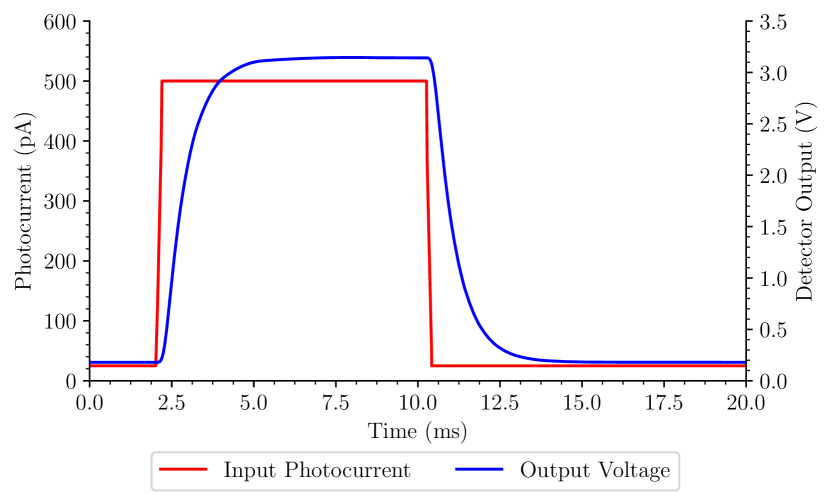
where is the desired rise time of a transition, and the inflection point or “knee” in the frequency spectrum above which frequency components are insignificant in the determining the shape of the signal. If we require a rise time of , then this suggests a bandwidth requirement of . We know from the frequency response analysis that the bandwidth is , and so we can expect the rise time to be longer than for a transition. Figure 6 shows the SPICE transient response analysis. The simulated photocurrent is stepped from , resulting in a rise time of depending on the acceptable percent of completion.
In the next section we look at two methods of electronically controlling light polarisation state, and the slew rates that can be achieved.
3 Electro-optic Light Modulation
3.1 Pockels-effect Cells
Most BiSON instrumentation uses Pockels-effect cells constructed using potassium dideuterium phosphate (KD*P), which belongs to the tetragonal crystal system (Phillips, 2011). This crystal exhibits birefringence and is normally optically uniaxial, however when placed in an electric field it becomes biaxial. The KD*P crystal is z-cut, which means that the two faces of the crystal are normal to the crystallographic z-axis. The on-axis rays through the spectrophotometer are parallel to the crystallographic z-axis, and the beam propagates in the positive z-direction. The cell acts as a linear retarder to a beam passing through the Pockels cell parallel to the optical axis. An electric field can be applied via transparent electrodes applied to the input and output faces of the crystal. The retardance varies linearly with the voltage applied across the electrodes, and at approximately the retardance reaches and the Pockels cell behaves like a quarter-wave plate. When combined with a linear polariser this causes one of the polarisation components to be retarded by in phase (a quarter of a wavelength) in relation to the other component, producing circularly polarised light. Circular polarisation is considered to be left- or right-handed depending on direction of rotation of the electric field vector of the wave. If the electric field across the cell is reversed then the retardance becomes and the opposite handedness of circular polarisation is produced.
The switching rate of a Pockels cell was tested by monitoring the change in light intensity between crossed polarisers. In industry it is typical to quote the slew-rate of a device as the time taken to transition from of the final value. Here we quote time taken from the instant the change is commanded to when the output reaches and of the final light intensity. The switching rate for transitions in both polarisation directions is shown in Figure 7. Power is supplied via a bespoke high-voltage supply. The driver has a “shape” control that smooths the applied square-wave voltage transitions and so helps to relieve mechanical stress on the crystal, at the expense of a slightly longer transition period. At minimum smoothing the switching time to of the final intensity is approximately . With maximum smoothing the switching time is approximately , and this is broadly symmetric in both directions. The instrumentation is typically operated with maximum smoothing to extend the life of the crystal, and so the switching time is considered to be nominally .
Both the field-widened Pockels cell and the required high-voltage computer-controlled driver are bespoke devices that are difficult to manufacture. Whilst commercial Pockels cells are available, their intended use is with highly collimated beams and so they have small apertures and very limited field of view. We will now look at a commercial alternative that is a potential off-the-shelf direct replacement.
3.2 Liquid Crystal Retarder
Many nematic crystal organic molecules are uniaxial with one long axis and two others of equal length, similar to a cylinder. In the nematic phase the cylinders have no preferential order, but they self-align with their long axes approximately parallel and this creates an optical anisotropy. When an electric field is applied the molecules tilt and align to the field, and so changes in the field strength cause changes in the effective retardance. The driving signal is typically between , considerably lower, more convenient, and safer than the required by a Pockels-effect cell.
However, LCD retarders are typically slower to switch between states than a Pockels-effect cell. Switching rate is affected by both the size of the difference between applied voltages, and the crystal temperature. When switching from a low voltage to a high voltage, the liquid crystal becomes under tension and the change occurs rapidly. In the reverse direction the rate is limited by how long it takes the cell to “relax” back to its natural state and this is determined by the liquid viscosity, and so by the temperature. The low-to-high voltage transition is much faster than the high-to-low voltage transition. Higher temperatures and larger voltage differences allow for faster switching. The overall change in polarisation varies slightly with temperature, and so it is important to calibrate the control voltages at the intended operating temperature, and then ensure stability at that temperature.
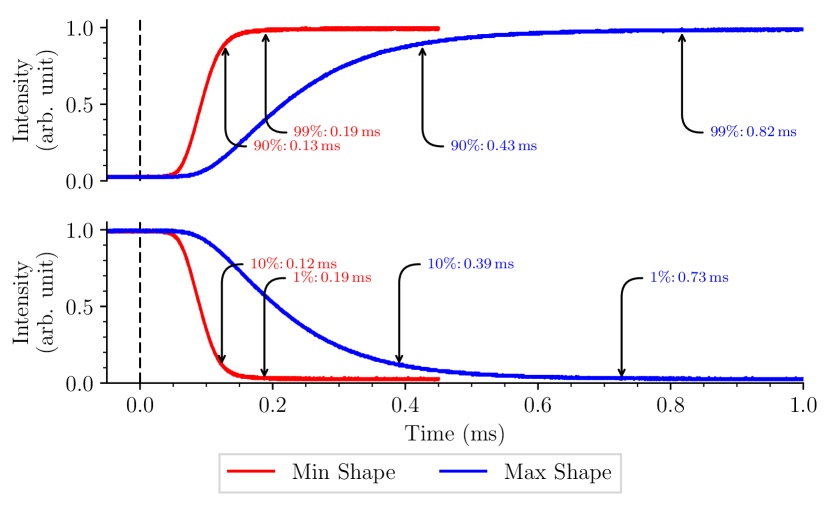
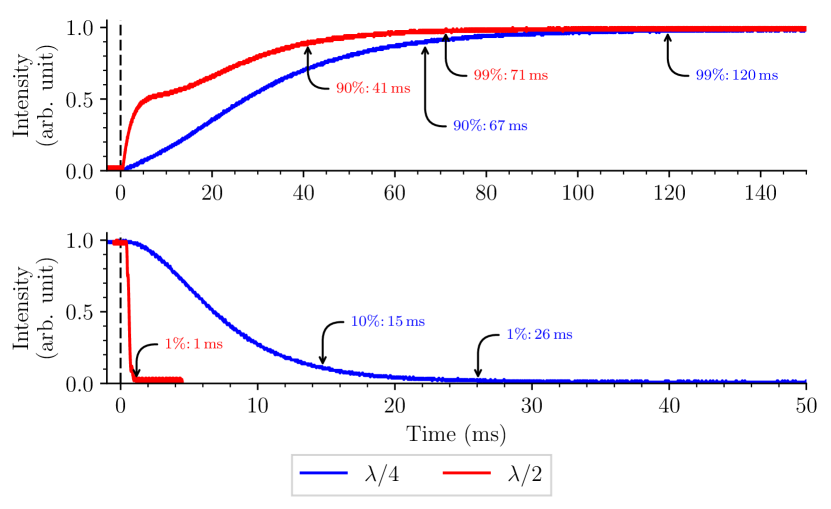
Figure 8 shows the time for both and a transition at room temperature with times to and indicated. When considering switching, the fast direction (low-to-high voltage) takes between . Switching in the slow direction (high-to-low voltage) takes between . The transition between and requires control voltages of and respectively.
The switching time can be reduced by adding a fixed quarter-wave plate and instead operating the LCD between zero- and half-wave retardance, which requires control voltages of and respectively. This configuration reduces the fast transition to just and the slow transition to between . However, this remains much slower than a Pockels-effect cell.
The slower transition rate can be improved by heating the liquid crystal. Figure 9 shows the high-to-low voltage switching time from zero-wave to half-wave for a range of temperatures. Table 1 shows the switching time for both the and transition completion points. At the switching time is between . There is little improvement above and so this is the ideal operating temperature with respect to switching rate and maximising the life expectancy of the crystal.
A transition time of is longer than that achieved with a Pockel’s effect cell. We discuss the potential impact of moving to LCD-based polarisation control in the next section.
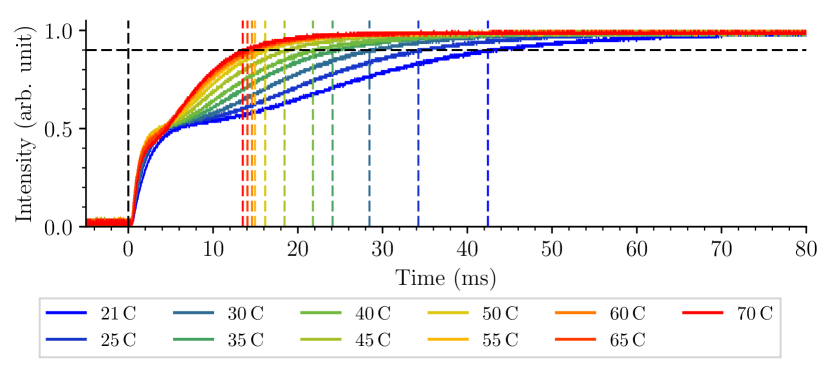
| Switching rate () at Temperature () | |||||||||||
| Temp | 21 | 25 | 30 | 35 | 40 | 45 | 50 | 55 | 60 | 65 | 70 |
| 42 | 34 | 28 | 24 | 22 | 18 | 16 | 15 | 15 | 14 | 14 | |
| 74 | 57 | 48 | 42 | 43 | 31 | 27 | 26 | 27 | 27 | 25 | |
4 Discussion
The noise characteristics of resonant scattering spectrophotometers, such as those deployed by BiSON, have been investigated by several authors in terms of time-dependent effects on the solar oscillation modes extracted from the observations – see, e.g., Grec et al. (1976); Brookes et al. (1978); Appourchaux (1989); Hoyng (1989, 1991); Chaplin et al. (2005). Here, we have considered electronic and atmospheric effects on the whole frequency envelope.
It is known that atmospheric scintillation is the dominant noise source in BiSON raw data (Hale, 2019). The BiSON spectrophotometers mitigate noise from atmospheric scintillation by rapidly switching the measurement wavelength between the red and the blue wings of the solar D1 transition of potassium, with polarisation switching rates targeting . The data acquisition system applies a exposure time for each polarisation state, and a stabilisation delay between transitions, producing a switching rate of . This is repeated for cycles giving a total acquisition period of , of which is exposure time. The values are then read out and the cycle repeated with a cadence. There is dead-time due to stabilisation delays and data readout within each integration period. We found here that the scattering detector amplifier rise time is longer than expected, and requires up to of stabilisation time resulting in some polarisation state mixing between data channels which is reducing the instrumental sensitivity.
When using NLC-based polarisation switching, the much longer rise time of up to requires a slower switching rate to avoid unacceptably high dead-time. If we accept a stabilisation period, then a switching rate of can be achieved with dead-time. This can be raised to with stabilisation and dead-time. Measurement of scintillation noise at the BiSON sites has shown that the point typically occurs above (Hale et al., 2020), and so it would be acceptable to reduce the switching rate a little if necessary. Whilst is ideal, up to is acceptable. However, the NLC performance remains slower than ideal switching rates. An FLC would be able to achieve performance equivalent to a Pockels-effect cell, but at the requirement of a much larger budget than NLC.
A prototype fibre-fed spectrophotometer based largely on off-the-shelf components, and using NLC-based polarisation switching, has been tested at the BiSON site in the Canary Islands (Hale et al., 2022). Whilst noise levels are, as expected, slightly higher than the best BiSON sites, the results are in-line with average network performance. The off-the-shelf nematic LCD retarder is a viable replacement for a bespoke Pockels-effect cell. The simplifications arising from the use of off-the-shelf components allows easier and lower cost instrumentation deployment, as utilised by BiSON:NG, the next generation observing platform for BiSON (Hale, 2019; Hale et al., 2020). Increasing the number of contemporaneous observations from many sites allows noise to be beaten down by combining many incoherent measurements of the observed noise level (Lund et al., 2017), and this produces an overall improvement in noise level for the network as a whole.
Acknowledgements
We would like to thank all those who have been associated with BiSON over the years. We particularly acknowledge the invaluable technical assistance at all our remote network sites. BiSON is funded by the Science and Technology Facilities Council (STFC) grant ST/V000500/1.
Data Availability
All data are freely available from the BiSON Open Data Portal – http://bison.ph.bham.ac.uk/opendata. Data products are in the form of calibrated velocity residuals, concatenated into a single time series from all BiSON sites. Individual days of raw or calibrated data, and also bespoke products produced from requested time periods and sites, are available by contacting the authors. Oscillation mode frequencies and amplitudes are available from Broomhall et al. (2009) and Davies et al. (2014).
References
- Appourchaux (1989) Appourchaux, T., 1989. Optimization of parameters for helioseismology experiments measuring solar radial velocities, A&A, 222(1-2), 361–366.
- Beck et al. (2010) Beck, C., Bellot Rubio, L. R., Kentischer, T. J., Tritschler, A., & Del Toro Iniesta, J. C., 2010. Two-dimensional solar spectropolarimetry with the KIS/IAA Visible Imaging Polarimeter, A&A, 520, A115.
- Brookes et al. (1978) Brookes, J. R., Isaak, G. R., & van der Raay, H. B., 1978. A resonant-scattering solar spectrometer, MNRAS, 185, 1–18.
- Broomhall et al. (2009) Broomhall, A. M., Chaplin, W. J., Davies, G. R., Elsworth, Y., Fletcher, S. T., Hale, S. J., Miller, B., & New, R., 2009. Definitive Sun-as-a-star p-mode frequencies: 23 years of BiSON observations, MNRAS, 396(1), L100–L104.
- Chaplin et al. (2005) Chaplin, W. J., Elsworth, Y., Isaak, G. R., Miller, B. A., New, R., & Pintér, B., 2005. Noise characteristics of full-disc helioseismic observations made by resonant scattering spectrometers, MNRAS, 359(2), 607–614.
- Davies et al. (2014) Davies, G. R., Broomhall, A. M., Chaplin, W. J., Elsworth, Y., & Hale, S. J., 2014. Low-frequency, low-degree solar p-mode properties from 22 years of Birmingham Solar Oscillations Network data, MNRAS, 439(2), 2025–2032.
- Elsworth et al. (1995) Elsworth, Y., Howe, R., Isaak, G. R., McLeod, C. P., Miller, B. A., New, R., & Wheeler, S. J., 1995. Techniques used in the analysis of solar oscillations data from the BiSON (University of Birmingham) network. I. Daily calibration., A&AS, 113, 379.
- Gandorfer (1999) Gandorfer, A. M., 1999. Ferroelectric retarders as an alternative to piezoelastic modulators for use in solar Stokes vector polarimetry, Optical Engineering, 38(8), 1402 – 1408.
- Graeme (1996) Graeme, J., 1996. Photodiode Amplifiers: Op Amp Solutions, Gain technology, McGraw Hill.
- Grec et al. (1976) Grec, G., Fossat, E., & Vernin, J., 1976. A spectrophotometer for the study of long period solar photospheric oscillations., A&A, 50(2), 221–225.
- Guo et al. (2017) Guo, J., Ren, D.-Q., Liu, C.-C., Zhu, Y.-T., Dou, J.-P., Zhang, X., & Beck, C., 2017. Design and calibration of a high-sensitivity and high-accuracy polarimeter based on liquid crystal variable retarders, Research in Astronomy and Astrophysics, 17(1), 8.
- Hale (2019) Hale, S. J., 2019. Birmingham Solar Oscillations Network: The Next Generation, Ph.D. thesis, School of Physics and Astronomy, University of Birmingham, UK.
- Hale et al. (2016) Hale, S. J., Howe, R., Chaplin, W. J., Davies, G. R., & Elsworth, Y. P., 2016. Performance of the Birmingham Solar-Oscillations Network (BiSON), Sol. Phys., 291(1), 1–28.
- Hale et al. (2020) Hale, S. J., Chaplin, W. J., Davies, G. R., & Elsworth, Y. P., 2020. A next generation upgraded observing platform for the automated Birmingham Solar Oscillations Network (BiSON), in Software and Cyberinfrastructure for Astronomy VI, vol. 11452, pp. 424 – 435, International Society for Optics and Photonics, SPIE.
- Hale et al. (2020) Hale, S. J., Chaplin, W. J., Davies, G. R., Elsworth, Y. P., Howe, R., & Pallé, P. L., 2020. Measurement of Atmospheric Scintillation during a Period of Saharan Dust (Calima) at Observatorio del Teide, Iz̃ana, Tenerife, and the Impact on Photometric Exposure Times, PASP, 132(1009), 034501.
- Hale et al. (2022) Hale, S. J., Chaplin, W. J., Davies, G. R., Elsworth, Y. P., & Howe, R., 2022. The next generation Birmingham Solar Oscillations Network (BiSON) spectrophotometer: a new miniaturized instrument for helioseismology, RAS Techniques and Instruments, 1(1), 58–64.
- Harrington et al. (2010) Harrington, D. M., Kuhn, J. R., Sennhauser, C., Messersmith, E. J., & Thornton, R. J., 2010. Achromatizing a Liquid-Crystal Spectropolarimeter: Retardance vs. Stokes-Based Calibration of HiVIS, PASP, 122(890), 420.
- Hoyng (1989) Hoyng, P., 1989. On the Sensitivity of Resonant Scattering Spectrometers for Whole-Disk Solar Velocity Oscillation Measurements, ApJ, 345, 1088.
- Hoyng (1991) Hoyng, P., 1991. The velocity sensitivity of resonant scattering spectrometers employing a piezoelastic modulator, Sol. Phys., 133(1), 43–50.
- Iglesias & Feller (2019) Iglesias, F. A. & Feller, A. J., 2019. Instrumentation for solar spectropolarimetry: state of the art and prospects, Optical Engineering, 58(8), 082417.
- Jaeggli et al. (2010) Jaeggli, S. A., Lin, H., Mickey, D. L., Kuhn, J. R., Hegwer, S. L., Rimmele, T. R., & Penn, M. J., 2010. FIRS: a new instrument for photospheric and chromospheric studies at the DST., Mem. Soc. Astron. Italiana, 81, 763.
- Johnson & Graham (1993) Johnson, H. & Graham, M., 1993. High-speed Digital Design: A Handbook of Black Magic, Prentice Hall Modern Semicondu, Prentice Hall.
- Lund et al. (2017) Lund, M. N., Chaplin, W. J., Hale, S. J., Davies, G. R., Elsworth, Y. P., & Howe, R., 2017. Spatial incoherence of solar granulation: a global analysis using BiSON 2B data, Monthly Notices of the Royal Astronomical Society, 472(3), 3256–3263.
- Martínez Pillet et al. (2011) Martínez Pillet, V., del Toro Iniesta, J. C., Álvarez-Herrero, A., Domingo, V., Bonet, J. A., González Fernández, L., López Jiménez, A., Pastor, C., Gasent Blesa, J. L., Mellado, P., Piqueras, J., Aparicio, B., Balaguer, M., Ballesteros, E., Belenguer, T., Bellot Rubio, L. R., Berkefeld, T., Collados, M., Deutsch, W., Feller, A., Girela, F., Grauf, B., Heredero, R. L., Herranz, M., Jerónimo, J. M., Laguna, H., Meller, R., Menéndez, M., Morales, R., Orozco Suárez, D., Ramos, G., Reina, M., Ramos, J. L., Rodríguez, P., Sánchez, A., Uribe-Patarroyo, N., Barthol, P., Gandorfer, A., Knoelker, M., Schmidt, W., Solanki, S. K., & Vargas Domínguez, S., 2011. The Imaging Magnetograph eXperiment (IMaX) for the Sunrise Balloon-Borne Solar Observatory, Sol. Phys., 268(1), 57–102.
- Nagel (1975) Nagel, L. W., 1975. SPICE2: A Computer Program to Simulate Semiconductor Circuits, Ph.D. thesis, EECS Department, University of California, Berkeley.
- Nagel & Pederson (1973) Nagel, L. W. & Pederson, D., 1973. SPICE (Simulation Program with Integrated Circuit Emphasis), Tech. Rep. UCB/ERL M382, EECS Department, University of California, Berkeley.
- Osborn et al. (2015) Osborn, J., Föhring, D., Dhillon, V. S., & Wilson, R. W., 2015. Atmospheric scintillation in astronomical photometry, MNRAS, 452, 1707–1716.
- Parejo et al. (2019) Parejo, P. G., Álvarez-Herrero, A., Capobianco, G., & Fineschi, S., 2019. Polarimetric performance of a polarization modulator based on liquid crystal variable retarders for wide acceptance angles, Journal of Astronomical Telescopes, Instruments, and Systems, 5, 034002.
- Phillips (2011) Phillips, F., 2011. An Introduction to Crystallography, Read Books.
- Rebolledo et al. (2018) Rebolledo, N. A., Kyle, D. C., & Phipps, D. P., 2018. Achromatic ferroelectric liquid crystal polarization rotator, in Polarization: Measurement, Analysis, and Remote Sensing XIII, vol. 10655, p. 1065506, International Society for Optics and Photonics, SPIE.
- Ren et al. (2020) Ren, D., Han, Z., & Guo, J., 2020. A High-Efficiency and High-Accuracy Polarimeter for Solar Magnetic Field Measurements, Sol. Phys., 295(8), 109.
- Roelfsema et al. (2010) Roelfsema, R., Schmid, H. M., Pragt, J., Gisler, D., Waters, R., Bazzon, A., Baruffolo, A., Beuzit, J.-L., Boccaletti, A., Charton, J., Cumani, C., Dohlen, K., Downing, M., Elswijk, E., Feldt, M., Groothuis, C., de Haan, M., Hanenburg, H., Hubin, N., Joos, F., Kasper, M., Keller, C., Kragt, J., Lizon, J.-L., Mouillet, D., Pavlov, A., Rigal, F., Rochat, S., Salasnich, B., Steiner, P., Thalmann, C., Venema, L., & Wildi, F., 2010. The ZIMPOL high-contrast imaging polarimeter for SPHERE: design, manufacturing, and testing, in Ground-based and Airborne Instrumentation for Astronomy III, vol. 7735, p. 77354B, International Society for Optics and Photonics, SPIE.
- Zangrilli et al. (2006) Zangrilli, L., Fineschi, S., Massone, G., Capobianco, G., Porcu, F., & Calcidese, P., 2006. EKPol: Liquid Crystal Polarimeter for Eclipse Observations of the K-Corona, in Solar Physics and Solar Eclipses (SPSE 2006), pp. 37–45.