2023
A massive interacting galaxy 525 million years after the Big Bang
[1,2]Kristan Boyett [1,2]Michele Trenti
[1]School of Physics, University of Melbourne, Parkville 3010, VIC, Australia 2]ARC Centre of Excellence for All Sky Astrophysics in 3 Dimensions (ASTRO 3D), Australia 3]National Astronomical Research Institute of Thailand (NARIT), Mae Rim, Chiang Mai, 50180, Thailand 4]INAF Osservatorio Astronomico di Roma, Via Frascati 33, 00078 Monteporzio Catone, Rome, Italy 5]Department of Physics and Astronomy, University of California, Los Angeles, 430 Portola Plaza, Los Angeles, CA 90095, USA 6]Kavli Institute for the Physics and Mathematics of the Universe, The University of Tokyo, Kashiwa, Japan 277-8583 7]Department of Physics and Astronomy, University of California Davis, 1 Shields Avenue, Davis, CA 95616, USA 8]Space Telescope Science Institute, 3700 San Martin Drive, Baltimore MD, 21218 9]Center for Astrophysical Sciences, Department of Physics and Astronomy, Johns Hopkins University, Baltimore, MD, 21218 10]Cosmic Dawn Center (DAWN), Denmark 11]Niels Bohr Institute, University of Copenhagen, Jagtvej 128, DK-2200 Copenhagen N, Denmark 12]IPAC, California Institute of Technology, MC 314-6, 1200 E. California Boulevard, Pasadena, CA 91125, USA 13]Centre for Astrophysics and Supercomputing, Swinburne University of Technology, PO Box 218, Hawthorn, VIC 3122, Australia 14]School of Astronomy and Space Science, University of Chinese Academy of Sciences (UCAS), Beijing 100049, China 15]National Astronomical Observatories, Chinese Academy of Sciences, Beijing 100101, China 16]Institute for Frontiers in Astronomy and Astrophysics, Beijing Normal University, Beijing 102206, China 17]University of Ljubljana, Department of Mathematics and Physics, Jadranska ulica 19, SI-1000 Ljubljana, Slovenia 18]Physics and Astronomy Department, Tufts University, 574 Boston Avenue, Medford, MA 02155, USA 19]INAF – OAS, Osservatorio di Astrofisica e Scienza dello Spazio di Bologna, via Gobetti 93/3, I-40129 Bologna, Italy 20]INAF Osservatorio Astronomico di Padova, vicolo dell’Osservatorio 5, 35122 Padova, Italy
A massive interacting galaxy 525 million years after the Big Bang
Abstract
JWST observations confirmed the existence of galaxies as early as 300 million years and with a higher number density than what was expected based on galaxy formation models and Hubble Space Telescope observations. Yet, sources confirmed spectroscopically so far in the first 500 million years have estimated stellar masses below , limiting the signal to noise ratio for investigating substructure. Here, we present a high-resolution spectroscopic and spatially resolved study of a rare bright galaxy at a redshift (525 million years after the Big Bang) with an estimated stellar mass of , forming Solar masses per year and with a metallicity of about one tenth of Solar - lower than in the local universe for the stellar mass but in line with expectations of chemical enrichment in galaxies 1-2 billion years after the Big Bang. The system has a morphology typically associated to two interacting galaxies, with a two-component main clump of very young stars (age less than million years) surrounded by an extended stellar population ( million years old, identified from modeling of the NIRSpec spectrum) and an elongated clumpy tidal tail. The observations acquired at high spectral resolution identify oxygen, neon and hydrogen emission lines, as well as the Lyman break, where there is evidence of substantial absorption of Ly. The [O ii] doublet is resolved spectrally, enabling an estimate of the electron number density and ionization parameter of the interstellar medium and showing higher densities and ionization than in analogs at lower redshifts. For the first time at , we identify evidence of absorption lines (silicon, carbon and iron), with low confidence individual detections but signal-to-noise ratio larger than 6 when stacked. These absorption features suggest that Ly is damped by the interstellar and circumgalactic medium. Our observations provide evidence of rapid and efficient built up of mass and metals in the immediate aftermath of the Big Bang through mergers, demonstrating that massive galaxies with several billion stars are present at earlier times than expected.
keywords:
galaxies: high-redshift, galaxies: formation, galaxies: interactions, galaxies: ISM1 Main
The first generations of stars and galaxies in the Universe formed in physical conditions different to those of the modern Universe. In fact, gas is expected to have nearly primordial composition, with low levels of chemical enrichment and dust content (e.g., Torrey2019 ). Gas cooling is further limited by the higher Cosmic Microwave Background radiation, possibly altering the characteristic fragmentation mass of protostellar clouds (Smith2009, ). In addition, early forming galaxies are expected to experience an elevated merger rate (Fakhouri2008, ), affecting their morphology and stellar populations.
Hubble Space Telescope observations have been able to identify galaxy candidates at redshift ( million years after the Big Bang; e.g. see Bouwens21 ), and follow-up with the Spitzer Space Telescope provided evidence of relatively old stellar populations, suggesting that star formation started at (Hashimoto2018, ; Roberts-Borsani20, ). Yet, comparison to theoretical and numerical modeling has been restricted to number counts and luminosity functions by the limited angular resolution and dearth of spectroscopic data.
With JWST commencing science operations in July 2022, progress has been rapid and transformational. Already in the first Cycle of science programs, JWST has built a convincing sample of candidates based on NIRCam photometry (Castellano2022, ; naidu22, ; Donnan23, ; Harikane23, ; MorishitaStiavelli2022, ; Bouwens22, ), and a growing number of sources at are being confirmed spectroscopically with NIRSpec (Morishita22, ; Roberts-Borsani22b, ; Curtis-lake22, ; Bunker23, ). Surprisingly, the number density of (spectroscopically confirmed) high-redshift galaxies has been higher than expected by most models, in particular at the bright end of the luminosity function, possibly suggesting that we are missing key physical processes connected to the formation of first galaxies (Mason2023, ; Wilkins23, ). The superior spectral and spatial resolution of JWST in the near-infrared offers a path to investigate these initial findings through detailed stellar population studies in early galaxies. An initial spectroscopic census of JWST galaxies above paints a picture of elevated ionization parameters, low metallicities, low dust content, high specific star formation rates (sSFR), and potentially higher ionizing radiation escape fraction () than seen locally (e.g., Katz23 ; Curti23 ; Hsiao2022 ; Cameron23 ; Endsley22arxiv ; Tang23 ; Sanders23 ). Many of these galaxies show resemblance to the extreme interstellar medium (ISM) conditions observed in metal-poor actively star forming galaxies, both local (blueberries, greenpeas (Cardamone09, ; Yang17, ; Henry15, ; Jaskot13, )) and at moderate redshifts (, (Tang21, ; Sanders20, ; Sanders_2015, )). The spatial resolution of JWST also means the resolved stellar populations of galaxies in the epoch of reionization can be studied as well, revealing that these systems, once considered compact with HST, exhibit spatial variations in their physical properties (Wang22b, ; Chen23, ; Gimenez-Arteaga22, ).
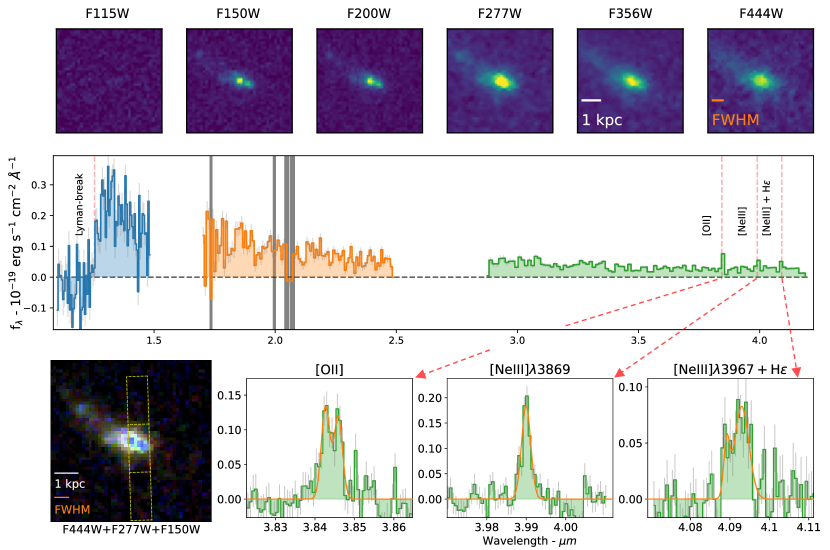
In this work we extend the frontier of detailed investigations of individual galaxy properties at very high redshift by reporting on imaging and spectroscopic observations of one of the brightest among the galaxy candidates at observed with JWST, with flux in F444W (corresponding to ). These observations include 6-band NIRCam imaging (F115W, F150W, F200W, F277W, F356W, F444W) and NIRSpec high resolution () Multi-object Spectroscopy (see 2.2). The galaxy - which we call here Gz9p3 - was initially identified as a potential F105W or F125W dropout based on HST observations, and then confirmed as a NIRCam F115W drop-out with a probable redshift (Castellano22b, ).
The NIRSpec data we use are part of the GLASS-JWST program ERS-1324 (TreuGlass22, ) centered on the foreground galaxy cluster Abell 2744, which is gravitationally lensing the high-redshift background sources. Gz9p3 is located in the outskirts of the cluster and relatively far away from high-magnification regions, with a best estimate of the lensing magnification based on Bergamini2022 (see 2.3).
The JWST photometry for Gz9p3 is shown in the top panel of Figure 1. The source has a magnification-corrected apparent AB magnitude in F444W, which for the cosmology adopted in this paper (see 2.1) corresponds to – approximately 50% brighter than the characteristic luminosity () of galaxies at this time (Bouwens21, ). The figure also includes a 1-D extraction of the NIRSpec spectrum in the middle panel, with spectral coverage in the range (with some gaps due to the target location relative to the edge of the instrument field of view as discussed in 2.2.1). The NIRSpec Multi-shutter Assembly (MSA) was configured based on HST imaging and as such the shutter covers the main body of the galaxy as shown in the bottom left panel of the figure. The spectrum shows a clear continuum detection and four emission lines are detected at , which we identify as ([O ii], [Ne iii] 3869, and [Ne iii] 3967 blended with H) for a source located at a redshift (see 2.5). In addition, the spectrum shows a Lyman break, and by modeling the stellar continuum as a step function around the break, we determine , consistent with the redshift measurement from emission lines (see further details in 2.5.1).
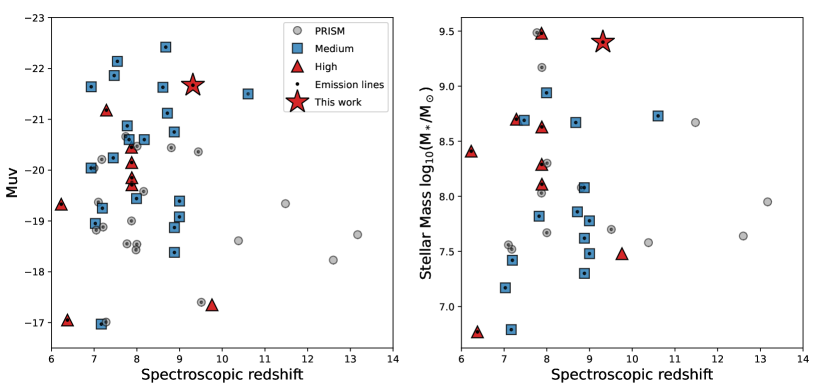
The galaxy properties are derived from Spectral Energy Distribution (SED) modeling using both broad-band photometry and the 1-D spectrum as input (see 2.8). The results are summarized in Table 1. Based on photometry of the whole galaxy (Kron fluxes, see Paris23 and 2.8), the modeling returns a magnification-corrected stellar mass of MM and . This makes Gz9p3 one of the most massive and intrinsically brightest galaxies confirmed in the epoch of reionization, and the brightest and most massive at (see Figure 2). Even when compared against photometric candidates Labbe22 , the stellar mass of Gz9p3 places it as one of the most massive galaxies identified within the first 750Myr since the Big Bang. The SED modeling from the spectrum is restricted to the main region of the galaxy where the shutter was placed, and returns a stellar mass consistent with the photometric estimate (see 2.7). Both SED modeling approaches (photometry and spectrum fitting) also identify substantial ongoing star formation (), and limited evidence of dust due to the blue spectral slope in the UV (), with robust results over a range of assumed star formation histories. Interestingly, the spectrum-based modeling shows evidence for older stellar populations in the central region of the galaxy (age Myr), indicating that star formation started as early as to produce the average age observed (see 2.7). In contrast, modeling based on photometry infers younger ages, with integrated-light fits giving an age of Myr and spatially resolved analysis identifying regions with ages Myr (see 2.9.1 and Table 3).
The detection of rest-optical emission lines provides a window into the interstellar medium conditions in the galaxy by resolving the [O ii] doublet thanks to high resolution settings (Figure 1), measuring a line ratio of (see 2.7). The relative strength of these low-ionization lines is sensitive to the electron number density (Sanders16b, ), leading to a measurement of . This is marginally higher (at ) than the median values of cm-2 seen in galaxies at , and cm-2 seen in local galaxies (Sanders16b, ), qualitatively following the trend of increasing with redshift as reported in that study. From the spectrum we determine a Ne3O2 ([Ne iii] 3869/[O ii]) ratio of . As these two lines are close in wavelength, the ratio is insensitive to dust reddening. The measurement is higher than what is typically seen at lower redshift, indicating a high ionization parameter of log based on (Witstok21, ), and a low metallicity of (depending on which one among the low- Ne3O2 calibrations is used and including systematic uncertainties Bian18 ; Shi07 ; Maiolino_2008 ; Jones15 ; see 2.7.2 for further details). Together, these conditions indicate a sub-solar () metal-poor interstellar medium, with a high electron density and ionization parameter, exhibiting similar properties to other galaxies spectroscopically confirmed at (Katz23, ; Curti23, ; Mascia23, ; Hsiao2022, ; Fujimoto23, ; Sanders23, ; Cameron23, ). The ISM conditions reflect expectations from the young stellar ages derived from SED fitting, providing a self-consistent picture of the stellar populations and their surrounding gas.
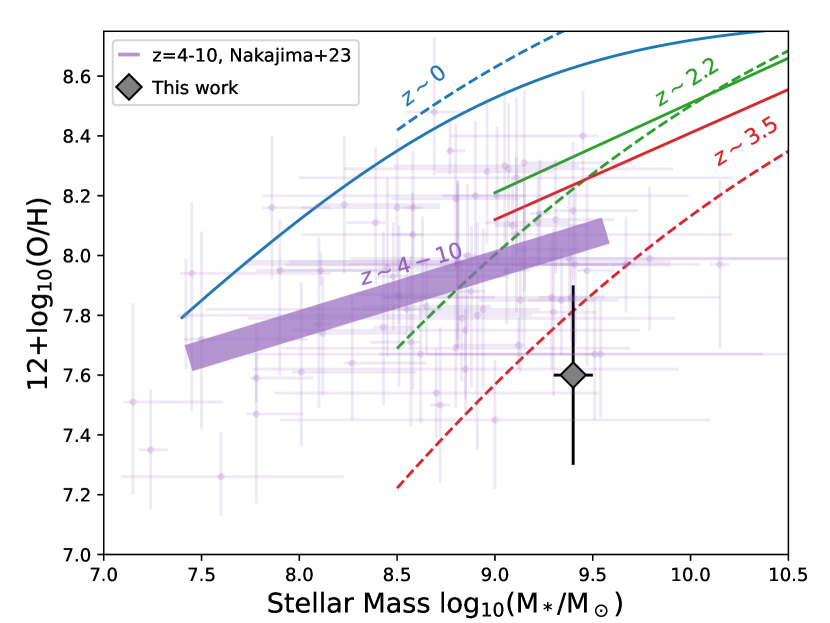
The large stellar mass and low oxygen abundance place Gz9p3 below the mass-metallicity relations for derived by Nakajima23 , and marginally below the relation for galaxies from Sanders21 ; Maiolino_2008 , even though systematic uncertainty may affect the robustness of these conclusions (see 2.7.2). The offset suggests Gz9p3 has a high gas fraction and potentially high gas accretion rates of pristine gas, which is qualitatively consistent with expectations from theoretical and numerical modeling of galaxies at these early times given the short assembly times of their dark-matter halos Mason2015 .
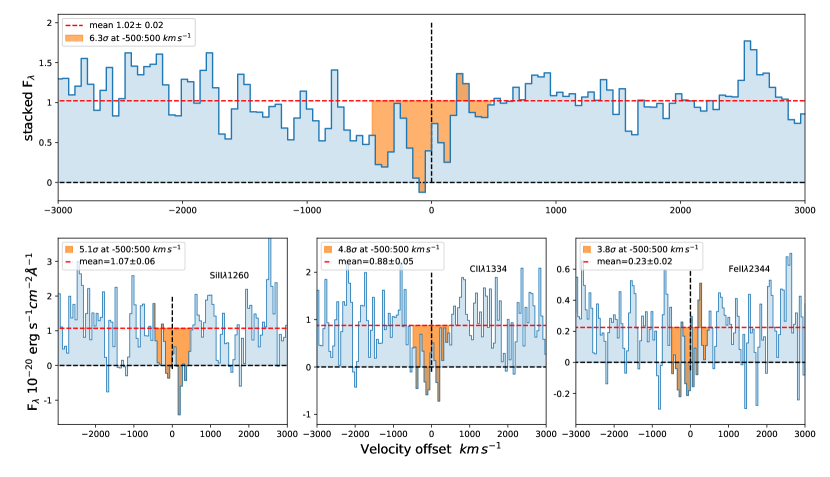
Further insight into the stellar populations of Gz9p3 is offered by the detection - albeit at low confidence - of UV absorption lines. The spectrum shows a flux deficit associated with the SiII1260, CII1334 and FeII2344 lines at a significance individually, and at when the lines are stacked together (see 2.7.7). The detection of metal absorption features reinforces the evidence from emission lines that the gas within the galaxy is not pristine and has been enriched by the older stellar population, again providing a consistent interpretation of the relatively evolved stellar ages inferred from SED modeling for the core of the galaxy where the slit is placed. The multi-component absorption profile hinted by the data suggests turbulence within the absorbing gas, as expected from models of star formation (Padoan02, ; Krumholz05, ), and/or from bulk gaseous flows that are associated to a merging or interacting system. However, higher signal to noise observations are required to quantify the robustness and confidence of these interpretations.
Interestingly, not only is there no evidence of Ly emission, with a stringent limit on the equivalent width from Table 1, but also the stellar continuum at ÅÅ (redward of the Lyman break) shows a deficit. Measurements over Å and Å windows show a and deficit at a and significance, respectively (see 2.7.6). The softening of the spectral break supports the presence of absorption from Ly damping wings. One interpretation is that the damping is due to absorption by the intergalactic medium (Miralda_escude98, ), which would indicate that the galaxy does not sit within a large ionized bubble. Such scenario falls in line with the expected transmission due to damping wing in a neutral IGM from Mason20 , with a predicted flux of continuum and continuum at 1000 km s-1 (Å) and 6000 km s-1 (Å) respectively. However, it is difficult to reconcile the lack of a large ionizing bubble with the high stellar mass and presence of relatively old ( Myr) stars, especially because Ly emission is detected in galaxies at higher redshift with lower star formation rates and stellar masses such as GN-z11 Bunker23 . An alternative interpretation is that the interstellar and circumgalactic medium in Gz9p3 is the primary responsible for the lack of Ly emission in the spectrum, irrespective of the IGM conditions. This scenario is supported by the detection of the SiII1260 and CII1334 absorption features with a rest-frame equivalent width of Å. In fact, it has been shown that their strength correlates with damping of Ly and results in Ly absorption when the equivalent width of low-ionization interstellar metal lines is Å Jones2012 ; Leethochawalit2016 ; Pahl2020 . Also, the presence of strong low-ionization ISM line absorption and the stringent upper limit on CIII] emission suggest that the galaxy is unlikely to be a Lyman continuum leaker Lopez2022 .
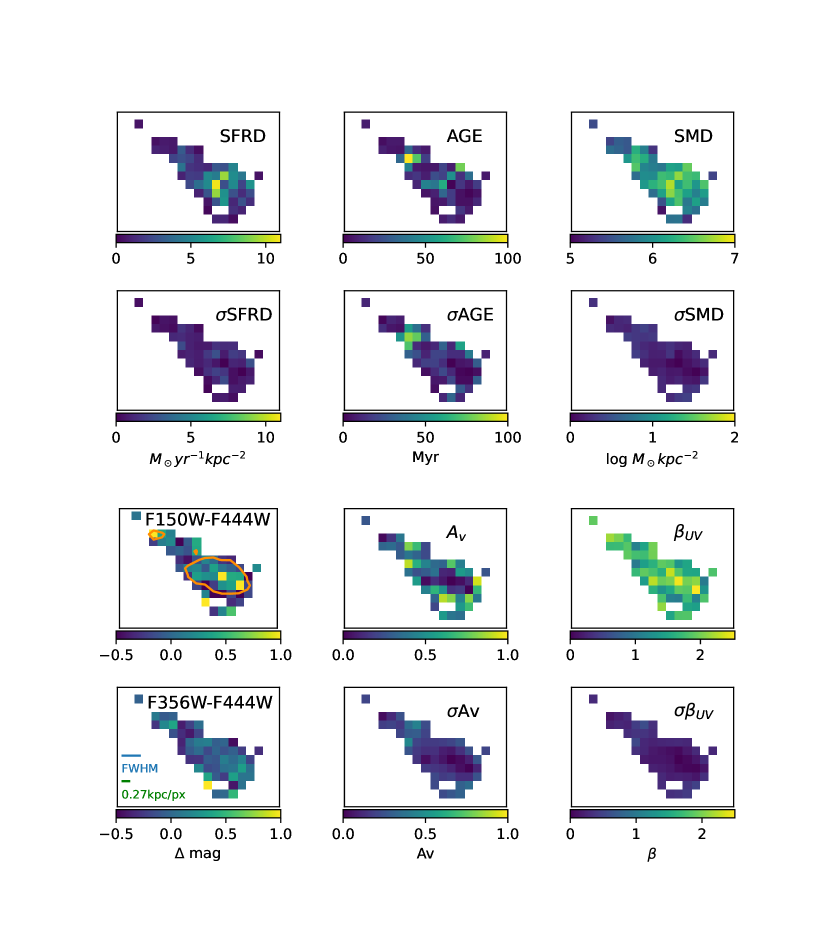
In addition to providing detailed spectral insight on the stellar populations within the shutter aperture, the NIRSpec observations allow us to fix the redshift of Gz9p3 for photometric pixel-by-pixel modeling. This allows us to investigate spatial variations across the galaxy, following an approach similar to the one adopted by Gimenez-Arteaga22 at lower redshift to create a 2D distribution of the galaxy’s physical properties (see 2.9). The analysis is carried out with BAGPIPES Carnall18 to determine the following maps of resolved properties, shown in Figure 4: stellar mass surface density (SMD); star formation rate surface density (SFRD); mass-weighted stellar age; visual extinction (Av); and UV slope (where ). The native pixel resolution in F444W is (with a FWHM F444W native pixels, or ), but for our analysis we bin pixels to improve the signal-to-noise ratio per pixel, generating the maps at a 0.27kpc/pixel resolution in the observed frame. This corresponds to 0.21kpc/pixel in the image plane after accounting for gravitational magnification. The galaxy shows a morphology comprised of an elongated tail and a central body, which in F444W appears as a single core. The peak of the star forming activity within the stellar population is situated in the central core and this traces the distribution of stellar mass. This central region of active star formation exhibits young stellar population ages (), as does the clump within the tail, whilst the surrounding regions on the outskirts of the central body show older populations, albeit with larger uncertainties (/Myr ). The galaxy shows blue slopes throughout and relatively low visual extinction, which traces the dust content (see 2.9).
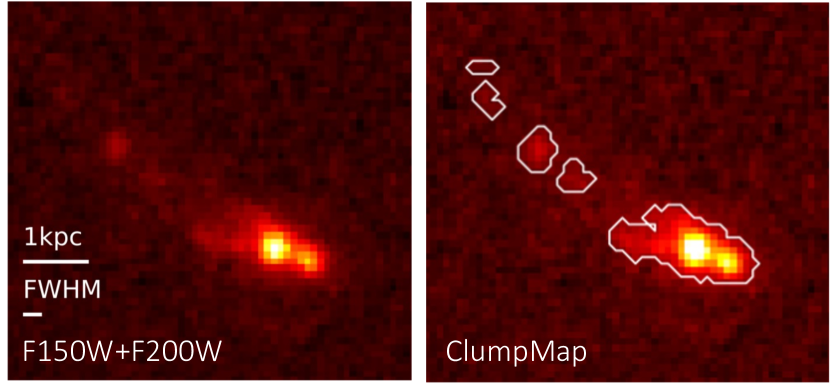
The spatially resolved modeling is suggestive of an interacting system undergoing (or having recently undergone) a major merger. To further investigate this scenario, we analyze photometry at rest-frame UV wavelengths, using a combined F150W+F200W image drizzled at 20 mas/pixel, presented in Figure 5. The data clearly show two distinct cores in the main region of the galaxy, and several components in the tail identified thorough a clump-finding algorithm (see 2.10). The morphology of Gz9p3 is described by clumpiness parameters that clearly indicate the galaxy is a merger (Gini=0.61, M20=-1.29, A=0.35; see Lotz08 ).
Informed by the morphological analysis, we repeat the spatially resolved SED modeling by placing apertures over different stellar populations (innermost region, a surrounding annulus and the tail), clearly seeing a distinction between active regions of star formation and an underlying older stellar population, as expected from the merging scenario (see 2.9.1).
The combined spectroscopic and imaging data paint a detailed picture of a very bright and relatively massive interacting system just 0.5 Gyr after the Big Bang, raising the question of how likely such JWST observations should be. Figures 2-3 hint that the system could be an outlier. To quantify expectations we consider both analytical modeling of early galaxy formation and comparison to cosmological hydrodynamical simulations, deriving that while the likelihood of capturing an interacting system is relatively high, i.e. at the level of for a major merger, the stellar mass of Gz9p3 is higher than expected (see 2.11-2.12). This would indicate either the system is hosted in a very rare dark matter halo for that epoch, that we serendipitously observed, or more likely that the current recipes for star formation are missing some key ingredients at early times. The latter interpretation would be consistent with the excess of sources identified by JWST at through imaging programs Castellano22b and with the high numbers of massive red galaxy candidates found at Labbe22 . All these aspects make Gz9p3 an excellent target for further spectroscopic investigations, in particular through the Integral Field Unit mode on NIRSpec that would shed further light on the kinematics of the system and on the complex interplay between assembly of dark matter halos, star formation and physical conditions in the interstellar, circumgalactic and intergalactic media at very early times.
| Property | Observed Value |
|---|---|
| RA [Deg] | 3.617193 |
| DEC [Deg] | -30.4255352 |
| Line flux [erg s-1cm-2] | |
| Ly | |
| CIII] | |
| MgII | |
| [O ii] | |
| [Ne iii] 3869 | |
| ([Ne iii] 3967 + H) | |
| [Ne iii] 3967 | |
| H | |
| Line EWrest [Å] | |
| Ly | |
| CIII] | |
| MgII | |
| [O ii] | |
| [Ne iii] 3869 | |
| ([Ne iii] 3967 + H) | |
| [Ne iii] 3967 | |
| H | |
| Full photometry SED fitb | |
| Stellar Mass [logMM] | |
| SFR [M] | |
| Stellar Age [Myr] | |
| [AB_mag] | |
| Spectrum+photometry SED fit of main componentc | |
| Stellar Mass [logMM] | |
| SFR [M] | |
| Stellar Age [Myr] | |
| [AB_mag] | |
2 Methods
2.1 Cosmology and conventions
Where applicable, we use a standard CDM cosmology with parameters H km/s/Mpc, 0.3, and 0.7. All magnitudes are in the AB system (Oke83, ). Throughout this paper we refer to quantities as “observed” or “intrinsic” depending on whether the best available estimate of any gravitational lensing magnification correction has been applied.
2.2 Observations
This work is based on JWST/NIRCam direct imaging and JWST/NIRSpec high resolution multi-object spectroscopy as part of the GLASS-JWST survey (ERS 1324, PI Treu; TreuGlass22 ) and DDT program 2756 (PI Wenlei Chen). We refer the reader to Roberts-Borsani2022 ; Paris23 for details of the observations and reduction strategy for NIRCam and to Morishita22 for NIRSpec.
As part of the GLASS JWST/NIRSpec observations, over 100 galaxies were assigned to slit apertures. Our target (GLASS ID: 10003, indicated as Gz9p3 hereafter) was included as a high-priority candidate, based on HST ACS/WFC3 photometry (Castellano2016, ) which identified it as a potential F105W/F125W drop-out. This placed the object at a redshift . Without longer wavelength imaging at the spatial resolution needed to deblend near-proximity neighbors, the validity of the single broadband filter detection in HST/WFC3 F160W could not be confirmed and physical properties could not be determined.
The photometric redshift solution has since been refined to based on NIRCam observations (ID: DHZ1 in Castellano22b, ). This galaxy was one of 7 galaxies identified in the ABELL 2744 cluster region, suggesting an apparent over-density at this epoch in the field and reaffirming the priority for spectroscopic follow-up. JWST NIRSpec observations now provide the spectral coverage needed to investigate this object further.
2.2.1 High-resolution spectroscopy
We obtain high-resolution () JWST/NIRSpec Multi-Object Spectroscopy of this target using the f100lp/g140h, f170lp/g235h and f290lp/g395h filter-disperser combinations. These spectroscopy configurations combined with the location of the object on the detector provide wavelength coverage from , and , respectively (970-4060Å in the rest-frame, see discussion in 2.5). The exposure time for each configuration is 4.9 hours.
In Figure 1, we overlay the location of the NIRSpec open shutters on the RGB direct image. The open shutters are placed over the main component but do not capture the total flux from the galaxy and we therefore suffer from some slit losses. Due to the extended morphology and potential change in stellar populations across the galaxy we do not correct the slit-losses to match the total photometry of the galaxy. Instead we will adopt a slit-loss correction based only on the photometry of the main component (where the slit is placed), as part of our SED spectrum+photometry analysis of this region (see 2.7). Therefore, for measurement of physical properties for the whole galaxy (e.g., Mass, SFR in 2.8), we rely on the photometric SED fitting (see Paris23 ), and use the spectrum SED fitting as consistency check and for investigation of the properties of the core of the system.
A detailed discussion of how the data were reduced is given in Morishita22 . Briefly, we use the official STScI JWST pipeline (ver.1.8.2)111https://github.com/spacetelescope/jwst for Level 1 data products, and the msaexp222https://github.com/gbrammer/msaexp Python package for Level 2 and 3 data products. We extract the 1D spectrum following Morishita22 and use the msaexp package to optimise our extraction using an inverse-variance weighted kernel. This kernel is derived by summing the 2D spectrum along the dispersion axis and fitting the resulting signal along the spatial axis with a Gaussian profile (). This is then used to extract the 1D spectrum along the dispersion axis.
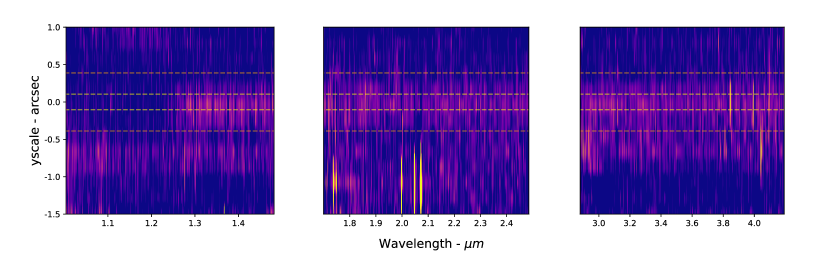
We present the full 2D spectrum in Figure 6 and the extracted 1D spectrum in Figure 1. Within the 2D image there is clear emission from an additional source below the trace associated to our target; this has been identified as a galaxy with prominent emission lines () and a faint continuum. The dispersed light from this second galaxy, which is another GLASS target and is discussed in Boyett23b , comes from an open shutter in a separate quadrant of the NIRSpec MSA. The dispersed light is spatially offset and the continuum is sufficiently faint as to not significantly contaminate our target. However, the strong rest-optical line emission does leave a negative imprint on the continuum trace of our object due to our background subtraction process. These contaminated regions are masked in Figure 1 and when modeling the spectrum of our object. The close proximity of the dispersed light from other open shutters demonstrates the potential dangers of over filling the NIRSpec MSA.
In the 2D and 1D spectrum of Gz9p3, several emission lines are visible at and we present a close up of this region in Figure 1 with individual panels focusing on each of the detected emission lines. In these panels it can be seen that the resolving power can deblend the [O ii] doublet into the separate and Å lines.
Finally, we perform a second extraction of the f100lp/g170h 2D spectrum with the intention of maximizing the signal to noise in the continuum around the observed spectral break (), which we model in 2.5. For this purpose we restrict the width of the Gaussian profile () to reduce the inclusion of pixels that contain only noise.
2.2.2 Direct Imaging
We obtain JWST/NIRCam observations in the F115W, F150W, F200W, F277W, F356W and F444W broadband filters. We additionally use the HST ACS and WFC3 F606W, F814W, F105W, F125W and F160W broadband filters from Castellano2016 . We report the Kron flux measurements for each broadband filter in Table 2, based on the analysis by Paris23 . In Figure 1, we present the direct imaging of the target in each of the available JWST filters. Here it can be seen that the galaxy exhibits a morphology comprised of a main body plus an extended tail.
We examine the SED of the full broadband photometry in 2.8 and for specific regions within the galaxy using aperture photometry in 2.9.1.
| Filter | Fν ( Jy) |
|---|---|
| F606W | |
| F814W | |
| F105W | |
| F125W | |
| F160W | |
| F115W | |
| F150W | |
| F200W | |
| F277W | |
| F356W | |
| F444W |
2.3 Gravitational lensing
Gz9p3 lies within the ABELL 2744 cluster region, albeit at a relatively large distance from the center of the cluster. Nonetheless this target will experience some degree of magnification. In this study we account for the cluster-induced lensing amplification factor by adopting a magnification when appropriate. This correction is based on the location of the target and its redshift ( determined in 2.5). The magnification is derived by combining the LM-model (Bergamini2022, ) with a new spatially more extensive model covering our field of view (Castellano22b, ).
2.4 Photometric properties
This galaxy has a magnification corrected F444W magnitude of . Under the adopted cosmology the distance modulus is 49.9, and using a k-correction of , the object has an absolute magnitude . This brightness makes it a comparable object to the rare bright galaxies discovered with HST photometry in the large-area BoRG survey (e.g., Leethochawalit22, ).
The rest-frame 1500Å is covered by the NIRCam/F150W broadband filter (with no detected emission lines that contribute to the flux density) and provides a magnification corrected estimate of using the same k-correction as above.
These values place this object as one of the intrinsically brightest galaxies spectroscopically confirmed in the early Universe. We plot this object onto the growing sample of known galaxies at high redshift in - redshift space in Figure 2. At the other luminosity extreme among sources is a highly magnified galaxy also from the GLASS-JWST survey (Roberts-Borsani22b, ) with an intrinsic (), demonstrating the dynamical range capabilities of the GLASS program and of JWST in general.
2.5 Emission line detection and spectroscopic redshift determination
The spectrum of this galaxy shows multiple emission lines and a spectral break in the UV, and both features enable the determination of a spectroscopic redshift.
We detect emission from [O ii], [Ne iii] 3869, [Ne iii] 3967, H and we measure the corresponding line flux without correcting for slit-losses using the latest version of the specutils333https://specutils.readthedocs.io/en/stable/index.html packages in Python. The stellar continuum in the high-resolution spectroscopy is well modeled by a simple polynomial after masking regions with detected emission line contribution or contamination from the dispersed light of neighboring targets) with Chi-square per dof = 1.2. The continuum is subtracted before modeling the emission lines. Note that we neglect possible underlying absorption from stellar Balmer absorption lines, which could affect the H line because we use this line uniquely for redshift determination, which is not affected by any reduction in the equivalent width. We adopt a bootstrap method to represent the flux of each emission line, we model [Ne iii] 3869 with a single Gaussian profile, and the [O ii] doublet and the [Ne iii] 3967+H complex with a pair of Gaussians. The only constraint we place is that within the [O ii] doublet both emission lines share the same standard deviation (). For individual computations we vary each spectrum by applying random gaussian noise to each pixel following the associated uncertainty spectrum and fit gaussian profiles to each identified emission line. The fits provide a resultant distribution of measured line fluxes from which we determine the median line flux as the 50th percentile and the associated uncertainty from the 16th and 84th percentiles. We report the measured line fluxes, which are not corrected for slit losses or reddening, in Table 1.
We likewise use the bootstrap Monte Carlo to determine the best-fit redshift. We record for each of the Gaussian profile fits for the [Ne iii] 3869 emission line and from the [16th, 50th, 84th] percentile we determine the best fit redshift and uncertainty to be . The choice of using [Ne iii] 3869 was made because it avoids the partial-blending in the [O ii] doublet and the [Ne iii] 3967+H complex.
2.5.1 Spectroscopic redshift from the Lyman break
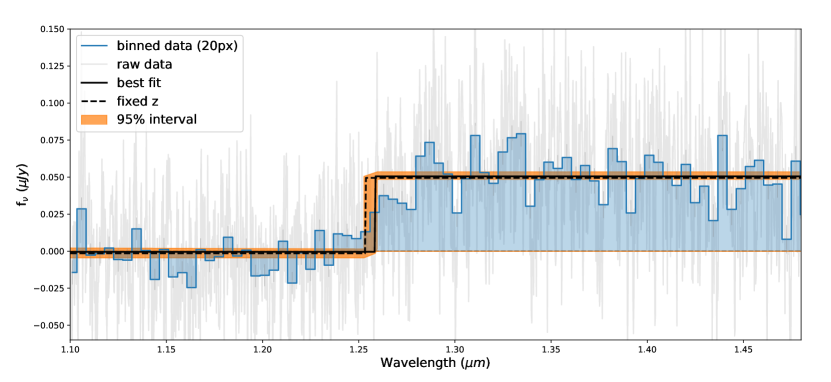
We can also measure the redshift from the location of the Lyman break. In the f100lp/g140h spectrum, we attribute the observed spectral break feature (range ) to be the Lyman break at Å. To determine the best fit to the spectral break, we use the narrow 1D extracted spectrum (to maximize the S/N) and randomize the data following the uncertainty spectrum by conducting Monte Carlo sampling a total of times. We model the Lyman break as a step function and determine a best-fit observed wavelength of , with the uncertainty assigned by identifying the confidence region when minimizing the . This best-fit wavelength corresponds to a redshift of (in full agreement with the redshift determination from the emission lines). The best fit and uncertainty regions are shown in Figure 8.
2.6 Constraints on other emission lines
It is also of interest which emission lines fall within our wavelength coverage but are not detected. In the rest-optical we do not detect either HeI lines at Å or 4027Å, placing upper limits of 0.50 and 0.39 erg s-1cm-2Å-1 based on the noise properties of the spectrum over a Å window (the extent of the pixel coverage of the detected emission lines). Neither do we detect any of the following commonly-studied rest-UV emission lines: Ly, CIII](), MgII(, NeV () which fall in our coverage (CIV, Oi, HeII, MgII are all out of our coverage). For each of these we place upper limits of [2.64, 1.45, 1.07, 0.54] erg s-1cm-2Å-1. We note that many of these are intrinsically faint lines relatively to rest-optical [O ii].
2.7 Physical interpretation of the spectrum
The detection of emission lines and the shape of the stellar continuum allows us to infer further galaxy properties of Gz9p3. Although, we note that the location of the MSA open shutter (as shown in Figure 1) means we capture the light from the core of the system only.
2.7.1 Spectrum SED fitting
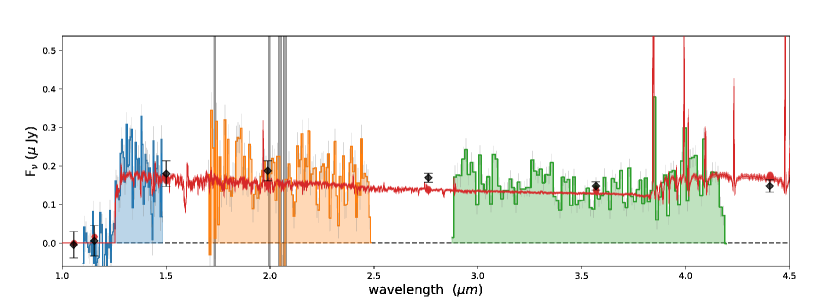
We utilize BAGPIPES (Carnall18, ) to fit a model SED provided both the spectrum and the photometry to determine the physical properties of the galaxy. For the combined analyze we apply a conversion factor to account for the slit-losses for each of the spectra such that the spectral flux density matches the broadband photometry in the F150W, F200W and F356W filters, respectively for each of the three non overlapping spectral regions covered by the data. Further discussion to validate this correction based on the resolved stellar population is discussed in 2.9. The SED fitting procedure is described in 2.8. Figure 7 presents the best fit template overlaid onto the adjusted spectrum and photometry, and the best-fit properties are given in Table 1. We correct our measurements for the lensing magnification; (see 2.3) and we report that the core of the target covered by the shutter has an intrinsic log10(MM⊙) = and SFR of . The core also shows minimal visual extinction with , equivalent to for a (Calzetti00, ). The mass-weighted stellar age of Myr reflects the presence of an older stellar population and indicates that star formation started as early as to produce the average age observed.
2.7.2 Metallicity
The detection of both [O ii] and [Ne iii] 3869 allows us to study both the number density with the galaxy’s ISM, via the ratio of the [O ii] doublet line fluxes, and the ionization parameter and metallicity from the flux ratio of the [O ii] and [Ne iii] 3869 lines. We measure a Ne3O2 (defined as [Ne iii] 3869/[O ii]) line flux ratio of . Considering how close these two lines are in wavelength, the measured ratio has only minimal sensitivity to either dust reddening or slitloss correction, which we therefore neglect.
We determine a metallicity estimate for the galaxy from the measured Ne3O2 line ratio. The Ne3O2 diagnostic exhibits an anti-correlation with Oxygen abundance (Bian18, ; Jones15, ; Shi07, ; Nagao06, ; Perez-montero07, ) due to its relation with the ionization parameter (which is anti-correlated with metallicity, Jeong20 ; Levesque14 ). Many studies have modeled the relation between the Ne3O2 diagnostic and oxygen abundance in samples of local galaxies. Using diagnostic calibrations from literature we determine metallicities of: (Jones15, ) (Bian18, ), (Maiolino_2008, ), (Shi07, ), with a mean and standard error from these diagnostics of . Note that with the data available, we are unable to break the degeneracy in the non-monotonic behavior of the Nakajima22 relation and obtain two possible values of and . Also, our Ne3O2 value appears to lie above the calibrated range of Sanders21 , placing an upper limit of . All the values quoted here are subject to systematic uncertainties in the diagnostic calibration of the order , which dominate the random uncertainty.
Our Ne3O2 line therefore supports an oxygen abundance of 10 % solar (O/H)), in line with recent JWST studies of galaxies (Sanders23, ; Mascia23, ; Cameron23, ; Nakajima23, ). However, an important caveat is that these metallicity results are based on diagnostics calibrated at low redshifts (SDSS ). While criteria were used in these studies to select low-redshift EOR analogues, it has not yet been confirmed as to whether these relations still hold true for high-redshift galaxies at .
2.7.3 Electron Density
Following Sanders16 , we determine an electron density of from a measured [O ii]/[O ii] flux ratio of . This has a large uncertainty as is highly sensitive to the flux ratio and the latter measurement has limited signal to noise. Sanders16 report a median [O ii]/[O ii] flux ratio of 1.18 in their sample (). Gz9p3 shows stronger [O ii] relative to [O ii] than this lower redshift sample, indicating a higher electron density.
2.7.4 Ionization state
The Ne3O2 ratio in this object is significantly higher than has been found in lower redshift samples. The stacked ratio from 66 MOSDEF galaxies of similar mass (log10(MM⊙):) at redshift is Ne3O2 (Jeong20, ), significantly lower than our value. This trend for a high Ne3O2 ratio has also been found in the recent JWST spectra of three galaxies (Ne3O2) in the SMACS early-release observations (Katz23, ; Curti23, )444SMACS early-release observations (JWST program ID: 2736, Pontoppidan22 ), and is indicative of a higher ionization parameter (Levesque14, ). Using the Witstok21 Ne3O2-U calibration, we determine an ionization parameter of log .
Due to a similar dependence on the ionization parameter, Ne3O2 can be used to trace the O32 ([O iii]/[O ii]) strong line diagnostic, with the advantage of being less sensitive to reddening (Jones15, ; Levesque14, ; Paalvast18, ; Witstok21, ). In a sample of galaxies, Jones15 demonstrate that the Ne3O2 diagnostic traces the dust-corrected O32, and can be reasonably approximated as [Ne iii] 3869[O iii], although we note scatter around this relation may hold a dependence on the hardness of the ionizing spectrum Strom_2017 ; Zeimann15 . Adopting this approximation would give Gz9p3 a dust-free O32 .
This estimate is larger than the typical range of values found in local samples (O32 , SDSS555Archival data from the Sloan Digital Sky Survey (SDSS; York00 ) Data-Release 7 (Abazajian09, ). We set a detection requirement on each emission line and we reject AGN following the method set out in Runco21 ) and falls into the trend that star forming galaxy samples at higher redshift typically exhibit large O32 compared to the local Universe (e.g., Sanders23, ; Strom_2017, ; Runco21, ). Our estimate is comparable to recent JWST/NIRSpec observations of sources. We find consistency with the range of O32 values (O32) found in three SMACS galaxies (Katz23, ; Curti23, ), the range of O32 values (O32) found in five GLASS galaxies (Mascia23, ), the lower O32 limits (O32) placed on six CEERS666Cosmic Evolution Early Release Science (CEERS) survey (JWST Program ID: 1345, Finkelstein22 ). galaxies (Fujimoto23, ), and the range of O32 values (O32) found in five JADES777JWST Advanced Deep Extragalactic Survey (JADES) (JWST program IDs: 1180, 1181, 1210, 1286 1287, Eisenstein23 ) galaxies (Cameron23, ).
The ISM conditions observed in Gz9p3 provide additional evidence for a higher ionization parameter at high redshift, likely due to the presence of a young stellar population and a harder ionizing spectrum, in line with the trend for an increase in the global specific star formation rate with redshift (Speagle14, ; Marmol16, ).
2.7.5 Population III stars and AGN constraints
PopIII stars may be present in galaxies down to based on cosmological simulations (Venditti23, ), and therefore within reach of JWST (Trussler22, ), with identifiable diagnostics based on the doubly ionized HeII EW (Schaerer02, ; Schaerer03, ; Raiter10, ), line ratios between HeII and hydrogen recombination lines (Nakajima_Maiolino22, ) and UV slope (Raiter10, ; Zackrisson11, ). Unfortunately, we don’t have wavelength coverage of HeII and the adoption of a UV slope diagnostic requires assumptions on too many unknown variables (e.g., ) such that we cannot examine their presence in our dataset.
Additionally, we report no evidence for Gz9p3 being an active galactic Nuclei (AGN). There is no broad-line component required in the model fitting of the detected emission lines, and we place an upper limit of 1.07 erg s-1 cm-2Å-1 on the MgII line flux. This corresponds to an equivalent width limit Å. Based on a local sample of AGN, this limit would indicate and a bolometric luminosity of the source far exceeding the Eddington luminosity of the central BH Dong09 . The inference that an AGN is not the dominant source of light is also fully supported by the extended, spatially resolved nature of Gz9p3.
2.7.6 Lya absorption
The shape of the Lyman break can be softened in the presence of a high neutral fraction in the Intergalactic medium (IGM) due to the strength of the Ly damping wing, allowing the Gunn-Peterson absorption to extend redward of Å (Miralda_escude98, ). To assess whether there is any evidence for Ly absorption we estimate the expected continuum level by fitting a model to the full stellar continuum in the narrow spectrum (to ensure we avoid any contamination from neighboring spectra) after masking the region of Ly absorption, regions covering detected emission lines and regions of contamination from emission lines in close-proximity dispersed spectra. Based on the best-fit model we expect a continuum signal at Å of erg s-1cm-2Å-1, which agrees with the mean signal over the wavelength range ÅÅ of F erg s-1cm-2Å-1. Over a Å region redward of Ly we measure a mean deficit against the expected continuum of -0.8 erg s-1cm-2Å-1 (missing 80 of the expected continuum flux) at a significance (based on the noise properties of the spectrum). Over a broader Å region we measure a mean deficit of -0.4 erg s-1cm-2Å-1 at a significance (40 of the expect continuum flux). Our findings are at face value consistent with the expected transmission due to damping wing in a neutral IGM from Mason20 , with a predicted flux of continuum and continuum at 1000 (Å) and 6000 (Å). From this, the flux deficit can be interpreted as Ly absorption and thus as evidence that this galaxy does not sit within a large ionized bubble. Similar interpretations have been drawn for 4 galaxies at which also show a softening of their Lyman break (Curtis-lake22, ). However, this physical interpretation is challenging to reconcile with the evolved stellar populations and large stellar mass estimates, which imply the reionization process of the IGM should be well underway. In this respect, we highlight that Ly has been observed in emission in GN-z11, a younger, less massive galaxy at higher redshift Bunker23 . An alternative interpretation of the Ly damping is explored in the context of ISM and CGM absorption in 2.7.7.
2.7.7 UV absorption features
We apply the same method used for Ly- absorption to measure the significance of a deficit between the expected stellar continuum and the measured continuum for several common UV absorption lines which fall within our spectral coverage (SiII, OI, CII, FeII). We examine the region of centered on each line and measure the average continuum level outside the central . We measure the significance of any absorption within this central region against the continuum level and find greater than detections in SiII, CII and FeII, with Å, Å and Å, respectively. The remaining lines show significance. To examine potential UV-absorption further we stack the window for these 7 lines, scaling the measured continuum level to unity and using a weighting. In Figure 9 we present the stacked spectrum plus the individual spectral regions for the detected absorption lines. The stacked spectrum shows a double absorption feature centered at . The deficit of the combine absorption feature over a [-500:500] window is a 40 reduction flux compared to the stellar continuum at a significance (57 reduction at over a window).
The equivalent width of SiII and CII absorption lines is closely correlated with the Ly equivalent width as these ions arise from HI gas, which is also responsible for the damping of Ly Jones2012 ; Leethochawalit2016 ; Pahl2020 ; Du2018 ; Shapley03 . From Pahl2020 , we estimate that rest-frame equivalent width of Å for low-ionization interstellar metal lines is associated with weakened Ly emission and moderate absorption damping wings. Therefore, our measurement of SiII and CII absorption with Å can qualitatively explain the damped Ly feature present in the spectrum redward of the Lyman break without necessarily requiring Gz9p3 to live within a partially neutral IGM region. While our data are inconclusive to determine the IGM ionization, we note that the combination of strong absorption for low-ionization ISM metal lines and weak CIII] emission (EWÅ) suggest that the galaxy is unlikely to be a Lyman continuum leaker in its current state Shapley03 ; Lopez2022 .
In both the stack and the individual lines the overall shape of the deficit shows hints of a multi-component structure. The absorption is centered at a offset to the expected location, either to one side or both. Such multi-component absorption may indicate the presence of turbulent gas within the system, but the signal to noise of our data is not sufficient to draw robust conclusions on this potential interpretation.
2.8 Measurements of integrated physical parameters
Given that the NIRSpec slit does not cover the full extend of the object due to its orientation (see Figure 1), we additionally use integrated-light photometry to derive an estimate for the stellar mass and the star formation rate (SFR) for the whole galaxy by fitting the spectral energy distribution using two alternative SED-fitting software tools; BAGPIPES (Carnall18, ) and ZPHOT (Fontana00, ).
The application of each tool for the GLASS photometric dataset is described in Leethochawalit23 for BAGPIPES and Santini2022 for ZPHOT, and we refer the reader to these articles for a detailed discussion. Briefly, for BAGPIPES, we model the photometry using a lognormal SFH, a Kroupa Kroupa02 initial mass function (IMF), a Calzetti Calzetti00 dust attenuation law and a BPASS (v2.2.1 EldridgeStanway2009 ) stellar population model that includes binary populations that is reprocessed with photoionization code CLOUDY (c17.03 Ferland2017 ) generated in (Hsiao2022, , private communication with Adam Carnal)888Consistent stellar mass and SFR estimates within are obtained using a delayed exponential SFH or when using the 2016 version of the BC03 Bruzual03 stellar population models.. For ZPHOT, the important changes are the use of a delayed exponentially declining Star Formation Histories, the 2016 version of the BC03 Bruzual03 stellar population models and a Chabrier Chabrier_03 IMF.
We run both tools twice, first allowing the redshift to vary and then fixing the redshift at (see 2.5). All variations of the photometric analysis return consistent estimates of the stellar mass and star formation rate, and we find the photometric redshift estimates for both tools are reasonably consistent with the spectroscopic value and place the redshift firmly at (: and for ZPHOT and BAGPIPES respectively). By fixing the redshift at the solution derived from emission line analysis, BAGPIPES and ZPHOT estimate an observed log10(MM⊙) of and and SFRs () of and . The consistency between the tools is discussed in Santini2022 , who find good agreement in all but the lowest mass galaxies. We present the best-fit SED using the BAGPIPES fixed-redshift model in Figure 10.
We correct our measurements for the lensing magnification (; see 2.3) and we report that our target has an intrinsic log10(MM⊙) (or ) and SFR (or ) for BAGPIPES (or ZPHOT). These measurements are consistent with those obtained by Castellano22b using ZPHOT, with Charlot00 templates and a delayed-star forming history (SFR=, log10(MM⊙)=).
2.8.1 Mass metallicity relation
This galaxy exhibits a large stellar mass and low oxygen abundance. In Figure 3 we present the location of Gz9p3 relative to measured mass-metallicity relations. The measured metallicity range for Gz9p3 [logO/H] places it offset below local (Andrews13, ; Maiolino_2008, ) and moderate redshift mass-metallicity relations (Sanders21, ; Maiolino_2008, ) (which estimate logO/H in the range and at log10(MM⊙), respectively). In a recent census of JWST galaxies at , Nakajima23 report little evolution in the mass-metallicity relation within their metallicity uncertainties () and we find Gz9p3 remains offset below the best-fit mass-metallicity relation at these higher redshifts. In fact, the relation from Nakajima23 provides logO/H at log10(MM⊙).
2.9 Resolved stellar populations
In Figure 1, Gz9p3 is clearly isolated from close neighbors and shows an elongated spatially-resolved structure with relatively high S/N in individual pixels.
The direct images have been PSF-matched to the F444W image and while the PSF-matching means the information encoding within a pixel will be blended with its neighbors, our target is spatially large enough to provide regions far enough apart to be resolved (FWHM of F444W is native pixels, or ). This offers the opportunity to carry out a resolved stellar population analysis.
Here, we follow the method of Gimenez-Arteaga22 and perform a pixel-by-pixel fitting of the SED. By fitting the physical parameters for each pixel we can create a 2D map of the distribution of galaxy properties (Stellar Mass, SFR, Stellar Age).
To ensure we have sufficient sensitivity to perform pixel-by-pixel SED model fitting, we first bin the direct image using a (22) kernel to improve the signal to noise (SNR) and then enforce a threshold in the F150W and F200W NIRCam broadband filters (which have the highest noise levels). After this binning, there are pixel that meet this threshold, which sample the full extent of the object with a (binned) pixel scale of 0.062”/px, which at scales to 0.27kpc/px.
For each pixel we fit the 11-band HST+JWST photometry using BAGPIPES (as discussed in 2.8) and we fix the redshift to . Our threshold choice is sufficient to obtain robust fits, with the log of the Bayesian evidence for all pixels .
From BAGPIPES we obtain estimates for the star formation rate and stellar mass, which we convert to surface density properties using the 0.27 kpc/pixel scale, as well as an estimate for the mass-weighted stellar age. We additionally measure the UV slope (where ) using the F150W-F200W colour, taken from the BAGPIPES best-fit SED magnitudes. We determine (e.g., Dunlop13 ), where . For F150W-F200W, the effective999We adopt the ‘pivot’ wavelength as the effective value to account for the transmission profile and detector sensitivity as a function of wavelength for each filter. wavelength Å and Å trace the rest-frame UV for our galaxy’s redshift (ÅÅ), and set . In Figure 4 we present the 2D distribution of these physical properties, where for each pixel we display the 50th percentile of the posterior and in the supporting panels we show the uncertainty of the estimates based on the 16th and 84th percentiles.
Within the 2D distributions, the presence of multiple components is apparent; the main body of the object, a tail and a compact region at the end of the tail (highlighted in the F150W-F444W panel of Figure 4 by the F150W contour). The SFR surface density peaks in the center of the main body, with minimal star formation found in the tail. The mass-weighted age for the main body and tail-clump is estimated to be , with the tail showing older ages albeit with a larger uncertainty. Across the whole 2D distribution of the galaxy the estimates for the visual extinction are below , with a median of only . It is clear that the SED modeling prefers solutions with little to no dust extinction. Like the SFRD, the stellar mass surface density peaks in the center of the main body with a SMD of maintained throughout the tail. The slope estimates range from to and trace the stellar age 2D distribution, with the steepest slopes (associated with the youngest stellar populations) correlating with the stellar age.
2.9.1 Properties of Integrated regions
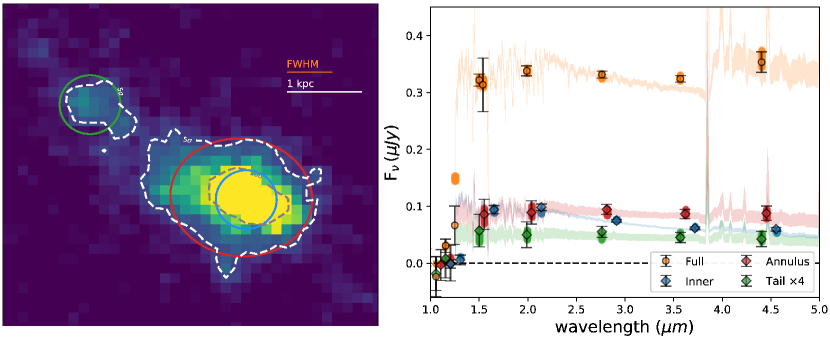
In addition to presenting the pixel-by-pixel 2D distributions of the physical parameters, we investigate the integrated properties of three distinct regions (with greater spatial separation than the FWHM). Figure 10 presents the placement of three apertures which follow the 5 and contours of the F277W direct image. One aperture () is placed over clump in the tail, which traces the region of low stellar ages and blue slope seen in Figure 4. Two apertures are placed over the main component of the source, a compact aperture () following the contour and a larger ellipse ( semi-minor/major axis) following the contour, the placement of these two creates an annulus. The inner aperture traces the compact peak of the SFRD and SMD distributions while the annulus covers the surrounding lower SFRD and SMD region.
To compare different regions of the target, we use the photutils101010https://photutils.readthedocs.io/en/stable/index.html package in Python to measure the aperture photometry. We perform BAGPIPES SED modeling of the aperture photometry from each region following the method in 2.8, obtaining tighter constraints on the physical parameters than in the pixel-by-pixel fitting. The photometry and best-fitting SED models are shown in the right panel of Figure 10.
The Inner region and the surrounding annulus have comparable F150W and F200W flux densities, however diverge at longer wavelengths, with the inner region showing a steeper UV-slope ( and , respectively) and a fainter rest-optical stellar continuum. The clump in the tail shows similar properties to the annulus region, with a UV slope. All three regions exhibit consistent sSFR () and Stellar ages (Myr, with 16 percentiles of and Myr), with the distinguishing property being the visual extinction which is significantly lower in the Inner region () than in the annulus and tail ( and , respectively). In each region the extinction is minimal and for the Inner region it appears negligible, possibly suggesting inflow of pristine gas to the core due to a merger event.
The inferred properties of these regions from the photometry alone are presented in Table 3 and all show young stellar ages (), whereas the fit to the spectrum and photometry of the main component (the combined inner+annulus region) in 2.7 estimated a higher age (Myr). These differences highlight how the light from the young stellar populations dominates the photometry in the rest-UV and masks the older population, which can be seen in the spectra based on the emerging Balmer break. Likewise, the stellar mass estimate for the main component using the spectrum+photometry (log10(MM⊙)=) is higher due to the inclusion of an older stellar population. From the photometry-only SED fitting, the stellar mass of the main component accounts for about one fifth of the full-photometry estimate, but for half of the flux density. Correspondingly, the outskirts of the main component (outside the aperture) and the extended tail exhibit a high stellar mass-to-UV-light ratio. This follows the pattern of SMD, stellar age and SFRD properties in the 2D distributions of Figure 4. We also note that the very young stellar population ages () preferred in the fits of the individual regions have lower stellar mass-to-UV-light ratios, with the fit outcome dominated by the rest-frame UV light. The discrepancy in the star formation rates and stellar masses between SED fitting from broadband photometry and SED fitting from the spectrum highlights the importance of spectroscopy to study galaxies during the epoch of reionization.
| Property | Main (phot-only) | Inner | Tail | Annulus |
|---|---|---|---|---|
| Stellar Mass [logMM] | ||||
| Star formation rate [M] | ||||
| Stellar Age [Myr] | ||||
| Slope | ||||
| Muv [AB_mag] |
2.10 Morphological properties and evidence for a merging system
The non-negligible mass in the tail of Gz9p3 suggests the extended structure is a result of a merger rather than being due to gas stripping, which would show very low masses in a tail (Vulcani21, ). This is further supported by the presence of a double nucleus (reminiscent of a merger remnant) in the F150W-F444W panel (and in Figure 1) and by star formation concentrated to the core, which may indicate a nuclear starburst triggered by gas infall during a merger (Springel00, ; Barnes02, ; Naab06, ). On the other hand, the pixel-by-pixel SED modeling returns a relatively smooth spatial distribution of properties, which could be interpreted as evidence that the system is observed a few dynamical times post-merger and has therefore largely completed its relaxation process.
Spectroscopic coverage over the tail, which is unavailable due to the placement of the slit, would likely allow stellar and gas kinematic measurements to further distinguish between a merger history and any gas stripping from either ram pressure stripping within the over-density reported by Castellano22b or due to cosmic web stripping Benitez-Llambay13 .
Lacking such spectroscopic data, to examine further whether this system is a merger, we utilize a tailored data reduction of the NIRCam direct imaging at short wavelengths without PSF matching to F444W. This allows greater spatial resolution in the short wavelength F150W and F200W filters, which are drizzled to a 20mas/px resolution. We weight-combine the F150W and F200W direct images to improve the signal to noise ratio before investigating the morphology. The combined image is presented in Figure 5 and visually shows two cores within the center of the galaxy. We fit both core components (Left and Right as viewed) with Sersic profiles and measure consistent profiles with (corresponding to ), and axis ratios of 0.81, 0.76. The central region (excluding the tail) shows a greater axis ratio of 0.44, with a (0.65kpc) for a profile. The best-fit F150W+F200W profile, which traces the rest-UV and hence activity star forming regions, shows a smaller size and shallower gradient than the F444W best-fit profile to the central region ( axis ratio) which traces the rest-optical and the older stellar population.
2.10.1 Morphological indexes
Several quantifiable indicators exist for describing the morphology of a galaxy, with thresholds to indicate whether a system is likely to have gone, or be going through, a merger: Gini - M20 and asymmetry (A). These morphological parameters are defined in Lotz04 ; Lotz08 and Abraham03 , respectively. Lotz08 define mergers as galaxies with Gini M20, while Conselice03 adopt the condition as a merger criterion. These parameters were already adopted to study the morphology of galaxies at the epoch reionization with JWST observations (Treu23, ). We thus follow the same measurement procedure on the combined F150W+F200W galaxy cutout shown in Figure 5. We obtain Gini , M, and , which robustly classify our system as a merger.
2.10.2 Clumpiness
The system appears also very clumpy in Figure 5, with two bright and distinct clumps clearly detected in the central region. These might represent the two merger components. To be more quantitative, we calculate the clumpiness parameter , which is defined as the fraction of light of the galaxy residing in clumps. This traces the relative importance of small scale structures inside a galaxy, and can shed light on star-formation episodes outside of the nucleus or material (gas+stars) that has been stripped away from the galaxy by tidal phenomena. At intermediate redshift, the presence of bright clumps is tightly associated to merger events (Calabro19, ). To compute the clumpiness, we follow a similar approach to Calabro19 . In brief, we smooth the original image (F150W + F200W combined) using a gaussian filter with a size of , corresponding to kpc at the target redshift.
We then subtract the smoothed image from the original image, and select the pixels with a flux at least above the background, in order to reduce the noise contamination. We also impose for all the pixels with a negative value in the residual (Conselice03, ). Finally, the clumpiness is calculated as the ratio between the flux in those pixels and the total flux of the galaxy. We obtain a final value of , and the clump-map is shown in the right panel of Figure 5.
In the clump-map we can see that, while most of the flux is coming from the two central nuclei, there are clumps detected in the left tail of the system. If we remove the nuclei, we still find that of the total flux (which roughly traces the SFR as we probe the rest-frame UV) resides in these external structures, which is completely different from the compact, nucleated morphology of typical star-forming galaxies seen at these redshifts (Treu23, ). We can also notice the elongated shape of the main clump in the center, which contributes to increase the asymmetry of the system. All this evidence suggests that a merger is ongoing and that the elongated, clumpy structure might be the result of the tidal forces generated during the interaction, as observed in lower redshift mergers.
2.11 Comparison to theoretical modeling
The properties of Gz9p3 can be compared to basic theoretical modeling of galaxy formation in CDM as a first step to assess the ability of current model to reproduce the observations. To estimate the number density and relation between stellar mass and , we consider a set of models where DM halos are populated with stellar populations based on simple analytical recipes (Mason2023, ; Mason2015, ; Ren2019, ). In summary, the modeling relies on three elements (1) the stellar-to-halo mass ratio is mass dependent but redshift independent; (2) the age of the stellar population is proportional to the DM halo assembly time and its scatter derives from the probability distribution of the halo assembly time based on extended Press Schechter theory; (3) the star formation efficiency is calibrated via abundance matching at a single reference redshift where a robust determination of the UV luminosity function is available. Using the results from Mason2023 we can see from their Fig. 3 that Gz9p3 sits very close to the modeling predictions for the stellar mass versus relationship at the median age of Myr, indicating it should be a typical object for its mass and luminosity (and dust content). Based on that model, the inferred DM halo mass of the system is and the inferred number density is (comoving). While it is challenging to estimate a parent survey volume to associate to this object (given it was included as a NIRSpec target based on pre-existing HST photometry), considering the NIRSpec FoV of and for photometric pre-selection a volume of (comoving) is derived (see e.g. the cosmic variance calculator from Trenti08 ). This implies only a few percent probability of having such a massive and bright galaxy in the GLASS NIRSpec FoV. Given that the relationships between stellar mass, UV luminosity, and dust are in agreement with theory, the natural degree of freedom to change is an increased star formation efficiency relative to the halo mass as the redshift increases. This has been proposed in similar modeling, e.g. by Behroozi2015 , and an increased star formation efficiency could also explain the higher than expected density of photometric candidates at from NIRCam observations (e.g. Castellano22b ).
Theoretical modeling is also useful to estimate the probability of observing a disturbed morphology deriving from a galaxy merger. The merger rate of DM halos per unit redshift is nearly universal across primary halo mass and redshift and only depends on the mass ratio (Fakhouri2008, ). Estimating a mass ratio between and from the photometry of Gz9p3, Fakhouri2008 gives , which corresponds to one merger expected every Myr at . Assuming further that the disturbed morphology remains observable over a timescale of a few dynamical times for the system. The latter can be estimated to be Myr considering a characteristic velocity dispersion of km/s (from virial equilibrium) and a characteristic radius of kpc (from imaging). Therefore, we conclude that catching galaxies in the act of merging at this epoch is relatively likely (at the level of % probability).
2.12 Comparison to cosmological hydrodynamical simulations
To further assess whether this galaxy is in tension with predictions from the CDM model, we searched for analogous galaxies with masses in the IllustrisTNG simulation suite (TNG1, ; TNG2, ; TNG3, ; TNG4, ; TNG5, ). We found 13 analogous galaxies in Snapshot 5 of TNG300-1 at a redshift of , with a box length of 446.7 cMpc, and an average mass resolution of for baryonic particles. No analogous galaxies were found in TNG100, the second largest simulation of the suite with a box length of 110 cMpc, indicating that such massive galaxies are rare objects in the early Universe.
While 13 simulated galaxies does not provide a statistical sample, we do find that these simulated sources do share similarities to Gz9p3. Each of the 13 galaxies shares a similar SFR, with the mean SFR . The merger tree history of the 13 systems indicates that two had undergone a major merger (Mass ratio 0.2, 15) and four had undergone a minor merger (Mass ratio 0.2, 31) within the cosmic time interval between and (Snapshots 4 and 5 of the simulation). Such a rate of major mergers falls in line with our prediction from theoretical modeling. Unfortunately, the spatial and mass resolution of the simulation is not sufficient to obtain a detailed morphology for a quantitative comparison. However, qualitatively, two simulated systems show a double-core structure (two distinct mass peaks) which reflects the structure of Gz9p3. Therefore, while current state of the art modeling and simulations suggest that the probability of finding an object such as Gz9p3 in the cosmological volume probed by this survey is low (approximately 6% considering 13 objects in the TNG300 and assuming a survey area of GLASS-ERS+UNCOVER of arcmin2), setting aside number density, galaxies with properties similar to Gz9p3 are expected to exist in the early Universe. This may suggest that star formation efficiency during the epoch of reionization may need to be revised upwards to improve the data-model comparison.
Declarations
-
•
Funding: This work is based on observations made with the NASA/ESA/CSA James Webb Space Telescope. The data were obtained from the Mikulski Archive for Space Telescopes at the Space Telescope Science Institute, which is operated by the Association of Universities for Research in Astronomy, Inc., under NASA contract NAS 5-03127 for JWST. These observations are associated with program JWST-ERS-1324. We acknowledge financial support from NASA through grant JWST-ERS-1324. KG and TN acknowledge support from Australian Research Council Laureate Fellowship FL180100060. BM acknowledges support from Australian Government Research Training Program (RTP) Scholarships and the Jean E Laby Foundation. This research is supported in part by the Australian Research Council Centre of Excellence for All Sky Astrophysics in 3 Dimensions (ASTRO 3D), through project number CE170100013. We acknowledge financial support through grants PRIN-MIUR 2017WSCC32 and 2020SKSTHZ. MB acknowledges support from the Slovenian national research agency ARRS through grant N1-0238. CM acknowledges support by the VILLUM FONDEN under grant 37459. The Cosmic Dawn Center (DAWN) is funded by the Danish National Research Foundation under grant DNRF140. We acknowledge support from the INAF Large Grant 2022 “Extragalactic Surveys with JWST” (PI Pentericci)
-
•
Authors’ contributions: KB identified the emission lines from the NIRSpec data, led the overall data analysis activities, produced all figures, and was primarily responsible for writing the Methods section. MT provided advice on the data analysis and on its physical interpretation, carried out the comparison to theoretical modeling and contributed associated text in Methods, and was primarily responsible for writing the Abstract and Main sections. NL led the SED fitting and contributed associated text in Methods. AC led the clumping analysis and contributed associated text in Methods. BM led the comparison to hydrodynamical simulations and contributed associated text in Methods. GRB led the NIRSpec data reduction. ND led the Lyman Break modeling. LY led the light profile fitting from imaging data. TT led the GLASS/ERS survey conception, design and execution as the Principal Investigator of the program, and contributed advice on the paper preparation. TJ and AH contributed to physical interpretation of the absorption lines. AH, CM, TM, TN, and XW contributed to the NIRSpec data reduction and to the development of the NIRSpec pipeline. AF, EM, CM, DP contributed to the NIRSpec data reduction and to the development of the NIRCam pipeline. All authors contributed comments during the research activities and the manuscript preparation.
References
- \bibcommenthead
- (1) Torrey, P., Vogelsberger, M., Marinacci, F., Pakmor, R., Springel, V., Nelson, D., Naiman, J., Pillepich, A., Genel, S., Weinberger, R., Hernquist, L.: The evolution of the mass-metallicity relation and its scatter in IllustrisTNG. MNRAS 484(4), 5587–5607 (2019) arXiv:1711.05261 [astro-ph.GA]. https://doi.org/10.1093/mnras/stz243
- (2) Smith, R.J., Longmore, S., Bonnell, I.: The simultaneous formation of massive stars and stellar clusters. MNRAS 400(4), 1775–1784 (2009) arXiv:0908.3910 [astro-ph.SR]. https://doi.org/10.1111/j.1365-2966.2009.15621.x
- (3) Fakhouri, O., Ma, C.-P.: The nearly universal merger rate of dark matter haloes in CDM cosmology. MNRAS 386(2), 577–592 (2008) arXiv:0710.4567 [astro-ph]. https://doi.org/10.1111/j.1365-2966.2008.13075.x
- (4) Bouwens, R.J., Oesch, P.A., Stefanon, M., Illingworth, G., Labbé, I., Reddy, N., Atek, H., Montes, M., Naidu, R., Nanayakkara, T., Nelson, E., Wilkins, S.: New Determinations of the UV Luminosity Functions from z 9 to 2 Show a Remarkable Consistency with Halo Growth and a Constant Star Formation Efficiency. The Astrophysical Journal 162(2), 47 (2021) arXiv:2102.07775 [astro-ph.GA]. https://doi.org/10.3847/1538-3881/abf83e
- (5) Hashimoto, T., Laporte, N., Mawatari, K., Ellis, R.S., Inoue, A.K., Zackrisson, E., Roberts-Borsani, G., Zheng, W., Tamura, Y., Bauer, F.E., Fletcher, T., Harikane, Y., Hatsukade, B., Hayatsu, N.H., Matsuda, Y., Matsuo, H., Okamoto, T., Ouchi, M., Pelló, R., Rydberg, C.-E., Shimizu, I., Taniguchi, Y., Umehata, H., Yoshida, N.: The onset of star formation 250 million years after the Big Bang. Nature 557(7705), 392–395 (2018) arXiv:1805.05966 [astro-ph.GA]. https://doi.org/10.1038/s41586-018-0117-z
- (6) Roberts-Borsani, G.W., Ellis, R.S., Laporte, N.: Interpreting the Spitzer/IRAC colours of 7 z 9 galaxies: distinguishing between line emission and starlight using ALMA. Monthly Notices of the Royal Astronomical Society 497(3), 3440–3450 (2020) arXiv:2002.02968 [astro-ph.GA]. https://doi.org/10.1093/mnras/staa2085
- (7) Castellano, M., Fontana, A., Treu, T., Santini, P., Merlin, E., Leethochawalit, N., Trenti, M., Vanzella, E., Mestric, U., Bonchi, A., Belfiori, D., Nonino, M., Paris, D., Polenta, G., Roberts-Borsani, G., Boyett, K., Bradač, M., Calabrò, A., Glazebrook, K., Grillo, C., Mascia, S., Mason, C., Mercurio, A., Morishita, T., Nanayakkara, T., Pentericci, L., Rosati, P., Vulcani, B., Wang, X., Yang, L.: Early Results from GLASS-JWST. III. Galaxy Candidates at z 9-15. ApJ 938(2), 15 (2022) arXiv:2207.09436 [astro-ph.GA]. https://doi.org/10.3847/2041-8213/ac94d0
- (8) Naidu, R.P., Oesch, P.A., van Dokkum, P., Nelson, E.J., Suess, K.A., Brammer, G., Whitaker, K.E., Illingworth, G., Bouwens, R., Tacchella, S., Matthee, J., Allen, N., Bezanson, R., Conroy, C., Labbe, I., Leja, J., Leonova, E., Magee, D., Price, S.H., Setton, D.J., Strait, V., Stefanon, M., Toft, S., Weaver, J.R., Weibel, A.: Two Remarkably Luminous Galaxy Candidates at z 10-12 Revealed by JWST. ApJ 940(1), 14 (2022) arXiv:2207.09434 [astro-ph.GA]. https://doi.org/10.3847/2041-8213/ac9b22
- (9) Donnan, C.T., McLeod, D.J., McLure, R.J., Dunlop, J.S., Carnall, A.C., Cullen, F., Magee, D.: The abundance of z galaxy candidates in the HUDF using deep JWST NIRCam medium-band imaging. MNRAS (2023) arXiv:2212.10126 [astro-ph.GA]. https://doi.org/10.1093/mnras/stad471
- (10) Harikane, Y., Ouchi, M., Oguri, M., Ono, Y., Nakajima, K., Isobe, Y., Umeda, H., Mawatari, K., Zhang, Y.: A Comprehensive Study of Galaxies at z 9-16 Found in the Early JWST Data: Ultraviolet Luminosity Functions and Cosmic Star Formation History at the Pre-reionization Epoch. ApJS 265(1), 5 (2023) arXiv:2208.01612 [astro-ph.GA]. https://doi.org/10.3847/1538-4365/acaaa9
- (11) Morishita, T., Stiavelli, M.: Physical Characterization of Early Galaxies in the Webb’s First Deep Field SMACS J0723.3-7323. arXiv e-prints, 2207–11671 (2022) arXiv:2207.11671 [astro-ph.GA]. https://doi.org/10.48550/arXiv.2207.11671
- (12) Bouwens, R.J., Stefanon, M., Brammer, G., Oesch, P.A., Herard-Demanche, T., Illingworth, G.D., Matthee, J., Naidu, R.P., van Dokkum, P.G., van Leeuwen, I.F.: Evolution of the UV LF from z~15 to z~8 Using New JWST NIRCam Medium-Band Observations over the HUDF/XDF. arXiv e-prints, 2211–02607 (2022) arXiv:2211.02607 [astro-ph.GA]. https://doi.org/10.48550/arXiv.2211.02607
- (13) Morishita, T., Roberts-Borsani, G., Treu, T., Brammer, G., Mason, C.A., Trenti, M., Vulcani, B., Wang, X., Acebron, A., Bahé, Y., Bergamini, P., Boyett, K., Bradac, M., Calabrò, A., Castellano, M., Chen, W., De Lucia, G., Filippenko, A.V., Fontana, A., Glazebrook, K., Grillo, C., Henry, A., Jones, T., Kelly, P.L., Koekemoer, A.M., Leethochawalit, N., Lu, T.-Y., Marchesini, D., Mascia, S., Mercurio, A., Merlin, E., Metha, B., Nanayakkara, T., Nonino, M., Paris, D., Pentericci, L., Santini, P., Strait, V., Vanzella, E., Windhorst, R.A., Rosati, P., Xie, L.: Early results from GLASS-JWST. XVIII: A spectroscopically confirmed protocluster 650 million years after the Big Bang. arXiv e-prints, 2211–09097 (2022) arXiv:2211.09097 [astro-ph.GA]
- (14) Roberts-Borsani, G., Treu, T., Chen, W., Morishita, T., Vanzella, E., Zitrin, A., Bergamini, P., Castellano, M., Fontana, A., Grillo, C., Kelly, P.L., Merlin, E., Paris, D., Rosati, P., Acebron, A., Bonchi, A., Boyett, K., Bradac, M., Broadhurst, T., Calabro, A., Diego, J.M., Dressler, A., Furtak, L.J., Filippenko, A.V., Glazebrook, K., Koekemoer, A.M., Leethochawalit, N., Malkan, M.A., Mason, C., Mercurio, A., Metha, B., Nanayakkara, T., Pentericci, L., Pierel, J., Rieck, S., Roy, N., Santini, P., Strait, V., Strausbaugh, R., Trenti, M., Vulcani, B., Wang, L., Wang, X., Windhorst, R., Yang, L.: A shot in the Dark (Ages): a faint galaxy at confirmed with JWST. arXiv e-prints, 2210–15639 (2022) arXiv:2210.15639 [astro-ph.GA]. https://doi.org/10.48550/arXiv.2210.15639
- (15) Curtis-Lake, E., Carniani, S., Cameron, A., Charlot, S., Jakobsen, P., Maiolino, R., Bunker, A., Witstok, J., Smit, R., Chevallard, J., Willott, C., Ferruit, P., Arribas, S., Bonaventura, N., Curti, M., D’Eugenio, F., Franx, M., Giardino, G., Looser, T.J., Lützgendorf, N., Maseda, M.V., Rawle, T., Rix, H.-W., Rodriguez del Pino, B., Übler, H., Sirianni, M., Dressler, A., Egami, E., Eisenstein, D.J., Endsley, R., Hainline, K., Hausen, R., Johnson, B.D., Rieke, M., Robertson, B., Shivaei, I., Stark, D.P., Tacchella, S., Williams, C.C., Willmer, C.N.A., Bhatawdekar, R., Bowler, R., Boyett, K., Chen, Z., de Graaff, A., Helton, J.M., Hviding, R.E., Jones, G.C., Kumari, N., Lyu, J., Nelson, E., Perna, M., Sandles, L., Saxena, A., Suess, K.A., Sun, F., Topping, M.W., Wallace, I.E.B., Whitler, L.: Spectroscopy of four metal-poor galaxies beyond redshift ten. arXiv e-prints, 2212–04568 (2022) arXiv:2212.04568 [astro-ph.GA]. https://doi.org/10.48550/arXiv.2212.04568
- (16) Bunker, A.J., Saxena, A., Cameron, A.J., Willott, C.J., Curtis-Lake, E., Jakobsen, P., Carniani, S., Smit, R., Maiolino, R., Witstok, J., Curti, M., D’Eugenio, F., Jones, G.C., Ferruit, P., Arribas, S., Charlot, S., Chevallard, J., Giardino, G., de Graaff, A., Looser, T.J., Luetzgendorf, N., Maseda, M.V., Rawle, T., Rix, H.-W., Rodriguez Del Pino, B., Alberts, S., Egami, E., Eisenstein, D.J., Endsley, R., Hainline, K., Hausen, R., Johnson, B.D., Rieke, G., Rieke, M., Robertson, B.E., Shivaei, I., Stark, D.P., Sun, F., Tacchella, S., Tang, M., Williams, C.C., Willmer, C.N.A., Baker, W.M., Baum, S., Bhatawdekar, R., Bowler, R., Boyett, K., Chen, Z., Circosta, C., Helton, J.M., Ji, Z., Lyu, J., Nelson, E., Parlanti, E., Perna, M., Sandles, L., Scholtz, J., Suess, K.A., Topping, M.W., Uebler, H., Wallace, I.E.B., Whitler, L.: JADES NIRSpec Spectroscopy of GN-z11: Lyman- emission and possible enhanced nitrogen abundance in a luminous galaxy. arXiv e-prints, 2302–07256 (2023) arXiv:2302.07256 [astro-ph.GA]
- (17) Mason, C.A., Trenti, M., Treu, T.: The brightest galaxies at cosmic dawn. MNRAS (2023) arXiv:2207.14808 [astro-ph.GA]. https://doi.org/10.1093/mnras/stad035
- (18) Wilkins, S.M., Vijayan, A.P., Lovell, C.C., Roper, W.J., Irodotou, D., Caruana, J., Seeyave, L.T.C., Kuusisto, J.K., Thomas, P.A., Parris, S.A.K.: First light and reionization epoch simulations (FLARES) V: the redshift frontier. MNRAS 519(2), 3118–3128 (2023) arXiv:2204.09431 [astro-ph.GA]. https://doi.org/10.1093/mnras/stac3280
- (19) Katz, H., Saxena, A., Cameron, A.J., Carniani, S., Bunker, A.J., Arribas, S., Bhatawdekar, R., Bowler, R.A.A., Boyett, K.N.K., Cresci, G., Curtis-Lake, E., D’Eugenio, F., Kumari, N., Looser, T.J., Maiolino, R., Übler, H., Willott, C., Witstok, J.: First insights into the ISM at z 8 with JWST: possible physical implications of a high [O III] 4363/[O III] 5007. MNRAS 518(1), 592–603 (2023) arXiv:2207.13693 [astro-ph.GA]. https://doi.org/10.1093/mnras/stac2657
- (20) Curti, M., D’Eugenio, F., Carniani, S., Maiolino, R., Sandles, L., Witstok, J., Baker, W.M., Bennett, J.S., Piotrowska, J.M., Tacchella, S., Charlot, S., Nakajima, K., Maheson, G., Mannucci, F., Amiri, A., Arribas, S., Belfiore, F., Bonaventura, N.R., Bunker, A.J., Chevallard, J., Cresci, G., Curtis-Lake, E., Hayden-Pawson, C., Jones, G.C., Kumari, N., Laseter, I., Looser, T.J., Marconi, A., Maseda, M.V., Scholtz, J., Smit, R., Übler, H., Wallace, I.E.B.: The chemical enrichment in the early Universe as probed by JWST via direct metallicity measurements at z 8. MNRAS 518(1), 425–438 (2023) arXiv:2207.12375 [astro-ph.GA]. https://doi.org/10.1093/mnras/stac2737
- (21) Hsiao, T.Y.-Y., Coe, D., Abdurro’uf, Whitler, L., Jung, I., Khullar, G., Meena, A.K., Dayal, P., Barrow, K.S.S., Santos-Olmsted, L., Casselman, A., Vanzella, E., Nonino, M., Jimenez-Teja, Y., Oguri, M., Stark, D.P., Furtak, L.J., Zitrin, A., Adamo, A., Brammer, G., Bradley, L., Diego, J.M., Zackrisson, E., Finkelstein, S.L., Windhorst, R.A., Bhatawdekar, R., Hutchison, T.A., Broadhurst, T., Dimauro, P., Andrade-Santos, F., Eldridge, J.J., Acebron, A., Avila, R.J., Bayliss, M.B., Benitez, A., Binggeli, C., Bolan, P., Bradac, M., Carnall, A.C., Conselice, C.J., Donahue, M., Frye, B., Fujimoto, S., Henry, A., James, B.L., Kassin, S., Kewley, L., Larson, R.L., Lauer, T., Law, D., Mahler, G., Mainali, R., McCandliss, S., Nicholls, D., Pirzkal, N., Postman, M., Rigby, J.R., Ryan, R., Senchyna, P., Sharon, K., Shimizu, I., Strait, V., Tang, M., Trenti, M., Vikaeus, A., Welch, B.: JWST reveals a possible galaxy merger in triply-lensed MACS0647JD. arXiv e-prints, 2210–14123 (2022) arXiv:2210.14123 [astro-ph.GA]. https://doi.org/%****␣main.tex␣Line␣1525␣****10.48550/arXiv.2210.14123
- (22) Cameron, A.J., Saxena, A., Bunker, A.J., D’Eugenio, F., Carniani, S., Maiolino, R., Curtis-Lake, E., Ferruit, P., Jakobsen, P., Arribas, S., Bonaventura, N., Charlot, S., Chevallard, J., Curti, M., Looser, T.J., Maseda, M.V., Rawle, T., Rodríguez Del Pino, B., Smit, R., Übler, H., Willott, C., Witstok, J., Egami, E., Eisenstein, D.J., Johnson, B.D., Hainline, K., Rieke, M., Robertson, B.E., Stark, D.P., Tacchella, S., Williams, C.C., Bhatawdekar, R., Bowler, R., Boyett, K., Circosta, C., Helton, J.M., Jones, G.C., Kumari, N., Ji, Z., Nelson, E., Parlanti, E., Sandles, L., Scholtz, J., Sun, F.: JADES: Probing interstellar medium conditions at with ultra-deep JWST/NIRSpec spectroscopy. arXiv e-prints, 2302–04298 (2023) arXiv:2302.04298 [astro-ph.GA]. https://doi.org/10.48550/arXiv.2302.04298
- (23) Endsley, R., Stark, D.P., Whitler, L., Topping, M.W., Chen, Z., Plat, A., Chisholm, J., Charlot, S.: A JWST/NIRCam Study of Key Contributors to Reionization: The Star-forming and Ionizing Properties of UV-faint Galaxies. arXiv e-prints, 2208–14999 (2022) arXiv:2208.14999 [astro-ph.GA]
- (24) Tang, M., Stark, D.P., Chen, Z., Mason, C., Topping, M., Endsley, R., Senchyna, P., Plat, A., Lu, T.-Y., Whitler, L., Robertson, B., Charlot, S.: JWST/NIRSpec Spectroscopy of Star Forming Galaxies with CEERS: New Insight into Bright Ly Emitters in Ionized Bubbles. arXiv e-prints, 2301–07072 (2023) arXiv:2301.07072 [astro-ph.GA]. https://doi.org/10.48550/arXiv.2301.07072
- (25) Sanders, R.L., Shapley, A.E., Topping, M.W., Reddy, N.A., Brammer, G.B.: Excitation and Ionization Properties of Star-forming Galaxies at z=2.0-9.3 with JWST/NIRSpec. arXiv e-prints, 2301–06696 (2023) arXiv:2301.06696 [astro-ph.GA]. https://doi.org/10.48550/arXiv.2301.06696
- (26) Cardamone, C., Schawinski, K., Sarzi, M., Bamford, S.P., Bennert, N., Urry, C.M., Lintott, C., Keel, W.C., Parejko, J., Nichol, R.C., Thomas, D., Andreescu, D., Murray, P., Raddick, M.J., Slosar, A., Szalay, A., Vandenberg, J.: Galaxy Zoo Green Peas: discovery of a class of compact extremely star-forming galaxies. Monthly Notices of the Royal Astronomical Society 399(3), 1191–1205 (2009) arXiv:0907.4155 [astro-ph.CO]. https://doi.org/10.1111/j.1365-2966.2009.15383.x
- (27) Yang, H., Malhotra, S., Rhoads, J.E., Wang, J.: Blueberry Galaxies: The Lowest Mass Young Starbursts. ApJ 847(1), 38 (2017) arXiv:1706.02819 [astro-ph.GA]. https://doi.org/10.3847/1538-4357/aa8809
- (28) Henry, A., Scarlata, C., Martin, C.L., Erb, D.: Ly Emission from Green Peas: The Role of Circumgalactic Gas Density, Covering, and Kinematics. ApJ 809(1), 19 (2015) arXiv:1505.05149 [astro-ph.GA]. https://doi.org/10.1088/0004-637X/809/1/19
- (29) Jaskot, A.E., Oey, M.S.: The Origin and Optical Depth of Ionizing Radiation in the “Green Pea” Galaxies. ApJ 766(2), 91 (2013) arXiv:1301.0530 [astro-ph.CO]. https://doi.org/10.1088/0004-637X/766/2/91
- (30) Tang, M., Stark, D.P., Chevallard, J., Charlot, S., Endsley, R., Congiu, E.: Lyman-alpha spectroscopy of extreme [O III] emitting galaxies at z = 2-3: implications for Ly-alpha visibility and LyC leakage at z 6. Monthly Notices of the Royal Astronomical Society 503(3), 4105–4117 (2021) arXiv:2012.04697 [astro-ph.GA]. https://doi.org/10.1093/mnras/stab705
- (31) Sanders, R.L., Shapley, A.E., Reddy, N.A., Kriek, M., Siana, B., Coil, A.L., Mobasher, B., Shivaei, I., Freeman, W.R., Azadi, M., Price, S.H., Leung, G., Fetherolf, T., de Groot, L., Zick, T., Fornasini, F.M., Barro, G.: The MOSDEF survey: direct-method metallicities and ISM conditions at z 1.5-3.5. Monthly Notices of the Royal Astronomical Society 491(1), 1427–1455 (2020) arXiv:1907.00013 [astro-ph.GA]. https://doi.org/10.1093/mnras/stz3032
- (32) Sanders, R.L., Shapley, A.E., Kriek, M., Reddy, N.A., Freeman, W.R., Coil, A.L., Siana, B., Mobasher, B., Shivaei, I., Price, S.H., de Groot, L.: The MOSDEF Survey: Electron Density and Ionization Parameter at z ~2.3. The Astrophysical Journal 816(1), 23 (2016) arXiv:1509.03636 [astro-ph.GA]. https://doi.org/10.3847/0004-637X/816/1/23
- (33) Wang, X., Jones, T., Vulcani, B., Treu, T., Morishita, T., Roberts-Borsani, G., Malkan, M.A., Henry, A., Brammer, G., Strait, V., Bradač, M., Boyett, K., Calabrò, A., Castellano, M., Fontana, A., Glazebrook, K., Kelly, P.L., Leethochawalit, N., Marchesini, D., Santini, P., Trenti, M., Yang, L.: Early Results from GLASS-JWST. IV. Spatially Resolved Metallicity in a Low-mass z 3 Galaxy with NIRISS. ApJ 938(2), 16 (2022) arXiv:2207.13113 [astro-ph.GA]. https://doi.org/10.3847/2041-8213/ac959e
- (34) Chen, Z., Stark, D.P., Endsley, R., Topping, M., Whitler, L., Charlot, S.: JWST/NIRCam observations of stars and HII regions in z = 6-8 galaxies: properties of star-forming complexes on 150 pc scales. MNRAS 518(4), 5607–5619 (2023) arXiv:2207.12657 [astro-ph.GA]. https://doi.org/10.1093/mnras/stac3476
- (35) Giménez-Arteaga, C., Oesch, P.A., Brammer, G.B., Valentino, F., Mason, C.A., Weibel, A., Barrufet, L., Fujimoto, S., Heintz, K.E., Nelson, E.J., Strait, V.B., Suess, K.A., Gibson, J.: Spatially Resolved Properties of High Redshift Galaxies in the SMACS0723 JWST ERO Field. arXiv e-prints, 2212–08670 (2022) arXiv:2212.08670 [astro-ph.GA]. https://doi.org/10.48550/arXiv.2212.08670
- (36) Castellano, M., Fontana, A., Treu, T., Merlin, E., Santini, P., Bergamini, P., Grillo, C., Rosati, P., Acebron, A., Leethochawalit, N., Paris, D., Bonchi, A., Belfiori, D., Calabrò, A., Correnti, M., Nonino, M., Polenta, G., Trenti, M., Boyett, K., Brammer, G., Broadhurst, T., Caminha, G.B., Chen, W., Filippenko, A.V., Glazebrook, K., Mascia, S., Mason, C.A., Meneghetti, M., Mercurio, A., Metha, B., Morishita, T., Nanayakkara, T., Pentericci, L., Roberts-Borsani, G., Roy, N., Vanzella, E., Vulcani, B., Yang, L., Wang, X.: A High Density of Bright Galaxies at in the A2744 region. arXiv e-prints, 2212–06666 (2022) arXiv:2212.06666 [astro-ph.GA]. https://doi.org/10.48550/arXiv.2212.06666
- (37) Treu, T., Roberts-Borsani, G., Bradac, M., Brammer, G., Fontana, A., Henry, A., Mason, C., Morishita, T., Pentericci, L., Wang, X., Acebron, A., Bagley, M., Bergamini, P., Belfiori, D., Bonchi, A., Boyett, K., Boutsia, K., Calabró, A., Caminha, G.B., Castellano, M., Dressler, A., Glazebrook, K., Grillo, C., Jacobs, C., Jones, T., Kelly, P.L., Leethochawalit, N., Malkan, M.A., Marchesini, D., Mascia, S., Mercurio, A., Merlin, E., Nanayakkara, T., Nonino, M., Paris, D., Poggianti, B., Rosati, P., Santini, P., Scarlata, C., Shipley, H.V., Strait, V., Trenti, M., Tubthong, C., Vanzella, E., Vulcani, B., Yang, L.: The GLASS-JWST Early Release Science Program. I. Survey Design and Release Plans. ApJ 935(2), 110 (2022) arXiv:2206.07978 [astro-ph.GA]. https://doi.org/10.3847/1538-4357/ac8158
- (38) Bergamini, P., Acebron, A., Grillo, C., Rosati, P., Caminha, G.B., Mercurio, A., Vanzella, E., Angora, G., Brammer, G., Meneghetti, M., Nonino, M.: New high-precision strong lensing modeling of Abell 2744. Preparing for JWST observations. arXiv e-prints, 2207–09416 (2022) arXiv:2207.09416 [astro-ph.CO]
- (39) Paris, D., Merlin, E., Fontana, A., Bonchi, A., Brammer, G., Correnti, M., Treu, T., Boyett, K., Calabrò, A., Castellano, M., Chen, W., Yang, L., Glazebrook, K., Kelly, P., Koekemoer, A.M., Leethochawalit, N., Mascia, S., Mason, C., Morishita, T., Nonino, M., Pentericci, L., Polenta, G., Roberts-Borsani, G., Santini, P., Trenti, M., Vanzella, E., Vulcani, B., Windhorst, R.A., Nanayakkara, T., Wang, X.: The GLASS-JWST Early Release Science Program. II. Stage I release of NIRCam imaging and catalogs in the Abell 2744 region. arXiv e-prints, 2301–02179 (2023) arXiv:2301.02179 [astro-ph.GA]
- (40) Labbe, I., van Dokkum, P., Nelson, E., Bezanson, R., Suess, K., Leja, J., Brammer, G., Whitaker, K., Mathews, E., Stefanon, M., Wang, B.: A population of red candidate massive galaxies ~600 Myr after the Big Bang. arXiv e-prints, 2207–12446 (2022) arXiv:2207.12446 [astro-ph.GA]. https://doi.org/10.48550/arXiv.2207.12446
- (41) Williams, H., Kelly, P.L., Chen, W., Brammer, G., Zitrin, A., Treu, T., Scarlata, C., Koekemoer, A.M., Oguri, M., Lin, Y.-H., Diego, J.M., Nonino, M., Hjorth, J., Broadhurst, T., Rogers, N., Perez-Fournon, I., Foley, R.J., Jha, S., Filippenko, A.V., Strolger, L., Pierel, J., Poidevin, F.: Spectroscopy from Lyman alpha to [O III] 5007 of a Triply Imaged Magnified Galaxy at Redshift z = 9.5. arXiv e-prints, 2210–15699 (2022) arXiv:2210.15699 [astro-ph.GA]. https://doi.org/10.48550/arXiv.2210.15699
- (42) Mascia, S., Pentericci, L., Calabro’, A., Treu, T., Santini, P., Yang, L., Napolitano, L., Roberts-Borsani, G., Bergamini, P., Grillo, C., Rosati, P., Vulcani, B., Castellano, M., Boyett, K., Fontana, A., Glazebrook, K., Henry, A., Mason, C., Merlin, E., Morishita, T., Nanayakkara, T., Paris, D., Roy, N., Williams, H., Wang, X., Brammer, G., Bradac, M., Chen, W., Kelly, P.L., Koekemoer, A.M., Trenti, M., Windhorst, R.A.: Closing in on the sources of cosmic reionization: first results from the GLASS-JWST program. arXiv e-prints, 2301–02816 (2023) arXiv:2301.02816 [astro-ph.GA]. https://doi.org/10.48550/arXiv.2301.02816
- (43) Fujimoto, S., Arrabal Haro, P., Dickinson, M., Finkelstein, S.L., Kartaltepe, J.S., Larson, R.L., Burgarella, D., Bagley, M.B., Behroozi, P., Chworowsky, K., Hirschmann, M., Trump, J.R., Wilkins, S.M., Yung, L.Y.A., Koekemoer, A.M., Papovich, C., Pirzkal, N., Ferguson, H.C., Fontana, A., Grogin, N.A., Grazian, A., Kewley, L.J., Kocevski, D.D., Lotz, J.M., Pentericci, L., Ravindranath, S., Somerville, R.S., Amorin, R.O., Backhaus, B.E., Calabro, A., Casey, C.M., Cooper, M.C., Franco, M., Giavalisco, M., Hathi, N.P., Harish, S., Hutchison, T.A., Iyer, K.G., Jung, I., Lucas, R.A., Zavala, J.A.: CEERS Spectroscopic Confirmation of NIRCam-Selected z 8 Galaxy Candidates with JWST/NIRSpec: Initial Characterization of their Properties. arXiv e-prints, 2301–09482 (2023) arXiv:2301.09482 [astro-ph.GA]
- (44) Wang, X., Cheng, C., Ge, J., Meng, X.-L., Daddi, E., Yan, H., Jones, T., Malkan, M.A., Arrabal Haro, P., Brammer, G., Oguri, M.: A strong He II 1640 emitter with extremely blue UV spectral slope at : presence of Pop III stars? arXiv e-prints, 2212–04476 (2022) arXiv:2212.04476 [astro-ph.GA]. https://doi.org/10.48550/arXiv.2212.04476
- (45) Sanders, R.L., Shapley, A.E., Kriek, M., Reddy, N.A., Freeman, W.R., Coil, A.L., Siana, B., Mobasher, B., Shivaei, I., Price, S.H., de Groot, L.: The MOSDEF Survey: Electron Density and Ionization Parameter at z ~2.3. ApJ 816(1), 23 (2016) arXiv:1509.03636 [astro-ph.GA]. https://doi.org/10.3847/0004-637X/816/1/23
- (46) Witstok, J., Smit, R., Maiolino, R., Curti, M., Laporte, N., Massey, R., Richard, J., Swinbank, M.: Assessing the sources of reionization: a spectroscopic case study of a 30× lensed galaxy at z 5 with Ly, C IV, Mg II, and [Ne III]. MNRAS 508(2), 1686–1700 (2021) arXiv:2109.03829 [astro-ph.GA]. https://doi.org/10.1093/mnras/stab2591
- (47) Bian, F., Kewley, L.J., Dopita, M.A.: “Direct” Gas-phase Metallicity in Local Analogs of High-redshift Galaxies: Empirical Metallicity Calibrations for High-redshift Star-forming Galaxies. ApJ 859(2), 175 (2018) arXiv:1805.08224 [astro-ph.GA]. https://doi.org/10.3847/1538-4357/aabd74
- (48) Shi, F., Zhao, G., Liang, Y.C.: [Ne III]/[O II] as an oxygen abundance indicator in the H II regions and H II galaxies. A&A 475(2), 409–414 (2007) arXiv:0709.4295 [astro-ph]. https://doi.org/10.1051/0004-6361:20077183
- (49) Maiolino, R., Nagao, T., Grazian, A., Cocchia, F., Marconi, A., Mannucci, F., Cimatti, A., Pipino, A., Ballero, S., Calura, F., Chiappini, C., Fontana, A., Granato, G.L., Matteucci, F., Pastorini, G., Pentericci, L., Risaliti, G., Salvati, M., Silva, L.: AMAZE. I. The evolution of the mass-metallicity relation at z 3. Astronomy and Astrophysics 488(2), 463–479 (2008) arXiv:0806.2410 [astro-ph]. https://doi.org/10.1051/0004-6361:200809678
- (50) Jones, T., Martin, C., Cooper, M.C.: Temperature-based Metallicity Measurements at z=0.8: Direct Calibration of Strong-line Diagnostics at Intermediate Redshift. ApJ 813(2), 126 (2015) arXiv:1504.02417 [astro-ph.GA]. https://doi.org/10.1088/0004-637X/813/2/12610.48550/arXiv.1504.02417
- (51) Nakajima, K., Ouchi, M., Isobe, Y., Harikane, Y., Zhang, Y., Ono, Y., Umeda, H., Oguri, M.: JWST Census for the Mass-Metallicity Star-Formation Relations at z=4-10 with Self-Consistent Flux Calibration and the Proper Metallicity Calibrators. arXiv e-prints, 2301–12825 (2023) arXiv:2301.12825 [astro-ph.GA]. https://doi.org/10.48550/arXiv.2301.12825
- (52) Sanders, R.L., Shapley, A.E., Jones, T., Reddy, N.A., Kriek, M., Siana, B., Coil, A.L., Mobasher, B., Shivaei, I., Davé, R., Azadi, M., Price, S.H., Leung, G., Freeman, W.R., Fetherolf, T., de Groot, L., Zick, T., Barro, G.: The MOSDEF Survey: The Evolution of the Mass-Metallicity Relation from z = 0 to z 3.3. The Astrophysical Journal 914(1), 19 (2021) arXiv:2009.07292 [astro-ph.GA]. https://doi.org/10.3847/1538-4357/abf4c1
- (53) Mason, C.A., Trenti, M., Treu, T.: The Galaxy UV Luminosity Function before the Epoch of Reionization. ApJ 813(1), 21 (2015) arXiv:1508.01204 [astro-ph.GA]. https://doi.org/10.1088/0004-637X/813/1/21
- (54) Padoan, P., Nordlund, Å.: The Stellar Initial Mass Function from Turbulent Fragmentation. ApJ 576(2), 870–879 (2002) arXiv:astro-ph/0011465 [astro-ph]. https://doi.org/10.1086/341790
- (55) Krumholz, M.R., McKee, C.F.: A General Theory of Turbulence-regulated Star Formation, from Spirals to Ultraluminous Infrared Galaxies. ApJ 630(1), 250–268 (2005) arXiv:astro-ph/0505177 [astro-ph]. https://doi.org/10.1086/431734
- (56) Miralda-Escudé, J.: Reionization of the Intergalactic Medium and the Damping Wing of the Gunn-Peterson Trough. ApJ 501(1), 15–22 (1998) arXiv:astro-ph/9708253 [astro-ph]. https://doi.org/%****␣main.tex␣Line␣2525␣****10.1086/305799
- (57) Mason, C.A., Gronke, M.: Measuring the properties of reionized bubbles with resolved Ly spectra. MNRAS 499(1), 1395–1405 (2020) arXiv:2004.13065 [astro-ph.GA]. https://doi.org/10.1093/mnras/staa2910
- (58) Jones, T., Stark, D.P., Ellis, R.S.: Keck Spectroscopy of Faint 3 7 Lyman Break Galaxies. III. The Mean Ultraviolet Spectrum at z ~= 4. ApJ 751(1), 51 (2012) arXiv:1111.5102 [astro-ph.CO]. https://doi.org/10.1088/0004-637X/751/1/51
- (59) Leethochawalit, N., Jones, T.A., Ellis, R.S., Stark, D.P., Zitrin, A.: Absorption-line Spectroscopy of Gravitationally Lensed Galaxies: Further Constraints on the Escape Fraction of Ionizing Photons at High Redshift. ApJ 831(2), 152 (2016) arXiv:1606.05309 [astro-ph.GA]. https://doi.org/10.3847/0004-637X/831/2/152
- (60) Pahl, A.J., Shapley, A., Faisst, A.L., Capak, P.L., Du, X., Reddy, N.A., Laursen, P., Topping, M.W.: The redshift evolution of rest-UV spectroscopic properties to z 5. MNRAS 493(3), 3194–3211 (2020) arXiv:1910.04179 [astro-ph.GA]. https://doi.org/10.1093/mnras/staa355
- (61) Saldana-Lopez, A., Schaerer, D., Chisholm, J., Flury, S.R., Jaskot, A.E., Worseck, G., Makan, K., Gazagnes, S., Mauerhofer, V., Verhamme, A., Amorín, R.O., Ferguson, H.C., Giavalisco, M., Grazian, A., Hayes, M.J., Heckman, T.M., Henry, A., Ji, Z., Marques-Chaves, R., McCandliss, S.R., Oey, M.S., Östlin, G., Pentericci, L., Thuan, T.X., Trebitsch, M., Vanzella, E., Xu, X.: The Low-Redshift Lyman Continuum Survey. Unveiling the ISM properties of low-z Lyman-continuum emitters. A&A 663, 59 (2022) arXiv:2201.11800 [astro-ph.GA]. https://doi.org/10.1051/0004-6361/202141864
- (62) Nakajima, K., Ouchi, M., Xu, Y., Rauch, M., Harikane, Y., Nishigaki, M., Isobe, Y., Kusakabe, H., Nagao, T., Ono, Y., Onodera, M., Sugahara, Y., Kim, J.H., Komiyama, Y., Lee, C.-H., Zahedy, F.S.: EMPRESS. V. Metallicity Diagnostics of Galaxies over 12 + log(O/H) = 6.9-8.9 Established by a Local Galaxy Census: Preparing for JWST Spectroscopy. ApJS 262(1), 3 (2022) arXiv:2206.02824 [astro-ph.GA]. https://doi.org/10.3847/1538-4365/ac7710
- (63) Andrews, B.H., Martini, P.: The Mass-Metallicity Relation with the Direct Method on Stacked Spectra of SDSS Galaxies. ApJ 765(2), 140 (2013) arXiv:1211.3418 [astro-ph.CO]. https://doi.org/10.1088/0004-637X/765/2/140
- (64) Carnall, A.C., McLure, R.J., Dunlop, J.S., Davé, R.: Inferring the star formation histories of massive quiescent galaxies with BAGPIPES: evidence for multiple quenching mechanisms. MNRAS 480(4), 4379–4401 (2018) arXiv:1712.04452 [astro-ph.GA]. https://doi.org/10.1093/mnras/sty216910.48550/arXiv.1712.04452
- (65) Lotz, J.M., Jonsson, P., Cox, T.J., Primack, J.R.: Galaxy merger morphologies and time-scales from simulations of equal-mass gas-rich disc mergers. MNRAS 391(3), 1137–1162 (2008) arXiv:0805.1246 [astro-ph]. https://doi.org/10.1111/j.1365-2966.2008.14004.x
- (66) Oke, J.B., Gunn, J.E.: Secondary standard stars for absolute spectrophotometry. The Astrophysical Journal 266, 713–717 (1983). https://doi.org/10.1086/160817
- (67) Roberts-Borsani, G., Morishita, T., Treu, T., Brammer, G., Strait, V., Wang, X., Bradac, M., Acebron, A., Bergamini, P., Boyett, K., Calabró, A., Castellano, M., Fontana, A., Glazebrook, K., Grillo, C., Henry, A., Jones, T., Malkan, M., Marchesini, D., Mascia, S., Mason, C., Mercurio, A., Merlin, E., Nanayakkara, T., Pentericci, L., Rosati, P., Santini, P., Scarlata, C., Trenti, M., Vanzella, E., Vulcani, B., Willott, C.: Early Results from GLASS-JWST. I: Confirmation of Lensed Lyman-Break Galaxies Behind the Abell 2744 Cluster With NIRISS. arXiv e-prints, 2207–11387 (2022) arXiv:2207.11387 [astro-ph.GA]
- (68) Castellano, M., Dayal, P., Pentericci, L., Fontana, A., Hutter, A., Brammer, G., Merlin, E., Grazian, A., Pilo, S., Amorin, R., Cristiani, S., Dickinson, M., Ferrara, A., Gallerani, S., Giallongo, E., Giavalisco, M., Guaita, L., Koekemoer, A., Maiolino, R., Paris, D., Santini, P., Vallini, L., Vanzella, E., Wagg, J.: First Observational Support for Overlapping Reionized Bubbles Generated by a Galaxy Overdensity. ApJ 818, 3 (2016) arXiv:1601.03442. https://doi.org/10.3847/2041-8205/818/1/L3
- (69) Boyett et al. ApJ(2023, in prep.)
- (70) Leethochawalit, N., Roberts-Borsani, G., Morishita, T., Trenti, M., Treu, T.: The UV luminosity functions of Bright z8 Galaxies: Determination from 0.41 deg2 of HST Observations along 300 independent sightlines. arXiv e-prints, 2205–15388 (2022) arXiv:2205.15388 [astro-ph.GA]. https://doi.org/10.48550/arXiv.2205.15388
- (71) Calzetti, D., Armus, L., Bohlin, R.C., Kinney, A.L., Koornneef, J., Storchi-Bergmann, T.: The Dust Content and Opacity of Actively Star-forming Galaxies. The Astrophysical Journal 533, 682–695 (2000) astro-ph/9911459. https://doi.org/10.1086/308692
- (72) Nagao, T., Maiolino, R., Marconi, A.: Gas metallicity diagnostics in star-forming galaxies. A&A 459(1), 85–101 (2006) arXiv:astro-ph/0603580 [astro-ph]. https://doi.org/10.1051/0004-6361:20065216
- (73) Pérez-Montero, E., Hägele, G.F., Contini, T., Díaz, Á.I.: Neon and argon optical emission lines in ionized gaseous nebulae: implications and applications. MNRAS 381(1), 125–135 (2007) arXiv:0707.2691 [astro-ph]. https://doi.org/10.1111/j.1365-2966.2007.12213.x
- (74) Jeong, M.-S., Shapley, A.E., Sanders, R.L., Runco, J.N., Topping, M.W., Reddy, N.A., Kriek, M., Coil, A.L., Mobasher, B., Siana, B., Shivaei, I., Freeman, W.R., Azadi, M., Price, S.H., Leung, G.C.K., Fetherolf, T., de Groot, L., Zick, T., Fornasini, F.M., Barro, G.: The MOSDEF Survey: Neon as a Probe of ISM Physical Conditions at High Redshift. ApJ 902(1), 16 (2020) arXiv:2008.08831 [astro-ph.GA]. https://doi.org/10.3847/2041-8213/abba7a
- (75) Levesque, E.M., Richardson, M.L.A.: [Ne III]/[O II] as an Ionization Parameter Diagnostic in Star-Forming Galaxies. ApJ 780(1), 100 (2014) arXiv:1309.0513 [astro-ph.GA]. https://doi.org/10.1088/0004-637X/780/1/100
- (76) Sanders, R.L., Shapley, A.E., Kriek, M., Reddy, N.A., Freeman, W.R., Coil, A.L., Siana, B., Mobasher, B., Shivaei, I., Price, S.H., de Groot, L.: The MOSDEF Survey: Detection of [O III]4363 and the Direct-method Oxygen Abundance of a Star-forming Galaxy at z = 3.08. ApJ 825(2), 23 (2016) arXiv:1606.04107 [astro-ph.GA]. https://doi.org/10.3847/2041-8205/825/2/L23
- (77) Pontoppidan, K.M., Barrientes, J., Blome, C., Braun, H., Brown, M., Carruthers, M., Coe, D., DePasquale, J., Espinoza, N., Marin, M.G., Gordon, K.D., Henry, A., Hustak, L., James, A., Jenkins, A., Koekemoer, A.M., LaMassa, S., Law, D., Lockwood, A., Moro-Martin, A., Mullally, S.E., Pagan, A., Player, D., Proffitt, C., Pulliam, C., Ramsay, L., Ravindranath, S., Reid, N., Robberto, M., Sabbi, E., Ubeda, L., Balogh, M., Flanagan, K., Gardner, J., Hasan, H., Meinke, B., Nota, A.: The JWST Early Release Observations. ApJ 936(1), 14 (2022) arXiv:2207.13067 [astro-ph.IM]. https://doi.org/10.3847/2041-8213/ac8a4e
- (78) Paalvast, M., Verhamme, A., Straka, L.A., Brinchmann, J., Herenz, E.C., Carton, D., Gunawardhana, M.L.P., Boogaard, L.A., Cantalupo, S., Contini, T., Epinat, B., Inami, H., Marino, R.A., Maseda, M.V., Michel-Dansac, L., Muzahid, S., Nanayakkara, T., Pezzulli, G., Richard, J., Schaye, J., Segers, M.C., Urrutia, T., Wendt, M., Wisotzki, L.: Properties and redshift evolution of star-forming galaxies with high [O III]/[O II] ratios with MUSE at 0.28 0.85. A&A 618, 40 (2018) arXiv:1808.04899 [astro-ph.GA]. https://doi.org/10.1051/0004-6361/201832866
- (79) Strom, A.L., Steidel, C.C., Rudie, G.C., Trainor, R.F., Pettini, M., Reddy, N.A.: Nebular Emission Line Ratios in z = 2-3 Star-forming Galaxies with KBSS-MOSFIRE: Exploring the Impact of Ionization, Excitation, and Nitrogen-to-Oxygen Ratio. The Astrophysical Journal 836(2), 164 (2017) arXiv:1608.02587 [astro-ph.GA]. https://doi.org/10.3847/1538-4357/836/2/164
- (80) Zeimann, G.R., Ciardullo, R., Gebhardt, H., Gronwall, C., Hagen, A., Trump, J.R., Bridge, J.S., Luo, B., Schneider, D.P.: Hubble Space Telescope Emission-line Galaxies at z ~2: The Mystery of Neon. ApJ 798(1), 29 (2015) arXiv:1410.6159 [astro-ph.GA]. https://doi.org/10.1088/0004-637X/798/1/29
- (81) York, D.G., Adelman, J., Anderson, J. John E., Anderson, S.F., Annis, J., Bahcall, N.A., Bakken, J.A., Barkhouser, R., Bastian, S., Berman, E., Boroski, W.N., SDSS Collaboration: The Sloan Digital Sky Survey: Technical Summary. The Astronomical Journal 120(3), 1579–1587 (2000) arXiv:astro-ph/0006396 [astro-ph]. https://doi.org/10.1086/301513
- (82) Abazajian, K.N., Adelman-McCarthy, J.K., Agüeros, M.A., Allam, S.S., Allende Prieto, C., An, D., Anderson, K.S.J., Anderson, S.F., Annis, J., Bahcall, N.A., Bailer-Jones, C.A.L., Barentine, J.C., Bassett, B.A., Becker, A.C., Beers, T.C., Bell, E.F., Belokurov, V., Berlind, A.A., Berman, E.F., Bernardi, M., Bickerton, S.J., Bizyaev, D., Blakeslee, J.P., Blanton, M.R., Bochanski, J.J., Boroski, W.N., Brewington, H.J., Brinchmann, J., Brinkmann, J., Brunner, R.J., Budavári, T., Carey, L.N., Carliles, S., Carr, M.A., Castander, F.J., Cinabro, D., Connolly, A.J., Csabai, I., Cunha, C.E., Czarapata, P.C., Davenport, J.R.A., de Haas, E., Dilday, B., Doi, M., Eisenstein, D.J., Evans, M.L., Evans, N.W., Fan, X., Friedman, S.D., Frieman, J.A., Fukugita, M., Gänsicke, B.T., Gates, E., Gillespie, B., Gilmore, G., Gonzalez, B., Gonzalez, C.F., Grebel, E.K., Gunn, J.E., Györy, Z., Hall, P.B., Harding, P., Harris, F.H., Harvanek, M., Hawley, S.L., Hayes, J.J.E., Heckman, T.M., Hendry, J.S., Hennessy, G.S., Hindsley, R.B., Hoblitt, J., Hogan, C.J., Hogg, D.W., Holtzman, J.A., Hyde, J.B., Ichikawa, S.-i., Ichikawa, T., Im, M., Ivezić, Ž., Jester, S., Jiang, L., Johnson, J.A., Jorgensen, A.M., Jurić, M., Kent, S.M., Kessler, R., Kleinman, S.J., Knapp, G.R., Konishi, K., Kron, R.G., Krzesinski, J., Kuropatkin, N., Lampeitl, H., Lebedeva, S., Lee, M.G., Lee, Y.S., French Leger, R., Lépine, S., Li, N., Lima, M., Lin, H., Long, D.C., Loomis, C.P., Loveday, J., Lupton, R.H., Magnier, E., Malanushenko, O., Malanushenko, V., Mandelbaum, R., Margon, B., Marriner, J.P., Martínez-Delgado, D., Matsubara, T., McGehee, P.M., McKay, T.A., Meiksin, A., Morrison, H.L., Mullally, F., Munn, J.A., Murphy, T., Nash, T., Nebot, A., Neilsen, J. Eric H., Newberg, H.J., Newman, P.R., Nichol, R.C., Nicinski, T., Nieto-Santisteban, M., Nitta, A., Okamura, S., Oravetz, D.J., Ostriker, J.P., Owen, R., Padmanabhan, N., Pan, K., Park, C., Pauls, G., Peoples, J. John, Percival, W.J., Pier, J.R., Pope, A.C., Pourbaix, D., Price, P.A., Purger, N., Quinn, T., Raddick, M.J., Re Fiorentin, P., Richards, G.T., Richmond, M.W., Riess, A.G., Rix, H.-W., Rockosi, C.M., Sako, M., Schlegel, D.J., Schneider, D.P., Scholz, R.-D., Schreiber, M.R., Schwope, A.D., Seljak, U., Sesar, B., Sheldon, E., Shimasaku, K., Sibley, V.C., Simmons, A.E., Sivarani, T., Allyn Smith, J., Smith, M.C., Smolčić, V., Snedden, S.A., Stebbins, A., Steinmetz, M., Stoughton, C., Strauss, M.A., SubbaRao, M., Suto, Y., Szalay, A.S., Szapudi, I., Szkody, P., Tanaka, M., Tegmark, M., Teodoro, L.F.A., Thakar, A.R., Tremonti, C.A., Tucker, D.L., Uomoto, A., Vanden Berk, D.E., Vandenberg, J., Vidrih, S., Vogeley, M.S., Voges, W., Vogt, N.P., Wadadekar, Y., Watters, S., Weinberg, D.H., West, A.A., White, S.D.M., Wilhite, B.C., Wonders, A.C., Yanny, B., Yocum, D.R., York, D.G., Zehavi, I., Zibetti, S., Zucker, D.B.: The Seventh Data Release of the Sloan Digital Sky Survey. ApJS 182(2), 543–558 (2009) arXiv:0812.0649 [astro-ph]. https://doi.org/10.1088/0067-0049/182/2/543
- (83) Runco, J.N., Shapley, A.E., Sanders, R.L., Topping, M.W., Kriek, M., Reddy, N.A., Coil, A.L., Mobasher, B., Siana, B., Freeman, W.R., Shivaei, I., Azadi, M., Price, S.H., Leung, G.C.K., Fetherolf, T., de Groot, L., Zick, T., Fornasini, F.M., Barro, G.: The MOSDEF survey: a comprehensive analysis of the rest-optical emission-line properties of z 2.3 star-forming galaxies. MNRAS 502(2), 2600–2614 (2021) arXiv:2008.04924 [astro-ph.GA]. https://doi.org/10.1093/mnras/stab119
- (84) Finkelstein, S.L., Bagley, M.B., Ferguson, H.C., Wilkins, S.M., Kartaltepe, J.S., Papovich, C., Yung, L.Y.A., Arrabal Haro, P., Behroozi, P., Dickinson, M., Kocevski, D.D., Koekemoer, A.M., Larson, R.L., Le Bail, A., Morales, A.M., Perez-Gonzalez, P.G., Burgarella, D., Dave, R., Hirschmann, M., Somerville, R.S., Wuyts, S., Bromm, V., Casey, C.M., Fontana, A., Fujimoto, S., Gardner, J.P., Giavalisco, M., Grazian, A., Grogin, N.A., Hathi, N.P., Hutchison, T.A., Jha, S.W., Jogee, S., Kewley, L.J., Kirkpatrick, A., Long, A.S., Lotz, J.M., Pentericci, L., Pierel, J.D.R., Pirzkal, N., Ravindranath, S., Ryan, J. Russell E., Trump, J.R., Yang, G., Bhatawdekar, R., Bisigello, L., Buat, V., Calabro, A., Castellano, M., Cleri, N.J., Cooper, M.C., Croton, D., Daddi, E., Dekel, A., Elbaz, D., Franco, M., Gawiser, E., Holwerda, B.W., Huertas-Company, M., Jaskot, A.E., Leung, G.C.K., Lucas, R.A., Mobasher, B., Pandya, V., Tacchella, S., Weiner, B.J., Zavala, J.A.: CEERS Key Paper I: An Early Look into the First 500 Myr of Galaxy Formation with JWST. arXiv e-prints, 2211–05792 (2022) arXiv:2211.05792 [astro-ph.GA]. https://doi.org/10.48550/arXiv.2211.05792
- (85) Eisenstein et al. ApJ(2023, in prep.)
- (86) Speagle, J.S., Steinhardt, C.L., Capak, P.L., Silverman, J.D.: A Highly Consistent Framework for the Evolution of the Star-Forming “Main Sequence” from z ~0-6. The Astrophysical Journal Supplement Series 214(2), 15 (2014) arXiv:1405.2041 [astro-ph.GA]. https://doi.org/10.1088/0067-0049/214/2/15
- (87) Mármol-Queraltó, E., McLure, R.J., Cullen, F., Dunlop, J.S., Fontana, A., McLeod, D.J.: The evolution of the equivalent width of the H emission line and specific star formation rate in star-forming galaxies at 1 < z < 5. Monthly Notices of the Royal Astronomical Society 460(4), 3587–3597 (2016) arXiv:1511.01911 [astro-ph.GA]. https://doi.org/10.1093/mnras/stw1212
- (88) Venditti, A., Graziani, L., Schneider, R., Pentericci, L., Di Cesare, C., Maio, U., Omukai, K.: A needle in a haystack? Catching Pop\III stars in the Epoch of Reionization: I. Pop\III star forming environments. arXiv e-prints, 2301–10259 (2023) arXiv:2301.10259 [astro-ph.GA]. https://doi.org/10.48550/arXiv.2301.10259
- (89) Trussler, J.A.A., Conselice, C.J., Adams, N.J., Maiolino, R., Nakajima, K., Zackrisson, E., Ferreira, L.: On the observability and identification of Population III galaxies with JWST. arXiv e-prints, 2211–02038 (2022) arXiv:2211.02038 [astro-ph.GA]. https://doi.org/10.48550/arXiv.2211.02038
- (90) Schaerer, D.: On the properties of massive Population III stars and metal-free stellar populations. A&A 382, 28–42 (2002) arXiv:astro-ph/0110697 [astro-ph]. https://doi.org/10.1051/0004-6361:20011619
- (91) Schaerer, D.: The transition from Population III to normal galaxies: Lyalpha and He II emission and the ionising properties of high redshift starburst galaxies. A&A 397, 527–538 (2003) arXiv:astro-ph/0210462 [astro-ph]. https://doi.org/10.1051/0004-6361:20021525
- (92) Raiter, A., Schaerer, D., Fosbury, R.A.E.: Predicted UV properties of very metal-poor starburst galaxies. A&A 523, 64 (2010) arXiv:1008.2114 [astro-ph.CO]. https://doi.org/10.1051/0004-6361/201015236
- (93) Nakajima, K., Maiolino, R.: Diagnostics for PopIII galaxies and direct collapse black holes in the early universe. MNRAS 513(4), 5134–5147 (2022) arXiv:2204.11870 [astro-ph.GA]. https://doi.org/10.1093/mnras/stac1242
- (94) Zackrisson, E., Rydberg, C.-E., Schaerer, D., Östlin, G., Tuli, M.: The Spectral Evolution of the First Galaxies. I. James Webb Space Telescope Detection Limits and Color Criteria for Population III Galaxies. ApJ 740(1), 13 (2011) arXiv:1105.0921 [astro-ph.CO]. https://doi.org/10.1088/0004-637X/740/1/13
- (95) Dong, X.-B., Wang, T.-G., Wang, J.-G., Fan, X., Wang, H., Zhou, H., Yuan, W.: Eddington Ratio Governs the Equivalent Width of Mg II Emission Line in Active Galactic Nuclei. ApJ 703(1), 1–5 (2009) arXiv:0907.4879 [astro-ph.GA]. https://doi.org/10.1088/0004-637X/703/1/L1
- (96) Du, X., Shapley, A.E., Reddy, N.A., Jones, T., Stark, D.P., Steidel, C.C., Strom, A.L., Rudie, G.C., Erb, D.K., Ellis, R.S., Pettini, M.: The Redshift Evolution of Rest-UV Spectroscopic Properties in Lyman-break Galaxies at z 2-4. ApJ 860(1), 75 (2018) arXiv:1803.05912 [astro-ph.GA]. https://doi.org/10.3847/1538-4357/aabfcf
- (97) Shapley, A.E., Steidel, C.C., Pettini, M., Adelberger, K.L.: Rest-Frame Ultraviolet Spectra of z~3 Lyman Break Galaxies. ApJ 588(1), 65–89 (2003) arXiv:astro-ph/0301230 [astro-ph]. https://doi.org/10.1086/373922
- (98) Fontana, A., D’Odorico, S., Poli, F., Giallongo, E., Arnouts, S., Cristiani, S., Moorwood, A., Saracco, P.: Photometric Redshifts and Selection of High-Redshift Galaxies in the NTT and Hubble Deep Fields. AJ 120(5), 2206–2219 (2000) arXiv:astro-ph/0009158 [astro-ph]. https://doi.org/10.1086/31680310.48550/arXiv.astro-ph/0009158
- (99) Leethochawalit, N., Trenti, M., Santini, P., Yang, L., Merlin, E., Castellano, M., Fontana, A., Treu, T., Mason, C., Glazebrook, K., Jones, T., Vulcani, B., Nanayakkara, T., Marchesini, D., Mascia, S., Morishita, T., Roberts-Borsani, G., Bonchi, A., Paris, D., Boyett, K., Strait, V., Calabrò, A., Pentericci, L., Bradac, M., Wang, X., Scarlata, C.: Early Results from GLASS-JWST. X. Rest-frame UV-optical Properties of Galaxies at 7 . ApJ 942(2), 26 (2023) arXiv:2207.11135 [astro-ph.GA]. https://doi.org/10.3847/2041-8213/ac959b10.48550/arXiv.2207.11135
- (100) Santini, P., Fontana, A., Castellano, M., Leethochawalit, N., Trenti, M., Treu, T., Belfiori, D., Birrer, S., Bonchi, A., Merlin, E., Mason, C., Morishita, T., Nonino, M., Paris, D., Polenta, G., Rosati, P., Yang, L., Bradac, M., Calabrò, A., Dressler, A., Glazebrook, K., Marchesini, D., Mascia, S., Nanayakkara, T., Pentericci, L., Roberts-Borsani, G., Scarlata, C., Vulcani, B., Wang, X.: Early results from GLASS-JWST. XI: Stellar masses and mass-to-light ratio of z7 galaxies. arXiv e-prints, 2207–11379 (2022) arXiv:2207.11379 [astro-ph.GA]
- (101) Kroupa, P., Boily, C.M.: On the mass function of star clusters. MNRAS 336(4), 1188–1194 (2002) arXiv:astro-ph/0207514 [astro-ph]. https://doi.org/10.1046/j.1365-8711.2002.05848.x10.48550/arXiv.astro-ph/0207514
- (102) Eldridge, J.J., Stanway, E.R.: Spectral population synthesis including massive binaries. Monthly Notices of the Royal Astronomical Society 400(2), 1019–1028 (2009) https://academic.oup.com/mnras/article-pdf/400/2/1019/3344317/mnras0400-1019.pdf. https://doi.org/10.1111/j.1365-2966.2009.15514.x
- (103) Ferland, G.J., Chatzikos, M., Guzmán, F., Lykins, M.L., van Hoof, P.A.M., Williams, R.J.R., Abel, N.P., Badnell, N.R., Keenan, F.P., Porter, R.L., Stancil, P.C.: The 2017 Release Cloudy. Rev. Mexicana Astron. Astrofis. 53, 385–438 (2017) arXiv:1705.10877 [astro-ph.GA]. https://doi.org/10.48550/arXiv.1705.10877
- (104) Bruzual, G., Charlot, S.: Stellar population synthesis at the resolution of 2003. Monthly Notices of the Royal Astronomical Society 344(4), 1000–1028 (2003) arXiv:astro-ph/0309134 [astro-ph]. https://doi.org/10.1046/j.1365-8711.2003.06897.x
- (105) Chabrier, G.: Galactic Stellar and Substellar Initial Mass Function. Publications of the Astronomical Society of the Pacific 115(809), 763–795 (2003) arXiv:astro-ph/0304382 [astro-ph]. https://doi.org/%****␣main.tex␣Line␣3925␣****10.1086/376392
- (106) Charlot, S., Fall, S.M.: A Simple Model for the Absorption of Starlight by Dust in Galaxies. The Astrophysical Journal 539(2), 718–731 (2000) arXiv:astro-ph/0003128 [astro-ph]. https://doi.org/10.1086/309250
- (107) Dunlop, J.S., Rogers, A.B., McLure, R.J., Ellis, R.S., Robertson, B.E., Koekemoer, A., Dayal, P., Curtis-Lake, E., Wild, V., Charlot, S., Bowler, R.A.A., Schenker, M.A., Ouchi, M., Ono, Y., Cirasuolo, M., Furlanetto, S.R., Stark, D.P., Targett, T.A., Schneider, E.: The UV continua and inferred stellar populations of galaxies at z = 7-9 revealed by the Hubble Ultra-Deep Field 2012 campaign. MNRAS 432(4), 3520–3533 (2013) arXiv:1212.0860 [astro-ph.CO]. https://doi.org/%****␣main.tex␣Line␣3975␣****10.1093/mnras/stt702
- (108) Vulcani, B., Poggianti, B.M., Moretti, A., Franchetto, A., Bacchini, C., McGee, S., Jaffé, Y.L., Mingozzi, M., Werle, A., Tomičić, N., Fritz, J., Bettoni, D., Wolter, A., Gullieuszik, M.: GASP. XXXIII. The Ability of Spatially Resolved Data to Distinguish among the Different Physical Mechanisms Affecting Galaxies in Low-density Environments. ApJ 914(1), 27 (2021) arXiv:2104.02089 [astro-ph.GA]. https://doi.org/10.3847/1538-4357/abf655
- (109) Springel, V.: Modelling star formation and feedback in simulations of interacting galaxies. MNRAS 312(4), 859–879 (2000). https://doi.org/10.1046/j.1365-8711.2000.03187.x
- (110) Barnes, J.E.: Formation of gas discs in merging galaxies. MNRAS 333(3), 481–494 (2002) arXiv:astro-ph/0201250 [astro-ph]. https://doi.org/10.1046/j.1365-8711.2002.05335.x
- (111) Naab, T., Jesseit, R., Burkert, A.: The influence of gas on the structure of merger remnants. MNRAS 372(2), 839–852 (2006) arXiv:astro-ph/0605155 [astro-ph]. https://doi.org/10.1111/j.1365-2966.2006.10902.x
- (112) Benítez-Llambay, A., Navarro, J.F., Abadi, M.G., Gottlöber, S., Yepes, G., Hoffman, Y., Steinmetz, M.: Dwarf Galaxies and the Cosmic Web. ApJ 763(2), 41 (2013) arXiv:1211.0536 [astro-ph.CO]. https://doi.org/10.1088/2041-8205/763/2/L41
- (113) Lotz, J.M., Primack, J., Madau, P.: A New Nonparametric Approach to Galaxy Morphological Classification. AJ 128(1), 163–182 (2004) arXiv:astro-ph/0311352 [astro-ph]. https://doi.org/10.1086/421849
- (114) Abraham, R.G., van den Bergh, S., Nair, P.: A New Approach to Galaxy Morphology. I. Analysis of the Sloan Digital Sky Survey Early Data Release. ApJ 588(1), 218–229 (2003) arXiv:astro-ph/0301239 [astro-ph]. https://doi.org/10.1086/373919
- (115) Conselice, C.J., Bershady, M.A., Dickinson, M., Papovich, C.: A Direct Measurement of Major Galaxy Mergers at z3. AJ 126(3), 1183–1207 (2003) arXiv:astro-ph/0306106 [astro-ph]. https://doi.org/10.1086/377318
- (116) Treu, T., Calabrò, A., Castellano, M., Leethochawalit, N., Merlin, E., Fontana, A., Yang, L., Morishita, T., Trenti, M., Dressler, A., Mason, C., Paris, D., Pentericci, L., Roberts-Borsani, G., Vulcani, B., Boyett, K., Bradac, M., Glazebrook, K., Jones, T., Marchesini, D., Mascia, S., Nanayakkara, T., Santini, P., Strait, V., Vanzella, E., Wang, X.: Early Results From GLASS-JWST. XII. The Morphology of Galaxies at the Epoch of Reionization. ApJ 942(2), 28 (2023) arXiv:2207.13527 [astro-ph.GA]. https://doi.org/10.3847/2041-8213/ac9283
- (117) Calabrò, A., Daddi, E., Fensch, J., Bournaud, F., Cibinel, A., Puglisi, A., Jin, S., Delvecchio, I., D’Eugenio, C.: Merger induced clump formation in distant infrared luminous starburst galaxies. A&A 632, 98 (2019) arXiv:1910.01661 [astro-ph.GA]. https://doi.org/10.1051/0004-6361/201935778
- (118) Ren, K., Trenti, M., Mason, C.A.: The Brightest Galaxies at Cosmic Dawn from Scatter in the Galaxy Luminosity versus Halo Mass Relation. ApJ 878(2), 114 (2019) arXiv:1905.04848 [astro-ph.GA]. https://doi.org/10.3847/1538-4357/ab2117
- (119) Trenti, M., Stiavelli, M.: Cosmic Variance and Its Effect on the Luminosity Function Determination in Deep High-z Surveys. ApJ 676(2), 767–780 (2008) arXiv:0712.0398 [astro-ph]. https://doi.org/10.1086/528674
- (120) Behroozi, P.S., Silk, J.: A Simple Technique for Predicting High-redshift Galaxy Evolution. ApJ 799(1), 32 (2015) arXiv:1404.5299 [astro-ph.GA]. https://doi.org/10.1088/0004-637X/799/1/32
- (121) Marinacci, F., Vogelsberger, M., Pakmor, R., Torrey, P., Springel, V., Hernquist, L., Nelson, D., Weinberger, R., Pillepich, A., Naiman, J., Genel, S.: First results from the IllustrisTNG simulations: radio haloes and magnetic fields. MNRAS 480, 5113–5139 (2018) arXiv:1707.03396. https://doi.org/10.1093/mnras/sty2206
- (122) Pillepich, A., Nelson, D., Hernquist, L., Springel, V., Pakmor, R., Torrey, P., Weinberger, R., Genel, S., Naiman, J.P., Marinacci, F., Vogelsberger, M.: First results from the IllustrisTNG simulations: the stellar mass content of groups and clusters of galaxies. MNRAS 475, 648–675 (2018) arXiv:1707.03406. https://doi.org/10.1093/mnras/stx3112
- (123) Naiman, J.P., Pillepich, A., Springel, V., Ramirez-Ruiz, E., Torrey, P., Vogelsberger, M., Pakmor, R., Nelson, D., Marinacci, F., Hernquist, L., Weinberger, R., Genel, S.: First results from the IllustrisTNG simulations: a tale of two elements - chemical evolution of magnesium and europium. MNRAS 477, 1206–1224 (2018) arXiv:1707.03401. https://doi.org/10.1093/mnras/sty618
- (124) Springel, V., Pakmor, R., Pillepich, A., Weinberger, R., Nelson, D., Hernquist, L., Vogelsberger, M., Genel, S., Torrey, P., Marinacci, F., Naiman, J.: First results from the IllustrisTNG simulations: matter and galaxy clustering. MNRAS 475, 676–698 (2018) arXiv:1707.03397. https://doi.org/10.1093/mnras/stx3304
- (125) Nelson, D., Pillepich, A., Springel, V., Weinberger, R., Hernquist, L., Pakmor, R., Genel, S., Torrey, P., Vogelsberger, M., Kauffmann, G., Marinacci, F., Naiman, J.: First results from the IllustrisTNG simulations: the galaxy colour bimodality. MNRAS 475, 624–647 (2018) arXiv:1707.03395. https://doi.org/10.1093/mnras/stx3040