2GRANTECAN, Cuesta de San José s/n, E-38712, Breña Baja, La Palma, Spain
3Instituto de Astrofísica de Canarias, Vía Láctea s/n, E-38200 La Laguna, Tenerife, Spain
4Observatorio Astronómico Nacional (OAN-IGN)-Observatorio de Madrid, Alfonso XII, 3, 28014 Madrid, Spain
5Department of Physics & Astronomy, The Hicks Building, University of Sheffield, Sheffield S3 7RH, UK
6National Radio Astronomy Observatory, 520 Edgemont Road, Charlottesville, VA 22903, USA
7Centro de Astrobiología (CAB), CSIC-INTA, Camino Bajo del Castillo s/n, 28692 Villanueva de la Cañada, Madrid, Spain
8Departamento de Física de la Tierra y Astrofísica, Fac. de CC Físicas, Universidad Complutense de Madrid, 28040 Madrid, Spain
9 Instituto de Física de Partículas y del Cosmos IPARCOS, Fac. CC Físicas, Universidad Complutense de Madrid, 28040 Madrid, Spain
11email: villarmm@cab.inta-csic.es
Limited impact of jet induced feedback in the multi-phase nuclear interstellar medium of 4C12.50
Abstract
Context. 4C12.50 (IRAS 13451+1232) at 0.122 is an ultraluminous infared radio galaxy that has often been proposed as a prime candidate for the link between ultraluminous infared galaxies and young radio galaxies. It is also an interesting target to investigate whether and how radio induced feedback may affect the evolution of galaxies in the early phases of radio activity.
Aims. We study in detail for the first time the hot (1500 K) molecular gas in 4C12.50. The potential impact of the radio jet on this gas phase, as well as on the star formation activity, are investigated. We also study the ionized (including coronal) gas as traced by the near-infrared lines.
Methods. Using near-infrared long slit spectroscopy obtained with EMIR on GTC and Xshooter on VLT, we analyse the emission line spectrum of the ionized, coronal and, specially, the hot molecular gas in the western nucleus hosting the compact radio jet. Based on high spatial resolution ALMA CO(2-1) data, we also revise the location of 4C12.50 in the Kennicutt-Schmidt diagram in order to investigate whether star formation is suppressed.
Results. 4C12.50 hosts (2.10.4)104 M⊙ of hot molecular gas. An unusually high rotational temperature =3020160 K is inferred. The molecular gas mass obeys a power law temperature distribution, from T 300 K and up to 3000 K. Both results support that shocks (probably induced by the radio jet) contribute to the heating and excitation of the hot molecular gas. A molecular outflow is not detected. The coupling of the outflowing ionized and neutral outflows with the hot molecular gas is poor. Contrary to other studies, we claim that there is no evidence for star formation suppresion in this object.
Conclusions. If radio induced feedback can regulate the star formation activity in galaxies, 4C12.50 is a promising candidate to reveal this phenomenon in action. However, we find no solid evidence for current or past impact of this mechanism on the evolution of this system, neither by clearing out the dusty central cocoon efficiently, nor by suppressing the star formation activity.
Key Words.:
galaxies – quasars – kinematics – outflows1 Introduction
Gigahertz-Peaked Spectrum (GPS) sources are compact and often powerful radio sources. They are estimated to make up around 10% of the bright radio-source population (O’Dea et al. 1998; 2021, Sadler 2016). There are three main hypotheses for their nature, which can vary from source to source. They might be: (1) very young radio galaxies which will evolve into large radio galaxies. (2) compact due to the confinement by interactions with dense gas in their environments; (3) transient or intermittent sources (O’Dea & Saikia 2021).
The GPS sources are entirely contained within the extent of the narrow-line region (NLR, 1 kpc). Because of the similar spatial scales, the feedback effects that result from the interaction between the radio source and the dense circumnuclear interstellar medium (ISM) can be very strong. Thus, they are interesting targets to investigate whether and how radio induced feedback may affect the evolution of galaxies in the early phases of radio activity (O’Dea 1998; Holt et al. 2003, 2011; Morganti et al. 2013; Santoro et al. 2020).
4C12.50 (IRAS 13451+1232) at 0.122 (luminosity distance =573 Mpc) is one of the closest and best known GPS sources (1033 W Hz-1; O’Dea 1998; Holt et al. 2003). Radio emission stretching outside the host galaxy provides evidence of a previous radio outburst, that occured yr ago (Stanghellini et al. 2005). The jet may have restarted only recently (105 yr) after a long period of inactivity or be a central component in a continuous supply of energy from the core to the extended lobes (Lister et al. 2003; O’Dea et al. 2000; Stanghellini et al. 2005; Morganti et al. 2013). Jet frustration appears to be working at some level, but the amount of mass seems to be insufficient to confine the jet completely (Morganti et al. 2004, 2013).
4C12.50 has often been suggested to be a prime candidate for the link between ultraluminous infrared galaxies (ULIRGs) and young radio galaxies (Gilmore & Shaw 1986, Morganti et al. 2003; 2013). It is a ULIRG with =log(/L⊙)=12.31 and a star forming rate SFR100 M⊙ yr-1 (Mirabel et al. 1989; Rupke et al. 2005a; Perna et al. 2021; Pereira-Santaella et al. 2021). 4C12.50 is hosted by an elliptical galaxy with two optical nuclei separated by 1.8 or 4.0 kpc. Additional morphological signs reveal a major merger event which is in the later stages involving at least one gas-rich galaxy (e.g. Heckman et al. 1986; Emonts et al. 2016). The western, primary nucleus is active and hosts the compact jet. This has a small size (220 pc) and twin-jet morphology. (Grandi 1977; Gilmore & Shaw 1986; Veilleux et al. 1997). The high [OIII]5007 luminosity 2.01042 erg s-1 (Tadhunter et al. 2011) is in the quasar regime (Zakamska et al. 2003). Therefore, 4C12.50 is a radio-loud type 2 quasar (QSO2).
4C12.50 is very rich in dust and molecular gas with a mass of cold (25 K) molecular gas 1010 M⊙ (Dasyra & Combes 2012), in the range of other ULIRGs (Mirabel 1989; Evans et al. 1999; Solomon & Vanden Bout 2005). It is the most molecular gas-rich radio galaxy known in the nearby Universe (e.g. Ocaña Flaquer et al. 2010; Smolčić & Riechers 2011). Most of this gas is highly concentrated within few kpc of the western active nucleus, including a small, 4 kpc wide disk (Fotopoulou et al. 2019).
This primary nucleus hosts fast outflows (up to 2000 km s-1) which have been detected in emission in the ionized phase and in absorption in the cold HI circumnuclear gas (e.g.Holt et al. 2003, 2011; Spoon & Holt 2009a, Morganti et al. 2005; Rose et al. 2018; see also Rupke et al. 2005a). The ionized and the neutral HI outflows in 4C12.50 are driven by the radio plasma. The compact jet seems to be fighting its way out and emerging from the dense cocoon of gas and dust in the western nucleus, clearing it out via these kinematically extreme outflows (Morganti et al. 2003; 2013).
It is of great interest to investigate the potential impact of this feedback mechanism in the molecular phase, since this is the fuel used by galaxies to form stars. The evidence for a cold molecular outflow in 4C12.50 is controversial. Blueshifted CO(3-2) absorption (shift relative to the systemic velocity -950 km s-1) and tentative CO(1-0) absorption (-1100 km s-1) (Dasyra & Combes 2012) have been reported at similar velocity as the neutral outflow. On the other hand, posterior studies (some making use of the Atacama Large Millimeter Array, ALMA) could not corroborate this outflow, neither in absorption or emission using different CO lines (Dasyra et al. 2014; Fotopoulou et al. 2019; Lamperti et al. 2022). The detection of outflow signatures in the warm (400 K) molecular gas is also controversial. The high velocity blueshifted mid-infrared (MIR) H2 emission detected by Dasyra & Combes (2011), could not be confirmed by Guillard et al. (2012).
The outflow imprint is yet to be searched for in the hot (1500 K) molecular phase. In fact, this gas, which emits the strongest lines in the near-infrared (NIR), has been barely studied in 4C12.50 (Veilleux et al. 1997; Rose et al. 2018). Our goal is to fill this gap in the knowledge of this otherwise widely studied system. We investigate the general hot H2 properties (mass, temperature, reddening, excitation mechanisms) and whether the outflow has affected it. Moreover, we present new results on the ionized phase, including the high ionization coronal gas. All the results are discussed in the context of prior studies of 4C12.50. This work is based on Gran Telescopio Canaria (GTC) K-band and Very Large Telescope (VLT) J, H, K bands long slit spectroscopy of the primary western active nucleus. It is also based on ALMA 12-m array CO(2–1) and 220 GHz continuum observations described in Lamperti et al. (2022) (program 2018.1.00699.S; PI: M. Pereira-Santaella). See also Pereira-Santaella et al. 2021).
The paper is organized as follows. We describe the observations and data in §2. The spectral fitting techniques are explained in §3. The results of the study of the ionized (including coronal) and the molecular gas components in 4C12.50 are presented in §4 and discussed in §5. The summary and conclusions are in §6.
We adopt =69.7 km s-1 Mpc-1, =0.7185 and =0.2877. This gives an arcsec to kpc conversion of 2.20 kpc arcsec-1 at z=0.122.
2 Observations
We obtained K-band spectroscopy of 4C12.50 (RA(2000) 13:47:33.35 and DEC(2000) 12:17:24.2) with the Spanish 10.4m GTC telescope and the EMIR (Espectrógrafo Multiobjeto Infra-Rojo) instrument in long-slit mode (program GTC16-21B). EMIR is a near-infrared wide-field imager and medium-resolution multi-object spectrograph installed at the Naysmith-A focal station. It is equipped with a 20482048 Teledyne HAWAII-2 HgCdTe near-infrared optimised chip with a pixel size of 0.2. The K grism covers a spectral range of 2.03-2.37 m with a dispersion of 1.71 Å pixel-1.
In order to find a compromise between spectral resolution and flux coverage, the slit width used during the observations was 0.8, adapted to the K-band seeing size (FWHM0.8). The instrumental profile measured from the arc lines is FWHMIP=6.320.44 Å (85.76 km s-1 at 2.2 m).
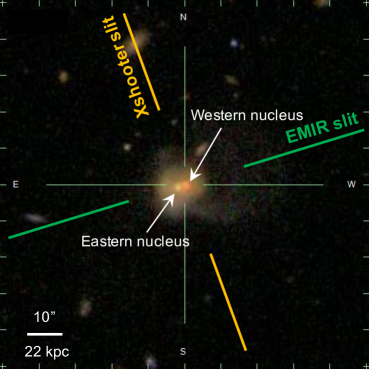
The slit position angle PA 104 N to E was chosen to align the slit with the two nuclei (Fig. 1). The only line detected from the secondary, Eastern nucleus is Pa, which is 90 times fainter than that from the primary nucleus. For this reason, we will focus our study on the primary nucleus.
Eight spectra were obtained in 4 different nights (Feb 12th, April 8th, 9th, and 12th of 2022). The total exposure time on source was 83360 sec = 26880 sec or 7.5 hours. A typical ABBA nodding pattern was applied.

The spectra were reduced using several Python routines customised by GTC staff for EMIR spectroscopic data. The sky background was first subtracted using consecutive A-B pairs. They were subsequently flat-fielded, calibrated in wavelength, and combined to obtain the final spectrum. To correct for telluric absorption, we observed a telluric standard star (HR 5238) with the same observing set-up as the science target, immediately after the 4C12.50 observations and at similar airmass. To apply the correction we used a version of Xtellcor (Vacca 2003) specifically modified to account for the atmospheric conditions of Roque de los Muchachos observatory in La Palma (Ramos Almeida et al. 2009). Flux calibration was applied using the spectrum of the standard star obtained with a wide 5 slit.
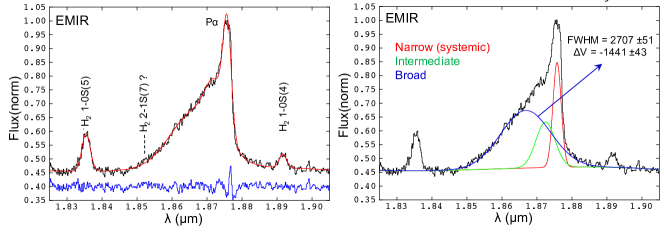
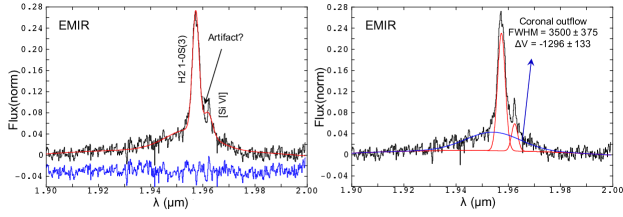
The K-band EMIR spectrum is shown in Fig. 2 (left). A 0.81.4 aperture centered at the continuum centroid of the western nucleus was chosen. This optimizes the extraction of the maximum line fluxes and the signal to noise for several important faint lines so that the kinematic parameters can be constrained more accurately. The strange continuum bump marked with a red arrow in Fig. 2 is an artifact. It suggests a problem with the relative flux calibration in that region of the spectrum. At bluer the continuum shape is very similar in the eight spectra and the accuracy of the absolute flux calibration is estimated 10%. The shape varies more towards the red. The comparison of the line fluxes in the individual spectra suggests an additional 15 uncertainty on the flux calibration in that spectral window (H2 1-0 S(2) and redder). This will not affect our conclusions. Moreover, we will also have the Xshooter NIR spectrum for comparison.
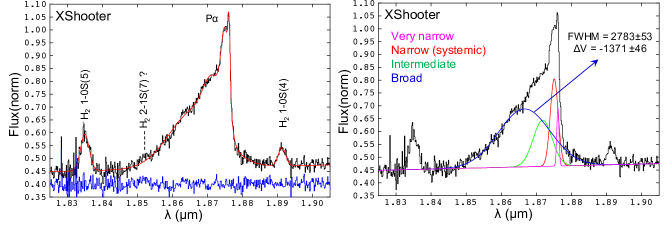
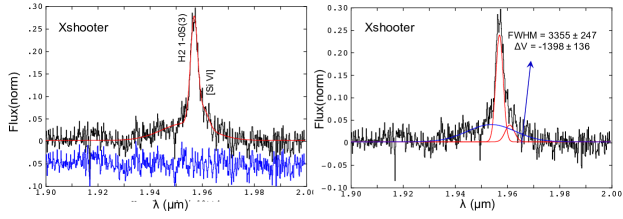
The Xshooter spectrum was described and shown in Rose et al. (2018). It covers the J+H+K spectral range so that very valuable information can be obtained from additional emission lines (the K band range is shown in Fig. 2, right). The spectral resolution values for the 1.2 slit were 69.21.3, 70.10.9 and 72.31.3 km s-1 for the J, H and K bands respectively. The slit was placed at PA 20, the paralactic angle during the observations (Fig. 1). The pixel scale for the NIR arm is 0.2. The spectrum was extracted from a 1.24.0 aperture, also centered at the western nucleus continuum centroid. The seeing was in the range 0.88-0.95 ( band). The authors reported a 8% relative flux calibration accuracy.
The Xshooter data has the advantage of covering a much wider spectral range, including very valuable molecular lines in the J band, as well as 1-0 S(1) (which lies on the edge of the EMIR spectrum). The advantage of the EMIR spectrum is its higher S/N. The r.m.s values in different continuum windows are in the range (1.3-2.6)10-18 erg s-1 cm-2 Å-1, 1.7-3.5 times lower than for the Xshooter data in the same regions. This spectrum is also more severely affected in some spectral windows by artifacts, including a glitch in the 2.272-2.283 m range (see Rose et al. (2018) for a detailed explanation). Both spectra are therefore valuable.
Galactic extinction is very low (=0.01) and no correction was applied for this effect.
In spite of the different aperture sizes, we measure almost identical Pafluxes in the EMIR (=(1.60.2) erg s-1 cm-2) and the Xshooter spectra (1.50.1) erg s-1 cm-2). The same can be said about most (if not all) K-band emission lines (see next section). This suggests that the Paand other line emission is very compact and strongly concentrated in the primary nucleus and there is little contamination by more extended gas in both apertures.
3 Analysis
| EMIR | Xshooter | |||||||
| Line | Flux 10-16 | FWHM | Flux 10-16 | FWHM | ||||
| (m) | ergs cm-2 s-1 | km s-1 | km s-1 | ergs cm-2 s-1 | km s-1 | km s-1 | ||
| Pa(vn) | 1.8756 | 4.30.6 | 10112 | +1679 | ||||
| (n) | 1.8756 | 29.51.1 | 4389 | 0 | 22.82.9 | 41918 | 0 | |
| (i) | 29.42.4 | 102345 | -53224 | 28.92.8 | 102962 | -52835 | ||
| (b) | 98.23.5 | 270751 | -144143 | 99.04.5 | 278353 | -137146 | ||
| Pa | 1.2822 | out | out | out | 52.74.7 | ns | ns | |
| Br | 2.1661 | out | out | out | 12.52.5 | ns | ns | |
| EMIR | Xshooter | |||||
| Line | Flux 10-16 | FWHM | Flux 10-16 | FWHM | ||
| (m) | ergs cm-2 s-1 | km s-1 | ergs cm-2 s-1 | km s-1 | ||
| H2 2-0 S(1) | 1.1622 | out | out | 2.200.21 | 45535 | |
| H2 1-0 S(7) | 1.7480 | out | out | 5.100.37 | 46123 | |
| H2 1-0 S(5) | 1.8358 | 11.40.40 | 4718 | 12.500.60 | 46515 | |
| H2 1-0 S(4) | 1.8920 | 3.650.18 | 42417 | 4.310.15 | 38914 | |
| H2 1-0 S(3) | 1.9576 | 20.10.3 | 41812 | 16.70.4 | 42421 | |
| H2 1-0 S(2) | 2.0338 | 6.030.24 | 4539 | 5.510.84 | 45766 (ns) | |
| H2 1-0 S(1) | 2.1218 | 20.01.9 | 44626 | 21.301.10 | 4359 | |
.
Relevant H and H2 lines detected in the NIR spectrum of 4C12.50 are listed in Tables 1 and 2. Except for Paand the blend of Br, H2 (1-0) S(3) and [SiVI]1.9630 (see below), each line flux was measured by integrating the area underneath its spectral profile and above the continuum level. The FWHM were obtained from single Gaussian fits. The splot task in iraf was used. A single Gaussian provides acceptable fits in general, even when slight asymmetries are hinted.
For complex line profiles and blends (see below), we applied multiple-Gaussian fits using the Starlink package dipso. We used the minimum number of components required to produce an adequate fit, without leaving significant features in the residuals. dipso is based on the optimization of fit coefficients, in the sense of minimizing the sum of the squares of the deviations of the fit from the spectrum data. The output from a complete fit consists of the optimized parameters (FWHM, central , peak and integrated fluxes) and their errors (calculated in the linear approximation, from the error matrix).
All FWHM values were corrected for instrumental broadening by subtracting the instrumental profile in quadrature.
3.1 Pa
Pashows a very prominent blue broad wing (Fig. 3). Three kinematic components are identified in the multi-Gaussian fit of the EMIR spectrum with FWHM and velocity shifts relative to the narrow component shown in Table 1. The results obtained with the Xshooter spectrum are in good agreement (Table 1). The only difference is that an additional very narrow component (FWHM=10112 km s-1 and redshifted by +1679 km s-1) is isolated in these data set. This can be due to the higher spectral resolution or the different position angle and width of the Xshooter slit picking up an additional narrow component. It only contributes 2% of the total line flux.
Holt et al. (2003, see also Holt et al. 2011; Rodríguez Zaurín et al. 2013; Rose et al. 2018) found relatively similar complex kinematics for the strongest optical emission lines from the western nucleus, including forbidden transitions such as [NeV]3426, [OIII]4959,5007, [OI]6300 and [SII]6716,6731 ([NeV], [OIII], [OI] and [SII] hereafter). The three components isolated in the [OIII] doublet have FWHM=34023 (narrow), 125512 (intermediate) and 194465 km s-1 (broad), with these last two shifted by -4029 and -198036 km s-1 relative to the narrow, systemic component. Rose et al. (2018) identified an additional, even more extreme component in the [OIII] lines using the Xshooter spectrum mentioned here. It has FWHM=3100200 km s-1 and =-33160 km s-1. This 4th component is not apparent in the Pafit of either the EMIR or the Xshooter spectra and thus we will not consider this option.
The Panarrow component has =0.121750.00008. This is consistent with the of the narrow [OIII]5007 (=0.121740.00002). According to Holt et al. (2003), this component is at the systemic implied by the stars. It is also consistent within the errors with the CO(2-1) redshift = 0.1216800.00004 (Lamperti et al. 2022). In what follows, we will also assume that the narrow Pacomponent is at .
3.2 The Br+H2 S(3)+[SiVI] blend
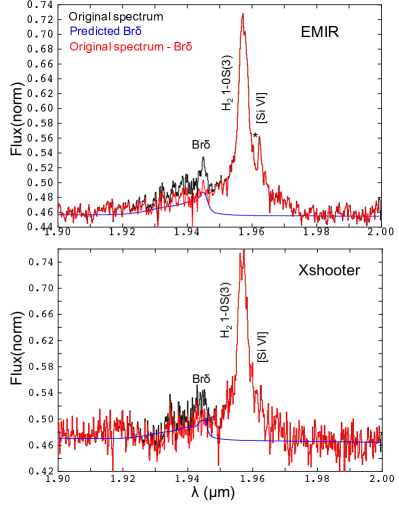
A broad pedestal is apparent underneath Br (1.9451m), H2 (1-0) S(3) and [SiVI]1.9630 (Fig. 4). Our aim is to discern its nature, since it reveals very high velocity gas that may trace a coronal and/or molecular outflow. It is also necessary to constrain the flux of the S(3) line.
Due to the complex blend of lines, it is not possible to apply a multiple Gaussian fit avoiding degeneracies. We have applied a different method consisting of creating an artificial Br that we subtracted from the original data, as explained below. We then fitted the residual spectrum, which should retain the contribution of S(3) and [SiVI]. This method was applied to both the EMIR and the Xshooter spectra.
To create the expected artificial Br profile for a given spectrum, we assumed the same spectral shape as Pa. The differential reddening of the three kinematic components (Holt et al. 2003, 2011) does not affect the line profile significantly. For 0.11 (as derived by H/H, Pa/H and Pa/H, Rose et al. 2018), the expected flux ratio Pa/Br18.1 is very close to the case B value, 18.29 (Osterbrock & Ferland 2006). Thus, we used the fitted Paprofile (see previous section), shifted it to the Br wavelength and divided its flux by 18.1. The expected Br contribution is shown in Fig. 4, together with the continuum fitted by interpolating between the blue and red sides of the line blend. The results of subtracting Br from the original spectra are. A broad pedestal is still obvious in both cases.
| Line | Flux | FWHM | ||
|---|---|---|---|---|
| m | 10-16 erg s-1 cm-2 | km s-1 | km s-1 | |
| EMIR | ||||
| H2 S(3) | 1.8756 | 21.10.3 | 48735 | -429 |
| [SiVI] | 1.9630 | 5.070.88 | 510122 | -12044 |
| Pedestal | 1.9630 | 24.22.2 | 3500375 | -1296133 |
| Xshooter | ||||
| H2 S(3) | 1.8756 | 19.81.8 | 49843 | -9021 |
| [SiVI] | 1.9630 | 3.961.64 | 637203 | -313133 |
| Pedestal | 1.9630 | 21.21.8 | 3355247 | -1398136 |
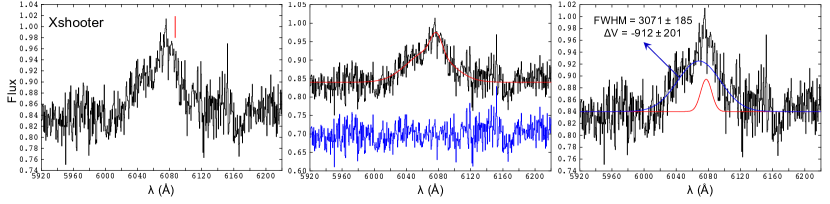
| [FeVII] (n) | 0.6087 | 1.280.28 | 828121 | -366143 |
| (br) | 0.6087 | 7.060.51 | 3071185 | -912201 |
We then fitted this new spectrum with the smallest number of components (three) that provides a reasonable fit to the residual blend. The results are shown in Table 3 and Fig. 6. The two narrower components correspond to H2 S(3) and the core of [SiVI].
The pedestal is consistent with a very broad component with FWHM=3500375 km s-1 for the EMIR spectrum (values for Xshooter will be given in brackets: 3355247 km s-1). One possibility is that it is dominated by a molecular outflow, blueshifted by -42583 (-478136) km s-1 relative to the narrow S(3) component. The fact that it is not detected in other molecular lines is not in contradiction. If its contribution relative to the narrow component was similar in all H2 lines (/1.15 (1.07), as in S(3)), the expected fluxes would be below or just close to the 3 detection limits in all cases.
While we cannot unambiguously rule out a broad H2 S(3) component, the very turbulent kinematics of the ionized gas (Pa, [OIII], etc) suggests that the broad pedestal may be dominated by a coronal [SiVI] outflow. An intermediate situation, with contribution from both broad S(3) and [SiVI] or even contamination by [Si XI]1.9359 on the blue side of the blend could also be possible. Overall, this just reflects the difficulty to deblend the Br+H2 S(3)+[SiVI] lines.
In spite of this, several arguments support that the pedestal is due to a coronal outflow. In this case, the line would consist of two components, both blueshifted relative to (Table 3). The blueshift of both components may indicate that the whole [SiVI] emitting gas (and not only the broad component) is outflowing, although asymmetries in the spatial and/or velocity distributions of the systemic coronal gas cannot be discarded. The broad component (the pedestal) has a blueshift of =-1296133 km s-1 (EMIR) or -1398136 km s-1 (Xshooter) and it contributes 8311% of the total [SiVI] flux. This interpretation is supported by the similar kinematics of the coronal [FeVII]6087 line (Fig. 6, Table 3). The profile is very broad and asymmetric and clearly blueshifted relative to . Two components are isolated, both broad and blueshifted. The broadest has FWHM=3071185 km s-1 and =-912201 km s-1 . It contributes 859% of the total line flux. Thus, [FeVII]6087, as [SiVI], is dominated by outflowing gas of rather extreme kinematics. Finally, Spoon et al. 2009b found also very turbulent kinematics for the MIR coronal [NeV]14.32 m (FWHM=2300190 and =-112089 km s-1). Higher S/N and higher spectral resolution would probably reveal a kinematic substructure consistent with [FeVII] and [SiVI].
In this scenario, the ratio of the total line fluxes is Pa/[SiVI]5.4. Similar values have been observed in other type 2 quasars (QSO2) and Seyfert 2 (e.g. Riffel et al. 2006; Ramos Almeida et al. 2009, 2019). This ratio would be anomalously high (31) if the pedestal had no [SiVI] contribution. The luminosity of [SiVI], =(1.150.07) erg s-1, is amongst the highest measured in active galaxies (Rodríguez-Ardila et al. 2011; Lamperti et al. 2017; Riffel et al. 2006; Cerqueira-Campos et al. 2021; den Brok et al. 2022). This is not surprising since most published [SiVI] measurements correspond to less luminous AGN (Seyfert galaxies), while 4C12.50 is a QSO2 (Sect. 1). SDSS J0945+1737, another QSO2 at 0.128, has a similarly high 1.3 erg s-1 (Speranza et al. 2022). Lamperti et al. (2017) found a weak correlation between the [OIII] and [SiVI] fluxes (in log) for a sample of nearby (0.075) AGN (see Fig. 8 in that paper). 4C12.50 is well within the scatter of this relation.
We therefore propose that the H2 S(3) emission is traced by the narrow S(3) above the pedestal, while this (possibly the whole [SiVI] flux) is dominated by a coronal outflow.
4 Results
4.1 The warm ionized and coronal gas
The extreme Pa kinematics are roughly consistent with those seen in the optical lines, including the forbidden ones (Sect. 3.1). This implies that the broad Pa(FWHM2750 km s-1 and =-140043 km s-1 (see Table 2) is not emitted by the broad line region (see also Rupke et al. 2005a). It is instead emitted by the kinematically extreme ionized compact outflow, whose radial size 69 pc was measured by Tadhunter et al. (2018) based on HST narrow band emission line images. The broadest component contributes 633% of the total Paflux. Considering the intermediate component also as part of the outflow as those authors, this value raises to 814%.
Holt et al. (2011) inferred a very high density for the broad component. Using the transauroral emission lines [S II]4068,4076 and [O II]7318,7319,7330,7331 they obtain cm-3, compared with , cm-3 for the narrow and the intermediate components respectively (see also Rose et al. 2018). With these values, and using the reddening corrected Paluminosities we calculate the mass of each kinematic component as:
| (1) |
where is the the H luminosity, inferred from the reddening corrected and assuming case B =0.332 (Osterbrock & Ferland 2006), mp is the mass of the proton, =3.0310-14 cm-3 s-1 is effective Case B recombination coefficient of H for 10,000 K and 104 cm-3 (Osterbrock & Ferland 2006), is Planck’s constant, is the frequency of H, and is the electron density. The total mass is 9.0105 M⊙, of which 6% corresponds to the broadest component and 28% to the total outflowing gas (broad+intermediate components).
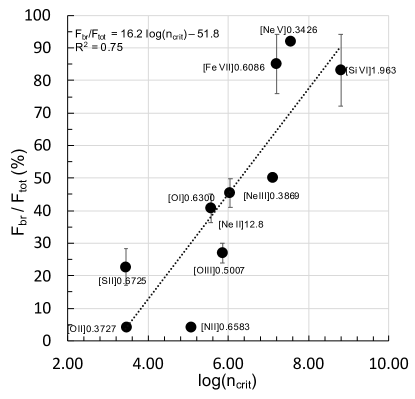
We plot in Fig. 7 the observed relative contribution of the broadest component to the total line fluxes against the critical density for all the forbidden lines with this information available. Although with a large scatter, a correlation is clear111The correlation is weaker with ionization potential. It is not shown for simplicity.. The emission from the most turbulent gas is much stronger (dominant) in lines with high such as the coronal lines than in low lines, specially those with lower than the outflow density (e.g. [OII]3727 with =1300 and 4500 cm-3 for the two doublet components and [SII]6716,6731, =1500 and 4000 cm-3). This is consistent with the frequent finding that AGN outflows have a more prominent signature in coronal features compared with other lines from both the ionized and specially the molecular phases (De Robertis & Osterbrock 1984; Rodríguez-Ardila et al. 2002; Álvarez-Márquez et al. 2023).
A similar correlation was found in MRK477, the nearest QSO2 at 0.035 by Villar Martín et al. (2015). The NLR density is expected to decrease with distance from the AGN (e.g. Bennert et al. 2006; see also De Robertis & Osterbrock 1984). The authors proposed that the outflow in MRK477 has been triggered at 220 pc, possibly at 30 pc, from the AGN (also by the radio jet) and the correlation shows how its emission weakens as it propagates outwards from the inner denser coronal region (e.g. Müller Sánchez et al. 2006; Rose et al. 2011) outwards in the NLR, following the decreasing density gradient. We propose a similar scenario for 4C12.50.
This also suggests that a single mechanism (the radio jet in this case) is responsible for the outflow identified in all emission lines emitted by the ionized phase, from the coronal to the lowest ionization species. This is also supported by the similar, unusually high values of (a frequent definition of the maximum outflow velocity, computed for the most blueshifted component; Rupke et al. 2005b) for most lines (Table 4).
| Line | ||
|---|---|---|
| km s-1 | ||
| Pa | 276353a | |
| [SII]6716,6731 | 2803242b | |
| [NeII]12.8 | 1831137c | |
| [OIII]5007 | 295248b | |
| [OI]6300 | 243180b | |
| [FeVII]6087 | 2496221a | |
| [SiVI]1.9623 | 3076184a | cr |
The narrow Pacomponent is at the systemic redshift (Sect. 3.1). The prominent blue excess and the almost total lack of redshifted emission (Fig. 3) could be due to an asymmetric spatial distribution of the outflowing gas. This is expected in 4C12.50, since the interaction between the radio source and the ambient gas at both sides of the AGN is indeed very asymmetric (Morganti et al. 2004).
Another possibility is that the receding side of the outflow is almost completely extinguished by dust. Let us consider the broadest, most turbulent component. If the gas moving away on the far side of the nucleus has the same kinematics and emits the same intrinsic Paflux as the approaching side (2.110-14 erg s-1 cm-2, corrected for reddening with =1.44 mag, Holt et al. 2003), the comparison with the 3 upper limit 9.410-16 erg s-1 cm-2, implies 5.8 or 23.5 mag. Assuming the same gas-to-extinction ratio as in our Galaxy (Zhu et al. 2017), this corresponds to a column density of HI, 2.0810 cm4.91022 cm-3, which is consistent with measurements in the central region (200 pc) of 4C12.50 (Morganti et al. 2013).
Therefore, it is possible that the receding ioinized outflow is completely extinguished. This would not be surprising, given the dusty circumnuclear environment of this and other ULIRGs and the presence of a circumnuclear torus related to the AGN. The outflow, therefore, could be trully kinematically extreme in this case, with FWHM2FWHM5400 km s-1 (7000 km s-1 for the coronal gas, Table 3), only comparable to those seen in a handful of high extremely luminous quasars (Perrotta et al. 2019; Villar Martín et al. 2020). The outflow mass, 2.5105 M⊙ (broad and intermediate Pacomponents, see above), the mass outflow rate, and the kinetic power would still be moderate. These are calculated as (e.g. Rose et al. 2018):
| (2) |
| (3) |
where is the average velocity of the outflowing gas and is the outflow radius. We assume = (Rupke et al. 2005b). For a Gaussian of a given FWHM centered at , =FWHM/2. In the current scenario, 2783 km s-1 and1029 km s-1 for the broadest and intermediate components respectively (Table 1). Assuming =69 pc (Tadhunter et al. 2018), then 3.3 M⊙ yr-1 and 1.11043 erg s-1 for the broad component; 4.4 M⊙ yr-1 and 2.01042 erg s-1 for the intermediate component. In total, 7.7 M⊙ yr-1 (SFR100 M⊙ yr-1, Rupke et al. 2005a) and 1.31043 erg s-1, which is 0.14% of the bolometric luminosity 91045 ergs. The values are still moderate (see also Holt et al. 2011; Rose et al. 2018). Given, in addition, the small size (much smaller than the effective radius of the western bulge component, 2.590.58 kpc, Dasyra et al. 2006) and volume apparently affected by the ionized outflow, it is not clear whether it will affect the evolution of the host galaxy.
4.2 The hot molecular gas
4.2.1 Rotational temperature,
We have calculated the H2 rotational excitation temperature, , using the extinction corrected fluxes and upper limits of the NIR H2 lines and following Pereira-Santaella et al. (2014). The molecular lines are not necessarily affected by the same extinction as the ionized gas emission. To estimate , we have used , which has a theoretical value of 0.83. Both lines are detected in the Xshooter spectrum. Because they are faint and noisy, different aperture sizes were attempted to maximize the S/N. We infer a value of 0.580.05. This implies =0.350.08, which is not significantly different in comparison with the ionized gas total extinction E(B-V)=0.590.11 (Holt et al. 2003; Rose et al. 2018).
We show in Fig. 8 the result of modelling the relative population levels of the NIR H2 lines using single excitation-temperature LTE models (see Pereira-Santaella et al. 2014). We infer 3020160 K. This is quite high in comparison with typical values in nearby AGN and ULIRGs. As an example, Riffel et al. (2021) obtained in the range 760-2075 K in a sample of 36 nearby Sy1 and Sy2 (0.0010.056) selected among the hard X-ray (14–195 keV) sources in the Swift Burst Alert Telescope (BAT) survey (Oh et al. 2018). The ULIRGs analysed by Davies et al. (2003), which also host very large (see next section), have maximum temperatures of 2400 K. In general, 2500 K in galaxies, including U/LIRGs and AGN, (Murphy et al. (2001); Davies et al. (2003); Rodríguez-Ardila et al. (2004, 2005); Ramos Almeida et al. (2009); Mazzalay et al. (2013); Pereira-Santaella et al. (2014). Such high temperature is not found either in hot molecular outflows (1900-2300 K), although there is only a handful of objects where it has been possible to isolate the NIR H2 outflow emission (Emonts et al. 2014; Tadhunter et al. 2014; Ramos Almeida et al. 2019).

The NIR H2 lines extend the gradient found by Guillard et al. (2012) in 4C2.50 to higher temperatures. They fitted three components using the MIR H2 lines with 100, 275 and 1500 K respectively. A temperature gradient, described with a power law, exists in the molecular gas of numerous galaxies (Davies et al. 2003; Ogle et al. 2010; Guillard et al. 2012; Pereira-Santaella et al. 2014; Togi & Smith 2016).
4.2.2 Mass
The mass of hot molecular gas can be estimated from the extinction corrected S(1) flux, , under the assumptions of local thermal equilibrium and an excitation temperature of 3020160 K (e.g. Scoville et al. 1982; Riffel et al. 2014). We infer =(2.440.41)10-15 erg s-1 cm-2 (we use the Xshooter line flux in this calculation because it is more accurate), assuming EB-V=0.350.08 (see Sect. 4.2.1). If the gas was not thermalized, the mass would be underestimated.
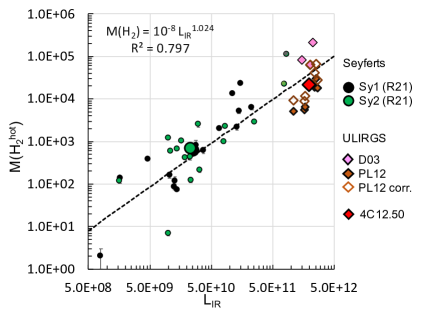
We obtain (2.100.44104 M⊙. We show in Fig. 9 vs. for Riffel et al. 2021 sample of nearby Seyfert 1 and 2 previously mentioned (Sect. 4.2.1). Mass values are also shown for several ULIRGs from Davies et al. (2003) and Piqueras López et al. (2012). of 4C12.50 is at the high end of values found in galaxies, including active galaxies and U/LIRGs (see also Rodríguez-Ardila et al. 2005; Piqueras López et al. 2012; Mazzalay et al. 2013; Mezcua et al. 2015; Riffel et al. 2021). It is similar to other nearby ULIRGs and consistent with the value expected from the observed vs. correlation.
If slit losses were significant, the intrinsic mass would be higher, although this situation is unlikely. The hot molecular gas in luminous AGN is usually mostly concentrated within several100 pc (Mezcua et al. 2015; Riffel et al. 2021). At the of 4C12.50, such physical size is not resolved spatially in our data. Moreover, since the K-band seeing (see Sect. 2), was significantly narrower than the Xshooter 1.2 slit, losses are expected to be low in the direction perpendicular to the slit also.
With log()=12.31 and =(1.250.38)1010 K km s-1 pc2 (Dasyra & Combes 2012), 4C12.50 lies close to the vs. correlation for galaxies and, as other local ULIRGs, it is slightly below it (e.g. Fig. 5 in Cortzen et al. 2019)). Thus, =(1.00.1)1010 M⊙ (Dasyra et al. 2014) is also consistent with that expected for its (see Fig. 1 in Daddi et al. 2010a).
The ratio of hot to cold H2 masses, = (2.100.49)10-6 M⊙, is within the range ([10-7-10-5]) observed across a sample of several dozen star-forming galaxies and AGN by Dale et al. (2005). It is moreover consistent with the value expected from its =0.93 IRAS color (see Fig. 4 in Dale et al. 2005).
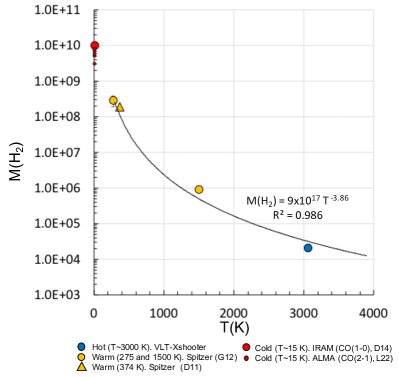
The dependence of with the excitation temperature, , is shown in Fig.10. The mass at 3000 K follows the trend of this and other galaxies, where the bulk of the molecular mass is concentrated at the lowest temperature (Guillard et al. 2012). The mass-temperature function at 300 K is well described in 4C12.50 with a power law: (M⊙) = 910 (coefficient of determination, =0.937) or with 5. Aperture effects do not have a significant impact in this plot. Although the warm masses (Guillard et al. 2012) were obtained with Spitzer IRS data (which provides much larger aperture sizes (3.6 to 11, depending on the line), the gas is expected to be highly concentrated within a spatial region smaller than the physical region covered by the Xshooter aperture (2.68.8 kpc2).
A mass-temperature power law distribution of the molecular gas at T100 K is frequently observed (or assumed) for galaxies independently of the excitation mechanism. Togi & Smith (2016) found that a continuous power-law distribution of rotational temperatures, with , reproduces well the H2 excitation from a wide range of galaxy types using a single parameter, the power-law slope (see also Pereira-Santaella et al. 2014). This model, can recover the mass at 100 K, with in the range 3.79-6.4 and average 4.840.61. gives information on the relative importance of gas heating by shocks, photoelectric heating, UV pumping, etc. According to Neufeld & Yuan (2008) 4-5 is consistent with the predictions of simple models for paraboloidal bow shocks.
For 4C12.50, the high and the 5 power law mass-temperature distribution suggest that shocks play an important role on the excitation of the molecular gas at T300 K.
4.2.3 Excitation mechanism
We have seen that the high and the power law mass-temperature distribution suggest that shocks play an important role on the excitation of the molecular gas at T300 K. We now check whether the influence of shocks is apparent in the diagnostic diagram [Fe II] 1.257m/Pa vs. H2 1-0 S(1)/Br (Larkin et al. 1998; Rodríguez-Ardila et al. 2005; Riffel et al. 2021; see also Colina et al. 2015). [Fe II] 1.257m/Pa=0.730.08 for 4C12.50 is obtained from the Xshooter spectrum.
Br is outside the observed spectral range of the EMIR data and very noisy in the Xshooter spectrum. We measure =(1.250.25)10-15 erg s-1 cm-2 (Table 1) and thus, S(1)/Br=1.700.35. agrees within the errors with the reddened flux predicted from Paassuming E(B-V)=0.590.11 (Holt et al. 2003; Rose et al. 2018): =(1.430.08)10-15 erg s-1 cm-2 and, thus, S(1)/Br=1.490.11.
4C12.50 is in the area of the [Fe II] 1.257m/Pa vs. H2 1-0 S(1)/Br occupied by AGN. According to Riffel et al. (2021), 0.4 H2 S(1)/Br2 for low excitation AGN; 2 S(1)/Br6 for high excitation AGN and S(1)/Br6 for shock dominated regions/objects. Thus, the ratio is typical of high excitation AGN and below values expected for shock dominated regions.
This, however, does not imply that shocks are not present and a more likely scenario is that a combination of excitation mechanisms exists. 4C12.50 is part of the MOHEG (molecular hydrogen emission galaxy) sample of radio galaxies hosting fast ionized and HI jet-driven outflows studied by Guillard et al. (2012). They discarded AGN X-ray heating as the dominant source of excitation of the MIR H2 in these systems, based on the large ratio of the H2 line luminosity (summed over the MIR S(0) to S(3) rotational transitions) to the unabsorbed 2-10 keV nuclear X-ray luminosity (see also Ogle et al. 2010). Instead, shocks are proposed as the main excitation mechanism. Using magnetic shock models, they showed that the dissipation of a small fraction (10%) of the kinetic energy of the radio jet heats the gas to a range of temperatures (Sect. 4.2.1) and is enough to power the observed mid-IR H2 emission.
An important difference between 4C12.50 and most MOHEGs is that it hosts a very luminous AGN (Ogle et al. 2010). Spoon et al. (2009b) and Guillard et al. (2012) show that, while the lower ionization lines in the MIR are consistent with shocks, the high ionization lines (in particular [NeV]), arise primarily from photoionization of the gas by the AGN. The presence of strong coronal lines (Sect. 3.2) indicates that it must contribute to the excitation of at least the ionized gas. This could explain why this system, which is expected to host strong jet-induced shocks affecting the molecular gas (see also previous section), is located in the AGN area of the diagnostic diagram.
4.2.4 Kinematics: a molecular outflow cannot be confirmed
Dasyra & Combes (2011) identified prominent blue wings in two out of the three H2 MIR lines detected in the Spitzer spectrum of 4C12.50, H2 (0-0) S(1) at 17.04 m and S(2) at 12.28 m. The main component, which they consider to trace the systemic velocity, is spectrally unresolved with FWHM550 km s-1. The blue wing is 2.6 times fainter, it is shifted by -640 km s-1 and has an instrumentally-corrected FWHM521 km s-1 (errors unavailable). They propose this is produced by an AGN jet or wind-driven outflow. The outflow mass, 5.2107 M⊙, is a very high fraction, 27%, of the total warm (400 K) H2 mass. Guillard et al. (2012) also studied the MIR H2 lines based on Spitzer data. They could not confirm the outflow and report the tentative detection of a blue wing in H2 (0-0) S(1) only.
We investigate in this section whether the molecular outflow is detected in the NIR H2 lines.
The hot molecular gas has much simpler kinematics than the ionized gas, whose motions are strongly defined by the outflow triggered by the radio source (Sect. 3.1). The NIR H2 line profiles are well reproduced by single Gaussians and have instrumentally-corrected FWHM with median values 44613 and 45510 km s-1 for the EMIR and Xshooter spectra respectively (Table 2). No broad components that may be indicative of an outflow are detected for any line (see below).
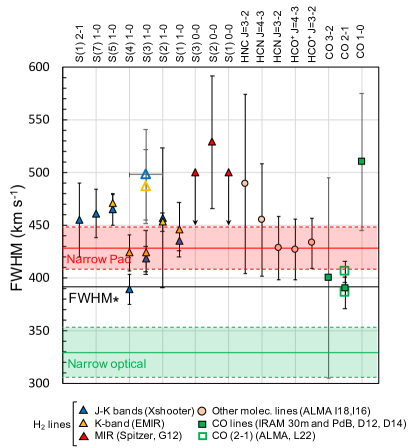
As shown in Fig. 11, the lines emitted by H2 and other molecular species in 4C12.50 have FWHM400 km s-1 (Fig. 11), although some are affected by large uncertainties222H2 0-0 S(0) at 28.22m is surprisingly broad FWHM=90691 km s-1(Guillard et al. 2012). Because this line is in a noisy part of the Spitzer spectrum (see their Fig. 2) and given the inconsistency of its FWHM in comparison with all other molecular lines, we will not consider it.. The CO(1-0) and H2 NIR lines are rather broad compared with different types of galaxies at 0.5, but not extreme if U/LIRGs and active galaxies, including quasars, are considered (Murphy et al. 2001; Rodríguez-Ardila et al. 2004, 2005; Colina et al. 2005; Piqueras López et al. 2012; Riffel et al. 2013; Villar-Martín et al. 2013; Cortzen et al. 2019; Ramos Almeida et al. 2022; Lamperti et al. 2022).
Information on the potential presence of gas turbulence can be obtained by comparing with the stellar FWHM∗. As in many interacting systems, complex, non-ordered stellar motions have been identified in 4C12.50 (Perna et al. 2021). Dasyra et al. (2006) measured FWHM∗=392112 km s-1, which is affected by a large uncertainty. The narrow (systemic) component of the emission lines from the ionized gas has FWHM=34023 km s-1 for the optical lines (Holt et al. 2003; 3196 km s-1 according to Rose et al. 2018) and FWHM=41918 km s-1 or 39215 km s-1 for Paaccording to the EMIR and the X-shooter spectra respectively; Table 2). All are consistent with FWHM∗ within the errors, although the FWHM of the narrow Pais somewhat broader (3.2 significance) in comparison with the optical lines. This is not surprising, given the rich dust content of 4C12.50. Slightly larger stellar velocity widths are often inferred for galaxies using NIR stellar features compared with the optical values. This suggests that the NIR features probe more deeply embedded (and therefore higher velocity dispersion) stellar populations than the optical ones (Caglar et al. 2020).
Depending on which value we use (Fig. 11), the molecular lines are all broader than the narrow optical component or similar to the narrow Pa. This is not likely to be affected by aperture effects, given the diversity of aperture sizes for the data and the consistency of the result for most lines. Based on this comparison, therefore, it is not possible to confirm whether the hot (neither the warm) H2 gas shows turbulent motions in relation to the systemic motions.
An indication of turbulence of the warm and hot molecular gas is suggested by the fact that all lines appear to be broader than CO(2-1) and possibily CO(1-0). The origin is however unknown. Although the dominant kinematic component of the hot molecular gas in ULIRGs and Seyferts is rotation, non rotational components are often also identified (e.g. Bianchin et al. 2021). They could be gas elements out of dynamical equilibrium, such as gas streams related to galaxy interactions, inflows or outflows Dasyra & Combes (2011); Guillard et al. (2012); Fotopoulou et al. (2019).
Another result of the kinematic analysis is that a counterpart of the prominent MIR H2 molecular outflow identified by Dasyra & Combes (2011) is not confirmed. We show next that if the NIR H2 lines had the same relative contribution of the outflow as in the MIR, we should have detected it.
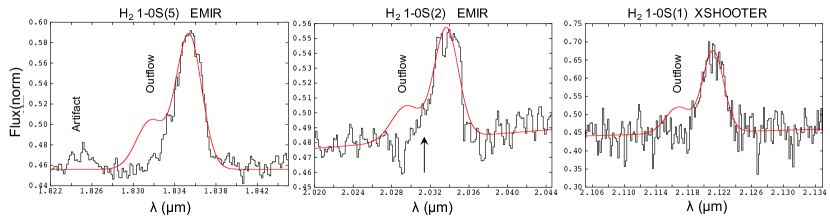
For this, we have created the expected spectral profiles of H2 S(5), S(2) and S(1) assuming the same kinematic substructure in km s-1 as the MIR lines (instrumental broadening has been taken into account). We then compared these with the data. For S(1) we have used the Xshooter spectrum because the line is on the edge of the EMIR data. The results are shown in Fig. 12. The red lines are the expected line profiles. The molecular outflow should have been detected for the three lines as a clear blue excess, but this is not the case.
A faint blue excess may be hinted on the blue wing of S(2) in the EMIR spectrum (Fig. 12). However, it is not clear this is real based on the non detection in the Xshooter spectrum, the structure of the noise in adjacent spectral regions and the absence of the wing in other H2 lines, both in the Xshooter and EMIR spectra.
In summary, we find no evidence for a hot molecular outflow in the NIR H2 lines. Kinematic turbulence is suggested by somewhat broader line widths in comparison with CO(2-1) and CO(1-0). The origin of this turbulence can be diverse. Given the clear role of the jet induced shocks in heating the H2 gas, it seems natural that they may also affect the kinematics inducing some turbulence (see alsoGuillard et al. 2012).
It is possible that faint spectroscopic features related to the feedback induced by the jet are lost in the overwhelming glare of the bright nuclear line emission in the spatially integrated spectra analyzed in this work. NIR and MIR integral field spectroscopy at very high spatial resolution (for instance with NIRSPEC and/or MIRI on the JWST) would be of key value to map in two spatial dimensions the impact of the interaction between the radio jet and the ambient hot and warm molecular gas with spatial resolution of FWHMseveral100 pc.
5 Discussion
Observations of ionized and neutral gas outflows in radio galaxies suggest that AGN radio jet feedback has the potential to affect the gaseous environment of their hosts from nuclear to galactic scales, and out into the circumgalactic medium. This feedback mechanism may also be relevant in systems hosting moderate power radio sources (e.g. Villar Martín et al. 2017; 2021, Jarvis et al. 2019; Girdhar et al. 2022). To determine whether and how the radio sources can regulate the star formation in their host galaxies it is necessary to understand how the molecular gas is affected (e.g. Tadhunter et al. 2014; Morganti et al. 2021).
4C12.50 is a very relevant system in this context. If radio induced feedback can regulate the star formation activity in galaxies, it is a promising candidate to reveal this phenomenon in action.The compact twin jet is still within the region where a huge accumulation of molecular gas and dust formed during the course of a gas-rich merger, prior to the coalescence with the companion secondary nucleus. This process has favoured intense star formation (see Sect. 1). The large mechanical energy of the powerful radio source and the high concentration of gas have resulted on a strong jet-gas interaction that has triggered kinematically extreme ionized and neutral outflows (Sect. 4.1 and references therein).
The regulation of the system’s evolution by the jet may occur, on one hand, by expelling the dusty nuclear cocoon. The system may transition in this way from a ULIRG to an optically less obscured radio galaxy (Sect. 1). On the other hand, the radio source could act on the molecular reservoir by heating (or cooling) gas, which may result in quenching (or triggering) star formation and thus halting (or triggering) the growth of the galaxy.
5.1 Is the radio jet clearing out the cocoon?
Like many local ULIRGs, 4C12.50 hosts an obscured and very compact nucleus. Based on the CO(2-1) ALMA data described in Lamperti et al. (2022), we measure a deconvolved half light radius of the CO(2-1) emisssion of 3582 pc (see also Evans et al. 2002). A molecular gas mass log() = 9.360.05 M⊙ (23% of the total cold molecular gas mass) is enclosed within. Most of the remaining cold molecular gas is in a 4 kpc wide disk (Fotopoulou et al. 2019).
For comparison, compact obscured nuclei with 200-400 pc and (0.1-several)109 M⊙ are common in local ULIRGs (Condon et al. 1991; Soifer et al. 2000; Pereira-Santaella et al. 2021). The small sizes of the twin jet in 4C12.50 (total size 220 pc) and of the ionized (radial size 69 pc, Tadhunter et al. 2018) and neutral (100 pc, Morganti et al. 2013) outflow triggered by it indicate that they are well within the dusty cocoon. Therefore, the clearing up process may be at work.
Currently, the radio plasma appears to be dragging a small fraction of the total cocoon mass, with 8105 M⊙ of ionized gas and 1.6104 M⊙ of neutral gas at a total mass outflow rate of 10 M⊙ yr-1 at most (Holt et al. 2011; Morganti et al. 2013; Rose et al. 2018). Considering all studies of the molecular gas component, there is no solid evidence for a molecular outflow in 4C12.50, neither in emission, nor in absorption (Sect. 1 and 4.2.4), not at any temperature, hot (this work), warm or cold. In spite of the clear and dramatic impact of the jet on the ionized and neutral gas kinematics, it has no obvious effects on the kinematics of the hot (neither warm) molecular gas except, possibly, some enhanced turbulence in comparison with the cold molecular gas. This is not enough to remove significant amounts of molecular gas and clear out the central cocoon (Guillard et al. 2012). As discussed by the later authors, this implies that dynamical coupling between the molecular gas and the ionized and neutral outflowing gas is weak.
At the total observed , and assuming the unlikely case that all the gas is successfully removed from the central region, the radio source would have to be trapped and removing the gas within the cocoon for an unrealistically long time 2.3108 yr. This is as long as the maximum radio source dynamical ages in radio galaxies in general. These are typically several108 yr, with the longest ages measured in giant radio galaxies (e.g. Machalski et al. 2007, 2009).
At the moment, it appears that the radio jet is displacing mass at a too slow rate to efficiently clear up the dusty cocoon. It is unclear whether the removal of a significantly lower amount of mass would suffice to promote the transtion into an optically less obscured radio galaxy.
5.2 Has star formation been suppressed by jet-induced feedback in 4C12.50?
It is not clear whether the outflow can affect substantially the star formation activity in 4C12.50, given the moderate mass outflow rate (), kinetic power and small volume (see Rose et al. 2018 for a detailed dicussion). The radio source size is 220 pc. The affected volume is much smaller than the galactic bulge (the effective radius of the galaxy hosting the western nucleus is 2.590.58 kpc, Dasyra et al. 2006). Star formation may be affected within the inner 100 pc, the maximum estimated outflow size, but the impact on larger scales is lacking evidence. As argued by Rose et al. (2018), although the presence of a lower density outflow component that has a high mass and contributes relatively little to the emission line fluxes cannot be ruled out, there is currently no observational evidence for it.
Even if a powerful molecular outflow is not triggered, supression of star formation may occur as a consequence of other processes related to the jet, such as molecular gas heating and/or the injection of turbulence. Evidence for this process lies in the unusually high temperature (=3020160 K) of the hot component, the power law -mass function relation (Sect. 4.2.1 and 4.2.2) and the fact that shocks are needed to explain the MIR H2 emission (Sect. 4.2.3; Ogle et al. 2010; Guillard et al. 2012). Shocks can be generated in different ways. In ULIRGs in particular, interactions with nearby galaxies can excite large-scale shocks that will cool by means of H2 emission (Zakamska 2010; Rich et al. 2015). In 4C12.50, a natural scenario is that the compact, powerful jet plays a major role on this regard. The clear impact of the interaction with the ionized and neutral components suggests that shocks are indeed present. If the jet encounters molecular gas on its path, it may inject mechanical energy capable of heating it, even if the kinematics is not significantly affected.
We investigate next whether there is evidence for star formation supression in 4C12.50. Lanz et al. (2016) found that MOHEGs (including 4C12.50) fall below the K-S relation of galaxies, log() vs. log() (Kennicutt 1998). These are the surface density of star formation and the surface density of molecular gas respectively. According to the authors, this suggests that the star formation rate (SFR) is suppressed by a factor of 3-6, depending on how the molecular gas mass is estimated. Approximately 25% of their sample shows a suppression by more than a factor of 10. For 4C12.50, they found a factor 10 in comparison with normal galaxies and a factor 100 in comparison with ULIRGs. They suggested that the shocks driven by the radio jets are responsible for the suppression, by injecting turbulence into the interstellar medium (ISM). They also found that the degree of SFR suppression does not correlate with indicators of jet feedback including jet power, diffuse X-ray emission, or intensity of warm molecular H2 emission.
Using the ALMA data previously mentioned, we have revised the location of 4C12.50 in the K–S relation of different galaxy types. For the purpose of comparison with Lanz et al. (2016), we calculate and , where and are the radial sizes of the star forming region and of the molecular gas distribution respectively.
The main sources of uncertainty to determine both values come from the uncertain SFR and the areas of the star forming region and the molecular gas distributions.
The main difficulty to estimate the SFR is the uncertain fraction of AGN contribution to , . Veilleux et al. (2009) applied six different methods to infer the fraction of AGN contribution to the bolometric luminosity , and obtained values in the range 28-84%, with an average of 57 %. Perna et al. (2021) constrained the range further to 60-82% depending on the method. Since 90% of is emitted in the infrared for 4C12.50, we assume . 60-82% is a reasonable range of values also based on the the ratio of the mid to far infrared continuum fluxes of 4C12.50, log()=-0.19, which is intermediate between starburst dominated ULIRGs (-1.25) and AGN dominated ULIRGs (0.35) (Veilleux et al. 2009). This suggestas a significant but not total contamination of a MIR bump due to the AGN (Lanz et al. 2016).
This implies SFR63-141 M⊙ yr-1 (Kennicutt 1998). For comparison Rupke et al. (2005b) quote 101 M⊙ yr-1. These SFR are in the range of other ULIRGs (e.g. Daddi et al. 2010a; De Looze et al. 2014; Perna et al. 2021), SFR100 M⊙ yr-1 is consistent with the value expected for its gas mass (see Fig. 1 in Daddi et al. 2010a). Lanz et al. 2016 fitted the spectral energy distribution (SED) of 4C12.50 with both an AGN and a SB component, which is essential to obtain a more accurate . They inferred SFR24 M⊙ yr-1 for 4C12.50 and, thus, 93%. This is indeed bellow the value expected for its gas mass. Notice, however, that the authors warn that a combination of dust temperatures not implemented in their method would be more adequate to fit the IR SED. Given all uncertainties, we will consider three possibilities: SFR=24, 63 and 141 M⊙ yr-1 .
Regarding the areas of the star forming region and the molecular gas distributions, we have considered several possibilities summarized in Table 5. We measure a half light radius of the CO(2-1) emitting region =3582 pc (see previous section), which is very similar to the median value, 320 pc, inferred by Pereira-Santaella et al. (2021) for their sample of nearby ULIRGs. We consider this a reasonable upper limit for , since invariably in ULIRGs (Pereira-Santaella et al. 2021). This is also consistent with MIR observations which indicate that most of the star formation in ULIRGs occurs in very compact regions (1 kpc; e.g. Soifer et al. 2000; Díaz-Santos et al. 2010; Alonso-Herrero et al. 2016). his implies lower limits for log() of 1.76 or 2.19 and 2.54 depending of the three assumed SFR values for 4C12.50. For comparison, most ULIRGs in Pereira-Santaella et al. (2021) sample are in the range 2.8-4.3 333For the purpose of this comparison, we have multiplied their values by 2, since they estimate the area as ..
We have considered different possible values for . In case (A) (Table 5), = and the mass within is log(/M⊙)=9.36. This implies log(=3.76). This is within the range 2.59-4.49 (log of the median 3.91) in Pereira-Santaella et al. (2021) (see also Bellocchi et al. 2022).
Based on the CO(1-0), (3-2), and (4-3) line obsevations with ALMA), Fotopoulou et al. (2019) discovered that most of the total molecular gas of 4C12.50 is within 2 kpc (this is consistent with our CO(2-1) ALMA data), including a disk of radius =2 kpc, associated with the western nucleus. Although they detected more extended molecular gas, its mass is relatively low. In case (B), we thus assume =2 kpc and log(/M⊙)=10.00, which is the total cold molecular gas of the system. For the sake of comparison with Lanz et al. (2016), we assume =, although this is likely to be unrealistically large (see above).
Finally, we will assume the values adopted by Lanz et al. (2016), ==4.2 kpc (case C). This is the extent of the main CO(1-0) spatial component, which Dasyra et al. (2014) found to be marginally resolved within the beam size based on IRAM Plateau de Bure Interferometer data. We emphasize that these authors used =4.3 (K km-1 s-1 pc2)-1 (instead of 0.78), leading to a significantly higher total molecular gas mass of log(/M⊙)=10.73.
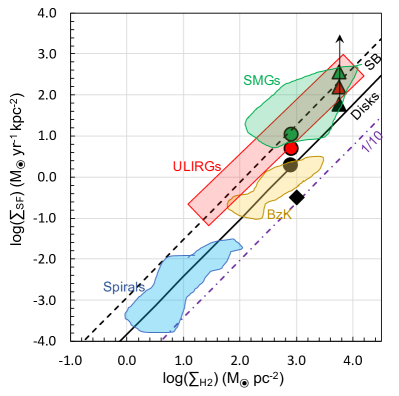
and for cases (A) to (C) are shown in Table 5 and their location on the the K-S relation in Fig. 13. As argued by Daddi et al. (2010a), this diagram suggests the existence of two different SF regimes: a long-lasting mode for disks and a more rapid mode for starbursts (including U/LIRGs and submillimeter galaxies (SMG)), the latter probably occurring during major mergers or in dense nuclear SF regions. They considered the total neutral and molecular gas. We use only the cold molecular gas in 4C12.50, because the neutral gas mass in ULIRGs is in likely negligible in comparison (Daddi et al. 2010b).
Being a ULIRG undergoing a major merger, we would expect 4C12.50 to lie near the starburst sequence. On the contrary, Lanz et al. (2016) found that the object is not only well below it, but well below the ”normal” disks sequence as well (see black diamond in Fig. 13).
Based on our revised location of 4C12.50 in the K-S diagram we cannot confirm this conclusion. In fact, the location based on the new ALMA measurements (Case (A) lower limits represented as triangles in the figure) in Table 5), all lie close or above the starburst region. Given that is most probably a lower limit of , we can claim that we find no evidence for star formation supression in this object. Positive feedback, in the sense of an enhacement of the star formation activity induced by the jet, may be present. To investigate this more accurate determinations of both the SFR and, specially, would be very valuable.
The main reason for the discrepancy with Lanz et al. (2016) is their assumption of unrealistically large 4.2 kpc. Another important difference is the lower SFR24 M⊙ yr-1 and the assumed =4.3. While this conversion factor is appropriate for galaxies in the disk sequence, =0.78 is more appropriate for U/LIRGs. This difference was taken into account by Daddi et al. (2010a), who used values adequate for each galaxy type.
| Case | log() | SFR | log() | log() | Symbol | ||
|---|---|---|---|---|---|---|---|
| kpc | kpc | M⊙ | M⊙ yr-1 | M⊙ pc-2 | M⊙ yr- kpc-2 | ||
| (A) ==, =0.78 | |||||||
| A1 | 0.358 | 0.358 | 9.36 | 141 | 3.76 | 2.54 | Green triangle |
| A2 | 0.358 | 0.358 | 9.36 | 63 | 3.76 | 2.19 | Red triangle |
| A3 | 0.358 | 0.358 | 9.36 | 24 | 3.76 | 1.76 | Black triangle |
| (B) ==, =0.78 | |||||||
| B1 | 2.0 | 2.0 | 10.00 | 141 | 2.90 | 1.05 | Green circle |
| B2 | 2.0 | 2.0 | 10.00 | 63 | 2.90 | 0.70 | Red circle |
| B3 | 2.0 | 2.0 | 10.00 | 24 | 2.90 | 0.28 | Black circle |
| (C) ==4.2 kpc, =4.3 | |||||||
| C | 4.2 | 4.2 | 10.73 | 24 | 3.03 | -0.36 | Black diamond |
5.3 No solid evidence for a significant impact of radio induced feedback on 4C12.50 evolution
Overall, there is no solid evidence for the radio jet to have a significant impact on the evolution of 4C12.50, not by clearing out the dusty central cocoon, nor by suppressing the star formation activity.
It is possible that we are observing 4C12.50 in a very early phase of the radio activity. At the moment, the radio source appears to be affecting just a small volume. However, as times passes, unless its advance is frustrated by the rich gaseous medium the jet will propagate through the galaxy and possibly expand beyond it at some point. Signs of a previous radio outburst stretching outside the host shows that this has happened in the past (Lister et al. 2003; Stanghellini et al. 2005). If the radio jet decelerates and inflates into large expanding bubbles, it will affect a much larger galactic volume. Whether it will carry enough energy to expel the cocoon and/or to prevent further gas cooling and/or to inject turbulence, affecting in this way future star formation is unknown (Mukherjee et al. 2016; Morganti et al. 2021).
The presence of other feedback mechanisms acting on different spatial scales should not be forgotten (AGN wind and/or starburst winds). Their action is suggested by Rupke et al. (2005a) results. They detected blueshifted NaID absorption due to a neutral outflow in the Western nucleus with = 364 km s-1, M⊙, M⊙ yr-1 and log()41.16 or 0.001% of (but see Perna et al. 2021). They locate it up to a radius of 10-15 kpc and at a large angle from the radio axis and thus, there is no clear link between this outflow and the radio source.
6 Summary and conclusions
We present for the first time a detailed analysis of the hot (1500 K) molecular H2 gas in the ultraluminous-infrared radio galaxy 4C12.50 at =0.122 based on GTC EMIR and VLT Xshooter near-infarred long slit spectroscopy of the western primary nucleus. New results on the ionized (including coronal) phase are also presented.
4C12.50 hosts a large hot molecular gas content, with =(2.100.44)104 M⊙. This is consistent with its high infrared luminosity (in the ULIRG regime) and with the large mass of cold (25 K) molecular gas.
An unusually high rotational temperature =3020160 K is inferred for H2, that is at the high end of values measured in galaxies in general.
The molecular gas mass obeys a power law temperature distribution from T300 K and up to 3000 K. This is consistent with paraboloidal bow shock model predictions. This, and the high , suggests that, as found by other authors for the warm H2 MIR emission lines, shocks (probably induced by the radio jet) contribute to the heating and excitation of the hot molecular gas. The jet induced shocks can heat the molecular gas, even it the dynamical coupling is weak.
The H2 2-0 S(3)1.1175 / 2-1 S(3)2.0735 ratio implies an extinction of =0.350.08 for the hot molecular gas. For comparison, the extinction inferred by other authors for the integrated ionized gas emission is =0.590.11.
We find no evidence for a hot molecular outflow in the NIR H2 lines. The warm (400 K) H2 outflow tentatively identified in the MIR lines by other authors should have been detected, if the relative flux contribution was the same. This is not the case.
In spite of the dramatic impact of the radio jet induced shocks on the dynamics of the ionized and neutral phases of 4C12.50, the dynamics of the hot molecular gas is not obviously affected. This is consistent with previous works that suggest the poor coupling of the outflowing ionized and neutral outflows with the molecular gas at lower temperatures.
The extreme Pa kinematics are consistent with those of the optical lines, including several forbidden ones. The prominent broad blueshifted Paexcess is not produced by the broad line region. It is due to the kinematically extreme ionized outflow previously identified in the optical. The outflow dominates (814%) the Pa flux.
Most of (possibily all) the coronal gas appears to be outflowing, with blueshifted and very broad [SiVI]1.963 and [FeVII]6087 (FWHM3430450 km s-1 and -1350190 km s-1 for the broadest component of [SiVI]).
The relative contribution of the most turbulent (broadest) outflowing gas component to the total forbidden line fluxes, , correlates with the critical density in log. This suggests that a single mechanism (the radio jet) is responsible for the outflow identified in all lines emitted by the ionized phase, from the coronal to the lowest ionization.
If the outflowing ionized gas moving away from the observer is completely extinguished, it could be trully kinematically extreme, with FWHM5400 km s-1 (7000 km s-1 for the coronal gas), only comparable to those seen in a handful of high extremely luminous quasars. Its mass and energetics would still be moderate.
Based on ALMA CO(2-1) data and a new estimation of the star forming rate, we revise the location of 4C12.50 in the K-S diagram. Contrary to other studies, we claim that there is no evidence for star formation suppresion in this object. Positive feedback as a consequence of jet induced star formation is not discarded.
If radio induced feedback can regulate the star formation activity in galaxies, 4C12.50 is a promising candidate to reveal this phenomenon in action. The rich amount of knowledge available for this object, however, has not provided solid evidence so far for this to be the case. We find no solid evidence for current or past impact of this mechanism on the evolution of this system, neither by clearing out the dusty central cocoon efficiently, nor by suppressing the star formation activity.
Acknowledgments
We thank an anonymous referee for revising the paper and contributing with constructive comments. This research has made use of grants PGC2018-094671-BI00, PID2021-124665NB-I00 (MVM, AC and AAH) and PIB2021-127718NB-100 (LC) by the Spanish Ministry of Science and Innovation/State Agency of Research MCIN/AEI/ 10.13039/501100011033 and by ”ERDF A way of making Europe”. IL acknowledges support from the Spanish Ministry of Science and Innovation (MCIN) by means of the Recovery and Resilience Facility, and the Agencia Estatal de Investigación (AEI) under the projects with references BDC20221289 and PID2019-105423GA-I00. EB acknowledges the María Zambrano program of the Spanish Ministerio de Universidades funded by the Next Generation European Union and is also partly supported by grant RTI2018-096188-B-I00 funded by MCIN/AEI/10.13039/501100011033.
Based on observations carried out at the Observatorio Roque de los Muchachos (La Palma, Spain) with EMIR on GTC (program GTC16-21B) and at the European Organization for Astronomical Research in the Southern hemisphere with Xshooter on VLT (ESO programme 091.B-0256(A)). We thank the observatories staff for their support with the observations. It also makes use of the following ALMA data: ADS/JAO.ALMA#2018.1.00699.S. ALMA is a partnership of ESO (representing its member states), NSF (USA) and NINS (Japan), together with NRC (Canada) and NSC and ASIAA (Taiwan) and KASI (Republic of Korea), in cooperation with the Republic of Chile. The Joint ALMA Observatory is operated by ESO, AUI/NRAO and NAOJ. The National Radio Astronomy Observatory is a facility of the National Science Foundation operated under cooperative agreement by Associated Universities, Inc.
This research has made use of: 1) the VizieR catalogue access tool, CDS, Strasbourg, France. The original description of the VizieR service was published in Ochsenbein et al. (2000); 2) the Cosmology calculator by Wright (2006); 3) the NASA/IPAC Extragalactic Database (NED), which is operated by the Jet Propulsion Laboratory, California Institute of Technology, under contract with the National Aeronautics and Space Administration; 4) data from Sloan Digital Sky Survey. Funding for the SDSS and SDSS-II has been provided by the Alfred P. Sloan Foundation, the Participating Institutions, the National Science Foundation, the U.S. Department of Energy, the National Aeronautics and Space Administration, the Japanese Monbukagakusho, the Max Planck Society, and the Higher Education Funding Council for England. The SDSS Web Site is http://www.sdss.org/.
References
- Alonso-Herrero et al. (2016) Alonso-Herrero, A., Poulton, R., Roche, P. F., et al. 2016, MNRAS, 463, 2405
- Álvarez-Márquez et al. (2023) Álvarez-Márquez, J., Labiano, A., Guillard, P., et al. 2023, A&A, in press (arXiv:2209.01695)
- Batcheldor et al. (2007) Batcheldor, D., Tadhunter, C., Holt, J., et al. 2007, ApJ, 661, 70
- Bellocchi et al. (2022) Bellocchi, E., Pereira-Santaella, M., Colina, L., et al. 2022, A&A, 664, A60
- Bennert et al. (2006) Bennert, N., Jungwiert, B., Komossa, S., et al. 2006, A&A, 456, 953
- Bianchin et al. (2021) Bianchin, M., Riffel, R. A., Storchi-Bergmann, T., et al. 2021, MNRAS.
- Bridges & Irwin (1998) Bridges, T. J. & Irwin, J. A. 1998, MNRAS, 300, 967
- Caglar et al. (2020) Caglar, T., Burtscher, L., Brandl, B., et al. 2020, A&A, 634, A114.
- Calzetti et al. (2000) Calzetti, D., Armus, L., Bohlin, R. C., et al. 2000, ApJ, 533, 682
- Cerqueira-Campos et al. (2021) Cerqueira-Campos, F. C., Rodríguez-Ardila, A., Riffel, R., et al. 2021, MNRAS, 500, 2666.
- Colina et al. (2005) Colina, L., Arribas, S., & Monreal-Ibero, A. 2005, ApJ, 621, 725.
- Colina et al. (2015) Colina, L., Piqueras López, J., Arribas, S., et al. 2015, A&A, 578, A48
- Condon et al. (1991) Condon, J. J., Huang, Z.-P., Yin, Q. F., et al. 1991, ApJ, 378, 65
- Cortzen et al. (2019) Cortzen, I., Garrett, J., Magdis, G., et al. 2019, MNRAS, 482, 1618.
- Daddi et al. (2010a) Daddi, E., Elbaz, D., Walter, F., et al. 2010, ApJ, 714, L118
- Daddi et al. (2010b) Daddi, E., Bournaud, F., Walter, F., et al. 2010, ApJ, 713, 686
- Dale et al. (2005) Dale, D. A., Sheth, K., Helou, G., et al. 2005, AJ, 129, 2197
- Dasyra et al. (2006) Dasyra, K. M., Tacconi, L. J., Davies, R. I., et al. 2006, ApJ, 638, 745
- Dasyra & Combes (2011) Dasyra, K. M. & Combes, F. 2011, A&A, 533, L10
- Dasyra & Combes (2012) Dasyra, K. M. & Combes, F. 2012, A&A, 541, L7
- Dasyra et al. (2014) Dasyra, K. M., Combes, F., Novak, G. S., et al. 2014, A&A, 565, A46
- Davies et al. (2003) Davies, R. I., Sternberg, A., Lehnert, M., et al. 2003, ApJ, 597, 907
- De Looze et al. (2014) De Looze, I., Cormier, D., Lebouteiller, V., et al. 2014, A&A, 568, A62
- De Robertis & Osterbrock (1984) De Robertis, M. M. & Osterbrock, D. E. 1984, ApJ, 286, 171
- De Robertis & Osterbrock (1986) De Robertis, M. M. & Osterbrock, D. E. 1986, ApJ, 301, 727
- den Brok et al. (2022) den Brok, J. S., Koss, M. J., Trakhtenbrot, B., et al. 2022, ApJS, 261, 7
- Díaz-Santos et al. (2010) Díaz-Santos, T., Charmandaris, V., Armus, L., et al. 2010, ApJ, 723, 993
- Emonts et al. (2014) Emonts, B. H. C., Piqueras-López, J., Colina, L., et al. 2014, A&A, 572, A40
- Emonts et al. (2016) Emonts, B. H. C., Morganti, R., Villar-Martín, M., et al. 2016, A&A, 596, A19
- Evans et al. (1999) Evans, A. S., Kim, D. C., Mazzarella, J. M., et al. 1999, ApJ, 521, L107
- Evans et al. (2002) Evans, A. S., Mazzarella, J. M., Surace, J. A., et al. 2002, ApJ, 580, 749
- Farrah et al. (2022) Farrah, D., Efstathiou, A., Afonso, J., et al. 2022, MNRAS, 513, 4770
- Fotopoulou et al. (2019) Fotopoulou, C. M., Dasyra, K. M., Combes, F., et al. 2019, A&A, 629, A30
- Gilmore & Shaw (1986) Gilmore, G. & Shaw, M. A. 1986, Nature, 321, 750
- Grandi (1977) Grandi, S. A. 1977, ApJ, 215, 446
- Guillard et al. (2012) Guillard, P., Ogle, P. M., Emonts, B. H. C., et al. 2012, ApJ, 747, 95
- Girdhar et al. (2022) Girdhar, A., Harrison, C. M., Mainieri, V., et al. 2022, MNRAS, 512, 1608
- Heckman et al. (1986) Heckman, T. M., Smith, E. P., Baum, S. A., et al. 1986, ApJ, 311, 526
- Holt et al. (2003) Holt, J., Tadhunter, C. N., & Morganti, R. 2003, MNRAS, 342, 227
- Holt et al. (2011) Holt, J., Tadhunter, C. N., Morganti, R., et al. 2011, MNRAS, 410, 1527
- Imanishi et al. (2016) Imanishi, M., Nakanishi, K., & Izumi, T. 2016, AJ, 152, 218
- Imanishi et al. (2018) Imanishi, M., Nakanishi, K., & Izumi, T. 2018, ApJ, 856, 143
- Jarvis et al. (2019) Jarvis, M. E., Harrison, C. M., Thomson, A. P., et al. 2019, MNRAS, 485, 2710
- Kennicutt (1998) Kennicutt, R. C. 1998, ApJ, 498, 541
- Lanz et al. (2016) Lanz, L., Ogle, P. M., Alatalo, K., et al. 2016, ApJ, 826, 29
- Lamperti et al. (2017) Lamperti, I., Koss, M., Trakhtenbrot, B., et al. 2017, MNRAS, 467, 540
- Lamperti et al. (2022) Lamperti, I., et al. 2022, in press
- Larkin et al. (1998) Larkin, J. E., Armus, L., Knop, R. A., et al. 1998, ApJS, 114, 59
- Lister et al. (2003) Lister, M. L., Kellermann, K. I., Vermeulen, R. C., et al. 2003, ApJ, 584, 135. doi:10.1086/345666
- Machalski et al. (2007) Machalski, J., Chyży, K. T., Stawarz, Ł., et al. 2007, A&A, 462, 43
- Machalski et al. (2009) Machalski, J., Jamrozy, M., & Saikia, D. J. 2009, MNRAS, 395, 812
- Małek et al. (2013) Małek, K., Pollo, A., Takeuchi, T. T., et al. 2013, Earth, Planets and Space, 65, 1101
- Mazzalay et al. (2013) Mazzalay, X., Saglia, R. P., Erwin, P., et al. 2013, MNRAS, 428, 2389
- Mezcua et al. (2015) Mezcua, M., Prieto, M. A., Fernández-Ontiveros, J. A., et al. 2015, MNRAS, 452, 4128
- Mirabel (1989) Mirabel, I. F. 1989, ApJ, 340, L13
- Mirabel et al. (1989) Mirabel, I. F., Sanders, D. B., & Kazes, I. 1989, ApJ, 340, L9
- Mittal et al. (2012) Mittal, R., Oonk, J. B. R., Ferland, G. J., et al. 2012, MNRAS, 426, 2957
- Morganti et al. (2003) Morganti, R., Tadhunter, C. N., Oosterloo, T. A., et al. 2003, PASA, 20, 129
- Morganti et al. (2004) Morganti, R., Oosterloo, T. A., Tadhunter, C. N., et al. 2004, A&A, 424, 119
- Morganti et al. (2005) Morganti, R., Tadhunter, C. N., & Oosterloo, T. A. 2005, A&A, 444, L9
- Morganti et al. (2013) Morganti, R., Fogasy, J., Paragi, Z., et al. 2013, Science, 341, 1082
- Morganti et al. (2021) Morganti, R., Oosterloo, T., Tadhunter, C., et al. 2021, A&A, 656, A55
- Mukherjee et al. (2016) Mukherjee, D., Bicknell, G. V., Sutherland, R., et al. 2016, MNRAS, 461, 967
- Müller Sánchez et al. (2006) Müller Sánchez, F., Davies, R. I., Eisenhauer, F., et al. 2006, A&A, 454, 481
- Murphy et al. (2001) Murphy, T. W., Soifer, B. T., Matthews, K., et al. 2001, AJ, 121, 97
- Neufeld & Yuan (2008) Neufeld, D. A. & Yuan, Y. 2008, ApJ, 678, 974
- Ocaña Flaquer et al. (2010) Ocaña Flaquer, B., Leon, S., Combes, F., et al. 2010, A&A, 518, A9
- Ochsenbein et al. (2000) Ochsenbein, F., Bauer, P., & Marcout, J. 2000, A&AS, 143, 23
- O’Dea (1998) O’Dea, C. P. 1998, PASP, 110, 493. doi:10.1086/316162
- O’Dea et al. (2000) O’Dea, C. P., De Vries, W. H., Worrall, D. M., et al. 2000, AJ, 119, 478
- O’Dea & Saikia (2021) O’Dea, C. P. & Saikia, D. J. 2021, A&A Rev., 29, 3
- Ogle et al. (2010) Ogle, P., Boulanger, F., Guillard, P., et al. 2010, ApJ, 724, 1193
- Oh et al. (2018) Oh, K., Koss, M., Markwardt, C. B., et al. 2018, ApJS, 235, 4
- Osterbrock & Ferland (2006) Osterbrock, D. E., & Ferland, G. J. 2006, Astrophysics of gaseous nebulae and active galactic nuclei (University Science Books)
- Pereira-Santaella et al. (2014) Pereira-Santaella, M., Spinoglio, L., van der Werf, P. P., et al. 2014, A&A, 566, A49
- Pereira-Santaella et al. (2021) Pereira-Santaella, M., Colina, L., García-Burillo, S., et al. 2021, A&A, 651, A42
- Perna et al. (2021) Perna, M., Arribas, S., Pereira Santaella, M., et al. 2021, A&A, 646, A101
- Perrotta et al. (2019) Perrotta, S., Hamann, F., Zakamska, N. L., et al. 2019, MNRAS, 488, 4126
- Piqueras López et al. (2012) Piqueras López, J., Colina, L., Arribas, S., et al. 2012, A&A, 546, A64
- Piqueras López et al. (2013) Piqueras López, J., Colina, L., Arribas, S., et al. 2013, A&A, 553, A85.
- Ramos Almeida et al. (2009) Ramos Almeida, C., Pérez García, & A. M., Acosta-Pulido, J., 2009, ApJ, 694, 1379
- Ramos Almeida et al. (2019) Ramos Almeida, C., Acosta-Pulido, J. A., Tadhunter, C. N., et al. 2019, MNRAS, 487, L18
- Ramos Almeida et al. (2022) Ramos Almeida, C., Bischetti, M., García-Burillo, S., et al. 2022, A&A, 658, A155. doi:10.1051/0004-6361/202141906
- Rich et al. (2015) Rich, J. A., Kewley, L. J., & Dopita, M. A. 2015, ApJS, 221, 28
- Riffel et al. (2006) Riffel, R., Rodríguez-Ardila, A., & Pastoriza, M. G. 2006, A&A, 457, 61
- Riffel et al. (2013) Riffel, R. A., Storchi-Bergmann, T., Riffel, R., et al. 2013, MNRAS, 429, 2587
- Riffel et al. (2014) Riffel, R. A., Vale, T. B., Storchi-Bergmann, T., et al. 2014, MNRAS, 442, 656
- Riffel et al. (2021) Riffel, R. A., Storchi-Bergmann, T., Riffel, R., et al. 2021, MNRAS, 504, 3265
- Rodríguez-Ardila et al. (2002) Rodríguez-Ardila, A., Viegas, S. M., Pastoriza, M. G., et al. 2002, ApJ, 579, 214
- Rodríguez-Ardila et al. (2004) Rodríguez-Ardila, A., Pastoriza, M. G., Viegas, S., et al. 2004, A&A, 425, 457
- Rodríguez-Ardila et al. (2005) Rodríguez-Ardila, A., Riffel, R., & Pastoriza, M. G. 2005, MNRAS, 364, 1041
- Rodríguez-Ardila et al. (2011) Rodríguez-Ardila, A., Prieto, M. A., Portilla, J. G., et al. 2011, ApJ, 743, 100.
- Rodríguez Zaurín et al. (2013) Rodríguez Zaurín, J., Tadhunter, C. N., Rose, M., et al. 2013, MNRAS, 432, 138
- Rose et al. (2011) Rose, M., Tadhunter, C. N., Holt, J., et al. 2011, MNRAS, 414, 3360
- Rose et al. (2018) Rose, M., Tadhunter, C., Ramos Almeida, C., et al. 2018, MNRAS, 474, 128
- Rupke et al. (2005a) Rupke, D. S., Veilleux, S., & Sanders, D. B. 2005a, ApJ, 632, 751
- Rupke et al. (2005b) Rupke, D. S., Veilleux, S., & Sanders, D. B. 2005b, ApJS, 632, 751
- Sadler (2016) Sadler, E. M. 2016, Astronomische Nachrichten, 337, 105
- Santoro et al. (2020) Santoro, F., Tadhunter, C., Baron, D., et al. 2020, A&A, 644, A54
- Scoville et al. (1982) Scoville, N. Z., Hall, D. N. B., Ridgway, S. T., et al. 1982, ApJ, 253, 136
- Smolčić & Riechers (2011) Smolčić, V. & Riechers, D. A. 2011, ApJ, 730, 64
- Soifer et al. (2000) Soifer, B. T., Neugebauer, G., Matthews, K., et al. 2000, AJ, 119, 509
- Solomon & Vanden Bout (2005) Solomon, P. M. & Vanden Bout, P. A. 2005, ARA&A, 43, 677
- Speranza et al. (2022) Speranza, G., Ramos Almeida, C., Acosta-Pulido, J. A., et al. 2022, arXiv:2206.15347
- Spoon & Holt (2009a) Spoon, H. W. W. & Holt, J. 2009a, ApJ, 702, L42
- Spoon et al. (2009b) Spoon, H. W. W., Armus, L., Marshall, J. A., et al. 2009b, ApJ, 693, 1223
- Stanghellini et al. (2005) Stanghellini, C., O’Dea, C. P., Dallacasa, D., et al. 2005, A&A, 443, 891
- Tadhunter et al. (2011) Tadhunter, C., Holt, J., González Delgado, R., et al. 2011, MNRAS, 412, 960
- Tadhunter et al. (2014) Tadhunter, C., Morganti, R., Rose, M., et al. 2014, Nature, 511, 440
- Tadhunter et al. (2018) Tadhunter, C., Rodríguez Zaurín, J., Rose, M., et al. 2018, MNRAS, 478, 1558
- Togi & Smith (2016) Togi, A. & Smith, J. D. T. 2016, ApJ, 830, 18
- U et al. (2012) U, V., Sanders, D. B., Mazzarella, J. M., et al. 2012, ApJS, 203, 9
- Vacca (2003) Vacca, W.D., Cushing, M.C., & Rayner, J. T., 2003, PASP, 115, 389
- Veilleux et al. (1997) Veilleux, S., Sanders, D. B., & Kim, D.-C. 1997, ApJ, 484, 92
- Veilleux et al. (2009) Veilleux, S., Rupke, D. S. N., Kim, D.-C., et al. 2009, ApJS, 182, 628
- Villar-Martín et al. (2013) Villar-Martín, M., Rodríguez, M., Drouart, G., et al. 2013, MNRAS, 434, 978
- Villar Martín et al. (2015) Villar Martín, M., Bellocchi, E., Stern, J., et al. 2015, MNRAS, 454, 439.
- Villar-Martín et al. (2017) Villar-Martín, M., Emonts, B., Cabrera Lavers, A., et al. 2017, MNRAS, 472, 4659
- Villar Martín et al. (2020) Villar Martín, M., Perna, M., Humphrey, A., et al. 2020, A&A, 634, A116
- Villar Martín et al. (2021) Villar Martín, M., Emonts, B. H. C., Cabrera Lavers, A., et al. 2021, A&A, 650, A84.
- Wright (2006) Wright, E.L. 2006 PASP, 118, 1711
- Zakamska et al. (2003) Zakamska, N. L., Strauss, M. A., Krolik, J. H., et al. 2003, AJ, 126, 2125
- Zakamska (2010) Zakamska, N. L. 2010, Nature, 465, 60
- Zhu et al. (2017) Zhu, H., Tian, W., Li, A., et al. 2017, MNRAS, 471, 3494