Steering Recommendations and Visualising Its Impact: Effects on Adolescents’ Trust in E-Learning Platforms
Abstract.
Researchers have widely acknowledged the potential of control mechanisms with which end-users of recommender systems can better tailor recommendations. However, few e-learning environments so far incorporate such mechanisms, for example for steering recommended exercises. In addition, studies with adolescents in this context are rare. To address these limitations, we designed a control mechanism and a visualisation of the control’s impact through an iterative design process with adolescents and teachers. Then, we investigated how these functionalities affect adolescents’ trust in an e-learning platform that recommends maths exercises. A randomised controlled experiment with 76 middle school and high school adolescents showed that visualising the impact of exercised control significantly increases trust. Furthermore, having control over their mastery level seemed to inspire adolescents to reasonably challenge themselves and reflect upon the underlying recommendation algorithm. Finally, a significant increase in perceived transparency suggested that visualising steering actions can indirectly explain why recommendations are suitable, which opens interesting research tracks for the broader field of explainable AI.
1. Introduction
Recommender systems have long been actively studied to help reduce information overload in contexts where people are searching for relevant content. To better anticipate people’s changing preferences and needs, researchers have increasingly acknowledged the importance of control mechanisms with which people can actively steer recommendations (Jannach et al., 2017). Studies have shown that being able to control recommendations can increase satisfaction with, perceived understanding of, and trust in a recommender system, which can in turn increase acceptance of recommendations (Knijnenburg et al., 2012a). At the same time, too much control can overwhelm people and incur high cognitive loads (Andjelkovic et al., 2016; Bollen et al., 2010).
However, most research on controlling recommender systems is limited because of two reasons. First, studied target audiences typically consist of adults, whereas in practice younger audiences such as adolescents (ages 12–19 (Fitton et al., 2013)) are just as much, if not more, exposed to recommendation algorithms. Second, recommender systems are most often studied within contexts such as multimedia, e-commerce, and other services, and it is unclear whether findings therein always transfer to other application domains. In a high-stakes domain such as education, for example, it is crucial to properly understand the effects of control mechanisms, especially now that e-learning platforms are increasingly recommending learning content to personalise learning. Thus, it is important to design control mechanisms fit for an educational context; reflect on how much control students, teachers, and other parties should get; and find suitable ways to communicate the impact of steering.
To address these limitations, we conducted a study on how adolescents trust an e-learning platform when they can steer recommended exercises and see their control’s effects. Our research questions were as follows:
- RQ1.:
-
How does the ability to control recommended exercises affect students’ trust in an e-learning platform?
- RQ2.:
-
How is students’ trust in an e-learning platform affected when they see a visual representation of their impact when controlling recommended exercises?
Our research contribution is threefold. First, we present a control mechanism and a visualisation of its impact, which have been found useful and usable by adolescents in a user-centred design process. Second, we discovered that a control mechanism does not necessarily change trust, neither when measured directly, nor when measured as a construct of competence, benevolence, integrity, intention to return, and perceived transparency. We also found, however, that a control mechanism can stimulate adolescents to reflect more upon their mastery level and the underlying recommendation system. Third, we show that visualising the control’s impact can increase trust and perceived understanding of recommendations. Additionally, we share our dataset111https://github.com/JeroenOoge/steering-recommendations-elearning on how adolescents trust our platform and interact with our control mechanism, allowing further exploration and direct comparison in future research. In sum, our contributions highlight the potential of control mechanisms and related visualisations for adolescents in e-learning.
2. Background and related work
This section first discusses existing research on user control in recommender systems and then briefly highlights the overlap with explainable AI research, focusing on trust. Next, it zooms in on educational recommenders and relevant pedagogical background.
2.1. Control over Recommendations
In real-world settings, the accuracy of recommendation algorithms is subject to people’s changing preferences: preference information known to the system can become outdated, leading to inaccurate recommendations (Amatriain et al., 2009). To ameliorate this problem, many control mechanisms have been developed to actively involve people in recommendation processes (Jannach et al., 2017). For example, during preference elicitation, people can exercise control through preference forms (Hijikata et al., 2012) or conversational dialogues (Göker and Thompson, 2000). In addition, after being shown recommendation results, people can steer these results through critiquing (Luo et al., 2020; Petrescu et al., 2021; Chen and Pu, 2012), dynamical filtering and re-sorting (Bostandjiev et al., 2012; O’Donovan et al., 2008), interactive (visual) explanations (He et al., 2016; Schaffer et al., 2015; Tsai and Brusilovsky, 2019, 2021), or changing the recommendation algorithms itself (Ekstrand et al., 2015).
Yet, how much control and which control mechanisms a recommender system should incorporate depends on the context, application, and end-user (Cramer et al., 2008; Jameson and Schwarzkopf, 2002; Jin et al., 2020). Therefore, researchers have been studying the effects of providing control to end-users from different human-centred perspectives (Konstan and Riedl, 2012; Xiao and Benbasat, 2007), including perceived variety of recommendations, personal characteristics, trust, and understanding of the recommendation system. Specifically, Knijnenburg et al. (Knijnenburg et al., 2012b) found that control can increase perceived variety of recommendations. Furthermore, preference for control methods in recommender systems depends on personal characteristics such as personality traits, need for cognition, and mood (Knijnenburg et al., 2011; Jin et al., 2020; Millecamp et al., 2018). Regarding trust in recommendations, control is highly valued for achieving personal goals but can also raise distrust about whether the control is just an illusion (Harambam et al., 2019). Finally, control mechanisms can increase overall system satisfaction and improve understanding of the recommendation process (Knijnenburg et al., 2012a).
2.2. Explainable AI and Trust
The challenge to make recommendation algorithms more transparent fits in the wider field of explainable AI (XAI). Essentially, XAI is an umbrella term for techniques that explain the outcomes of AI models, such that a specific audience can better understand and appropriately trust them (Gunning and Aha, 2019; Barredo Arrieta et al., 2020; Hind, 2019; Guidotti et al., 2019). Research on these techniques brings together many concepts of interest, including fairness, privacy, bias, human reasoning, accountability, and ethics (Abdul et al., 2018).
One frequently studied concept in XAI is trust in automated systems (Lee and See, 2004). Some work approaches trust from an algorithmic perspective, for example by considering it equivalent to reputation in recommender systems (O’Donovan and Smyth, 2005). However, XAI more often approaches trust from a human-centred perspective. Definitions for human-AI trust are heavily debated, but most agree that trust is an attitude in a situation of vulnerability and positive expectations (Vereschak et al., 2021). Thus, from this angle, trust is a human belief that can be wrongly calibrated to the objective trustworthiness of an automated system (Han and Schulz, 2020). Besides, trust building and calibration is influenced by how a system behaves: people’s trust typically fluctuates until they feel sufficiently familiar with the system (Yu et al., 2017; Nourani et al., 2020; Holliday et al., 2016).
Given the lack of well-accepted definitions, researchers measure human-AI trust in many ways. For example, some researchers consider trust as a one-dimensional, i.e. monolithic, concept and typically measure it with a single Likert-type question. While some studies (e.g., Holliday et al., 2016; Nourani et al., 2020) apply this strategy because it is quick, they are limited since a single question cannot measure a complex concept such as trust (Hoff and Bashir, 2015). Alternatively, other researchers consider trust as a multidimensional ensemble of several constructs which they typically measure with multiple Likert-type questions. For example, McKnight et al. (McKnight et al., 2002) introduced trusting beliefs as a composition of competence, benevolence, and integrity; and Ooge et al. (Ooge et al., 2022) measured trust as the average of trusting beliefs, intention to return, and perceived transparency.
2.3. Educational Recommender Systems
Recommendation techniques are increasingly being integrated in digital learning environments (Zhai et al., 2021; Khanal et al., 2020). However, educational recommender systems differ from their general-purpose counterparts: they intend to facilitate achieving learning goals, are subject to a pedagogical context, and consider end-users’ educational role or mastery level instead of personal characteristics (Garcia-Martinez and Hamou-Lhadj, 2013; Manouselis et al., 2013). In general, educational recommender systems can support learning in several ways (Drachsler et al., 2015). For example, they can recommend courses (Farzan and Brusilovsky, 2011; Aher and Lobo, 2013), suggest additional learning resources (Tang and McCalla, 2005), and support teachers to improve their courses or monitor their teaching resources (Gallego et al., 2013; García et al., 2009).
In the spirit of XAI for education (Khosravi et al., 2022), educational recommender systems are often requested to allow steering and to justify their recommendations. Steering could occur, for example, in the form of explicitly asking learners for feedback on exercises’ difficulty after completing them (Michlík and Bieliková, 2010). Furthermore, recommendations tailored to learners’ mastery level can be justified by showing how the system estimates that mastery level (Kay and Kummerfeld, 2019). In the context of open learner models (Bull and Kay, 2010; Conati et al., 2018; Hooshyar et al., 2020), Mabbott and Bull (Mabbott and Bull, 2006) found that learners felt less comfortable having full control over a learner model, compared to only making suggestions; and Abdi et al. (Abdi et al., 2020) found that an open learner model increases understanding of recommendations.
2.4. Estimating Mastery and Exercise Difficulty
From a pedagogical perspective, students’ mastery level can be assessed based on several frameworks. One famous framework is Bloom’s revised taxonomy (Krathwohl, 2002), which consists of two dimensions: a knowledge dimension with four levels (factual, conceptual, procedural, and metacognitive knowledge) and a cognitive process dimension with six levels (remember, understand, apply, analyse, evaluate, and create). Another framework is the Dreyfus model (Dreyfus, 2004), which proposes five skill acquisition levels: novice, advanced beginner, competent, proficient, and expert.
From a computer science perspective, different techniques can simultaneously estimate learners’ mastery level and exercises’ difficulty based on how learners perform while solving exercises (Wauters et al., 2012; Torkamaan and Ziegler, 2022). Specialised models such as item response theory (Kadengye et al., 2015) or knowledge tracing (Guo et al., 2021), however, need to be calibrated on large item sets with known difficulties (Wauters et al., 2012; Pelánek, 2016). A classic alternative that circumvents this disadvantage is the Elo rating system (Pelánek, 2016), which was originally introduced by Arpad Elo (Elo, 1978) for rating chess players. Translated to education, the Elo rating system assigns dynamic ratings to both learners and exercises: the higher a learner’s rating, the higher their mastery level; and the higher an exercise’s rating, the more difficult it is. Furthermore, Elo ratings are of interval scale and their range can be chosen arbitrarily. Each time a learner answers an exercise , the Elo ratings of and are updated as follows:
| (1) |
where is a fixed learning-rate parameter that determines how strongly the attempt influences the Elo rating, reflects whether answered correctly, and
| (2) |
is the modelled probability for a correct answer. In words, whenever someone correctly solves an exercise, their Elo rating increases and the exercise’s Elo rating decreases, proportional to how unexpected that correct answer was; vice versa for incorrect answers. Besides its intuitive functioning, the Elo rating system has the asset that it can be extended to multivariate settings (Abdi et al., 2019), adapted to consider how quickly students solve questions (Klinkenberg et al., 2011), and combined with other techniques such as collaborative filtering (Dahl and Fykse, 2018; Ooge et al., 2022).
3. Materials and Methods
This section presents our e-learning platform and design decisions inspired by a pilot study with teachers and an iterative design process with students. Next, it describes our main study design, which was approved by the ethical committee of KU Leuven (reference number: G-2022-4917).
3.1. E-Learning Platform with Personalised Exercises and a Control Mechanism
We built upon Wiski, an existing e-learning platform for middle and high school students (Ooge, 2019). Essentially, Wiski’s core functionality is solving multiple-choice questions about maths topics in the Belgian school curriculum. Through an iterative design process with students and teachers, we extended this core with three functionalities: (a) composing exercise series recommended for students’ mastery level, (b) giving students partial control over their estimated mastery level, and (c) visualising the impact of that control. Think-aloud studies in which adolescents executed predefined tasks on a low-fidelity version of our e-learning platform ensured that these new functionalities were deemed useful and usable.
Personalised exercise series
Brief semi-structured interviews (Leech, 2002) with 4 high school teachers learned us that teachers appreciated the idea of an e-learning platform that recommends exercises tailored to students’ mastery level. In addition, to give students sufficient time to adapt to new difficulty levels, teachers advised recommending exercise series instead of individual exercises. We therefore decided to let our platform estimate students’ mastery level and exercises’ difficulty with an Elo rating system and then use those estimates to recommend exercise series. Specifically, whenever a student would select a topic to practise, they would start a series consisting of two exercises, and , chosen such that and were closest to 0.7; a value yielding reasonably challenging exercises (Klinkenberg et al., 2011). Probabilities were estimated with a variant of (2), which originates from a chess context:
To set up our Elo rating system, students could initialise their Elo rating with the slider in Figure 1, which indicated five thresholds inspired by the Dreyfus model (Dreyfus, 2004). In the background, the slider’s range corresponded to the interval , which roughly corresponds to typical Elo scores for novice (1000) and expert (2000) chess players. Furthermore, exercises’ initial Elo ratings were set by teachers who participated in our main study. Concretely, teachers used the thresholds in Figure 1 to estimate the difficulty of all exercises belonging to the subjects they wanted to cover in class. In case multiple teachers were interested in the same subjects, we only asked one of them to set the initial ratings, distributing the workload evenly. Finally, we set the hyperparameter in (1) to 160 to allow for relatively large Elo changes.


Control mechanism and impact visualisation
Through two rounds of think-aloud studies with 11 adolescents (2 middle school, 9 high school), we iteratively designed a control mechanism and a visualisation of the exercised control’s impact. First, the control mechanism in Figure 2 allowed students to modify their mastery level and thus steer the difficulty of subsequent recommendations. Specifically, after finishing an exercise series, students could indicate whether they wanted easier or harder exercises. In the background, this would lower or raise their Elo rating up to 10%, respectively. The think-alouds learned us that the slider provided intuitive and sufficient control. In addition, adolescents preferred to reflect in terms of their mastery level and were sometimes confused by a preliminary design that also allowed them to steer exercises’ Elo ratings with a similar slider. Second, the visualisation of the control’s impact in Figure 3 contained three parts: a fixed explanation; a description of how mastery level changed due to solving an exercise series and subsequent steering; and a line chart of the latter information. The think-alouds learned us that adolescents preferred the line chart over an animated bar chart. More details on our iterative designs can be found in Dereu’s master’s thesis (Dereu, 2022).
3.2. Study Design
To answer our research questions, we conducted a randomised controlled experiment with three groups: in none, participants did not have any control over recommended exercises; in control, participants could steer their mastery level with the slider in Figure 2; and in control+impact, participants additionally saw the visualisation of their control’s impact in Figure 3. The flow of our study is depicted in Figure 4. First, participants registered on our Wiski platform and were randomly assigned to one of the three research groups. Then, they initialised their maths mastery level with the slider in Figure 1 and saw one or two of the screens in Figure 5 which globally explained Wiski’s recommendation algorithm. Next, participants chose a maths topic on the practice page and solved three series, each consisting of two exercises. We chose this relatively low number of series to ensure participants could finish the study in under 50 minutes. After each series, participants could adjust their mastery level and see its impact, depending on their research group. Finally, participants filled out a questionnaire and could continue to freely use the platform. Thus, participants’ experience with Wiski only differed in whether or not they could control their mastery level and see a visualisation of their control’s impact. In the background, we logged all Elo rating changes.


Our final questionnaire contained the 31 Likert-type questions in Table 2, scored on a 7-point range. The first part captured trust. Similar to Ooge et al. (Ooge et al., 2022), we measured trust both with a single question and as the average of trusting beliefs, intention to return, and transparency. Slightly different is that, for more reliable scores, we measured transparency with three questions from the ResQue questionnaire (Pu and Chen, 2010) instead of one. The second part of our questionnaire, also based on ResQue (Pu and Chen, 2010; Pu et al., 2011), captured three control aspects: overall control, preference elicitation, and preference revision.
Our questionnaire also contained open text fields that encouraged participants to elaborate on their Likert-type responses. Furthermore, we explicitly asked participants whether they trusted our platform for recommending maths exercises, whether they (would have) liked controlling the desired difficulty level of exercises, and whether they (would have) liked seeing the impact of that control. Only the open question on trust was mandatory and the latter two questions included screenshots similar to Figures 2 and 3.
3.3. Participant Recruitment
We contacted 30 secondary school teachers in Belgium (Flanders) via email and LinkedIn, inviting them and their students to participate in our research during school hours. We asked teachers to not coerce students into participating and to prepare exercises on paper should some students refuse to participate. Four teachers accepted our invitation: they passed through a brochure to students and their respective parents, which communicated our study goals, data management, and Covid-19 precautions. Interested students gave informed consent and students under 16 required parental consent. Ultimately, all 76 invited students (ages 12–17) participated in the study. We excluded 5 participants from the analysis due to incomplete questionnaires, ending up with 22 participants in none, 25 in control, and 24 in control+impact.

|
none vs.
control |
none vs.
control+impact |
control vs.
control+impact |
|
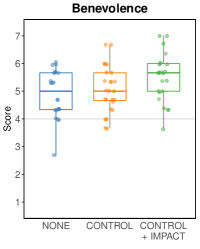
| Benevolence | 0.16 () | 0.61 () | 0.45 () |
| Trusting beliefs | -0.01 () | 0.38 () | 0.40 () |
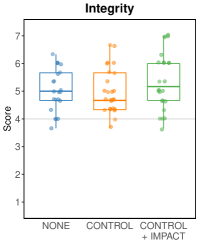
| Transparency | 0.29 () | 1.04 ()** | 0.74 ()* |
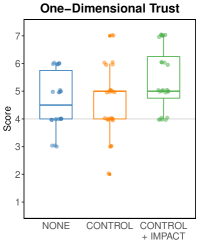
| One-dimens. trust | 0.00 () | 0.78 () | 0.78 () |
| Multidimens. trust | 0.15 () | 0.55 ()* | 0.40 () |
| Preference revision | 0.33 () | 0.43 () | 0.10 () |
| *, **, non-significant results () are greyed out | |||
3.4. Data Analysis
We analysed the collected quantitative data in R 4.2.1. To compare the three research groups in terms of trust and control perceptions, measured as an average of several Likert-type questions, we first conducted one-way ANOVA tests after checking the requirements: independence was guaranteed by the randomised set-up, assuming a normal distribution was plausible given the central limit theorem, and equal variances were verified with F-tests. Then, constructs that differed in at least two groups () were compared in more detail with unpaired t-tests, which assume the same as ANOVA. To compare trust measured with a single Likert-type question, we applied Mann-Whitney U tests to avoid normality assumptions. All t-tests and Mann-Whitney U tests used as threshold for significance and were one-sided with alternative hypothesis that groups with more functionalities score higher.
To get further insights into differences between research groups, we thematically analysed (Braun and Clarke, 2012) the qualitative feedback stemming from the open questions in our questionnaire. For presentation here, we translated the original Dutch responses to English, only correcting grammar and spelling.
4. Results
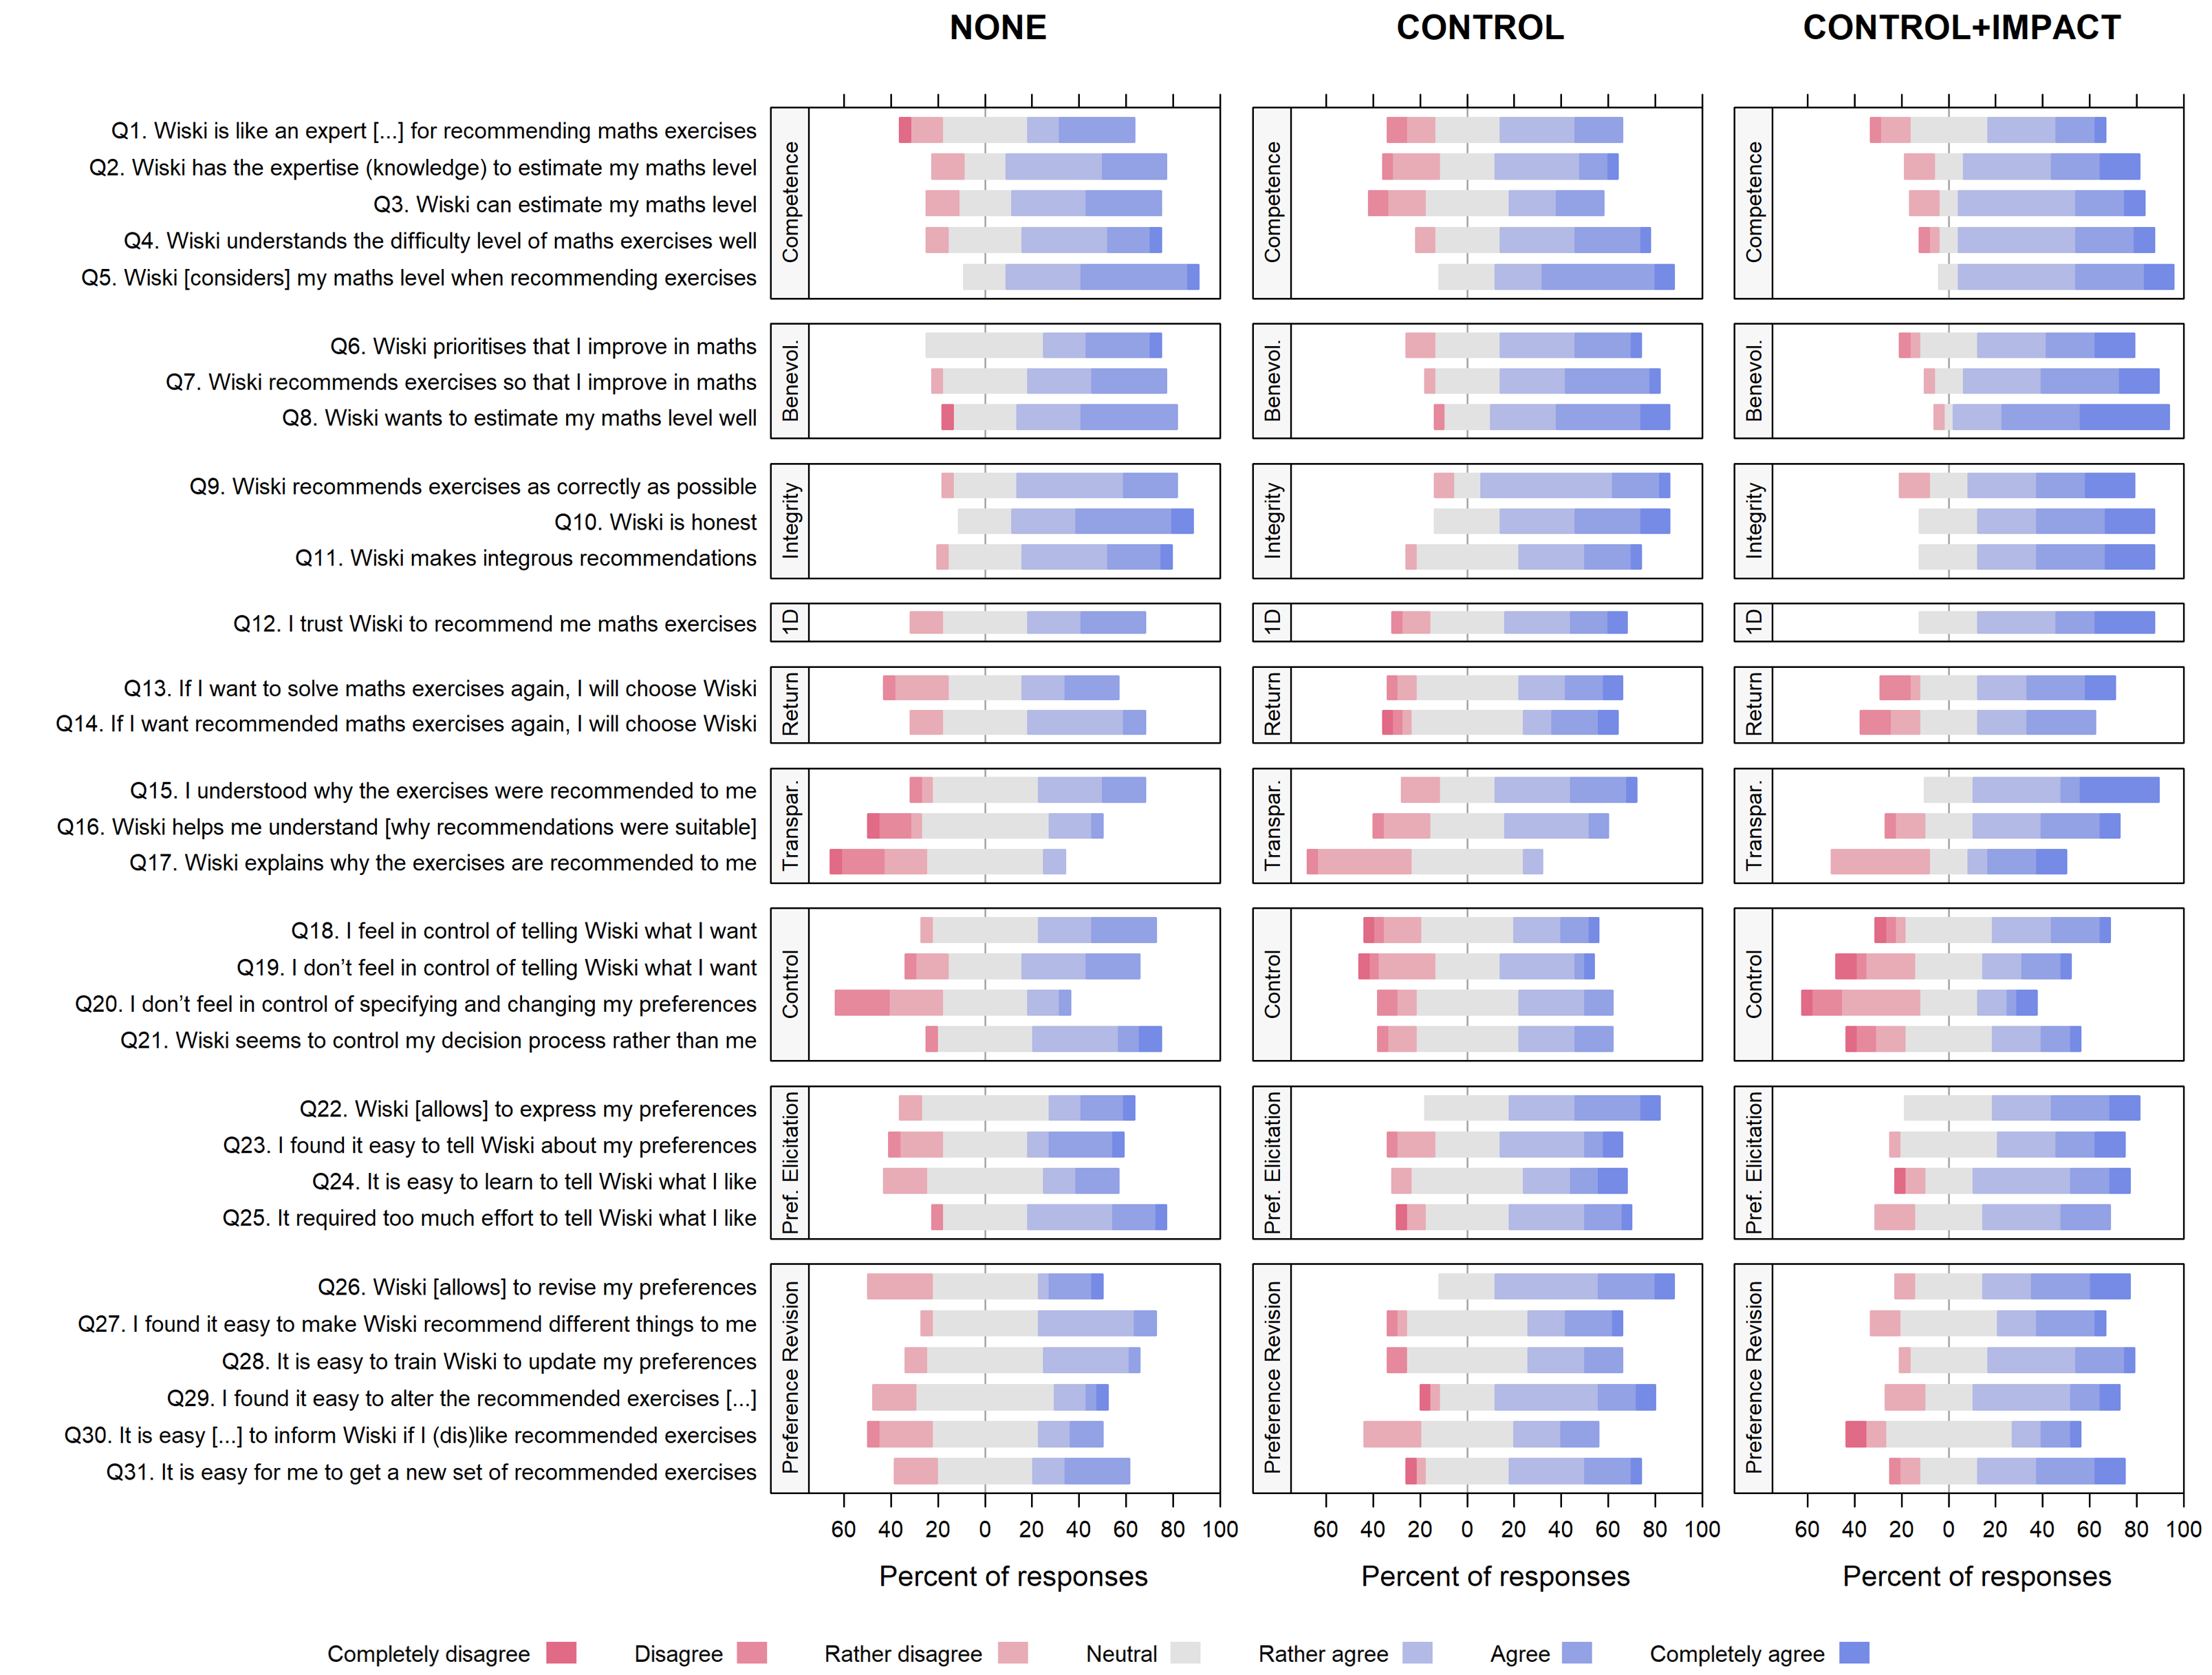
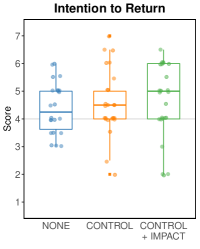
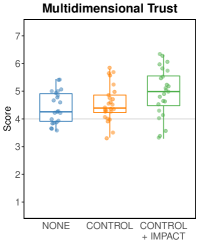
Figure 6 shows the number of participants per grade, equally distributed over the three research groups. To get a detailed understanding of how participants filled out the Likert-type questions, Figure 7 depicts the distribution of responses in each research group. In turn, Figure 8 gives a more aggregated view of participants’ responses per research group. Recall that multidimensional trust is the average of trusting beliefs, intention to return, and transparency. Overall, the median scores of all measured constructs lay between neutral and rather agree. ANOVA tests found that competence, integrity, intention to return, control, and preference elicitation did not differ significantly in the three research groups ().


Fully described in the caption and text.
4.1. Effects Without Control or Seeing Its Impact
Qualitative responses confirmed that most participants in none trusted the platform overall. Over one third of the participants seemed to have based their trust on the platform’s design and utility: they found that “the website looked professional,” was “good for practising for tests,” was “a good way to practise maths to improve,” and seemed to contain exercises that “fit well to the subject matter.” Furthermore, two participants believed the platform was developed by teachers or experts. Another third of the participants commented on whether exercises had a suitable difficulty level. In case they found exercises well-tailored, participants appeared trusting, for example, “The website looks […] trustworthy. I also have the feeling that the exercises are of a good level.” Conversely, a few participants appeared distrusting or hesitant because they “often got the same questions they had already answered correctly before,” which gave them the feeling their mastery level stagnated and they could memorise answers. Finally, four participants alluded to potentially different trust perceptions in the long term: “I have not been able to practise and use the site enough, so I cannot give a good final assessment either (at the moment).”
Thirteen participants in none commented on obtaining control over recommended exercises. Apart from one indifferent individual, all of them were in favour of extra control. Only three, however, clarified why: “This allows you to give a bit of direction to what exercises you want yourself. Also, if you perform a bit less well, you still get some more difficult exercises to see what they entail.”
4.2. Effects of Controlling Recommendations
The first column in Table 1 shows that one-sided tests did not reveal statistical differences between none and control (). Thus, our sample did not provide evidence against equal means for any measured construct. Only transparency and preference revision were borderline non-significant.
The qualitative responses on trust showed that two thirds of the participants in control seemed trusting and mostly supported that perception by the platform’s ability to tailor exercises: “It seems reliable at first sight and it also asks good questions adapted to your maths level”; “It can assess your level and provide further exercises to raise your level”; and “[I trust Wiski] if you can enter your own level.” Furthermore, similar to the responses in none, some participants referred to the platform’s “professional” design and utility to “learn something new.” In addition, two participants mentioned repeatedly occurring exercises but did not seem troubled by that: “Wiski knows when I have some difficulties with exercises and when I don’t. That’s why difficult exercises are recommended again.”
There were, however, also mixed trusting sentiments: while six participants did see benefits in our platform for casual practice, they hesitated to blindly adopt it in the long term for two reasons. First, some were bothered by the algorithmic nature of recommendations: “It’s a programme and not a teacher so I don’t quite trust it” and “[It’s] just an AI […]. Wiski is good but I’d rather seek advice from a physical person.” Two quotes might explain this sentiment: “It remains a computer system that can always be flawed” and “It only has a limited view of my maths skills.” Second, practice in the context of preparing tests or exams might require the presence of a teacher: “Sometimes teachers have their own way of asking questions and this may not always match the exercises offered by Wiski.”
Furthermore, all respondents in control and control+impact were very positive about the feature to control recommendations. The ability to modify the difficulty level of recommended exercises was especially appreciated to not “get stuck” when “you find the exercises too difficult or too easy” and when “you want to try something harder but also go for something easy once in a while.” Yet, one participant noted that while “the slider is nice to make small adjustments, it’s not convenient to specifically choose a new level because [they] wanted to go up 1 level in difficulty and went up 2 levels,” alluding to the five mastery levels depicted in Figures 1 and 3. Someone else agreed that it was indeed “difficult to find the perfect level.” Finally, one participant admitted they were “not sure whether [Wiski] understood [they] wanted slightly more difficult exercises” when using the slider.

4.3. Effects of Visualising the Impact of Control
The second and third columns in Table 1 show the results of comparing none to control+impact, and control to control+impact, respectively. Both one-dimensional trust and multidimensional trust increased significantly . The latter relates to an increase in two of its components: trusting beliefs and transparency. First, trusting beliefs increased due to higher perceived benevolence. Second, participants perceived the platform as significantly more transparent, with the average score in control+impact lying 1 point higher than in none. Regarding control, however, only preference revision was deemed significantly higher in control+impact, compared to none.
In control+impact, most qualitative responses regarding trust were positive. Similar to control, two thirds of the respondents focused on how well exercises were tailored. Most of these participants trusted the platform and highlighted that exercises were well-tailored: “I think Wiski does give exercises at my level. It’s nice that when you get a lot of exercises right, you get more difficult exercises to challenge yourself. You notice that they get harder, therefore I trust the recommended exercises” and “[It’s] handy that this platform can estimate your level, the exercises recommended by Wiski are therefore well fit.” Yet, three participants were rather distrustful because exercises seemed ill-tailored or repetitive to them: “I have now made some exercises and have not yet found the level that suits me. So I am more inclined to make exercises in my textbook because I know we should be able to achieve that level.” Other participants seemed to prefer consulting a teacher or using Wiski only for supplementary exercises: “I think Wiski is well-made and does its best to help but I don’t think it can really determine my maths level.” Finally, two participants touched upon long-term trust: “It’s hard to say whether I fully trust it after just a few exercises.”
Few participants in control+impact commented on the feature to see their control’s impact, yet those who did found it useful to see their evolution and current level. In contrast, in none and control together, most participants commented on whether they would have liked a screen similar to Figure 3; all but one would. Many comments tapped into seeing and understanding one’s current mastery level: “This can be useful in several ways to see why you are at a certain level” and “Then you can see how well some exercises go.” One participant wrote: “That’s pretty handy to see how bad you are at maths.” Another frequent related theme was the possibility to see one’s evolution: “That would be useful because then you know how you are progressing.” Finally, one participant brought up motivation, stating “I think this could also be motivating.”
4.4. Correlations
Figure 9 shows the relations between all measured trust-related and control-related constructs. Regarding the trust-related constructs, we found that competence, benevolence and integrity were moderately correlated to one another and were equally correlated with one-dimensional trust (all around ). Furthermore, intention to return turned out to be most correlated to competence (). Regarding the control-related constructs, preference elicitation and preference revision correlated strongly (), but were barely correlated to control. In fact, control had little to no linear relationship with any of the constructs. Finally, the most correlated pair of trust-related and control-related constructs consisted of transparency and preference revision (), which is still relatively low as one construct explains only 25% of the variance in the other.
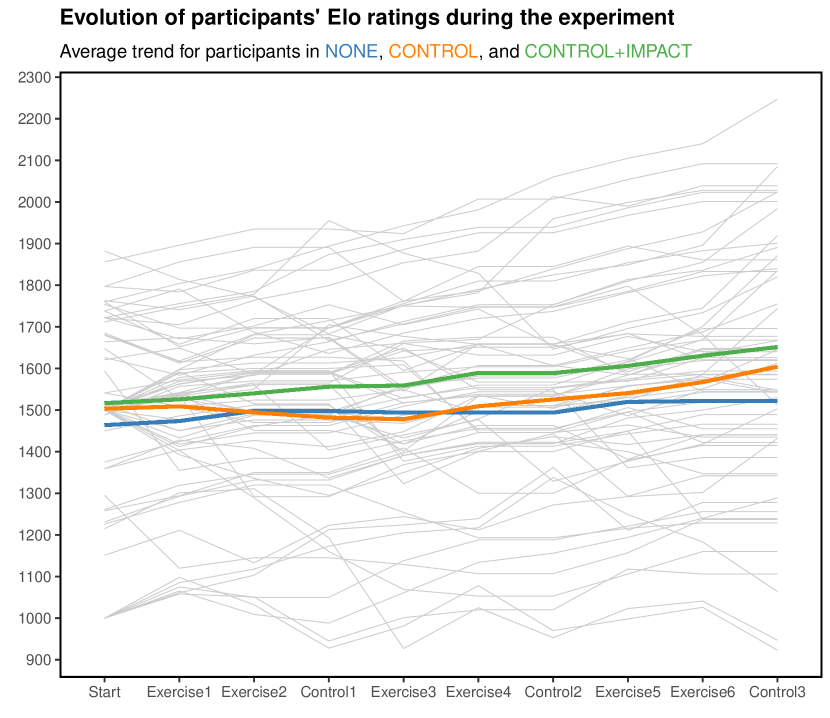

4.5. Elo Ratings
Figure 10 shows how participants’ Elo ratings evolved during the experiment. In all research groups, the ratings gradually increased and finally participants in none had a lower average increase (58) than participants in control (101) and control+impact (135). Yet, the trends and Figure 11 also show that participants in control and control+impact most often increased their mastery level further after completing an exercise series. Ignoring Elo changes due to control, the average Elo increased with 60 in control and 98 in control+impact. According to one-sided t-tests, however, these average Elo growths were not significantly larger than in none (). Figure 11 furthermore shows that participants used the control mechanism reasonably: most dots are in the top right quadrant, indicating that participants often further increased their mastery level after a successful exercise series; the left quadrants show that participants rarely boosted their mastery level after an unsuccessful exercise series and instead kept or downgraded it.
5. Discussion
This section interprets our results and answers our research questions. Based on our findings, we reflect upon implications for the explainable AI field and real-world e-learning platforms.
5.1. Sanity Check for Responses About Control
Before interpreting our results, we take a closer look at the findings regarding control. First, the quantitative results showed no higher sense of control in research groups with control, compared to the baseline without control. This unexpected result could be due to the measurement instrument rather than an actual lack of control: Figure 7 shows quite polarised responses on Q18–Q21, indicating that the questions may have been interpreted differently because they were too broad. In addition, the qualitative data confirmed that participants in control and control+impact were very aware of the control mechanism and Figure 11 shows that they often used it. Second, preference elicitation was perceived equally amongst the three research groups. This was expected as participants could only indicate initial preferences by setting their initial mastery level and choosing maths topics. Third, also as expected, preference revision increased (almost) significantly when the control mechanism was added, but not when the control’s impact was visualised. These observations support the sanity of our results.
5.2. Control Does Not Affect Trust but Stimulates Self-Reflection
RQ1 was concerned with how a control mechanism affects trust in our e-learning platform. Table 1 contains no evidence for significant effects on any of the measured trust components; only perceived transparency was borderline. The fact that one-dimensional trust did not differ significantly in none and control suggests participants did not consider the control mechanism a major factor for calibrating their trust.
However, the qualitative responses on trust interestingly revealed more self-reflection. Specifically, while participants in none most often described the platform’s utility and design while discussing trust, participants who could control recommendations spontaneously referred twice as much to whether exercises were tailored to their personal mastery level. Some participants even reflected on the recommendation algorithm itself, questioning whether it was as competent as teachers. Thus, our qualitative findings suggest that control mechanisms similar to ours foster awareness of an underlying manipulable algorithm. Growing such awareness seems very valuable in a world that becomes permeated by applications relying on algorithmic decision-making, so future experiments could investigate whether and why this effect holds in larger samples. One plausible explanation could be that controlling mechanisms are uncommon in current e-learning platforms and therefore caught participants’ attention.
5.3. Seeing the Impact of Control Grows Trust
RQ2 asked how visualising the impact of control influences adolescents’ trust in our e-learning platform. Our results showed a significant increase in one-dimensional trust, which suggests that the visualisation played a big role in growing trust. Multidimensional trust also increased significantly, partly due to a higher perceived benevolence. This could be explained by the following observation: Figures 10 and 11 show that most exercise series led to an increase in Elo rating, which implies that participants in control+impact mostly saw increasing mastery evolutions. Thus, it seems plausible that participants who saw the visualisation considered our platform as more benevolent than participants who did not.
5.4. Visualising the Impact of Control is a Kind of Explanation
The most heavily changed trusting component was transparency: participants who saw their control’s impact visualised considered the recommendations as more transparent. This suggests that participants experienced the visualisation as a sort of explanation. However, at first sight, it is not entirely clear what part of the recommendation process this explanation clarified for them. Comparing the responses for Q15–Q17 in Figure 7, we observe that roughly half of the responses for Q17 were negative, whereas most responses for Q15 and Q16 were positive. This seems to imply that participants did not view the visualisation of their control’s impact as a direct explanation for why they received specific recommendations; which they indeed should not have. Rather, the visualisation arguably acted as an indirect explanation: participants felt they had a better understanding of why recommendations were suitable for them because they could repeatedly see how the e-learning platform estimated and modified their mastery level. Overall, visualising the impact of control seems to have reinforced participants’ mental model (Johnson-Laird, 1983; Kulesza et al., 2012) of the recommendation system by gradually clarifying the behaviour of a crucial component of the recommender, namely iterative estimation of learners’ mastery level.
5.5. Implications for Explainable AI Research
Our findings potentially have interesting research implications for the broader field of explainable AI. First, visual explanations intended for a lay audience may not need to explain complete algorithms in detail. Instead, explaining crucial components could suffice when complemented with a global reasoning rationale of the algorithm. In our case, this global reasoning rationale was provided as a simple sentence on the practice page (“You will automatically get the two exercises that best suit your level” in Figure 5). Another provoking idea is that control by itself could increase transparency. This turned out to be the case in our sample, although the increase was borderline non-significant. We hypothesise that on our platform the combination of exercising control and seeing the difficulty level of subsequently recommended exercises acted as a kind of model inspection (Guidotti et al., 2019). In other words, participants could steer the recommendation algorithm and then see the impact on outcomes of the recommendation algorithm. If future research could confirm our hypothesis, this might be one of the earliest examples of effective model inspection with adolescents. Third, the qualitative responses regarding motivation open up research tracks on whether (visual) explanations can inherently motivate students to, for example, practise more, challenge themselves more, or – being hopeful – even appreciate maths more as a whole.
5.6. Taking a Step Back: Technology-Enhanced Learning and Control
Before we conclude, we briefly reflect upon control in e-learning. How much control should students get and does that imply taking control away from teachers? Should students always see their control’s impact with respect to their mastery level?
Overall, students received our platform’s control mechanism enthusiastically and seemed to have used it reasonably. The faster increase in Elo rating for students with control also suggests that the control mechanism allowed them to more quickly converge towards exercises with difficulty levels that best suited them. Moreover, the control mechanism and its accompanying impact visualisation seemed to have prompted students to think more consciously about which difficulty levels they could handle and how their mastery level changed. This is an important metacognitive skill, which is crucial in self-regulated learning (Zimmerman, 1990). For these reasons, we believe giving control to students can be an asset for e-learning platforms.
Yet, we see at least two nuances. First, giving too much control to students can be disadvantageous when it causes discomfort because of the responsibility it entails (Mabbott and Bull, 2006). In addition, students could abuse control over their mastery level in evaluative contexts: artificially decreasing their mastery level could allow them to obtain higher success rates when solving exercises, and artificially increasing it could trick inattentive teachers into overestimating their abilities. Thus, it is important to balance the amount of control with factors such as pedagogical responsibility and the use context and to not overly rely on Elo ratings for evaluation purposes. Second, providing students with control does not make teachers redundant. In our study, participants highlighted the still valuable role of teachers: providing extra feedback on students’ progress, and verifying that exercises on the e-learning system are aligned with the curriculum and their usual style of interrogating. Furthermore, by monitoring or adapting students’ mastery levels, teachers could additionally guide students who under- or overestimate themselves because of the Dunning-Kruger effect (Dunning, 2011).
Our visualisation of how control affected mastery level, and thus recommended exercises, was well-received too. However, some comments regarding motivation made us realise the potentially demotivating effects of frequently showing downward evolutions in students’ mastery levels. Therefore, we argue that visualisations related to mastery level should be shown sufficiently infrequent to avoid potential negative motivational effects, yet frequently enough to allow intervention in case of learning issues. Such interventions could be facilitated by e-learning platforms in the form of alerts that inform students when it seems advisable they ask teachers for additional support. In line with teachers’ desires in our pilot study, those alerts could also be shown to teachers so they can intervene, similar to existing work in the learning analytics community (Denden et al., 2019; Akçapınar et al., 2019).
5.7. Limitations and Future Work
Our research has several limitations which restrict how well our findings generalise. First, our sample was relatively small so some findings may not hold in larger studies and we could not investigate differences between age groups. Although we controlled for multiple testing by only conducting t-tests when ANOVA indicated a group-wise difference, false positive differences could remain. Second, since our study was not focused on developing a highly accurate recommender system, we generated recommendations with a simple Elo rating system. More sophisticated algorithms such as multivariate Elo-based models (Abdi et al., 2019) or knowledge tracing (Guo et al., 2021) could be considered for platforms deployed in the real world, especially because competence is rather highly correlated to intention to return (see Figure 9). Third, the mechanism to steer recommendations was quite simple and only affected recommended exercises indirectly by altering mastery levels. Future studies with adolescents in e-learning could further study more advanced control mechanisms that affect recommendations directly, for example steering through interactive visualisations. Fourth, as our study was conducted in a class context, it is possible that some students noticed that their peers were shown a different version of our platform. Although we did not observe copying during the study, we are wary of adolescents’ resourcefulness to copy and the bias it may have entailed. Fifth, as some participants indicated, our study was restricted to capturing trust while participants were arguably still familiarising themselves with the recommender and control mechanism. In this learning phase (Yu et al., 2017), trust perceptions can change briskly, for example due to encountering unexpected behaviour such as repeated recommendations (Nourani et al., 2020; Yu et al., 2017; Holliday et al., 2016). Thus, as briefly using our platform might have hampered reliable long-term trust assessment, our results should be interpreted cautiously. Sixth, our results regarding transparency relied on self-reported understanding. Future research could complement transparency measurements with testing effective understanding, for example through adjusted tasks. Overall, we hope our suggestions help to pursue research into providing adolescents with control over recommendations in e-learning.
6. Conclusion
Our research explored how a control mechanism for steering recommended exercises and a visualisation of the control’s impact influence adolescents’ trust in an e-learning platform. We measured trust both with a single Likert-type question and as a multidimensional construct of trusting beliefs, intention to return, and perceived transparency. In addition, we collected qualitative feedback to further contextualise students’ responses. Our randomised controlled experiment with 76 middle and high school students showed that our control mechanism did not significantly change any trusting perception. However, adolescents appreciated the feature and seemed to reflect more upon their mastery level and the recommendation system, which is highly favourable in the context of self-regulated learning. Furthermore, visualising the control’s impact did increase trust and perceived understanding, which suggests several implications for the broader field of explainable AI. In sum, even though our study had limitations, we hope our methods, designs, and findings inspire other researchers to further explore the link between control mechanisms, explainable AI, and motivational techniques, especially in e-learning and targeting adolescents.
Acknowledgements.
We thank all students who participated in our study, their parents for consenting, and their teachers for inviting us into their classrooms. This work was supported by Research Foundation–Flanders (FWO, grant G0A3319N), Flanders Innovation & Entrepreneurship (imec.icon grant HB.2020.2373), and KU Leuven (grant C14/21/072).References
- (1)
- Abdi et al. (2019) Solmaz Abdi, Hassan Khosravi, Shazia Sadiq, and Dragan Gasevic. 2019. A Multivariate Elo-Based Learner Model for Adaptive Educational Systems. In International Educational Data Mining Society. International Educational Data Mining Society, Montreal, Canada, ED599177.
- Abdi et al. (2020) Solmaz Abdi, Hassan Khosravi, Shazia Sadiq, and Dragan Gasevic. 2020. Complementing Educational Recommender Systems with Open Learner Models. In Proceedings of the Tenth International Conference on Learning Analytics & Knowledge. Association for Computing Machinery, New York, NY, USA, 360–365.
- Abdul et al. (2018) Ashraf Abdul, Jo Vermeulen, Danding Wang, Brian Y. Lim, and Mohan Kankanhalli. 2018. Trends and Trajectories for Explainable, Accountable and Intelligible Systems: An HCI Research Agenda. In Proceedings of the 2018 CHI Conference on Human Factors in Computing Systems (CHI ’18). Association for Computing Machinery, New York, NY, USA, 1–18. https://doi.org/10.1145/3173574.3174156
- Aher and Lobo (2013) Sunita B. Aher and L. M. R. J. Lobo. 2013. Combination of Machine Learning Algorithms for Recommendation of Courses in E-Learning System Based on Historical Data. Knowledge-Based Systems 51 (Oct. 2013), 1–14. https://doi.org/10.1016/j.knosys.2013.04.015
- Akçapınar et al. (2019) Gökhan Akçapınar, Arif Altun, and Petek Aşkar. 2019. Using Learning Analytics to Develop Early-Warning System for at-Risk Students. International Journal of Educational Technology in Higher Education 16, 1 (Dec. 2019), 40. https://doi.org/10.1186/s41239-019-0172-z
- Amatriain et al. (2009) Xavier Amatriain, Josep M. Pujol, Nava Tintarev, and Nuria Oliver. 2009. Rate It Again: Increasing Recommendation Accuracy by User Re-Rating. In Proceedings of the Third ACM Conference on Recommender Systems - RecSys ’09. ACM Press, New York, New York, USA, 173. https://doi.org/10.1145/1639714.1639744
- Andjelkovic et al. (2016) Ivana Andjelkovic, Denis Parra, and John O’Donovan. 2016. Moodplay: Interactive Mood-based Music Discovery and Recommendation. In Proceedings of the 2016 Conference on User Modeling Adaptation and Personalization. ACM, Halifax Nova Scotia Canada, 275–279. https://doi.org/10.1145/2930238.2930280
- Barredo Arrieta et al. (2020) Alejandro Barredo Arrieta, Natalia Díaz-Rodríguez, Javier Del Ser, Adrien Bennetot, Siham Tabik, Alberto Barbado, Salvador Garcia, Sergio Gil-Lopez, Daniel Molina, Richard Benjamins, Raja Chatila, and Francisco Herrera. 2020. Explainable Artificial Intelligence (XAI): Concepts, Taxonomies, Opportunities and Challenges toward Responsible AI. Information Fusion 58 (June 2020), 82–115. https://doi.org/10.1016/j.inffus.2019.12.012
- Bollen et al. (2010) Dirk Bollen, Bart P. Knijnenburg, Martijn C. Willemsen, and Mark Graus. 2010. Understanding Choice Overload in Recommender Systems. In Proceedings of the Fourth ACM Conference on Recommender Systems - RecSys ’10. ACM Press, Barcelona, Spain, 63. https://doi.org/10.1145/1864708.1864724
- Bostandjiev et al. (2012) Svetlin Bostandjiev, John O’Donovan, and Tobias Höllerer. 2012. TasteWeights: A Visual Interactive Hybrid Recommender System. In Proceedings of the Sixth ACM Conference on Recommender Systems (RecSys ’12). Association for Computing Machinery, New York, NY, USA, 35–42. https://doi.org/10.1145/2365952.2365964
- Braun and Clarke (2012) Virginia Braun and Victoria Clarke. 2012. Thematic Analysis. In APA Handbook of Research Methods in Psychology, Vol 2: Research Designs: Quantitative, Qualitative, Neuropsychological, and Biological. American Psychological Association, Washington, DC, US, 57–71. https://doi.org/10.1037/13620-004
- Bull and Kay (2010) Susan Bull and Judy Kay. 2010. Open Learner Models. In Advances in Intelligent Tutoring Systems, Janusz Kacprzyk, Roger Nkambou, Jacqueline Bourdeau, and Riichiro Mizoguchi (Eds.). Vol. 308. Springer Berlin Heidelberg, Berlin, Heidelberg, 301–322. https://doi.org/10.1007/978-3-642-14363-2_15
- Chen and Pu (2012) Li Chen and Pearl Pu. 2012. Critiquing-Based Recommenders: Survey and Emerging Trends. User Modeling and User-Adapted Interaction 22, 1-2 (April 2012), 125–150. https://doi.org/10.1007/s11257-011-9108-6
- Conati et al. (2018) Cristina Conati, Kaska Porayska-Pomsta, and Manolis Mavrikis. 2018. AI in Education Needs Interpretable Machine Learning: Lessons from Open Learner Modelling. https://doi.org/10.48550/arXiv.1807.00154 arXiv:1807.00154 [cs]
- Cramer et al. (2008) Henriette Cramer, Vanessa Evers, Satyan Ramlal, Maarten van Someren, Lloyd Rutledge, Natalia Stash, Lora Aroyo, and Bob Wielinga. 2008. The Effects of Transparency on Trust in and Acceptance of a Content-Based Art Recommender. User Modeling and User-Adapted Interaction 18, 5 (Nov. 2008), 455–496. https://doi.org/10.1007/s11257-008-9051-3
- Dahl and Fykse (2018) Ole Halvor Dahl and Olav Fykse. 2018. Combining Elo Rating and Collaborative Filtering to Improve Learner Ability Estimation in an E-Learning Context. Master’s thesis. NTNU.
- Denden et al. (2019) Mouna Denden, Ahmed Tlili, Fathi Essalmi, Mohamed Jemni, Maiga Chang, Kinshuk, and Ronghuai Huang. 2019. iMoodle: An Intelligent Gamified Moodle to Predict “at-Risk” Students Using Learning Analytics Approaches. In Data Analytics Approaches in Educational Games and Gamification Systems, Ahmed Tlili and Maiga Chang (Eds.). Springer Singapore, Singapore, 113–126. https://doi.org/10.1007/978-981-32-9335-9_6
- Dereu (2022) Leen Dereu. 2022. De juiste wiskunde aanbevelen op digitale leeromgevingen: het effect van controle over aanbevolen oefeningen. Master’s thesis. KU Leuven, Faculty of Engineering Science.
- Drachsler et al. (2015) Hendrik Drachsler, Katrien Verbert, Olga C. Santos, and Nikos Manouselis. 2015. Panorama of Recommender Systems to Support Learning. In Recommender Systems Handbook, Francesco Ricci, Lior Rokach, and Bracha Shapira (Eds.). Springer US, Boston, MA, 421–451. https://doi.org/10.1007/978-1-4899-7637-6_12
- Dreyfus (2004) Stuart E. Dreyfus. 2004. The Five-Stage Model of Adult Skill Acquisition. Bulletin of Science, Technology & Society 24, 3 (June 2004), 177–181. https://doi.org/10.1177/0270467604264992
- Dunning (2011) David Dunning. 2011. Chapter Five - The Dunning–Kruger Effect: On Being Ignorant of One’s Own Ignorance. In Advances in Experimental Social Psychology, James M. Olson and Mark P. Zanna (Eds.). Vol. 44. Academic Press, San Diego, CA, USA, 247–296. https://doi.org/10.1016/B978-0-12-385522-0.00005-6
- Ekstrand et al. (2015) Michael D. Ekstrand, Daniel Kluver, F. Maxwell Harper, and Joseph A. Konstan. 2015. Letting Users Choose Recommender Algorithms: An Experimental Study. In Proceedings of the 9th ACM Conference on Recommender Systems. ACM, Vienna Austria, 11–18. https://doi.org/10.1145/2792838.2800195
- Elo (1978) Arpad E. Elo. 1978. The Rating of Chessplayers, Past and Present. Arco Pub, New York.
- Farzan and Brusilovsky (2011) Rosta Farzan and Peter Brusilovsky. 2011. Encouraging User Participation in a Course Recommender System: An Impact on User Behavior. Computers in Human Behavior 27, 1 (Jan. 2011), 276–284. https://doi.org/10.1016/j.chb.2010.08.005
- Fitton et al. (2013) Daniel Fitton, Janet C C. Read, and Matthew Horton. 2013. The Challenge of Working with Teens as Participants in Interaction Design. In CHI ’13 Extended Abstracts on Human Factors in Computing Systems on - CHI EA ’13. ACM Press, Paris, France, 205. https://doi.org/10.1145/2468356.2468394
- Gallego et al. (2013) Daniel Gallego, Enrique Barra, Aldo Gordillo, and Gabriel Huecas. 2013. Enhanced Recommendations for E-Learning Authoring Tools Based on a Proactive Context-Aware Recommender. In 2013 IEEE Frontiers in Education Conference (FIE). IEEE, Oklahoma City, OK, USA, 1393–1395. https://doi.org/10.1109/FIE.2013.6685060
- García et al. (2009) Enrique García, Cristóbal Romero, Sebastián Ventura, and Carlos de Castro. 2009. An Architecture for Making Recommendations to Courseware Authors Using Association Rule Mining and Collaborative Filtering. User Modeling and User-Adapted Interaction 19, 1-2 (Feb. 2009), 99–132. https://doi.org/10.1007/s11257-008-9047-z
- Garcia-Martinez and Hamou-Lhadj (2013) Salvador Garcia-Martinez and Abdelwahab Hamou-Lhadj. 2013. Educational Recommender Systems: A Pedagogical-Focused Perspective. In Multimedia Services in Intelligent Environments, George A. Tsihrintzis, Maria Virvou, and Lakhmi C. Jain (Eds.). Vol. 25. Springer International Publishing, Heidelberg, 113–124. https://doi.org/10.1007/978-3-319-00375-7_8
- Göker and Thompson (2000) Mehmet H Göker and Cynthia A Thompson. 2000. The Adaptive Place Advisor: A Conversational Recommendation System.
- Guidotti et al. (2019) Riccardo Guidotti, Anna Monreale, Salvatore Ruggieri, Franco Turini, Fosca Giannotti, and Dino Pedreschi. 2019. A Survey of Methods for Explaining Black Box Models. Comput. Surveys 51, 5 (Jan. 2019), 1–42. https://doi.org/10.1145/3236009
- Gunning and Aha (2019) David Gunning and David Aha. 2019. DARPA’s Explainable Artificial Intelligence (XAI) Program. AI Magazine 40, 2 (June 2019), 44–58. https://doi.org/10.1609/aimag.v40i2.2850
- Guo et al. (2021) Xiaopeng Guo, Zhijie Huang, Jie Gao, Mingyu Shang, Maojing Shu, and Jun Sun. 2021. Enhancing Knowledge Tracing via Adversarial Training. In Proceedings of the 29th ACM International Conference on Multimedia. ACM, Virtual Event China, 367–375. https://doi.org/10.1145/3474085.3475554
- Han and Schulz (2020) Wenkai Han and Hans-Jorg Schulz. 2020. Beyond Trust Building — Calibrating Trust in Visual Analytics. In 2020 IEEE Workshop on TRust and EXpertise in Visual Analytics (TREX). IEEE, Salt Lake City, UT, USA, 9–15. https://doi.org/10.1109/TREX51495.2020.00006
- Harambam et al. (2019) Jaron Harambam, Dimitrios Bountouridis, Mykola Makhortykh, and Joris van Hoboken. 2019. Designing for the Better by Taking Users into Account: A Qualitative Evaluation of User Control Mechanisms in (News) Recommender Systems. In Proceedings of the 13th ACM Conference on Recommender Systems. ACM, Copenhagen Denmark, 69–77. https://doi.org/10.1145/3298689.3347014
- He et al. (2016) Chen He, Denis Parra, and Katrien Verbert. 2016. Interactive Recommender Systems: A Survey of the State of the Art and Future Research Challenges and Opportunities. Expert Systems with Applications 56 (Sept. 2016), 9–27. https://doi.org/10.1016/j.eswa.2016.02.013
- Heiberger and Robbins (2014) Richard M. Heiberger and Naomi B. Robbins. 2014. Design of Diverging Stacked Bar Charts for Likert Scales and Other Applications. Journal of Statistical Software 57, 5 (2014), 1–32. https://doi.org/10.18637/jss.v057.i05
- Hijikata et al. (2012) Yoshinori Hijikata, Yuki Kai, and Shogo Nishida. 2012. The Relation between User Intervention and User Satisfaction for Information Recommendation. In Proceedings of the 27th Annual ACM Symposium on Applied Computing - SAC ’12. ACM Press, Trento, Italy, 2002. https://doi.org/10.1145/2245276.2232109
- Hind (2019) Michael Hind. 2019. Explaining Explainable AI. XRDS: Crossroads, The ACM Magazine for Students 25, 3 (April 2019), 16–19. https://doi.org/10.1145/3313096
- Hoff and Bashir (2015) Kevin Anthony Hoff and Masooda Bashir. 2015. Trust in Automation: Integrating Empirical Evidence on Factors That Influence Trust. Human Factors: The Journal of the Human Factors and Ergonomics Society 57, 3 (May 2015), 407–434. https://doi.org/10.1177/0018720814547570
- Holliday et al. (2016) Daniel Holliday, Stephanie Wilson, and Simone Stumpf. 2016. User Trust in Intelligent Systems: A Journey Over Time. In Proceedings of the 21st International Conference on Intelligent User Interfaces. ACM, Sonoma California USA, 164–168. https://doi.org/10.1145/2856767.2856811
- Hooshyar et al. (2020) Danial Hooshyar, Margus Pedaste, Katrin Saks, Äli Leijen, Emanuele Bardone, and Minhong Wang. 2020. Open Learner Models in Supporting Self-Regulated Learning in Higher Education: A Systematic Literature Review. Computers & Education 154 (Sept. 2020), 103878. https://doi.org/10.1016/j.compedu.2020.103878
- Jameson and Schwarzkopf (2002) Anthony Jameson and Eric Schwarzkopf. 2002. Pros and Cons of Controllability: An Empirical Study. In Adaptive Hypermedia and Adaptive Web-Based Systems, Gerhard Goos, Juris Hartmanis, Jan van Leeuwen, Paul De Bra, Peter Brusilovsky, and Ricardo Conejo (Eds.). Vol. 2347. Springer Berlin Heidelberg, Berlin, Heidelberg, 193–202. https://doi.org/10.1007/3-540-47952-X_21
- Jannach et al. (2017) Dietmar Jannach, Sidra Naveed, and Michael Jugovac. 2017. User Control in Recommender Systems: Overview and Interaction Challenges. In E-Commerce and Web Technologies, Derek Bridge and Heiner Stuckenschmidt (Eds.). Vol. 278. Springer International Publishing, Cham, 21–33. https://doi.org/10.1007/978-3-319-53676-7_2
- Jin et al. (2020) Yucheng Jin, Nava Tintarev, Nyi Nyi Htun, and Katrien Verbert. 2020. Effects of Personal Characteristics in Control-Oriented User Interfaces for Music Recommender Systems. User Modeling and User-Adapted Interaction 30, 2 (April 2020), 199–249. https://doi.org/10.1007/s11257-019-09247-2
- Johnson-Laird (1983) Philip N. Johnson-Laird. 1983. Mental Models: Towards a Cognitive Science of Language, Inference, and Consciousnes. Harvard University Press, Cambridge, Massachusetts.
- Kadengye et al. (2015) Damazo T. Kadengye, Eva Ceulemans, and Wim Van Den Noortgate. 2015. Modeling Growth in Electronic Learning Environments Using a Longitudinal Random Item Response Model. The Journal of Experimental Education 83, 2 (April 2015), 175–202. https://doi.org/10.1080/00220973.2014.907226
- Kay and Kummerfeld (2019) Judy Kay and Bob Kummerfeld. 2019. From Data to Personal User Models for Life-Long, Life-Wide Learners. British Journal of Educational Technology 50, 6 (Nov. 2019), 2871–2884. https://doi.org/10.1111/bjet.12878
- Khanal et al. (2020) Shristi Shakya Khanal, P.W.C. Prasad, Abeer Alsadoon, and Angelika Maag. 2020. A Systematic Review: Machine Learning Based Recommendation Systems for e-Learning. Education and Information Technologies 25, 4 (July 2020), 2635–2664. https://doi.org/10.1007/s10639-019-10063-9
- Khosravi et al. (2022) Hassan Khosravi, Simon Buckingham Shum, Guanliang Chen, Cristina Conati, Yi-Shan Tsai, Judy Kay, Simon Knight, Roberto Martinez-Maldonado, Shazia Sadiq, and Dragan Gašević. 2022. Explainable Artificial Intelligence in Education. Computers and Education: Artificial Intelligence 3 (Jan. 2022), 100074. https://doi.org/10.1016/j.caeai.2022.100074
- Klinkenberg et al. (2011) S. Klinkenberg, M. Straatemeier, and H. L. J. van der Maas. 2011. Computer Adaptive Practice of Maths Ability Using a New Item Response Model for on the Fly Ability and Difficulty Estimation. Computers & Education 57, 2 (Sept. 2011), 1813–1824. https://doi.org/10.1016/j.compedu.2011.02.003
- Knijnenburg et al. (2012a) Bart P. Knijnenburg, Svetlin Bostandjiev, John O’Donovan, and Alfred Kobsa. 2012a. Inspectability and Control in Social Recommenders. In Proceedings of the Sixth ACM Conference on Recommender Systems - RecSys ’12. ACM Press, Dublin, Ireland, 43. https://doi.org/10.1145/2365952.2365966
- Knijnenburg et al. (2011) Bart P. Knijnenburg, Niels J.M. Reijmer, and Martijn C. Willemsen. 2011. Each to His Own: How Different Users Call for Different Interaction Methods in Recommender Systems. In Proceedings of the Fifth ACM Conference on Recommender Systems - RecSys ’11. ACM Press, Chicago, Illinois, USA, 141. https://doi.org/10.1145/2043932.2043960
- Knijnenburg et al. (2012b) Bart P. Knijnenburg, Martijn C. Willemsen, Zeno Gantner, Hakan Soncu, and Chris Newell. 2012b. Explaining the User Experience of Recommender Systems. User Modeling and User-Adapted Interaction 22, 4-5 (Oct. 2012), 441–504. https://doi.org/10.1007/s11257-011-9118-4
- Konstan and Riedl (2012) Joseph A. Konstan and John Riedl. 2012. Recommender Systems: From Algorithms to User Experience. User Modeling and User-Adapted Interaction 22, 1-2 (April 2012), 101–123. https://doi.org/10.1007/s11257-011-9112-x
- Krathwohl (2002) David R. Krathwohl. 2002. A Revision of Bloom’s Taxonomy: An Overview. Theory Into Practice 41, 4 (Nov. 2002), 212–218. https://doi.org/10.1207/s15430421tip4104_2
- Kulesza et al. (2012) Todd Kulesza, Simone Stumpf, Margaret Burnett, and Irwin Kwan. 2012. Tell Me More?: The Effects of Mental Model Soundness on Personalizing an Intelligent Agent. In Proceedings of the SIGCHI Conference on Human Factors in Computing Systems. ACM, Austin Texas USA, 1–10. https://doi.org/10.1145/2207676.2207678
- Lee and See (2004) John D. Lee and Katrina A. See. 2004. Trust in Automation: Designing for Appropriate Reliance. Human Factors 46, 1 (March 2004), 50–80. https://doi.org/10.1518/hfes.46.1.50_30392
- Leech (2002) Beth L. Leech. 2002. Asking Questions: Techniques for Semistructured Interviews. Political Science & Politics 35, 04 (Dec. 2002), 665–668. https://doi.org/10.1017/S1049096502001129
- Luo et al. (2020) Kai Luo, Hojin Yang, Ga Wu, and Scott Sanner. 2020. Deep Critiquing for VAE-based Recommender Systems. In Proceedings of the 43rd International ACM SIGIR Conference on Research and Development in Information Retrieval. Association for Computing Machinery, New York, NY, USA, 1269–1278.
- Mabbott and Bull (2006) Andrew Mabbott and Susan Bull. 2006. Student Preferences for Editing, Persuading, and Negotiating the Open Learner Model. In Intelligent Tutoring Systems, David Hutchison, Takeo Kanade, Josef Kittler, Jon M. Kleinberg, Friedemann Mattern, John C. Mitchell, Moni Naor, Oscar Nierstrasz, C. Pandu Rangan, Bernhard Steffen, Madhu Sudan, Demetri Terzopoulos, Dough Tygar, Moshe Y. Vardi, Gerhard Weikum, Mitsuru Ikeda, Kevin D. Ashley, and Tak-Wai Chan (Eds.). Vol. 4053. Springer Berlin Heidelberg, Berlin, Heidelberg, 481–490. https://doi.org/10.1007/11774303_48
- Manouselis et al. (2013) Nikos Manouselis, Hendrik Drachsler, Katrien Verbert, and Erik Duval. 2013. Recommender Systems for Learning. Springer New York, New York, NY. https://doi.org/10.1007/978-1-4614-4361-2
- McKnight et al. (2002) D. Harrison McKnight, Vivek Choudhury, and Charles Kacmar. 2002. Developing and Validating Trust Measures for E-Commerce: An Integrative Typology. Information Systems Research 13, 3 (Sept. 2002), 334–359. https://doi.org/10.1287/isre.13.3.334.81
- Michlík and Bieliková (2010) Pavel Michlík and Mária Bieliková. 2010. Exercises Recommending for Limited Time Learning. Procedia Computer Science 1, 2 (2010), 2821–2828. https://doi.org/10.1016/j.procs.2010.08.007
- Millecamp et al. (2018) Martijn Millecamp, Nyi Nyi Htun, Yucheng Jin, and Katrien Verbert. 2018. Controlling Spotify Recommendations: Effects of Personal Characteristics on Music Recommender User Interfaces. In Proceedings of the 26th Conference on User Modeling, Adaptation and Personalization. ACM, Singapore Singapore, 101–109. https://doi.org/10.1145/3209219.3209223
- Nourani et al. (2020) Mahsan Nourani, Joanie King, and Eric Ragan. 2020. The Role of Domain Expertise in User Trust and the Impact of First Impressions with Intelligent Systems. Proceedings of the AAAI Conference on Human Computation and Crowdsourcing 8 (Oct. 2020), 112–121.
- O’Donovan and Smyth (2005) John O’Donovan and Barry Smyth. 2005. Trust in Recommender Systems. In Proceedings of the 10th International Conference on Intelligent User Interfaces. ACM, San Diego California USA, 167–174. https://doi.org/10.1145/1040830.1040870
- O’Donovan et al. (2008) John O’Donovan, Barry Smyth, Brynjar Gretarsson, Svetlin Bostandjiev, and Tobias Höllerer. 2008. PeerChooser: Visual Interactive Recommendation. In Proceeding of the Twenty-Sixth Annual CHI Conference on Human Factors in Computing Systems - CHI ’08. ACM Press, Florence, Italy, 1085. https://doi.org/10.1145/1357054.1357222
- Ooge (2019) Jeroen Ooge. 2019. Het Personaliseren van Motivationele Strategieën En Gamificationtechnieken m.b.v. Recommendersystemen. Master’s thesis. KU Leuven, Faculteit Wetenschappen.
- Ooge et al. (2022) Jeroen Ooge, Shotallo Kato, and Katrien Verbert. 2022. Explaining Recommendations in E-Learning: Effects on Adolescents’ Trust. In 27th International Conference on Intelligent User Interfaces (IUI ’22). Association for Computing Machinery, New York, NY, USA, 93–105. https://doi.org/10.1145/3490099.3511140
- Pelánek (2016) Radek Pelánek. 2016. Applications of the Elo Rating System in Adaptive Educational Systems. Computers & Education 98 (July 2016), 169–179. https://doi.org/10.1016/j.compedu.2016.03.017
- Petrescu et al. (2021) Diana Andreea Petrescu, Diego Antognini, and Boi Faltings. 2021. Multi-Step Critiquing User Interface for Recommender Systems. In Fifteenth ACM Conference on Recommender Systems (RecSys ’21). Association for Computing Machinery, New York, NY, USA, 760–763. https://doi.org/10.1145/3460231.3478886
- Pu and Chen (2010) Pearl Pu and Li Chen. 2010. A User-Centric Evaluation Framework of Recommender Systems. In Proceedings of the ACM RecSys 2010 Workshop on User-Centric Evaluation of Recommender Systems and Their Interfaces (UCERSTI), Vol. 612. CEUR-WS.org, Barcelona, Spain, 8.
- Pu et al. (2011) Pearl Pu, Li Chen, and Rong Hu. 2011. A User-Centric Evaluation Framework for Recommender Systems. In Proceedings of the Fifth ACM Conference on Recommender Systems (RecSys ’11). Association for Computing Machinery, New York, NY, USA, 157–164. https://doi.org/10.1145/2043932.2043962
- Schaffer et al. (2015) James Schaffer, Tobias Hollerer, and John O’Donovan. 2015. Hypothetical Recommendation: A Study of Interactive Profile Manipulation Behavior for Recommender Systems. In Proceedings of the Twenty-Eighth International Florida Artificial Intelligence Research Society Conference. AAAI Press, Hollywood, Florida, 6.
- Tang and McCalla (2005) Tiffany Tang and Gordon McCalla. 2005. Smart Recommendation for an Evolving E-Learning System: Architecture and Experiment. International Journal on E-Learning 4, 1 (2005), 105–129.
- Torkamaan and Ziegler (2022) Helma Torkamaan and Jürgen Ziegler. 2022. Recommendations as Challenges: Estimating Required Effort and User Ability for Health Behavior Change Recommendations. In 27th International Conference on Intelligent User Interfaces. ACM, Helsinki Finland, 106–119. https://doi.org/10.1145/3490099.3511118
- Tsai and Brusilovsky (2019) Chun-Hua Tsai and Peter Brusilovsky. 2019. Explaining Recommendations in an Interactive Hybrid Social Recommender. In Proceedings of the 24th International Conference on Intelligent User Interfaces. ACM, Marina del Ray California, 391–396. https://doi.org/10.1145/3301275.3302318
- Tsai and Brusilovsky (2021) Chun-Hua Tsai and Peter Brusilovsky. 2021. The Effects of Controllability and Explainability in a Social Recommender System. User Modeling and User-Adapted Interaction 31, 3 (July 2021), 591–627. https://doi.org/10.1007/s11257-020-09281-5
- Vereschak et al. (2021) Oleksandra Vereschak, Gilles Bailly, and Baptiste Caramiaux. 2021. How to Evaluate Trust in AI-Assisted Decision Making? A Survey of Empirical Methodologies. Proceedings of the ACM on Human-Computer Interaction 5, CSCW2 (Oct. 2021), 327:1–327:39. https://doi.org/10.1145/3476068
- Wauters et al. (2012) Kelly Wauters, Piet Desmet, and Wim Van Den Noortgate. 2012. Item Difficulty Estimation: An Auspicious Collaboration between Data and Judgment. Computers & Education 58, 4 (May 2012), 1183–1193. https://doi.org/10.1016/j.compedu.2011.11.020
- Xiao and Benbasat (2007) Xiao and Benbasat. 2007. E-Commerce Product Recommendation Agents: Use, Characteristics, and Impact. MIS Quarterly 31, 1 (2007), 137. https://doi.org/10.2307/25148784
- Yu et al. (2017) Kun Yu, Shlomo Berkovsky, Ronnie Taib, Dan Conway, Jianlong Zhou, and Fang Chen. 2017. User Trust Dynamics: An Investigation Driven by Differences in System Performance. In Proceedings of the 22nd International Conference on Intelligent User Interfaces. ACM, Limassol Cyprus, 307–317. https://doi.org/10.1145/3025171.3025219
- Zhai et al. (2021) Xuesong Zhai, Xiaoyan Chu, Ching Sing Chai, Morris Siu Yung Jong, Andreja Istenic, Michael Spector, Jia-Bao Liu, Jing Yuan, and Yan Li. 2021. A Review of Artificial Intelligence (AI) in Education from 2010 to 2020. Complexity 2021 (April 2021), e8812542. https://doi.org/10.1155/2021/8812542
- Zimmerman (1990) Barry J. Zimmerman. 1990. Self-Regulated Learning and Academic Achievement: An Overview. Educational Psychologist 25, 1 (Jan. 1990), 3–17. https://doi.org/10.1207/s15326985ep2501_2
Appendix A Post-Study Questionnaire
| No. | English version | Dutch version |
|---|---|---|
| Competence | ||
| Q1 | Wiski is like an expert (for example, a teacher) for recommending maths exercises. | Wiski is zoals een expert (bv. een leerkracht) in wiskunde-oefeningen aanraden. |
| Q2 | Wiski has the expertise (knowledge) to estimate my maths level. | Wiski heeft de expertise (kennis) om mijn wiskundeniveau te kunnen inschatten. |
| Q3 | Wiski can estimate my maths level. | Wiski kan mijn wiskundeniveau inschatten. |
| Q4 | Wiski understands the difficulty level of maths exercises well. | Wiski begrijpt de moeilijkheidsgraad van wiskunde-oefeningen goed. |
| Q5 | Wiski takes my maths level into account when recommending exercises. | Wiski houdt rekening met mijn wiskundeniveau om oefeningen aan te raden. |
| Benevolence | ||
| Q6 | Wiski prioritises that I improve in maths. | Wiski zet op de eerste plaats dat ik vorderingen maak in wiskunde. |
| Q7 | Wiski recommends exercises so that I improve in maths. | Wanneer Wiski oefeningen aanraadt, doet Wiski dat zodat ik vorderingen maak in wiskunde. |
| Q8 | Wiski wants to estimate my maths level well. | Wiski wil mijn wiskundeniveau goed inschatten. |
| Integrity | ||
| Q9 | Wiski recommends exercises as correctly as possible. | Wiski raadt oefeningen op een zo correct mogelijke manier aan. |
| Q10 | Wiski is honest. | Wiski is eerlijk. |
| Q11 | Wiski makes integrous recommendations. | Wiski maakt oprechte aanbevelingen. |
| Trust (one-dimensional) | ||
| Q12 | I trust Wiski to recommend me maths exercises. | Ik vertrouw Wiski om mij wiskunde-oefeningen aan te raden. |
| Intention to return | ||
| Q13 | If I want to solve maths exercises again, I will choose Wiski. | Als ik nog eens online wiskunde-oefeningen maak, dan kies ik voor Wiski. |
| Q14 | If I want to be recommended maths exercises again, I will choose Wiski. | Als ik nog eens wiskunde-oefeningen aangeraden wil krijgen, dan kies ik voor Wiski. |
| Transparency | ||
| Q15 | I understood why the exercises were recommended to me. | Ik begreep waarom de oefeningen aan mij werden aanbevolen. |
| Q16 | Wiski helps me understand why the exercises were recommended to me. | Wiski helpt mij te begrijpen waarom de oefeningen aan mij werden aanbevolen. |
| Q17 | Wiski explains why the exercises are recommended to me. | Wiski legt uit waarom de oefeningen aan mij worden aanbevolen. |
| Control | ||
| Q18 | I feel in control of telling Wiski what I want. | Ik heb het gevoel dat ik Wiski kan vertellen wat ik wil. |
| Q19 | I don’t feel in control of telling Wiski what I want. | Ik heb niet het gevoel dat ik Wiski kan vertellen wat ik wil. |
| Q20 | I don’t feel in control of specifying and changing my preferences. | Ik heb niet het gevoel dat ik controle heb over het omschrijven en veranderen van mijn voorkeuren. |
| Q21 | Wiski seems to control my decision process rather than me. | Wiski lijkt mijn keuzeproces te controleren in plaats van ikzelf. |
| Preference elicitation | ||
| Q22 | Wiski provides an adequate way for me to express my preferences. | Wiski laat me op een geschikte manier mijn voorkeuren aangeven. |
| Q23 | I found it easy to tell Wiski about my preferences. | Ik vond het gemakkelijk om Wiski over mijn voorkeuren te vertellen. |
| Q24 | It is easy to learn to tell Wiski what I like. | Het is gemakkelijk om te leren hoe ik Wiski kan vertellen wat ik leuk vind. |
| Q25 | It required too much effort to tell Wiski what I like. | Het kostte te veel moeite om Wiski te vertellen wat ik leuk vind. |
| Preference revision | ||
| Q26 | Wiski provides an adequate way for me to revise my preferences. | Wiski laat me op een geschikte manier mijn voorkeuren aanpassen. |
| Q27 | I found it easy to make Wiski recommend different things to me. | Ik vond het gemakkelijk om Wiski mij verschillende dingen te laten aanbevelen. |
| Q28 | It is easy to train Wiski to update my preferences. | Het is gemakkelijk om Wiski te leren mijn voorkeuren aan te passen. |
| Q29 | I found it easy to alter the recommended exercises due to my preference changes. | Ik vond het gemakkelijk om de aanbevolen oefeningen te wijzigen met mijn voorkeursveranderingen. |
| Q30 | It is easy for me to inform Wiski if I dislike/like recommended exercises. | Het is voor mij gemakkelijk om Wiski te laten weten of ik de aanbevolen oefeningen leuk/niet leuk vind. |
| Q31 | It is easy for me to get a new set of recommended exercises. | Het is voor mij gemakkelijk om een nieuwe reeks aanbevolen oefeningen te krijgen. |