A variable active galactic nucleus at triply-imaged by the galaxy cluster MACS J0035.4-2015
Abstract
We report the discovery of a triply imaged active galactic nucleus (AGN), lensed by the galaxy cluster MACS J0035.4-2015 (). The object is detected in Hubble Space Telescope imaging taken for the RELICS program. It appears to have a quasi-stellar nucleus consistent with a point-source, with a de-magnified radius of pc. The object is spectroscopically confirmed to be an AGN at showing broad rest-frame UV emission lines, and is detected in both X-ray observations with Chandra and in ALCS ALMA band 6 (1.2 mm) imaging. It has a relatively faint rest-frame UV luminosity for a quasar-like object, . The object adds to just a few quasars or other X-ray sources known to be multiply lensed by a galaxy cluster. Some diffuse emission from the host galaxy is faintly seen around the nucleus and there is a faint object nearby sharing the same multiple-imaging symmetry and geometric redshift, possibly an interacting galaxy or a star-forming knot in the host. We present an accompanying lens model, calculate the magnifications and time delays, and infer physical properties for the source. We find the rest-frame UV continuum and emission lines to be dominated by the AGN, and the optical emission to be dominated by the host galaxy of modest stellar mass . We also observe some variation in the AGN emission with time, which may suggest that the AGN used to be more active. This object adds a low-redshift counterpart to several relatively faint AGN recently uncovered at high redshifts with HST and JWST.
keywords:
quasars – gravitational lensing: Strong – galaxies: clusters: individual: MACS J0035.4-2015 – galaxies: nuclei – cosmology: observations – galaxies: Seyfert1 Introduction
Active galactic nuclei (AGN) are galaxies hosting a supermassive black hole (SMBH) that is actively accreting matter at their center. The accretion process, in which potential and kinetic energy are transformed into thermal energy, results in very high luminosities (for reviews see e.g. Peterson, 2009; Netzer, 2013).
A prominent sub-type of AGN are quasars, or quasi-stellar objects, in which the emission is dominated by the accretion disk such that the object appears as a bright point source, with typical bolometric luminosities of (see, e.g., Shen et al., 2020). While many quasars and AGN are known (e.g. Bañados et al., 2016; Lyke et al., 2020; Flesch, 2021), only a relatively small fraction – perhaps a few dozen – are known to be multiply imaged (at least with separations large enough to be seen with HST; e.g., Suyu et al., 2017; Millon et al., 2020), and only about a handful are known to be multiply imaged by galaxy clusters (Inada et al., 2003, 2006; Oguri et al., 2013; Dahle et al., 2013; Sharon et al., 2017; Shu et al., 2018; Acebron et al., 2022a, b; Martinez et al., 2023; Bogdán et al., 2022; Furtak et al., 2022b; Napier et al., 2023).
Multiply imaged quasars play a significant role in astronomy. For example, they provide invaluable insight into the composition of the lens, which is dominated by a dark matter (DM) component of unknown nature. This insight is usually gained from flux anomalies between the different images of the quasar. Using the chromaticity due to microlensing, lensed quasars also enable insight into the source structure, such as the accretion disk and broad- and narrow-line regions (e.g., Fian et al., 2021; Mediavilla et al., 2011; Rojas et al., 2014). In addition, thanks to lensing magnification, we are able to probe fainter quasars than the typical bright population, including objects that without lensing might not immediately be classified as potentially AGN-dominated based on their appearance. This is because at high redshifts faint galaxies can also appear as point-sources (e.g. Bouwens et al., 2017). For a lensed point-source, however, the size constraint is much stronger than for a blank-field point-source, since it translates into an even smaller size (typically several tens of pc) in the source plane (e.g. Furtak et al., 2022b). Finally, perhaps the most notable role lensed quasars have played in the past decade is the measurement of the Hubble constant (e.g. Suyu et al., 2013; Courbin et al., 2018; Wang et al., 2018; Wang et al., 2021; Napier et al., 2023), adding key constraints to the renewed tension in its local value compared to results from the Cosmic Microwave Background (CMB) (Planck Collaboration et al., 2016; Riess et al., 2021; Wang et al., 2021). Because the path to each multiple image is different, the light arrival time for each image of a lensed quasar is different. That difference is in turn inversely proportional to the Hubble constant – the expansion rate of the Universe.
Lensed quasars also constitute a rare example of X-ray sources multiply imaged by galaxy clusters, only few of which are known. As another example, several years ago Bayliss et al. (2020) reported a multiply imaged X-ray source lensed by the galaxy cluster SPT-CLJ2344-4243, which in optical imaging appeared as a typical, elongated strongly lensed arc. Indeed, Bayliss et al. (2020) concluded, based on various properties such as its morphology and emission line flux ratios, that in this case the X-ray emission comes from a star-formation region and is atypical for an AGN. This galaxy, however, is quite unique: out of the few X-ray sources known to be strongly lensed by clusters, most are indeed AGN – and in particular, quasars.
Here, we report the discovery of a triply-imaged compact object detected in the Hubble Space Telescope (HST) imaging of the galaxy cluster MACS J0035.4-2015 (hereafter MACS0035; ; Ebeling et al., 2010) taken several years ago for the REionization LensIng Cluster Survey (RELICS; Coe et al., 2019). The lensed object shows a nucleus of a prominent point-like morphology, is relatively bright for its size, and shows broad rest-frame ultra-violet (UV) emission features typical of an AGN. It has indeed previously been spectroscopically classified as a quasar in Mainali (2019)111PhD Thesis but not analysed further. In addition, we detect this object in both X-ray and millimeter observations, which further confirms that it is an AGN. In this work we analyse the available data of this triply-imaged AGN and present its physical properties, adding to some recent samples of X-ray detected AGN in lensing cluster fields (Bogdán et al., 2022; Uematsu et al., 2023).
This paper is organised as follows: In §2 we describe the data used in this work and the lens model constructed for MACS0035. The source and its properties are presented and discussed in §3, and the work is concluded in §4. Throughout this work, we use a standard flat CDM cosmology with , , and . All magnitudes quoted are in the AB system (Oke & Gunn, 1983) and all uncertainties represent ranges unless stated otherwise.
2 Data
With the goal of finding high-redshift galaxies, the RELICS program (Coe et al., 2019) imaged 41 massive galaxy clusters with HST to depths of about 26.5 magnitudes (at in the F160W-band) in seven filters from the optical, with the Advanced Camera for Surveys (ACS), to the near-infrared (NIR), with the Wide-field Camera Three (WFC3). The RELICS observations of MACS0035 took place in 2016 November 10, and 2016 December 27. The final RELICS products that we use also include archival ACS data taken on 2005 September 13 in the F606W-band (PI: H. Ebeling, Program ID: 10491) and on 2013 June 2, in the F814W band (PI: H. Ebeling, Program ID: 12884). We use here the public data products from the RELICS program222https://archive.stsci.edu/hlsp/relics which include, besides the drizzled broad-band images of MACS0035, a source catalog obtained with SExtractor (Bertin & Arnouts, 1996) that contains photometry and photometric redshifts computed with BPZ (Benítez et al., 2004), and colour images made using Trilogy (Coe et al., 2012). The details of the observations, data reduction and source extraction can be found in Coe et al. (2019). Additional HST observations for MACS0035 were recently obtained on 2022 October 4 in the WFC3/UVIS F606W- and WFC3/IR F105W-bands (PI: P. Kelly, Program ID: 16729), which we use here as well for comparison.
In addition, we use ground-based spectroscopic data obtained with the Multi-Unit Spectroscopic Explorer (MUSE; Bacon et al., 2010) on ESO’s Very Large Telescope (VLT), which are publicly available in the ESO Science Archive (Program ID: 0103.A-0777; PI: A. Edge; observation date: 2019-09-07 and 2019-07-02; exposure time: 2910 s per observation), and with the Low Dispersion Survey Spectrograph 3 (LDSS3) on the Magellan Clay Telescope as part of a RELICS spectroscopic follow-up program (PI: K. Sharon; observation date: 2017-07-27; exposure time: 4.8 ks Mainali, 2019). MACS0035 is also part of the ALMA Lensing Cluster Survey (ALCS; Kohno, 2019; Fujimoto et al., 2023) which took high-resolution 1.2 mm imaging ( beam) of 33 strong lensing clusters with the Atacama Large Millimeter/sub-millimeter Array (ALMA). These data are also used in this work and are publicly available on the ESO Science Archive (Program ID: 2018.1.00035.L; PI: K. Kohno; observation date: 2019-03-12). Finally, we also use the existing X-ray imaging of MACS0035 taken with the Advanced CCD Imaging Spectrometer (ACIS) aboard the Chandra X-ray Observatory which is publicly available in the Chandra Data Archive (Obs. ID: 3262; PI: H. Ebeling; observation date: 2003-01-22; exposure time: 21 ks).
2.1 Gravitational lensing
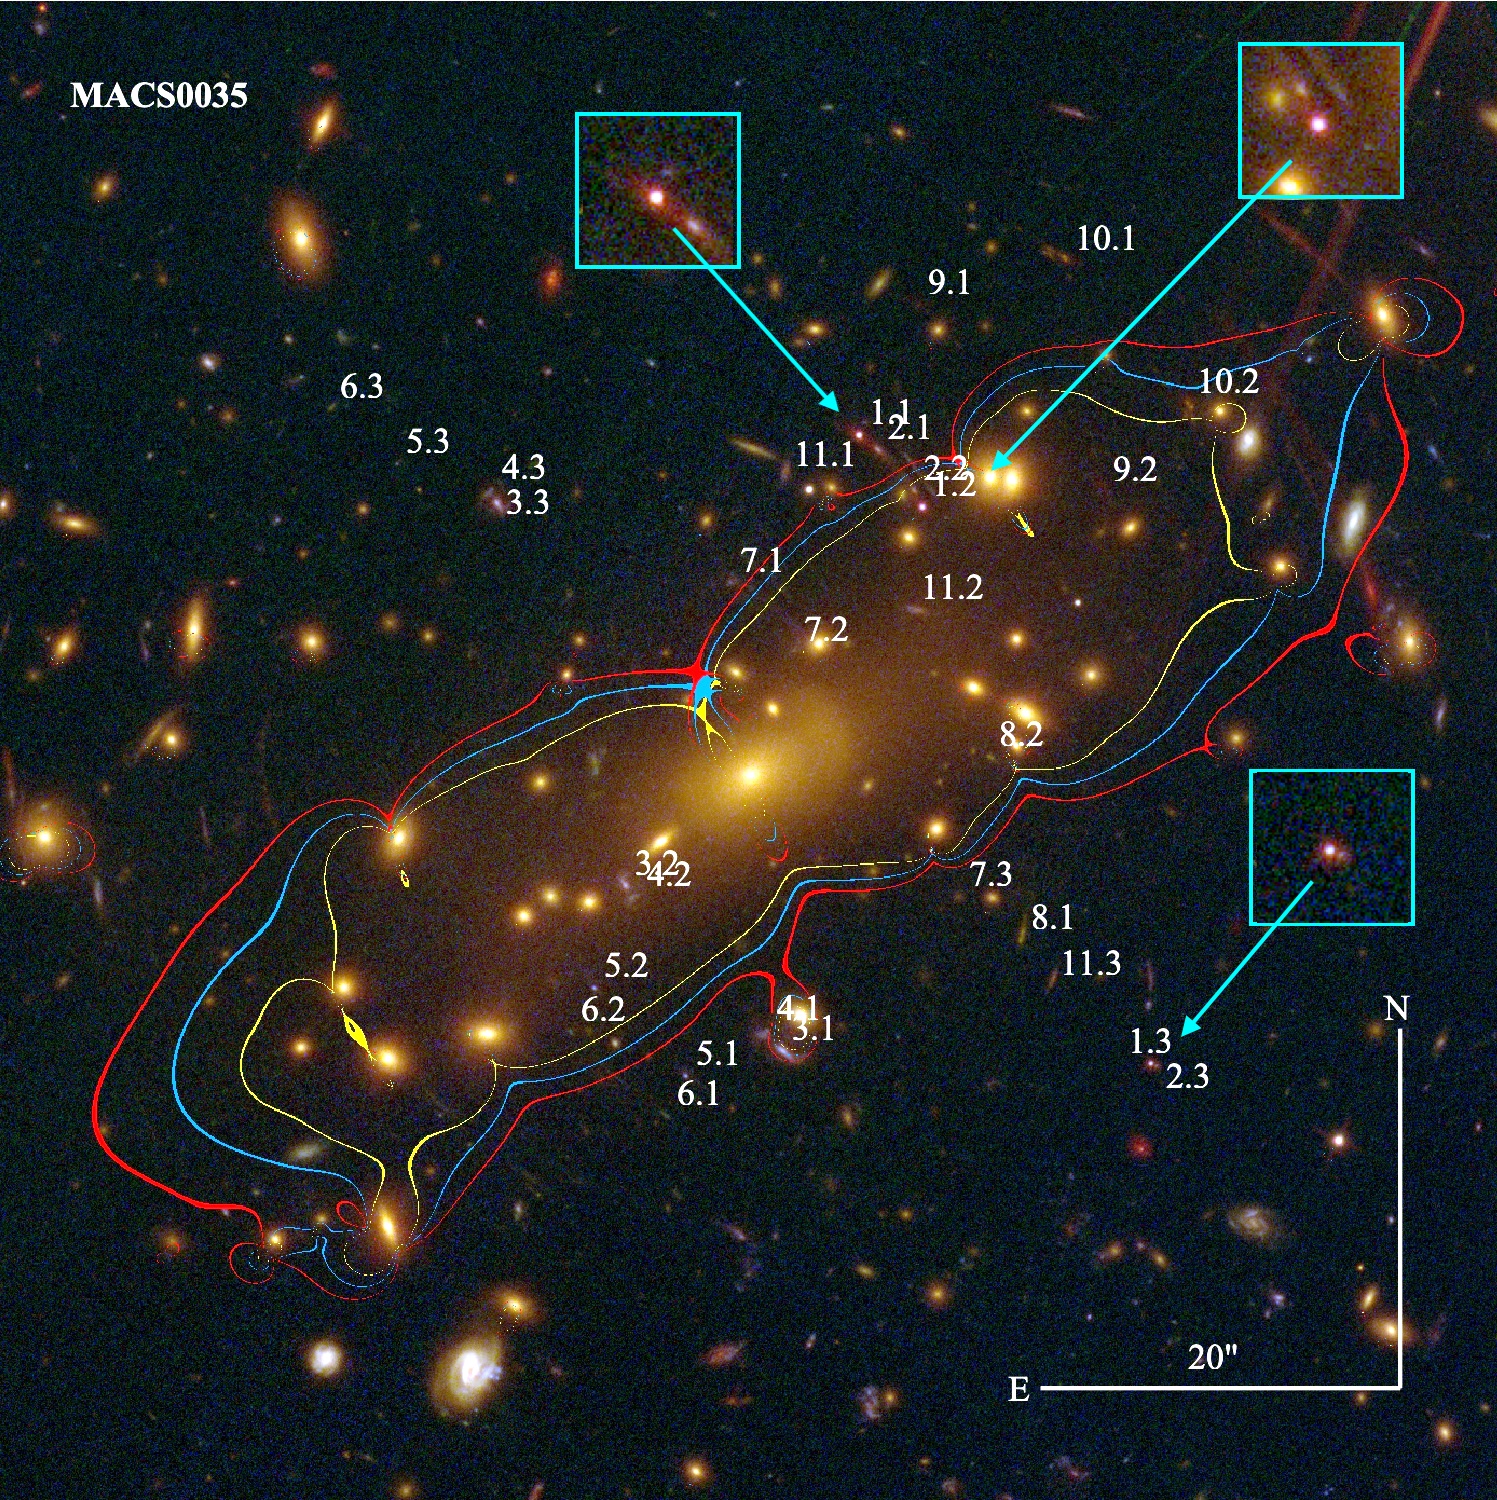
We construct a lens model for the galaxy cluster MACS0035 using an updated version of the parametric lens modeling code from Zitrin et al. (2015) that was presented in Pascale et al. (2022) and Furtak et al. (2022a). The model is based on 11 sets of multiple images identified in the HST imaging, comprising a total of 30 images (see Fig. 1). In the MUSE observations of the field (see section 2), we detect a prominent double emission line feature – consistent with the [O ii]Å-doublet at – for the two adjacent systems 3 and 4 (see Fig. 1). The spectra are extracted and the redshifts measured with the same method that was used in Golubchik et al. (2022). We note also that this redshift is independently confirmed by the Magellan LDSS3 observations in Mainali (2019). For the other multiple image systems, which were not identified individually in the MUSE data, we use the photometric redshifts from the RELICS catalog as priors and allow their redshift to be freely optimised in the minimization. The cluster galaxies are modeled each as a dual pseudo isothermal elliptical mass distribution (dPIE; Keeton 2001; Elíasdóttir et al. 2007) following typical luminosity scaling relations (Jullo et al., 2007) which are free to vary. One large cluster DM halo is used, modeled as a pseudo-isothermal elliptical mass distribution (PIEMD; e.g. Keeton, 2001). The model parameters are optimised via a long Monte-Carlo Markov Chain (MCMC) of several tens of thousand steps and with an input positional uncertainty of 0.5″ for each multiple image. The best-fit model reproduces the position of the multiple images with a lens plane RMS of 0.7″. The images of the AGN studied in this work, i.e. system 1, in particular are reproduced with an RMS of 0.4″. The critical curves from the model for various redshifts are shown in Fig. 1. We compute magnifications and time delays for each image of the AGN studied here and report them in Tab. 1. The best-fitting lensing redshift of this source is , in excellent agreement with its spectroscopic redshift (see section 2.3).
2.2 Photometry
| ID | R.A. | Dec. | Chandra/ACIS-I | F435W | F606W | F814W | F105W | F125W | F140W |
|---|---|---|---|---|---|---|---|---|---|
| 1.1 | |||||||||
| 1.2 | |||||||||
| 1.3 | |||||||||
| F160W | ALMA Band 6 | [95% C.I.] | [d] | ||||||
| - | Å | Å | |||||||
| - | - | - | |||||||
| - | - | - |
Note. – Optical, NIR and millimeter fluxes, given in Jy, are measured in the RELICS HST/ACS+WFC3 images and the ALMA data (see section 2). The Chandra X-ray fluxes are integrated fluxes from keV in units of with their 90% errors. All fluxes are observed, i.e. not de-magnified yet. The photometric redshift estimates are from the RELICS catalog (Coe et al., 2019, note that the first two images are contaminated by near-by galaxies and ICL in the RELICS catalog which also affects the photometric redshift estimates). The magnifications and time delays are computed with our lens model described in section 2.1. The latter are in days relative to the first image, 1.1. The last three columns show the rest-frame EWs of the emission lines measured in the LDSS3 spectrum in section 2.3. Note that we do not resolve the C iv and C iii] doublets.
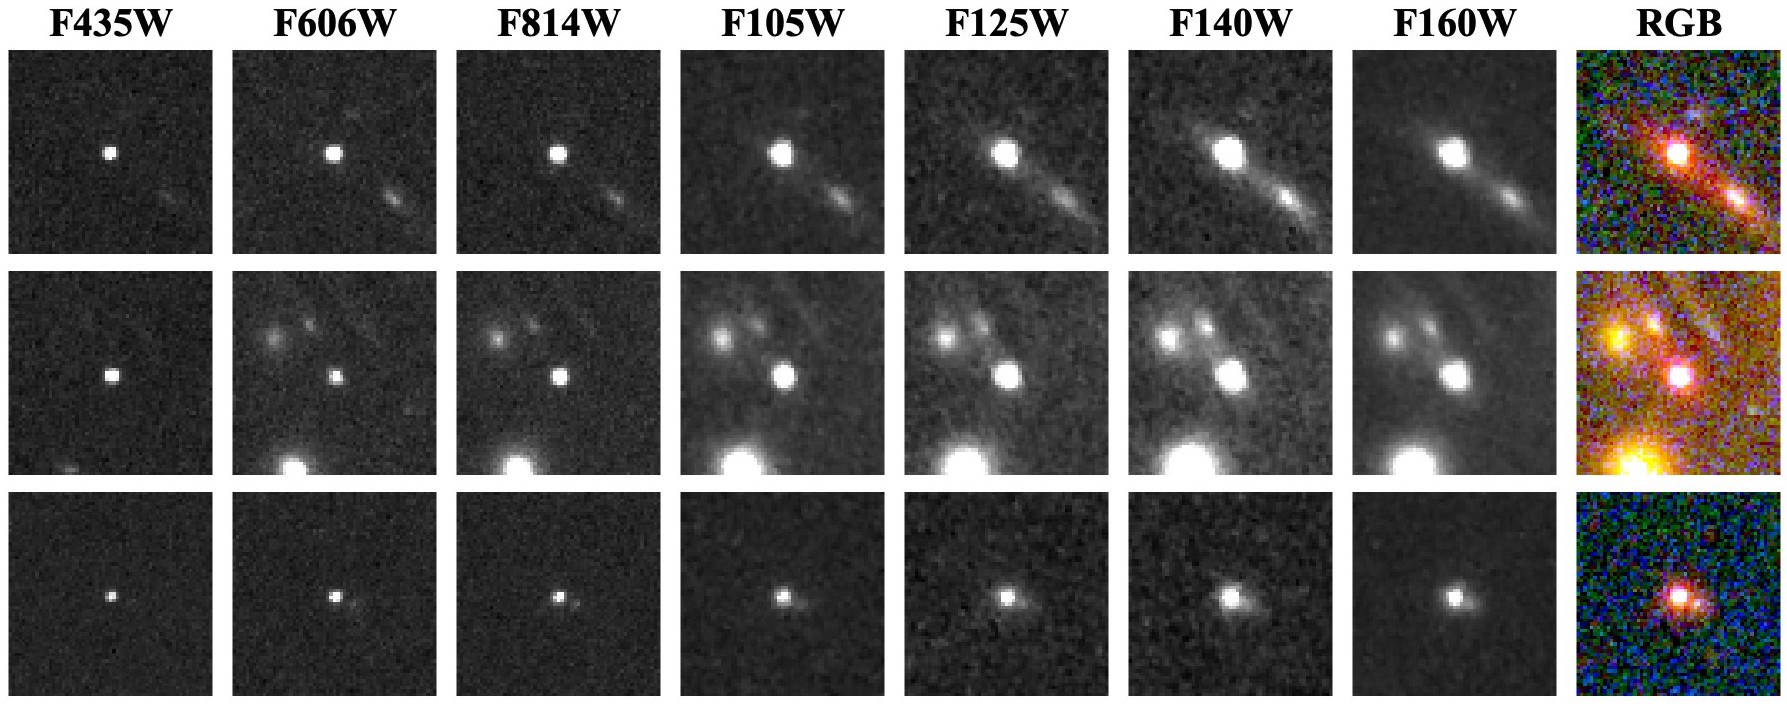
While all three images of the AGN (see Figs. 1 and 2) are detected in the RELICS catalog (section 2), we note upon examination of the corresponding segmentation map that the detections are blended with another nearby multiple image system (Fig. 1) in the catalog. Because of that, we measure the photometry of the three images of the AGN with photutils (v1.6.0; Bradley et al., 2022) in circular apertures of 0.5″ diameter and a local background annulus, both of which are carefully chosen to avoid contamination by the close-by companion (but does include the thin red envelope around the nucleus; see Figs. 1 and 2). The aperture fluxes are then corrected using aperture correction factors that take the point-spread-function (PSF) in each band into account. The resulting fluxes in each band are listed for each image in Tab. 1 and cutouts of the images in the individual bands can be seen in Fig. 2. Despite some variation, possibly attributed to contribution from nearby galaxies especially for image 1.2 (although see more discussion about variability in section 3), the flux ratios of the images seem to be broadly consistent over all bands and concur with the magnification ratios within the -uncertainties.
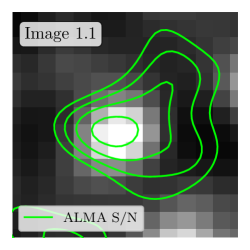
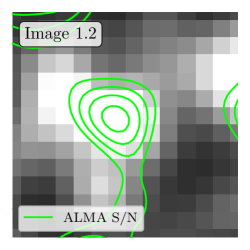
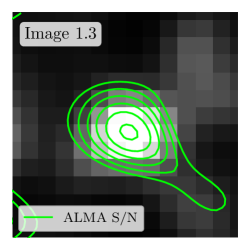
In the ALMA continuum map, we identify a source within the ALMA beam size () around each multiple image position. We thus attribute these ALMA sources to be the rest-frame far-infrared (FIR) counterparts of these multiple images and measure the 1.2 mm flux densities from their peak pixel counts, as reported in Tab. 1. Note that image 1.2 was previously detected as an ALMA source in a joint ALCS and Herschel Space Observatory (Pilbratt et al., 2010) study by Sun et al. (2022) but did not show any Herschel flux above the detection threshold. All three images of the lensed AGN are also detected in Chandra X-ray keV maps of the field (see section 2) although with relatively low count statistics ( net photons). The integrated X-ray fluxes in the keV energy band, corrected for galactic absorption, are also given in Tab. 1 and we show the X-ray map overlaid with the ALMA contours of the object in Fig. 3. The X-ray fluxes are measured in 2″ apertures with local background estimates which were corrected for the Chandra PSF and off-axis angle. The ALMA and Chandra flux ratios between multiple images do not concur with the magnification ratios, nor with the optical flux ratios, i.e. the least magnified image 1.3 is the brightest rather than the most magnified one, image 1.2. This may indicate variable AGN activity, as we discuss further in section 3 but note also that the uncertainties on these measurements are very large.
Finally, the RELICS catalog also contains BPZ photometric redshifts that are also listed in Tab. 1 for completeness.
2.3 Spectroscopy
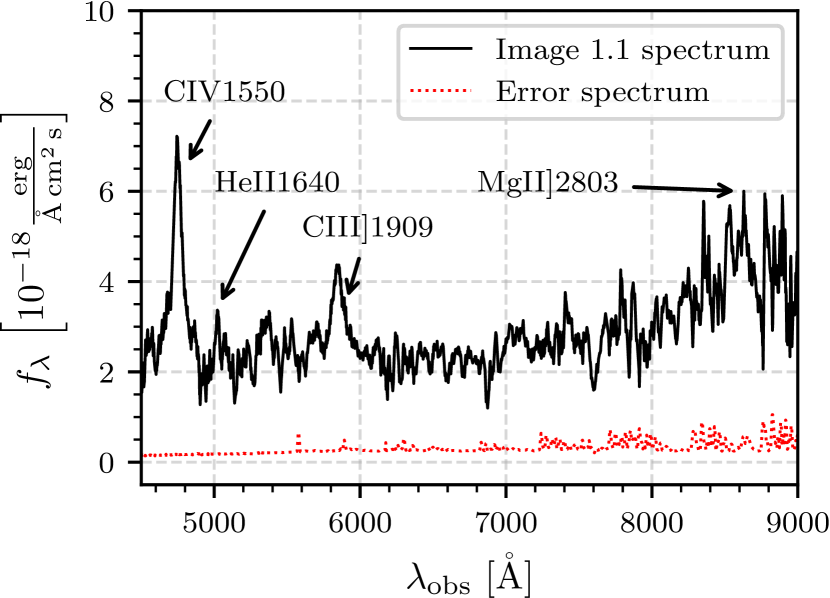
The LDSS3 mask (see section 2) targeted one of the three known images of the source, image 1.1, among other objects of interest in the field (see Mainali, 2019). These data were reduced and presented in Mainali (2019), who reported the detection of several broad UV emission lines which enabled the identification of this object as a quasar at redshift .
As can be seen in Fig. 4, the spectrum features several prominent emission lines. The two brightest ones are the C ivÅ and C iii]Å (unresolved) doublets at , and there is also a somewhat weaker He iiÅ emission. We use the specutils package (v1.9.1; Earl et al., 2022) to compute the equivalent widths (EWs) and perform a Gaussian fit to the detected lines in order to measure line centers and full-width-half-maxima (FWHM). We derive a spectroscopic redshift of for this object, consistent with Mainali (2019). Given their high ionization potential and broad (rest-frame) line widths, i.e. FWHM of , , and respectively, these lines indeed confirm this object as an AGN. Note that since we do not resolve the C iv and C iii] doublets, the quoted line widths nominally represent upper limits, but the true values should not be significantly smaller given that the line widths (tens of Å) are much larger than the separation between the two doublet components ( Å). The measured EWs are listed in Tab. 1. We also find a tentative Mg ii]Å detection at the same redshift, but it is too uncertain to derive a robust line center and EW (it is also possible that the higher continuum seen towards redder wavelengths is in part due to complex Fe ii emission; see e.g. Sameshima et al. 2011). Note that the C ivÅ and C iii]Å lines can also be seen in the MUSE spectra, though at very low signal-to-noise (; when combining the signal from the different multiple images), and corroborate the redshift and the large line width measurements from the LDSS3 data.
3 A lensed AGN – Physical properties of the source

In the colour image shown in Fig. 1, several different features are noticeable in the multiple images of the AGN, especially in the two highly magnified ones (1.1 and 1.2; see Tab. 1). The first most notable feature is the blue/white, point-like nucleus. Given it is a point-source in the blue optical bands, verified by dedicated GALFIT (Peng et al., 2010) analysis, we can place an approximate upper limit on its size by adopting a nominal 0.1″ FWHM PSF in the HST imaging. Taking the magnification and distance into account, this translates into a size of pc in the source plane, or pc. The second feature is identified as a thin redder envelope around the blue nucleus, seen in the longer-wavelength HST/WFC3 bands, which is only marginally point-like, i.e. it presents a slight stretch in the direction of the arc (the direction of the shear). This means that the red emission likely comes from a slightly larger region than the nucleus, which, following similar arguments as above and a GALFIT measurement in the F160W where this feature is more pronounced, should not be larger than about pc in radius. The measured surface brightness of this emission is in the F160W-band ( Å in the galaxy’s rest-frame at ) and it looks to be of a spherical morphology in the least-sheared image (image 1.3). The last feature is a relatively blue and bright ( AB in the F160W-band) patch from the nucleus along the arc which corresponds to a de-magnified projected distance of about 3.3 kpc (image system 2 in Fig. 1). Assuming this clump has the same redshift as the nucleus, it could be an outer part of the host, probably a star-forming knot, or perhaps more likely, a small interacting companion.
At the redshift of the source, the 1450 Å emission is contained in the F435W-band. We therefore use the photometry of image 1.1 measured in that filter to derive a de-magnified UV luminosity of . This is relatively faint for a quasar-like object, and could potentially fall under the category of Seyfert galaxies, also given part of the host is seen. We refer to the object as a quasar-like throughout in the simplest sense that it is an AGN with an apparent quasi-stellar appearance. By assuming a single modified black-body with a typical dust temperature of K and dust-emissivity spectral index (Beelen et al., 2006) scaled to the ALMA detection (see Tab. 1), we derive an FIR luminosity of . Applying the Rieke et al. (2009) relation, this results in a dust-obscured star-formation rate (SFR) of which agrees well with the optical emission line inferred SFR of the host derived below. The X-ray luminosity of image 1.1 is . Using the relation between the UV luminosity, the C ivÅ FWHM, the line ratio between the C ivÅ and C iii]Å lines and the black hole mass from Popović (2020) based on Mejía-Restrepo et al. (2016) and Ge et al. (2019), we obtain an estimate of the black hole mass of . Together with the stellar mass of the host galaxy found below, this broadly agrees with the typical (i.e. black hole mass-velocity dispersion of stars in the galaxy) or black hole mass-luminosity relation established for local AGN (e.g. Gültekin et al., 2009). This relation has not yet been probed out to and in particular not at these masses (e.g. Canalizo et al., 2012; Park et al., 2015; Schindler et al., 2016; Li et al., 2021). Note that since the spectrum has only been measured for image 1.1 (see section 2.3), we cannot at this stage derive the black hole mass for the other two images.
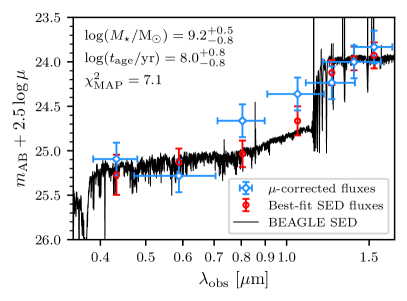
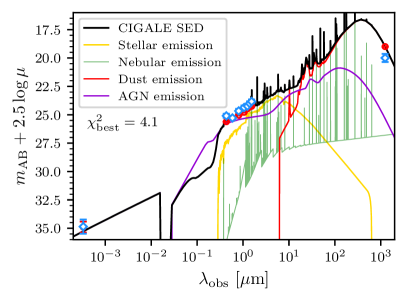
To constrain the physical properties of this object, we perform a spectral energy distribution (SED) analysis by fitting the photometry of image 1.1 (see Tab. 1) after correcting it for magnification, and fix the fit to the spectroscopic redshift (see section 2.3), with two distinct codes: We use the BayEsian Analysis of GaLaxy sEds (BEAGLE) tool (Chevallard & Charlot, 2016) on the broad-band HST data and, in order to also fold-in the Chandra and ALMA detections, the Code Investigating GAlaxy Emission code (CIGALE; Boquien et al., 2019; Yang et al., 2020, 2022). Since the flux ratios of the three images concur with the magnification ratios as described in section 2.2, the de-magnified photometry is identical within the uncertainties for each image and would thus yield the same SED-fit. For BEAGLE, following the approach of Endsley et al. (2022b) and Furtak et al. (2022b), we use hybrid templates consisting of a galaxy component and an AGN component (Feltre et al., 2016) newly developed for BEAGLE (this update is called BEAGLE-AGN; Vidal-García et al., 2022, currently only a type II AGN template is available in this library). We assume a delayed star-formation history (SFH), a Charlot & Fall (2000) dust attenuation law and the Inoue et al. (2014) intergalactic-medium (IGM) absorption models in the BEAGLE-AGN fit. In CIGALE, which also includes the possibility to fit a type I AGN, we assume a delayed SFH and a Calzetti dust attenuation law (Calzetti et al., 2000) for the host galaxy, the Skirtor2016 (Stalevski et al., 2012, 2016) AGN emission models for the AGN component and the Dale et al. (2014) dust emission templates. Note that we fix the CIGALE templates to a type I AGN. The resulting best-fit SEDs are shown in Fig. 5.
The BEAGLE-AGN-fit yields a moderate stellar mass and age of and Myr, respectively, for the host galaxy. It additionally finds a significant current SFR (representing the last 10 Myr) of and a dust attenuation of . Note that this SFR estimates agrees well with the FIR luminosity inferred SFR value above. While this SED-fit with BEAGLE-AGN reproduces the broad-band photometry reasonably well within the uncertainties, it does not, however, reproduce the strong rest-frame UV emission lines measured in section 2.3 (see Tab. 1). This is not surprising, since the BEAGLE-AGN templates only model a type II AGN whereas the broad emission lines clearly originate from a type I AGN. The resulting best-fitting CIGALE host-galaxy parameters are and Myr which agree with the BEAGLE-AGN results within the uncertainties. The best-fitting CIGALE SED further suggests an accretion luminosity of . As can be clearly seen in the right-hand panel of Fig. 5, the rest-frame UV emission is dominated by the type I AGN component ( % of the integrated flux) whereas the rest-frame optical is dominated by the host galaxy ( % AGN contribution). The latter is also consistent with the fact that the AGN contribution to the integrated flux inferred with BEAGLE-AGN is %.
The rest-frame optical HST flux ratios concur with the magnification ratios from the lens model. However, the X-ray, rest-frame UV, and FIR fluxes do not (see section 2.2). This concurs with the picture that the optical emission originates mostly from the host galaxy, and thus is stable, whereas the X-ray and UV (and potentially the FIR) originate directly from the AGN (which also contributes significantly to the heating of the dust) and are therefore sensitive to variations in its activity. The X-ray emission typically varies on different time-scales than the FIR emission due to the distance between the AGN and the dust around it (of order several pc). Since image 1.3 is the first to arrive, by yr according to our SL model (see Tab. 1 and section 2.1), its enhanced X-ray and FIR emission may therefore suggest that the AGN was more active at that time. Note however that since uncertainties on both the X-ray and ALMA measurements, and the magnifications, are quite large (see Tab. 1), and since the X-ray and FIR data were taken almost 15 years apart, this conclusion remains uncertain. In addition, the X-ray emission typically varies on different time-scales than the FIR emission due to the distance between the AGN and the dust around it (of order several pc). Regarding the possible AGN variability, we also make use of the fact that the cluster was observed in some of the blue HST filters in several epochs. For example, the imaging in the F606W-band was repeated three times over nearly two decades (two with ACS, and the most recent with WFC3/UVIS; see section 2). We do find signatures of variability also in these HST data when re-measuring the photometry of the three images in the single-epoch frames: The rest-frame UV measurements of the three AGN images vary by as much as magnitudes between the different epochs, as can be seen in Fig. 6. Note that while AGN typically vary more in the rest-frame UV than in the optical, we do not have enough epochs in the rest-frame optical bands (i.e. F125W and beyond) to confirm this for the object studied here. That being said, the strongest variation is clearly seen in the bluest (F606W) band.
We thus conclude that the object studied here is likely a un-obscured moderate-luminosity ("Seyfert"-level) AGN, possibly undergoing a merger with a companion galaxy at Cosmic Noon (). It is possible that the enhanced AGN activity is associated with merger-driven AGN growth. This phenomenon is well documented locally (e.g. Comerford et al., 2015; Trakhtenbrot et al., 2017; Ricci et al., 2021), but rarely with such compact hosts at such small projected distances. Although intrinsically rather faint and compact, the lensing magnification of this AGN could ultimately allow a privileged view of the dynamics of this system. This would allow us to better understand potential changes in AGN and galaxy growth over cosmic time, e.g. with future dedicated integral-field-unit (IFU) spectroscopic observations.
4 Conclusion
We present a triply-imaged, relatively faint () quasar-like object at , lensed by the galaxy cluster MACS0035. In addition to its nucleus’ point-like appearance, the source is detected in both X-ray and millimeter wavelengths, which, together with its broad () high-ionization C ivÅ, He iiÅ and C iii]Å emission lines confirm it is an AGN, adding to less than a handful of known quasars multiply imaged by galaxy clusters. We run BEAGLE-AGN and CIGALE on the photometry of the source to derive its physical properties. We find that its host galaxy is relatively young, about Myr to Gyr old, with a moderate stellar mass of , and that about 40 % of the rest-frame optical emission originates from the AGN, which dominates however in the UV. We also note that while the HST bands largely agree with the magnification ratios from our lens model, both the X-ray and the millimeter observations seem to show a slight excess in the first-arrived image, suggesting it may have been caught in a particularly active phase of the AGN, even though the uncertainties are very large. We do find however substantial variability in the rest-frame UV emission of the AGN by using archival data from the past 20 years. The time delay between the two nearby images (1.1 and 1.2) is of order several months, which, given this variability, may thus make this system a useful target for constraining . Future spectroscopic observations of this object could possibly further examine this and allow constraints on cosmological parameters thanks to the gravitational time delays. High-resolution IFU observations of this object might further yield insight into the dynamics of this potentially merging Seyfert galaxy system at .
The AGN we present here adds to three other lensed – albeit not multiply imaged – AGN recently detected in the ALCS survey (Uematsu et al., 2023). Moreover, this AGN adds to a few other AGN and intriguingly faint quasar candidates that were recently detected with the JWST, out to higher redshifts (e.g. Bogdán et al., 2022; Endsley et al., 2022a; Onoue et al., 2023; Furtak et al., 2022b; Kocevski et al., 2023; Larson et al., 2023; Harikane et al., 2023). Despite, or perhaps because of their observational rarity, faint quasars are particularly interesting. If indeed the quasar luminosity function remains steep towards the faint end (e.g. Glikman et al., 2011; Niida et al., 2020), this may indicate that quasars, or perhaps hybrid objects (e.g. Laporte et al., 2017; Mainali et al., 2017; Fujimoto et al., 2022), contribute more heavily to the UV background (Madau & Haardt, 2015) than is commonly assumed, and may have thus played a more significant role in the reionisation of the Universe.
Acknowledgements
The authors would like to thank the anonymous referee for their useful comments, which helped to improve the manuscript. A.Z. thanks Benny Trakhtenbrot for a useful discussion. L.J.F. and A.Z. acknowledge support by grant 2020750 from the United States-Israel Binational Science Foundation (BSF) and grant 2109066 from the United States National Science Foundation (NSF), and by the Ministry of Science & Technology, Israel. J.C. acknowledges funding from the “FirstGalaxies” Advanced Grant from the European Research Council (ERC) under the European Union’s Horizon 2020 research and innovation program (Grant agreement No. 789056). E.C.L. acknowledges support of an STFC Webb Fellowship (ST/W001438/1). K.K. acknowledges the support by JSPS KAKENHI Grant Number JP17H06130 and the NAOJ ALMA Scientific Research Grant Number 2017-06B. D.E. acknowledges support from a Beatriz Galindo senior fellowship (BG20/00224) from the Spanish Ministry of Science and Innovation, projects PID2020-114414GB-100 and PID2020-113689GB-I00 financed by MCIN/AEI/10.13039/501100011033, project P20-00334 financed by the Junta de Andalucía, and project A-FQM-510-UGR20 of the FEDER/Junta de Andalucía-Consejería de Transformación Económica, Industria, Conocimiento y Universidades. G.E.M. acknowledges financial support from the Villum Young Investigator grant 37440 and 13160 and the The Cosmic Dawn Center (DAWN), funded by the Danish National Research Foundation under grant No. 140. F.E.B. acknowledges support from ANID-Chile BASAL CATA FB210003, FONDECYT Regular 1200495 and 1190818, and Millennium Science Initiative Program–ICN12_009. K.K.K. acknowledges support from the Knut and Alice Wallenberg Foundation.
This work is based on observations made with the NASA/ESA Hubble Space Telescope (HST). The data were obtained from the Barbara A. Mikulski Archive for Space Telescopes (MAST) at the Space Telescope Science Institute (STScI), which is operated by the Association of Universities for Research in Astronomy (AURA) Inc., under NASA contract NAS 5-26555 for HST. This research has made use of data obtained from the Chandra Data Archive and software provided by the Chandra X-ray Center (CXC) in the application packages CIAO and Sherpa. This work is also based on observations made with ESO Telescopes at the La Silla Paranal Observatory and the Atacama Large Millimeter/sub-millimeter Array (ALMA), obtained from the ESO Science Archive. ALMA is a partnership of ESO (representing its member states), NSF (USA) and NINS (Japan), together with NRC (Canada), MOST and ASIAA (Taiwan), and KASI (Republic of Korea), in cooperation with the Republic of Chile. The Joint ALMA Observatory is operated by ESO, AUI/NRAO and NAOJ. The National Radio Astronomy Observatory (NRAO) is a facility of the NSF operated under cooperative agreement by Associated Universities Inc. This paper is based on data gathered with the 6.5 m Magellan Telescopes located at Las Campanas Observatory, Chile, awarded through the University of Michigan.
This research made use of Astropy,333http://www.astropy.org a community-developed core Python package for Astronomy (Astropy Collaboration et al., 2013; Price-Whelan et al., 2018) as well as the packages NumPy (van der Walt et al., 2011), SciPy (Virtanen et al., 2020), spectral-cube (Ginsburg et al., 2014) and the astronomy library for MATLAB (Ofek, 2014). The Matplotlib package (Hunter, 2007) was used to create some of the figures in this work.
Data Availability
The HST data used in this work are publicly available ion the MAST archive, under program IDs 12884, 10491, 14096 and 16729, and on the RELICS website444https://archive.stsci.edu/hlsp/relics. The Chandra X-ray data are available on the Chandra Data Archive555https://cda.harvard.edu/chaser under observation ID 3262. The ESO/VLT and ALMA data can be obtained from the ESO Science Archive666http://archive.eso.org/scienceportal/home under program IDs 103.A-0777 and 2018.1.00035.L. Finally, the Magellan data and the lens models used in this work will be shared by the authors upon request.
References
- Acebron et al. (2022a) Acebron A., et al., 2022a, A&A, 668, A142
- Acebron et al. (2022b) Acebron A., et al., 2022b, ApJ, 926, 86
- Astropy Collaboration et al. (2013) Astropy Collaboration et al., 2013, A&A, 558, A33
- Bañados et al. (2016) Bañados E., et al., 2016, ApJS, 227, 11
- Bacon et al. (2010) Bacon R., et al., 2010, in McLean I. S., Ramsay S. K., Takami H., eds, Society of Photo-Optical Instrumentation Engineers (SPIE) Conference Series Vol. 7735, Ground-based and Airborne Instrumentation for Astronomy III. p. 773508, doi:10.1117/12.856027
- Bayliss et al. (2020) Bayliss M. B., et al., 2020, Nature Astronomy, 4, 159
- Beelen et al. (2006) Beelen A., Cox P., Benford D. J., Dowell C. D., Kovács A., Bertoldi F., Omont A., Carilli C. L., 2006, ApJ, 642, 694
- Benítez et al. (2004) Benítez N., et al., 2004, ApJS, 150, 1
- Bertin & Arnouts (1996) Bertin E., Arnouts S., 1996, A&AS, 117, 393
- Bogdán et al. (2022) Bogdán Á., Kovács O. E., Jones C., Forman W. R., Kraft R. P., Strait V., Coe D., Bradač M., 2022, ApJ, 927, 34
- Boquien et al. (2019) Boquien M., Burgarella D., Roehlly Y., Buat V., Ciesla L., Corre D., Inoue A. K., Salas H., 2019, A&A, 622, A103
- Bouwens et al. (2017) Bouwens R. J., Oesch P. A., Illingworth G. D., Ellis R. S., Stefanon M., 2017, ApJ, 843, 129
- Bradley et al. (2022) Bradley L., et al., 2022, astropy/photutils: 1.6.0, doi:10.5281/zenodo.7419741, https://doi.org/10.5281/zenodo.7419741
- Calzetti et al. (2000) Calzetti D., Armus L., Bohlin R. C., Kinney A. L., Koornneef J., Storchi-Bergmann T., 2000, ApJ, 533, 682
- Canalizo et al. (2012) Canalizo G., Wold M., Hiner K. D., Lazarova M., Lacy M., Aylor K., 2012, ApJ, 760, 38
- Charlot & Fall (2000) Charlot S., Fall S. M., 2000, ApJ, 539, 718
- Chevallard & Charlot (2016) Chevallard J., Charlot S., 2016, MNRAS, 462, 1415
- Coe et al. (2012) Coe D., et al., 2012, ApJ, 757, 22
- Coe et al. (2019) Coe D., et al., 2019, ApJ, 884, 85
- Comerford et al. (2015) Comerford J. M., Pooley D., Barrows R. S., Greene J. E., Zakamska N. L., Madejski G. M., Cooper M. C., 2015, ApJ, 806, 219
- Courbin et al. (2018) Courbin F., et al., 2018, A&A, 609, A71
- Dahle et al. (2013) Dahle H., et al., 2013, ApJ, 773, 146
- Dale et al. (2014) Dale D. A., Helou G., Magdis G. E., Armus L., Díaz-Santos T., Shi Y., 2014, ApJ, 784, 83
- Earl et al. (2022) Earl N., et al., 2022, astropy/specutils: v1.9.1, doi:10.5281/zenodo.7348235, https://doi.org/10.5281/zenodo.7348235
- Ebeling et al. (2010) Ebeling H., Edge A. C., Mantz A., Barrett E., Henry J. P., Ma C. J., van Speybroeck L., 2010, MNRAS, 407, 83
- Elíasdóttir et al. (2007) Elíasdóttir Á., et al., 2007, arXiv e-prints, p. arXiv:0710.5636
- Endsley et al. (2022a) Endsley R., Stark D. P., Whitler L., Topping M. W., Chen Z., Plat A., Chisholm J., Charlot S., 2022a, arXiv e-prints, p. arXiv:2208.14999
- Endsley et al. (2022b) Endsley R., et al., 2022b, MNRAS, 512, 4248
- Feltre et al. (2016) Feltre A., Charlot S., Gutkin J., 2016, MNRAS, 456, 3354
- Fian et al. (2021) Fian C., Mediavilla E., Motta V., Jiménez-Vicente J., Muñoz J. A., Chelouche D., Hanslmeier A., 2021, A&A, 653, A109
- Flesch (2021) Flesch E. W., 2021, arXiv e-prints, p. arXiv:2105.12985
- Fujimoto et al. (2022) Fujimoto S., et al., 2022, Nature, 604, 261
- Fujimoto et al. (2023) Fujimoto S., et al., 2023, arXiv e-prints, p. arXiv:2303.01658
- Furtak et al. (2022a) Furtak L. J., et al., 2022a, arXiv e-prints, p. arXiv:2212.04381
- Furtak et al. (2022b) Furtak L. J., et al., 2022b, arXiv e-prints, p. arXiv:2212.10531
- Ge et al. (2019) Ge X., Zhao B.-X., Bian W.-H., Frederick G. R., 2019, AJ, 157, 148
- Ginsburg et al. (2014) Ginsburg A., Robitaille T., Beaumont C., ZuHone J., 2014, Release Candidate 2 - includes yt interop, doi:10.5281/zenodo.11485, https://doi.org/10.5281/zenodo.11485
- Glikman et al. (2011) Glikman E., Djorgovski S. G., Stern D., Dey A., Jannuzi B. T., Lee K.-S., 2011, ApJ, 728, L26
- Golubchik et al. (2022) Golubchik M., Furtak L. J., Meena A. K., Zitrin A., 2022, ApJ, 938, 14
- Gültekin et al. (2009) Gültekin K., et al., 2009, ApJ, 698, 198
- Harikane et al. (2023) Harikane Y., et al., 2023, arXiv e-prints, p. arXiv:2303.11946
- Hunter (2007) Hunter J. D., 2007, Computing in Science & Engineering, 9, 90
- Inada et al. (2003) Inada N., et al., 2003, Nature, 426, 810
- Inada et al. (2006) Inada N., et al., 2006, ApJ, 653, L97
- Inoue et al. (2014) Inoue A. K., Shimizu I., Iwata I., Tanaka M., 2014, MNRAS, 442, 1805
- Jullo et al. (2007) Jullo E., Kneib J.-P., Limousin M., Elíasdóttir Á., Marshall P. J., Verdugo T., 2007, New Journal of Physics, 9, 447
- Keeton (2001) Keeton C. R., 2001, ArXiv Astrophysics e-prints,
- Kocevski et al. (2023) Kocevski D. D., et al., 2023, arXiv e-prints, p. arXiv:2302.00012
- Kohno (2019) Kohno K., 2019, in ALMA2019: Science Results and Cross-Facility Synergies. p. 64, doi:10.5281/zenodo.3585294
- Laporte et al. (2017) Laporte N., et al., 2017, ApJ, 837, L21
- Larson et al. (2023) Larson R. L., et al., 2023, arXiv e-prints, p. arXiv:2303.08918
- Li et al. (2021) Li J. I. H., et al., 2021, ApJ, 906, 103
- Lyke et al. (2020) Lyke B. W., et al., 2020, ApJS, 250, 8
- Madau & Haardt (2015) Madau P., Haardt F., 2015, ApJ, 813, L8
- Mainali (2019) Mainali R., 2019, PhD thesis, University of Arizona
- Mainali et al. (2017) Mainali R., Kollmeier J. A., Stark D. P., Simcoe R. A., Walth G., Newman A. B., Miller D. R., 2017, ApJ, 836, L14
- Martinez et al. (2023) Martinez M. N., et al., 2023, ApJ, 946, 63
- Mediavilla et al. (2011) Mediavilla E., et al., 2011, ApJ, 730, 16
- Mejía-Restrepo et al. (2016) Mejía-Restrepo J. E., Trakhtenbrot B., Lira P., Netzer H., Capellupo D. M., 2016, MNRAS, 460, 187
- Millon et al. (2020) Millon M., et al., 2020, A&A, 640, A105
- Napier et al. (2023) Napier K., Sharon K., Dahle H., Bayliss M., Gladders M. D., Mahler G., Rigby J. R., Florian M., 2023, arXiv e-prints, p. arXiv:2301.11240
- Netzer (2013) Netzer H., 2013, The Physics and Evolution of Active Galactic Nuclei
- Niida et al. (2020) Niida M., et al., 2020, The Astrophysical Journal, 904, 89
- Ofek (2014) Ofek E. O., 2014, MAAT: MATLAB Astronomy and Astrophysics Toolbox, Astrophysics Source Code Library, record ascl:1407.005 (ascl:1407.005)
- Oguri et al. (2013) Oguri M., et al., 2013, MNRAS, 429, 482
- Oke & Gunn (1983) Oke J. B., Gunn J. E., 1983, ApJ, 266, 713
- Onoue et al. (2023) Onoue M., et al., 2023, ApJ, 942, L17
- Park et al. (2015) Park D., Woo J.-H., Bennert V. N., Treu T., Auger M. W., Malkan M. A., 2015, ApJ, 799, 164
- Pascale et al. (2022) Pascale M., et al., 2022, ApJ, 938, L6
- Peng et al. (2010) Peng C. Y., Ho L. C., Impey C. D., Rix H.-W., 2010, AJ, 139, 2097
- Peterson (2009) Peterson B. M., 2009, in Cepa J., ed., , The Emission-Line Universe. p. 138
- Pilbratt et al. (2010) Pilbratt G. L., et al., 2010, A&A, 518, L1
- Planck Collaboration et al. (2016) Planck Collaboration et al., 2016, A&A, 594, A13
- Popović (2020) Popović L. C., 2020, Open Astronomy, 29, 1
- Price-Whelan et al. (2018) Price-Whelan A. M., et al., 2018, AJ, 156, 123
- Ricci et al. (2021) Ricci C., et al., 2021, MNRAS, 506, 5935
- Rieke et al. (2009) Rieke G. H., Alonso-Herrero A., Weiner B. J., Pérez-González P. G., Blaylock M., Donley J. L., Marcillac D., 2009, ApJ, 692, 556
- Riess et al. (2021) Riess A. G., Casertano S., Yuan W., Bowers J. B., Macri L., Zinn J. C., Scolnic D., 2021, ApJ, 908, L6
- Rojas et al. (2014) Rojas K., Motta V., Mediavilla E., Falco E., Jiménez-Vicente J., Muñoz J. A., 2014, ApJ, 797, 61
- Sameshima et al. (2011) Sameshima H., Kawara K., Matsuoka Y., Oyabu S., Asami N., Ienaka N., 2011, MNRAS, 410, 1018
- Schindler et al. (2016) Schindler J.-T., Fan X., Duschl W. J., 2016, ApJ, 826, 67
- Sharon et al. (2017) Sharon K., et al., 2017, ApJ, 835, 5
- Shen et al. (2020) Shen X., Hopkins P. F., Faucher-Giguère C.-A., Alexander D. M., Richards G. T., Ross N. P., Hickox R. C., 2020, MNRAS, 495, 3252
- Shu et al. (2018) Shu Y., Marques-Chaves R., Evans N. W., Pérez-Fournon I., 2018, MNRAS, 481, L136
- Stalevski et al. (2012) Stalevski M., Fritz J., Baes M., Nakos T., Popović L. Č., 2012, MNRAS, 420, 2756
- Stalevski et al. (2016) Stalevski M., Ricci C., Ueda Y., Lira P., Fritz J., Baes M., 2016, MNRAS, 458, 2288
- Sun et al. (2022) Sun F., et al., 2022, ApJ, 932, 77
- Suyu et al. (2013) Suyu S. H., et al., 2013, ApJ, 766, 70
- Suyu et al. (2017) Suyu S. H., et al., 2017, MNRAS, 468, 2590
- Trakhtenbrot et al. (2017) Trakhtenbrot B., Volonteri M., Natarajan P., 2017, ApJ, 836, L1
- Uematsu et al. (2023) Uematsu R., et al., 2023, ApJ, 945, 121
- Vidal-García et al. (2022) Vidal-García A., Plat A., Curtis-Lake E., Feltre A., Hirschmann M., Chevallard J., Charlot S., 2022, arXiv e-prints, p. arXiv:2211.13648
- Virtanen et al. (2020) Virtanen P., et al., 2020, Nature Methods, 17, 261
- Wang et al. (2018) Wang F., et al., 2018, ApJ, 869, L9
- Wang et al. (2021) Wang F., et al., 2021, The Astrophysical Journal Letters, 907, L1
- Yang et al. (2020) Yang G., et al., 2020, MNRAS, 491, 740
- Yang et al. (2022) Yang G., et al., 2022, ApJ, 927, 192
- Zitrin et al. (2015) Zitrin A., et al., 2015, ApJ, 801, 44
- van der Walt et al. (2011) van der Walt S., Colbert S. C., Varoquaux G., 2011, Computing in Science Engineering, 13, 22