Present address: ]Center for Integrated Nanostructure Physics (CINAP), Institute for Basic Science (IBS), Sungkyunkwan University, Suwon 16419, Republic of Korea.
Ferromagnetism and Metal-Insulator transition in F-doped LaMnO3
Abstract
We present our studies on polycrystalline samples of fluorine doped LaMnO3 (LaMnO3-yFy). LaMnO2.5F0.5 exhibits remarkable magnetic and electrical properties. It shows ferromagnetic and metallic behavior with a high Curie temperature of K and a high magnetoresistance of 64. This drastic change in magnetic properties in comparison to pure LaMnO3 is ascribed to the presence of mixed-valence Mn ions driven by the F-doping at the O-sites, which enables double exchange (DE) in LMOF. Furthermore, the resistivity data exhibits two resistivity peaks at 239 K and 213 K, respectively. Our results point towards the possibility of multiple double exchange hopping paths of two distinct resistances existing simultaneously in the sample below 213 K.
I Introduction
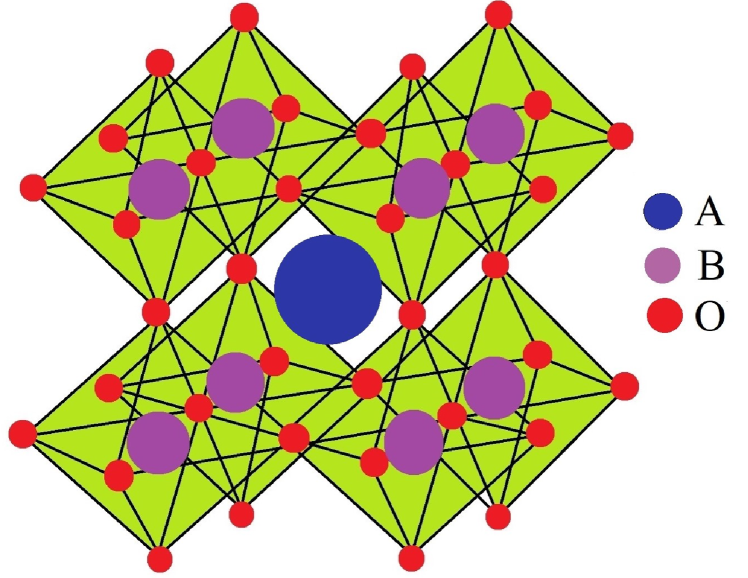
Perovskite manganites have been known to exhibit exotic phenomena such as colossal magnetoresistance (CMR), ferromagnetism, half-metallic behavior [1, 2, 3] etc. Perovskites have the chemical formula ABO3. In perovskite manganites the smaller B ions (transition metals) sit at the center of an oxygen octahedra BO6 as shown in Fig. 1. The exotic properties of manganites are derived from the parent compound LaMnO3 (LMO), which is an insulating A-type antiferromagnet with a Néel temperature of 140 K [4, 5, 6]. LMO being an antiferromagnetic insulator, is “interesting but useless”, to quote Louis Néel from his Nobel prize speech. A common strategy to extract “useful” properties out of LMO is doping the A-sites with divalent atoms. A large number of these exciting phenomena results from doping the La-site of the parent compound LaMnO3. Prominent examples include compounds such as La1-xSrxMnO3 (LSMO), La1-xPrxCa0.375MnO3 (LPCMO), La1-xCaxMnO3 (LCMO) etc., which exhibit rich phase diagrams at various dopant concentrations [7, 8, 9, 10, 11]. It is observed that for a certain range of the value of the doping concentration , we can induce ferromagnetism and metallic properties in LMO. In the case of LSMO, the range of is [12, 13].
Doping at the A-site or the La-site with divalent ions results in a mixed valency of the Mn ions i.e. Mn3+/Mn4+ [14, 15]. The Mn3+/Mn4+ ions occupy the B-site of the LMO lattice. Mixed valency of Mn is essential for the ferromagnetic and metallic behavior, which result from the double exchange (DE) hopping of electrons along the MnOMn4+ chains from one B-site to another B-site in the manganite lattice [16]. The DE hopping depends on the MnOMn4+ bond angle, [17]. Double exchange hopping is maximum for , and decreases as deviates from . Consequently, ferromagnetic and metallic properties of manganites are very sensitive to distortions of the MnO6 octahedra.
An alternate route to tune the properties of manganites is doping at the anion sites. Although La site doping of LMO has been studied extensively, there are very few reports on O-site doping of LMO. One possible way is to dope the O-site with fluorine [18, 19]. Here, we present our studies on F doping of LMO sample. We observe, that on F doping, the LMO sample exhibits ferromagnetic and metallic behavior with high values of magnetoresistance (MR). The ferromagnetic properties are at par with La-site doped manganites.
II Experimental Details
LaMnO3-yFy (LMOF) samples (with ) were synthesized by the solid state reaction method. Powders of La2O3, Mn2O3 and LaF3 were taken in stoichiometric ratios and were ground and mixed thoroughly using a mortar and pestle for 45 minutes. The ground powder was sintered in air for 24 hours at a fixed temperature of 600∘C, 700∘C, 800∘C, 900∘C, 1000∘C and 1100∘C. Before each sintering process, the powder was thoroughly ground in a mortar and pestle. Finally, the mixed powder was pressed into a pellet and annealed in air at 900∘C.
X-ray diffraction (XRD) and Energy-dispersive X-ray spectroscopy (EDX) was used for structural characterization and elemental analysis of the samples, respectively. XRD was performed using a Panalytical Expert Pro X-ray diffractometer with a CuKα1 radiation. JXA-8230 Electron Probe Microanalyzer (JEOL Ltd.) was used for determining the chemical composition. Iodometric titration was also used for determination of oxygen content. The electrical and magnetotransport measurements were carried out in a Quantum design physical property measurement system (PPMS). Standard four-probe technique was used for the electrical resistivity measurements. X-ray photoemission spectroscopy (XPS) measurement (using AlKα X-ray source, eV, PHI 5000 Versa Probe II, FEI Inc.) was carried out to determine the valence states of Mn and La in LMOF.
III RESULT AND DISCUSSION
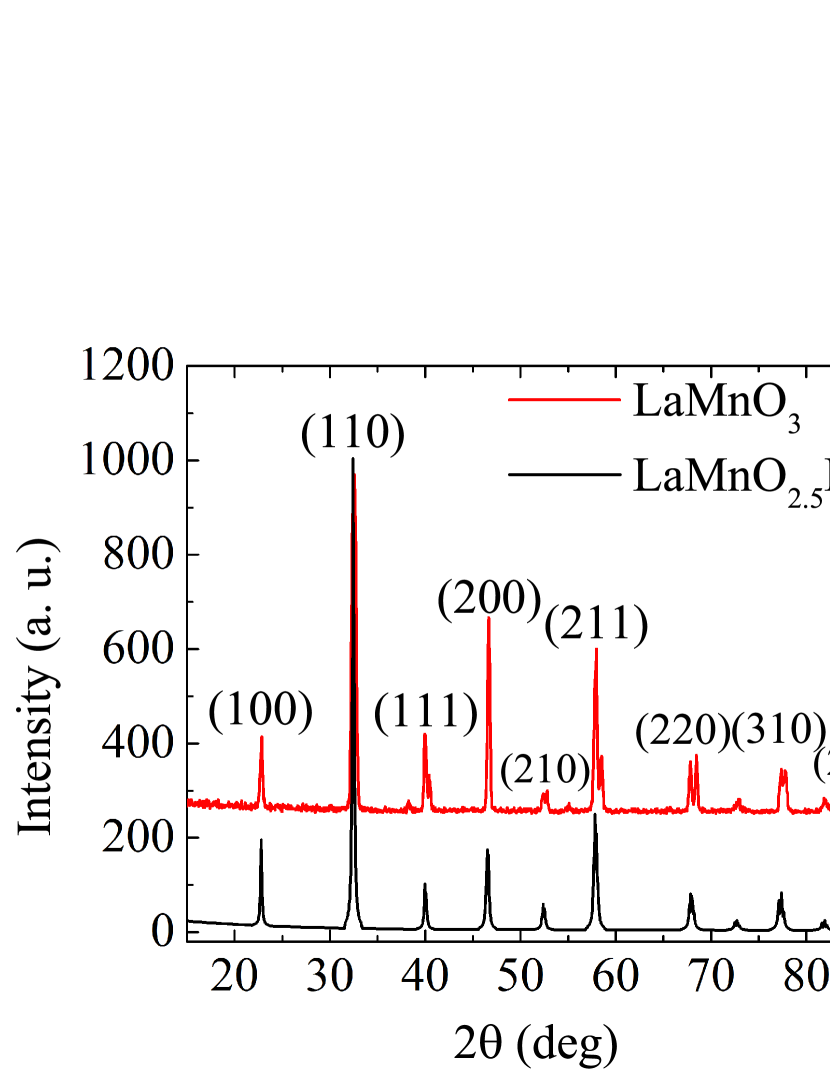
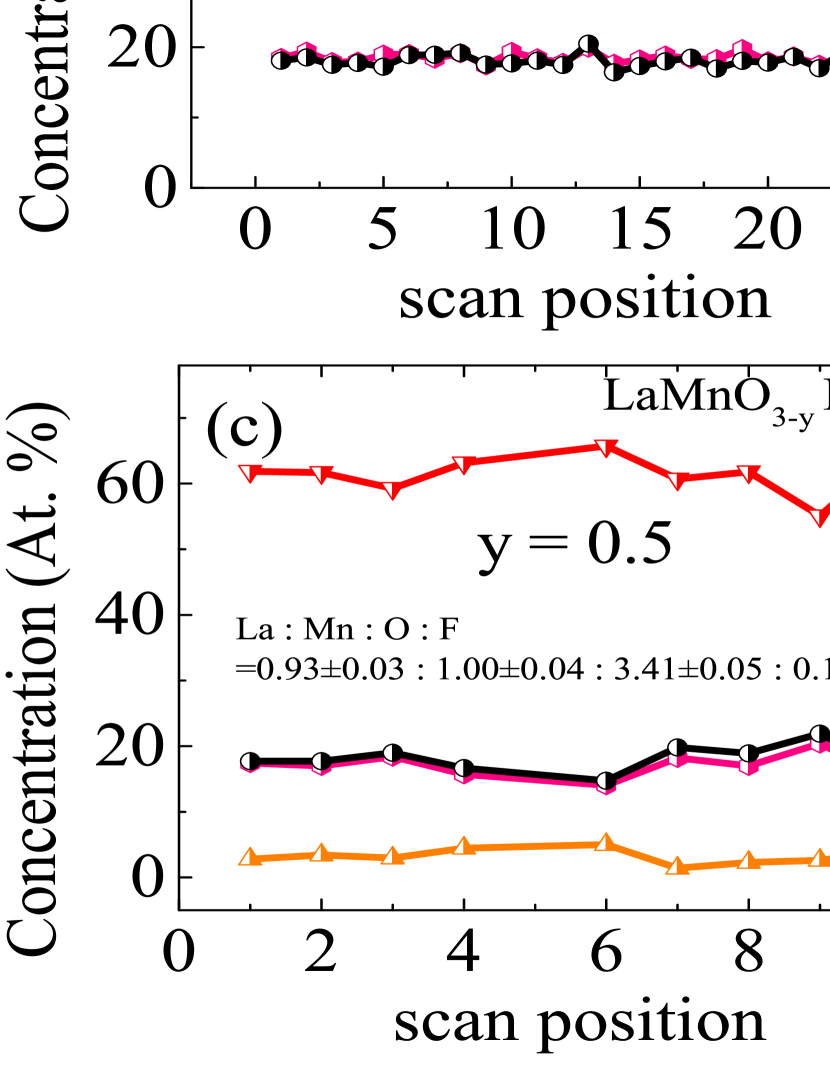
The results of the XRD measurement carried out on the LMOF sample with is shown in Fig. 2(a) (unless stated explicitly, LMOF denotes F doping concentration of in the rest of the text). For comparison the XRD result of an LMO control sample is also shown in Fig. 2 (a) (red line). The XRD data reveals coinciding LMO and LMOF peaks indicating that LMOF also maintains the same perovskite structure as LMO. The absence of extra peaks in the XRD data confirms the absence of any secondary phases in the LMOF sample. The lattice parameters of LMO sample was determined to be 0.5483 nm, 0.7803 nm, 0.5543 nm which are comparable to the values reported by others [20]. The lattice parameters of LMOF are 0.5477 nm, 0.7802 nm, 0.5542 nm. The grain size of the different LMOF samples determined using Scherrer’s formula are 29 nm, 39 nm and 32 nm for different F concentrations with 0.25, 0.50 and 0.75, respectively. EDX measurements (at room temperature) on different regions of the LMOF sample show La deficiency. EDX data for undoped and F-doped LMO samples are shown in Fig. 3 along with atomic ratio of all elements. For undoped LMO, EDX [Fig. 3(a)] reveals La : Mn : O = 1.02 0.01 : 1.00 0.01 : 3.50 0.01 with excess oxygen and with atomic concentration ( standard error) La = 18.48 0.46, Mn = 18.04 0.78, O = 63.44 1.99. The atomic ratio averaged over many point scans for different F-doped samples are depicted in the Fig. 3(b)-(d). For 0.5 F-doped LMO it is La : Mn : O : F = 0.93 0.03 : 1 0.04 : 3.41 0.05 : 0.17 0.02 (with at. concentration La = 17.00 0.60, Mn = 18.10 0.65, F = 3.21 0.35, O = 61.54 0.97). For undoped LMO, at of the cations are La=18.48 and Mn=18.04. Similarly, for F-doped LMO it is La=17.00 and Mn=18.10. It is clearly seen that the Mn content is more or less the same in both the doped and undoped LMO, whereas La content decreases in the F-doped sample. Thus, it is reasonable to normalize with respect to Mn rather than La. For all F-doped samples, fluorine concentration is seen to increase monotonically (0.11 0.02, 0.17 0.02, 0.21 0.03) but is less than the intended value of y=0.25, 0.5 and 0.75, respectively. EDX data shows considerably higher value of oxygen concentration for both undoped and F-doped LMO.
The low atomic number of oxygen makes it difficult for EDX measurements to make reliable estimate of its concentration in oxides. Therefore, we also performed iodometric titration[21, 22] to further determine the oxygen concentration in both doped and undoped LMO samples. Titration involves slowly adding a chemical substance to a reaction mixture till the chemical change is complete. For undoped LMO, iodometric titration yields a concentration of 3.21 with an excess oxygen of 0.21. The excess oxygen obtained with this method is much less than the EDX value of 0.5 for undoped LMO. Similarly, for 0.5 F-doped LMO, it shows a concentration of 3.15, with excess oxygen of 0.15. This is again less than the excess oxygen value obtained from EDX for 0.5 F-doped LMO (which is 0.41). Combining the EDX and iodometric titration we conclude that the undoped and doped samples have some excess oxygen and there is a systematic increase of F-content for different F-doped samples. The excess oxygen is due to sintering and annealing of the samples in air.
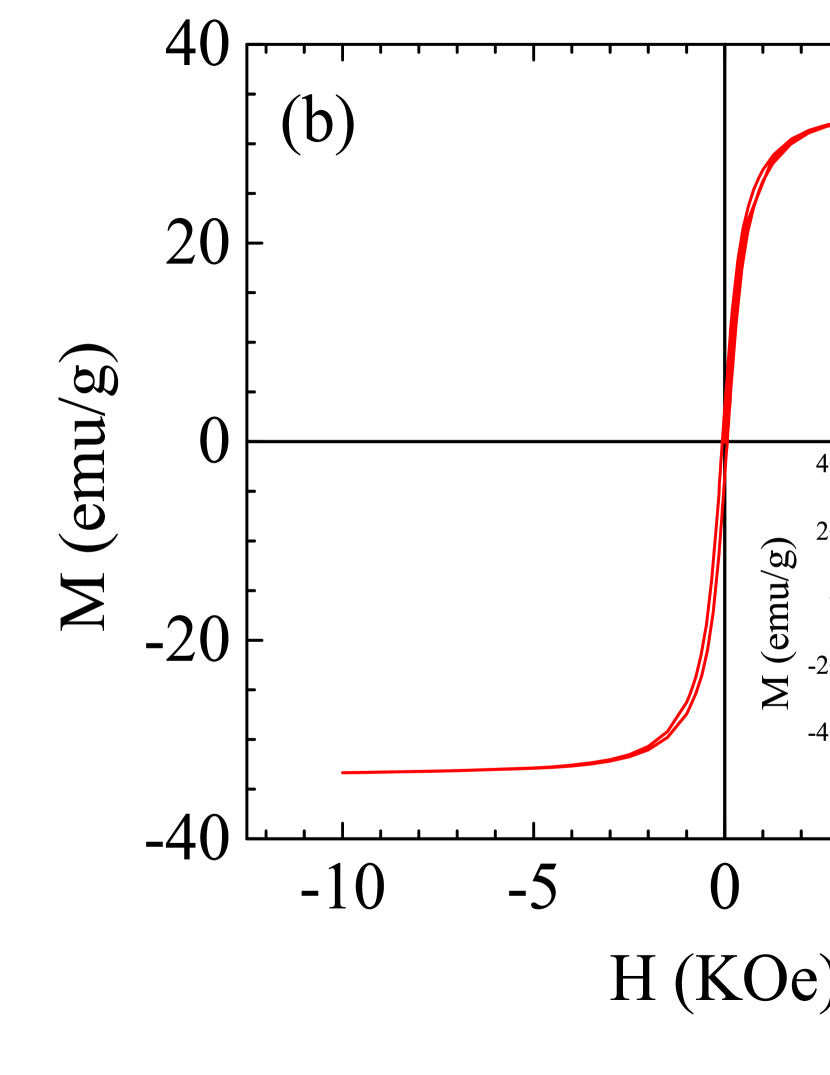
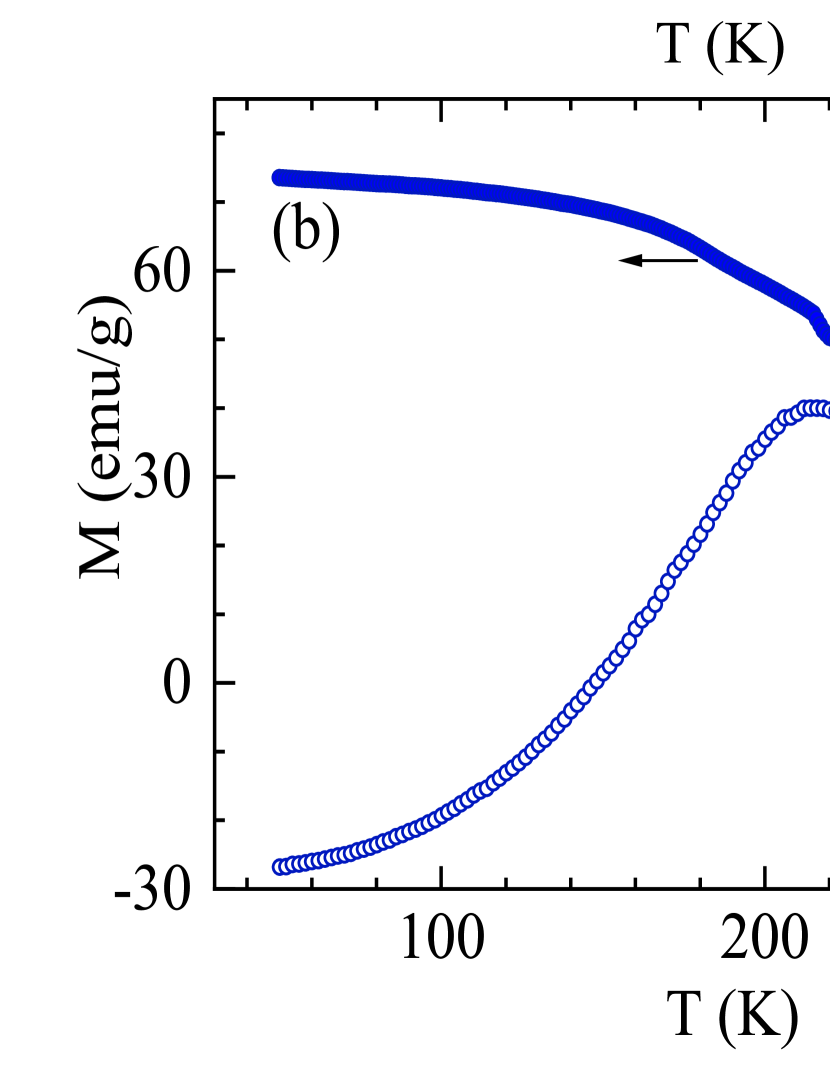
A very interesting feature of our LMOF sample is the observation of a ferromagnetic transition close to room temperature. Figure 4(a) displays the results of the field cooled (FC) and zero field cooled (ZFC) magnetization measurement as a function of temperature. For the FC measurement the sample was cooled in an applied field of 2000 Oe and the data acquisition was carried out during the heating cycle. The Curie temperature of the ferromagnetic transition is 238 K. Another ferromagnetic transition is also observed in the data at 217 K, indicating the presence of two distinct ferromagnetic exchanges in the LMOF sample. measurement done at 120 K [shown in Fig. 4(b)] exhibits a hysteresis loop typical of ferromagnets, further confirming the ferromagnetic nature of LMOF below the Curie temperature.
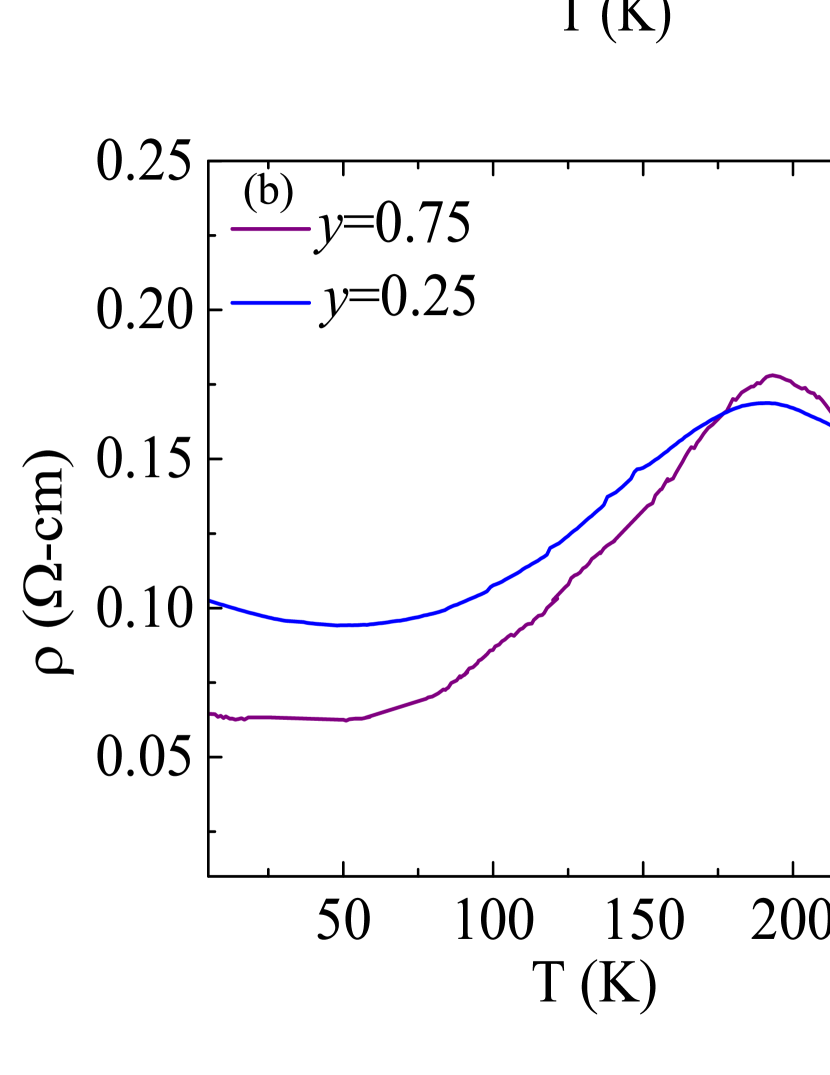
To further probe the nature of ferromagnetism we carried out electrical transport measurements on the LMOF sample, the results of which are shown in Fig. 5(a). The sample exhibits a metallic behavior with a metal-insulator transition (MIT) at K and another slightly broad resistivity peak at K. It is to be noted that the undoped LMO control sample exhibits an insulating behavior without any MIT as can be seen in the upper inset of Fig. 5(a). Hall measurement carried out at 300 K on the LMOF sample reveals hole-type carriers, inferred from the positive slope of the curve [shown in lower inset of Fig. 5(a)]. The carrier concentration was determined to be 0.18 1022 cm-3. For comparison, we also carried out resistivity measurements on two additional LaMnO3-yFy samples with 0.25 and 0.75 . Their resistivity data also exhibit metallic behavior with similar double peaks as shown in Fig. 5(b). The field dependent resistivity data of LMOF is shown in Fig. 6(a). In the presence of a 7 T magnetic field both the resistivity peaks at and are suppressed and are also shifted to higher temperatures by an amount of 40 K and 22 K, respectively, suggestive of a similar magnetic origin of the two peaks. Moreover, a large magnetoresistance [MR] of about 64 and 50 is also observed at and , respectively. The MR below show no significant change with temperature. Interestingly, the onset of the ferromagnetic transition and the MIT temperature coincide [shown in Fig. 6(b)]. This result strongly suggests that the ferromagnetic and the metallic properties of LMOF are related. One such example of concurrent ferromagnetic and metallic behavior in A-site doped LMO (such as LSMO, LCMO) results from double exchange mechanism [13, 23], where the charge carriers are holes. Such DE mechanism in LMOF is only possible in the presence of mixed valence of Mn. Also, the resistivity peak coincides with the ferromagnetic transition in the data at K, which further indicates that is related to ferromagnetic properties of the sample.
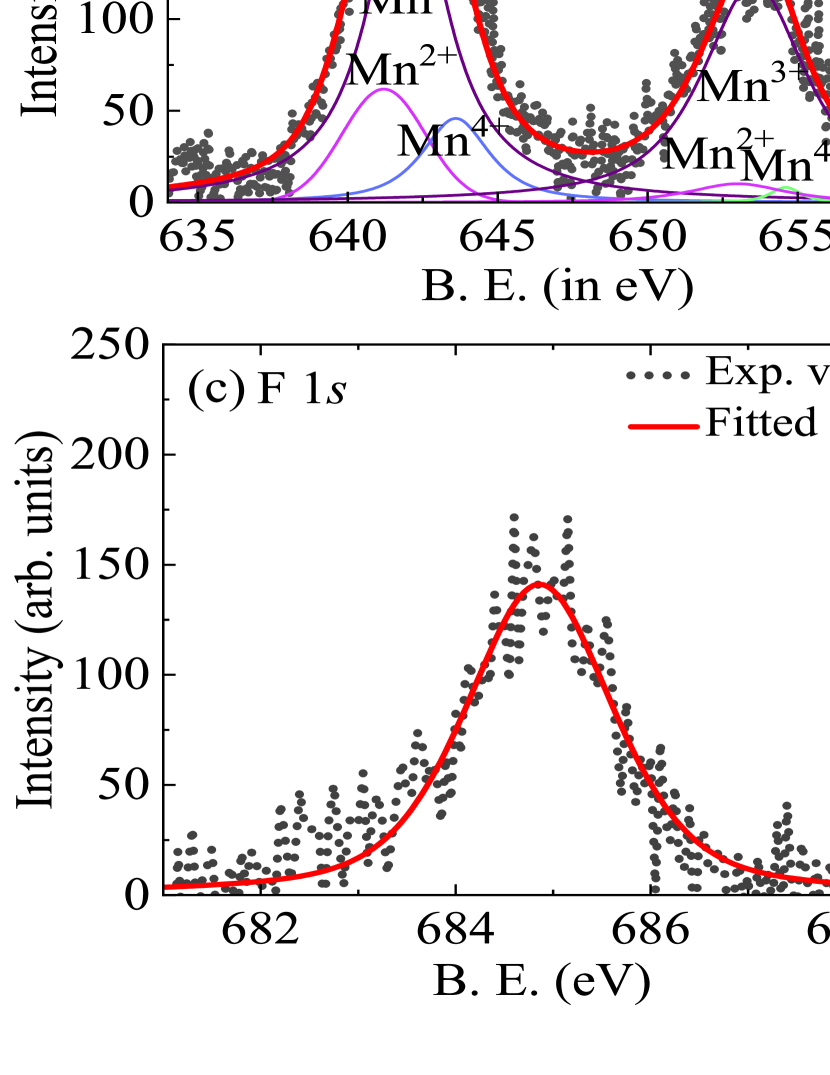
The core level XPS spectra of the LMOF sample is shown in Fig. 7. Mn in LMOF exhibits a mixed valence state as is apparent from its XPS spectra displayed in Fig. 7(a). Analysis of the XPS spectra for Mn reveals a valence state of Mn2+, Mn3+ and Mn4+. The Mn2+, Mn3+ and Mn4+ peak positions occur at 641.0, 642.1, 643.6 and 653.0, 653.6, 654.6 for the 2 and 2 spin-orbit split peaks, respectively, which are similar to earlier reported values [24, 25]. The XPS spectra of La [shown in Fig. 7(b)] determines its valence state to be La3+ [26]. The deconvoluted La 3 and 3 show multiple peaks due to La binding with oxide and hydroxyl species and also final state effects. The peaks A, C, E and G correspond to La binding with oxides while the peaks B, D and F correspond to La binding with hydroxyl species [26]. F 1 and O 1 XPS spectra are shown in Fig. 7(c) and (d), respectively. The additional peak at 531.5 eV in the O 1 XPS spectra is ascribed to the formation of hydroxyl species [27].
Thus, F doping induces a mixed valence state of the Mn ions. Using resonant inelastic X-Ray Spectroscopy Orgiani et al., have established that Mn2+ ions occupy the La site in LMO [28], which probably explains the La deficiency in our LMOF sample. The origin of the Mn2+ is due to the sample’s tendency to maintain charge neutrality upon F doping. Mn2+ ions occupying the La-sites is analogous to A-site doping of manganites by divalent atoms (such as in LSMO, LCMO etc.). It leads to the generation of Mn4+ ions at the B (or the Mn) sites of LMOF. With the assumption that the La deficient sites (we deduce La deficiency of 0.07 per unit cell from EDX measurement) are occupied by Mn2+, we obtain a doping level of 0.07 Mn2+ ions per unit cell at the A-site. In analogy with A-site doped manganites (with divalent atoms such as Sr, Ca etc.), we obtain a carrier concentration of 0.07 holes per unit cell. Furthermore, Hall measurement at 300 K confirms hole-type carriers with a concentration of 0.18 1022 cm-3. Using the volume of the unit cell obtained from XRD data, we determine the carrier concentration to be 0.11 holes per unit cell, which is comparable with the EDX result. This result further supports Mn2+ occupancy of the A-sites.
The presence of Mn3+/Mn4+ in LMOF does provide a fertile ground for the existence of double exchange, which would explain its metallic and ferromagnetic properties below . On the other hand, F- doping at the O2- sites will break the MnOMn4+ DE chain, which should degrade the metallic and ferromagnetic properties. The Mn ions occupying the A-sites have a considerably longer MnO bond lengths (2.7 Å) as compared to when the Mn ions occupy the B-sites (1.9 Å) [28]. Additionally, the occupation of the La sites by the smaller Mn2+ ions would result in lattice distortions which would also lead to a decrease in DE hopping. Against this conflicting backdrop, the observed persisting ferromagnetism and metallic behavior of LMOF is very much intriguing.
A fascinating feature of the LMOF sample is the presence of two resistivity peaks in data at and . Double peak in the resistivity of manganites have been reported earlier. Such double peaks were ascribed to the presence of excess oxygen in the manganites samples [29], grain size [30] and grain boundary effects [31, 32]. The results of EDX and iodometric titration show oxygen excess in both undoped and F-doped LMO samples. However, double peaks in is observed only in F-doped LMO. This confirms that the double peak feature originates exclusively from F-doping. The peak at that originate due to small polycrystal grain size exhibit low MR which is typically less than 20 as reported in literature [30]. However, the MR at (at 7 T) is high in the LMOF sample, with a value of 50. The grain boundary effects manifest themselves as a gradual increase in MR as the temperature is lowered, with MR increasing to a value which is comparable to the MR value at at the lowest temperatures [33]. No such MR behavior is observed in the LMOF sample [please see Fig. 6(a)]. MR is more or less independent of temperature below . The last two observations discount the possibility of grain size and grain boundary effects as the origin of double peak in the resistivity data. Another important feature to note is the presence of an additional magnetic transition in the data at , which roughly corresponds to the second resistivity peak at [see Fig. 6(b)]. Moreover, a large MR of 50 is observed at . These results indicate that the second resistivity peak is related to ferromagnetic properties of the sample.
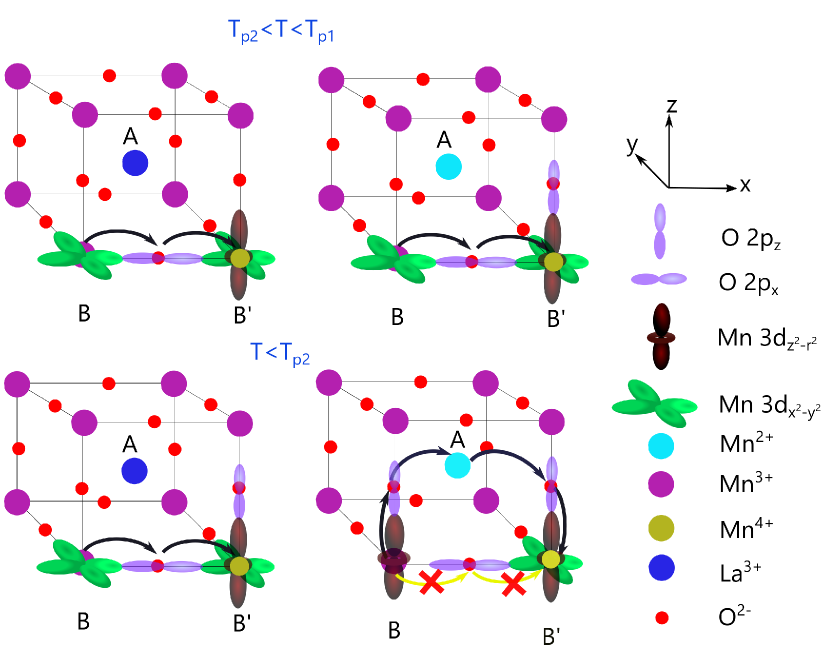
The persistent ferromagnetism and metallic properties of LMOF may have its origin in the presence of Mn2+ ions at the La site. Such occupancy of the A-site by divalent Mn2+ would explain the hole-type carriers and the mixed-valent Mn3+/Mn4+ (in the LMOF sample) observed in the Hall and XPS measurements, respectively. The observed ferromagnetism may also originate from excess oxygen in LMOF. The excess oxygen can increase Mn4+ concentration thereby facilitating double exchange. However, we do not observe ferromagnetism and metallic behavior in the undoped LMO sample with a similar oxygen excess. Thus, ferromagnetism in LMOF originates exclusively from F-doping. In LMO containing Mn2+, it has been shown that an additional double exchange hopping path via an intermediate Mn2+ ion (MnOMnOMn4+) exists [28], other than the conventional Mn3+/Mn4+ (MnOMn4+) hopping path. This DE hopping path involves electron hopping along BAB′ sites (B′ is a neighboring B site) in contrast to conventional DE, where the hopping sites are BB′ in the manganite lattice (shown in Fig. 8). We suspect that the second peak in the resistivity data at is on account of double exchange hopping along this additional path. The FM ordering at , further lends some credibility to our assumption. We could model the LMOF sample as consisting of some Mn-ions at B sites (Mn Mn4+) and some at A sites (Mn2+), which exhibit ferromagnetic ordering at different temperatures and , respectively. The ferromagnetic ordering of the A and B sites originate from DE hopping of electrons via the BB′ and BAB′ hopping paths. Furthermore, the two DE paths exhibit different resistance. The higher resistance path include DE hopping via the Mn2+ ions located at the A-sites. Due to the decreased angle (180∘) between the Mn ions and the longer hopping path, it will have a higher resistance. Whereas the lower resistance path involves DE hopping via the conventional MnOMn4+ chains which occupy the B-sites with angle between the neighboring Mn ions close to 180∘. In the temperature range of the metallic behavior is due to DE hopping via the low resistance path. At the Mn2+ ions at the A-sites start to exhibit ferromagnetic order, which implies that a DE hopping via the high resistance path is also activated. One possible trigger for the activation of DE hopping along BAB′ is local orbital ordering of Mn3+ orbitals. Local ordering of Mn3+ orbitals have been observed in thin films of LSMO and LMO [34, 35]. Here due to the presence of Mn2+ at the A-sites, orbitals of Mn3+ (at the B-sites) order along the direction (i.e. electrons occupy the orbital) [34, 35]. Consequently, for those lattices where Mn2+ ions occupy the A-site, hopping takes place via the orbital. It is also interesting to note that this orbital ordering prevailed despite the presence of a tensile strain from the substrate on the LSMO film which would have otherwise preferred an in-plane (i.e. ) orbital ordering [35]. Thus, such local orbital ordering of Mn3+ is attributed to the presence of Mn2+ at the A-sites. Such a local orbital ordering of Mn3+ orbitals is the only possible scenario that favor hopping along BAB′ as shown in Fig. 8 (since DE hopping takes place only in the presence of orbital overlap between the participating Mn ions and the intermediate O ion). Mn3+ being Jahn-Teller (JT) active, its orbitals ( and ) are non degenerate, whereas Mn2+ and Mn4+ are JT inactive and hence their orbitals are degenerate. In the temperature range , electrons occupy the lower energy in-plane orbital. As a result the orbital overlap is in the in-plane direction leading to conventional DE (as shown in top panel of Fig. 8). At the Mn3+ orbitals in the lattice containing Mn2+ ions at the A-sites order locally along the out-of plane direction, i.e. the energy of the orbital is lowered. Consequently, orbital overlap with the O ions take place along the out-of plane direction as shown in the bottom panel of Fig. 8. This results in a DE hopping along the high resistance BAB′ path. Thus, below the electron hopping is along the low resistance BB′ and high resistance BAB′ paths in series. Such low resistance and high resistance paths in series leads to a re-emergent MIT in manganites [36]. The second resistivity upturn at in the LMOF sample can be explained in terms of addition of the resistance of the two paths. Initially at , the resistivity of the sample increases due to the inclusion of the high resistance BAB′ path. Below , more number of hopping paths via Mn2+ are activated. As a result, the resistance starts to decrease again after an initial increase at as temperature is further lowered.
IV Conclusion
To conclude, we prepared flourine doped LaMnO3 polycrystalline samples using solid state reaction method. The LMOF samples exhibit ferromagnetic and metallic properties which are similar to La-site doped manganites. The Curie temperature is 239 K and a high MR of 64 is observed. The ferromagnetic and metallic behavior is ascribed to DE mechanism. Furthermore, the resistivity data exhibits two resistivity peaks around the same temperature at which the data exhibit two magnetic transitions. Our XPS studies show the presence of Mn2+, Mn3+ and Mn4+ ions in the LMOF sample. The two peaks in the resistivity data are attributed to the presence of multiple DE hopping paths i.e. one along MnOMn4+ and another along MnOMnOMn4+. Our study shows that anion site doping of perovskite manganite can be a robust technique to explore new and exciting physics in perovskite manganites.
V Acknowledgement
We gratefully acknowledge financial support from IIT Kanpur, India and Department of Science and Technology, India. ZH would like to acknowledge the Polish National Agency for Academic Exchange (NAWA) for Ulam Fellowship. We also thank Namrata Singh for helping us with iodometric titration.
References
- Dagotto [2010] E. Dagotto, Nanoscale Phase Separation and Colossal Magnetoresistance: The Physics of Manganites and Related Compounds (Springer Series in Solid-State Sciences, 136), softcover reprint of hardcover 1st ed. 2003 ed. (Springer, 2010).
- Schiffer et al. [1995] P. Schiffer, A. P. Ramirez, W. Bao, and S.-W. Cheong, Phys. Rev. Lett. 75, 3336 (1995).
- Tovstolytkin et al. [2007] A. I. Tovstolytkin, A. M. Pogorily, D. I. Podyalovskii, V. M. Kalita, A. F. Lozenko, P. O. Trotsenko, S. M. Ryabchenko, A. G. Belous, O. I. V’yunov, and O. Z. Yanchevskii, Journal of Applied Physics 102, 063902 (2007).
- Fontcuberta et al. [1996] J. Fontcuberta, B. Martinez, A. Seffar, S. Pinol, J. L. Garcia-Munoz, and X. Obradors, Phys. Rev. Lett. 76, 1122 (1996).
- Kalyana Lakshmi et al. [2008] Y. Kalyana Lakshmi, G. Venkataiah, M. Vithal, and P. Venugopal Reddy, Physica B: Condensed Matter 403, 3059 (2008).
- Snyder et al. [1996] G. J. Snyder, R. Hiskes, S. DiCarolis, M. R. Beasley, and T. H. Geballe, Phys. Rev. B 53, 14434 (1996).
- Mahendiran et al. [1996] R. Mahendiran, S. K. Tiwary, A. K. Raychaudhuri, T. V. Ramakrishnan, R. Mahesh, N. Rangavittal, and C. N. R. Rao, Phys. Rev. B 53, 3348 (1996).
- He et al. [2012] J. He, M.-X. Chen, X.-Q. Chen, and C. Franchini, Phys. Rev. B 85, 195135 (2012).
- Salamon and Jaime [2001] M. B. Salamon and M. Jaime, Rev. Mod. Phys. 73, 583 (2001).
- Ghising et al. [2020] P. Ghising, B. Samantaray, and Z. Hossain, Phys. Rev. B 101, 024408 (2020).
- Ghising and Hossain [2019] P. Ghising and Z. Hossain, Phys. Rev. B 100, 115119 (2019).
- Tokura et al. [1994] Y. Tokura, A. Urushibara, Y. Moritomo, T. Arima, A. Asamitsu, G. Kido, and N. Furukawa, Journal of the Physical Society of Japan 63, 3931 (1994).
- Urushibara et al. [1995] A. Urushibara, Y. Moritomo, T. Arima, A. Asamitsu, G. Kido, and Y. Tokura, Phys. Rev. B 51, 14103 (1995).
- Kusters et al. [1989] R. Kusters, J. Singleton, D. Keen, R. McGreevy, and W. Hayes, Physica B: Condensed Matter 155, 362 (1989).
- Roy et al. [2001] S. Roy, Y. Q. Guo, S. Venkatesh, and N. Ali, Journal of Physics: Condensed Matter 13, 9547 (2001).
- Zener [1951] C. Zener, Phys. Rev. 82, 403 (1951).
- Bahadur and Dunlap [1998] D. Bahadur and R. A. Dunlap, Bulletin of Materials Science 21, 393 (1998).
- Nowroozi et al. [2017] M. A. Nowroozi, K. Wissel, J. Rohrer, A. R. Munnangi, and O. Clemens, Chemistry of Materials 29, 3441 (2017).
- Wissel et al. [2018] K. Wissel, J. Heldt, P. B. Groszewicz, S. Dasgupta, H. Breitzke, M. Donzelli, A. I. Waidha, A. D. Fortes, J. Rohrer, P. R. Slater, G. Buntkowsky, and O. Clemens, Inorganic Chemistry 57, 6549 (2018).
- Thygesen et al. [2017] P. M. M. Thygesen, C. A. Young, E. O. R. Beake, F. D. Romero, L. D. Connor, T. E. Proffen, A. E. Phillips, M. G. Tucker, M. A. Hayward, D. A. Keen, and A. L. Goodwin, Phys. Rev. B 95, 174107 (2017).
- Mefford et al. [2014] J. T. Mefford, W. G. Hardin, S. Dai, K. P. Johnston, and K. J. Stevenson, Nature Materials 13, 726 (2014).
- Laiho et al. [2003] R. Laiho, K. Lisunov, E. Lähderanta, P. Petrenko, J. Salminen, V. Stamov, Y. Stepanov, and V. Zakhvalinskii, Journal of Physics and Chemistry of Solids 64, 2313 (2003).
- de Gennes [1960] P. G. de Gennes, Phys. Rev. 118, 141 (1960).
- Huang et al. [2015] Z. Huang, W. Zhou, C. Ouyang, J. Wu, F. Zhang, J. Huang, Y. Gao, and J. Chu, Scientific Reports 5, 10899 (2015).
- Töpfer et al. [1992] J. Töpfer, A. Feltz, D. Gräf, B. Hackl, L. Raupach, and P. Weissbrodt, physica status solidi (a) 134, 405 (1992).
- Mickevičius et al. [2006] S. Mickevičius, S. Grebinskij, V. Bondarenka, B. Vengalis, K. Šliužienė, B. Orlowski, V. Osinniy, and W. Drube, Journal of Alloys and Compounds 423, 107 (2006).
- Ghising et al. [2018] P. Ghising, D. Das, S. Das, and Z. Hossain, Journal of Physics: Condensed Matter 30, 285002 (2018).
- Orgiani et al. [2010] P. Orgiani, A. Galdi, C. Aruta, V. Cataudella, G. De Filippis, C. A. Perroni, V. Marigliano Ramaglia, R. Ciancio, N. B. Brookes, M. Moretti Sala, G. Ghiringhelli, and L. Maritato, Phys. Rev. B 82, 205122 (2010).
- Mandal and Das [1997] P. Mandal and S. Das, Phys. Rev. B 56, 15073 (1997).
- Zhang et al. [1999] N. Zhang, F. Wang, W. Zhong, and W. Ding, Journal of Physics: Condensed Matter 11, 2625 (1999).
- Ju and Sohn [1997] H. Ju and H. Sohn, Solid State Communications 102, 463 (1997).
- Verma et al. [2020] M. K. Verma, N. D. Sharma, S. Sharma, N. Choudhary, and D. Singh, Journal of Alloys and Compounds 814, 152279 (2020).
- Yang et al. [2004] J. Yang, B. Zhao, R. Zhang, Y. Ma, Z. Sheng, W. Song, and Y. Sun, Solid State Communications 132, 83 (2004).
- Galdi et al. [2011] A. Galdi, C. Aruta, P. Orgiani, N. B. Brookes, G. Ghiringhelli, M. Moretti Sala, R. V. K. Mangalam, W. Prellier, U. Lüders, and L. Maritato, Phys. Rev. B 83, 064418 (2011).
- Aruta et al. [2012] C. Aruta, M. Minola, A. Galdi, R. Ciancio, A. Y. Petrov, N. B. Brookes, G. Ghiringhelli, L. Maritato, and P. Orgiani, Phys. Rev. B 86, 115132 (2012).
- Ward et al. [2008] T. Z. Ward, S. Liang, K. Fuchigami, L. F. Yin, E. Dagotto, E. W. Plummer, and J. Shen, Phys. Rev. Lett. 100, 247204 (2008).